Back to Journals » Diabetes, Metabolic Syndrome and Obesity » Volume 15
Salidroside Affects Gut Microbiota Structure in db/db Mice by Affecting Insulin, Blood Glucose and Body Weight
Authors Zhao Q, Shi J, Chen S, Hao D, Wan S, Niu H, Zhang Y
Received 16 May 2022
Accepted for publication 5 August 2022
Published 29 August 2022 Volume 2022:15 Pages 2619—2631
DOI https://doi.org/10.2147/DMSO.S372192
Checked for plagiarism Yes
Review by Single anonymous peer review
Peer reviewer comments 4
Editor who approved publication: Professor Ming-Hui Zou
Qin Zhao,1,* Jing Shi,1,* Siyuan Chen,1 Doudou Hao,1 Sha Wan,1 Haomeng Niu,2 Yongqun Zhang1
1Biobank, Hospital of Chengdu Office of People’s Government of Tibetan Autonomous Region (Hospital.C.T.), Chengdu, Sichuan Povince, People’s Republic of China; 2Medical School, Tibet University, Lhasa, Tibet Autonomous Region, People’s Republic of China
*These authors contributed equally to this work
Correspondence: Yongqun Zhang, Biobank, Hospital of Chengdu Office of People’s Government of Tibetan Autonomous Region (Hospital.C.T.), No. 20 Ximianqiao Road, Chengdu, Sichuan Povince, 610041, People’s Republic of China, Tel +86-28-85593218, Fax +86 28-85558071, Email [email protected]
Purpose: The purpose of this study was to investigate the regulatory effect of salidroside on the intestinal flora of mice with type 2 diabetes (T2DM) and its protective effect in the body.
Patients and Methods: We acclimated 8-week-old mice for 7 days, divided them into 4 groups, and continued dosing for 8 weeks. We recorded weekly blood glucose levels and body weight for each mouse. After the completion of the feeding cycle, the 16S rRNA of the intestinal flora in the mice was sequenced, and the insulin and C-peptide levels in each group of mice were measured. Four samples were taken from each group for liver and kidney section staining.
Results: Our results showed that gut microbiota diversity and function were significantly different between the diabetic mice and healthy mice and that insulin levels, body weight, and blood glucose levels could significantly influence gut microbiota changes at the genus level. The gut microbiota diversity and function of db/db mice were also altered after salidroside administration. Salidroside could attenuate inflammatory damage, lipid accumulation and inflammatory changes in the diabetic liver, as well as diabetic kidney damage. Candidatus arthromitus and Odoribacter are important species of the microbiota during diabetes and may serve as potential therapeutic targets.
Conclusion: Our investigation of the associated pathological conditions and fecal microbiota in db/db mice provides new insights into the pathogenesis of T2DM and provides implications for the diagnosis and treatment of T2DM.
Keywords: salidroside, db/db mice, T2DM, intestinal microbiota
Introduction
Type 2 diabetes mellitus (T2DM) is the most common endocrine and metabolic disorder on the planet T2DM can be driven by genetic components and environmental elements.1 The prevalence of diabetes mellitus in China was 11.2% in 2020.2 Modern medical technology has not yet been able to completely cure T2DM. Consequently, it is imperative that an effective diabetes therapy is discovered. Salidroside (SAL) is a potent compound obtained from Rhodiola rosea, which has been utilized throughout generations in traditional Chinese medicine.3 It can help to prevent cardiovascular disease,4 and promote pharmacological effects5 including immunity, antitumor responses, and defense mechanisms against different types of radiation; it can also reduce blood glucose levels, improve insulin resistance, and induce mitochondrial biogenesis.6 Studies have shown that SAL has an effect on oxidative stress, nervous system damage,7 diabetes-induced cardiac dysfunction,8 liver inflammation,9 and kidney damage10 that results in significant improvement of these conditions; SAL can also regulate gastrointestinal function, increase probiotic levels and regulate the intestinal flora.11 Numerous studies have also demonstrated the association between the gut microbiota and disease diagnosis, treatment, and prognosis. Metabolic diseases,12 including obesity,13 and diabetes,14 are associated with changes in the gut microbiota. Changes in gut microbial composition and lower microbial diversity in obese subjects were associated with higher levels of inflammatory stress.15 Hyperglycemia directly drives intestinal barrier permeability through Glut2-dependent reprogramming of intestinal epithelial cells, leading to intestinal barrier dysfunction and risk of intestinal infection.16 Patients with T2DM are characterized by moderate intestinal microbe dysfunction, decreased abundance of some common butyrate-producing bacteria, increased abundance of opportunistic pathogens, and the overactivation of processes that occur in other microorganisms that result in sulfate reduction and oxidative stress resistance.17 The continuous abnormal increase in blood sugar levels affects the intestinal cells, indirectly changes the growth environment of the intestinal microbiota in the patient’s body, and alters the necessary nutrients required for the proliferation of intestinal microbes. SAL may improve the living environment of the intestinal microbiota, increase the proportion of beneficial bacteria and achieve the purpose of treating diseases.18 This study mainly investigated the role and mechanism of SAL in regulating the intestinal microbiota, blood sugar and other physiological indexes of diabetic mice and the influence of SAL on the structure and function of the intestinal microbiota in diabetic mice, and identified the unique microbiota. The results can offer a new perspective on the future of the targeted and precise regulation of microbiota to treat diabetes mellitus.
Materials and Methods
Animal Experiments
All animal experiments were carried out in accordance with the approval of the ethics committee of the Hospital of Chengdu Office of People’s Government of Tibetan Autonomous Region (2019–63). All animal experimental procedures were performed in accordance with the guidelines of the Regulation for the Administration of Affairs Concerning Experimental Animals (Ministry of Science and Technology, China, 1988, revised in march 2017). Eight-weeks-old BKS - db/db mice and C57BL/KSJ wild-type (WT) mice were purchased from Jiangsu Jicui Yaokang Biotechnology Co., Ltd. A db/db mouse with a tail-tip vein blood glucose level > 13 mmol/L was described as a diabetic mouse. After 7 days of adaptive feeding, the mice were divided into four groups: (1) the NC group, which included normal healthy individuals as control (n = 10); (2) the MD group, which included untreated db/db mice (n = 10); (3) the SAL group, which included db/db mice treated with SAL (n = 10); (4) the MET group, which included db/db mice treated with metformin (MET). SAL was purchased from Chengdu Refines Biotechnology Co., Ltd., and MET hydrochloride was purchased from China-US Shanghai Squibb Pharmaceutical Co., Ltd. Intragastric administration was performed each day with 400 mg/kg of MET in the MET group. Intragastric administration of 200 mg/kg SAL was applied to the SAL group in the same way. To minimize the influence of gastric perfusion, mice in the healthy control group and the untreated db/db group were given the same volume of normal saline. Drug intervention lasted for eight weeks. During the observation period, the blood glucose levels in the mice were detected by a blood glucose meter (ACCU-CHEK) every week, and the weight of the mice was monitored using a weigh scale (Lucky). At the end of the 8th week, four groups (SAL, MET, NC, MD) of fecal specimens were collected and stored at −80°C. At the end of the observation period, all animals were anesthetized with sodium pentobarbital and bled. GraphPad Prism 8.3.0 and R 4.1.3 were used for graphing and statistical analysis. One-way analysis of variance (ANOVA) was used to test for differences between groups of continuous variables.
Enzyme-Linked Immunosorbent Assay (ELISA)
The mouse blood was placed in an ultralow temperature centrifuge for 2000 r for 10 min, and the supernatant was removed and placed in a refrigerator at 4°C. The mouse insulin (INS) enzyme-linked immunosorbent assay kit (Elabscience) and the mouse C-peptide (C-P) enzyme- linked immunosorbent assay kit (Elabscience) were utilized to detect the concentrations of INS and C-P in the serum of mice. The actual absorption value of the standard protein and the sample to be tested in each well (that is, the absorption value of the standard product - the average absorption value of the blank) were calculated, and then the average absorption value of the multiple wells was calculated. A standard protein curve was drawn and the standard curve regression formula was used to calculate the protein concentration of the tested sample.
H&E Staining
The liver and kidney were removed from the fat and connective tissue around the organs. After washing with standard saline, the tissues were stabilized with 10% formaldehyde, and then dehydrated sequentially by an ethanol concentration gradient method. The dehydrated tissues were then soaked in xylene. When the tissues were open, the xylene soak was stopped. Subsequently, the tissue was embedded, sliced and dried. After dewaxing with xylene, the sections were washed with the ethanol gradient method. After H&E staining, the sections were dehydrated with ethanol and transparent xylene, and finally wrapped with neutral resin.
Sequencing of Intestinal Microbiota
Sequencing Process
Sample gDNA was purified by the Zymo Research BioMICS DNA Microprep Kit (Cat# D4301). The integrity of gDNA was examined by 0.8% agarose electrophoresis, and then the nucleic acid concentration was detected by a Tecan F200. According to the sequence region, this method is used to synthesize specific primers with index sequences and amplify the 16S rDNA V4 region in the sample. Each sample was submitted to polymerase chain reaction (PCR) analysis three times, and the products of linear phase polymerase chain reaction were mixed evenly for subsequent library construction. The PCR product was mixed with 6-fold loading buffer, and then a 2% agarose gel was used for electrophoresis detection of the target fragment. Qualified samples were retrieved from the target strips, and the Zymoclean Gel Recovery Kit (D4008) was used for recovery; a Qubit@ 2.0 Fluorometer (Thermo Scientific) was used for quantification; finally, an equimolar amount of the mixture was added The library was constructed by the NEBNext Ultra II DNA Library Prep Kit for Illumina (NEB#E7645 L) from NEW ENGLAND BioLabs. The PE250 sequence method was adopted, and the sequence kit utilized was Illmina’s HiSeq Rapid SBS Kit v2 (FC-402-4023 500 Cycle).
Data Analysis
The data that are compatible with the findings of this study are openly available in the NCBI database [https://www.ncbi.nlm.nih.gov/] using reference number [PRJNA 732231].
Usearch (http://drive.com/uparse/) software was used to perform at operational taxonomic unit (OTU) clustering. The UCLUST classification and SILVA database were used for OTU annotation analysis. PyNAST was used to carry out multiple alignment on representative sequences.
R software was used for community composition analysis, and the ggplot2 package was used for drawing. Alpha-diversity analysis was performed using the Hellinger method using in R 3.6.0. (vegan package) to reflect the richness, evenness and diversity of microbial communities. The R software stats package was used to normalize the principal component analysis (PCA) and z score results, and the scatterplot3d package was used for plotting to restore the degree of difference between samples and the law of variation.
The functions of the identified gut microbiota were classified based on SILVA, Kyoto Encyclopedia of Genes and Genomes (KEGG) and National Center for Biotechnology Information (NCBI) databases using Tax4Fun to enable the prediction of microbial community function. STAMP and Linear discriminant analysis effect size (LEfSe) (https://bitbucket.org/biobakery/biobakery/wiki/Home) were used to test the differences in taxa between groups and to identify potential biomarkers.
Redundancy analysis (RDA) was used to explore the relationship between samples, microbiota and the internal environment. RDA was obtained by the Spearman correlation and its significance, and using the R software (vegan package) for mapping.
The R package (random forest) implements the random forest algorithm to identify taxa (biomarkers) that contribute to large differences between groups. Receiver operating characteristic (ROC) curves and area under the curve (AUC) values were calculated using the pROC and ROCR packages in R. Correlations between the abundances of key bacterial genera and environmental factors were calculated using the Pearson method in R.
The relative abundance of key taxa in diabetes-related diseases was obtained using gutMEGA (http://gutmega.omicsbio.info/index.php) and Disbiome (https://disbiome.ugent.be/hom).
Results
SAL Has a Protective Effect on db/db Mice
To understand the regulatory mechanism of SAL on the gut microbiota in diabetic mice, db/db mice were administered SAL for 8 weeks to treat their diabetes. The blood glucose levels (Figure 1A), body weight (Figure 1B), insulin (INS) levels (Figure 1C) and C-peptide (C-P) levels (Figure 1D) in the mice measured. The results showed that the blood glucose levels and body weight of db/db mice were higher than those of healthy mice and mice administered SAL. Mice treated with SAL and MET exhibited lower blood glucose levels, CP levels, and body weight than healthy and db/db mice, as well as differing insulin levels. Salidroside- and metformin- treated db/db mice had significantly lower blood glucose levels at the end of feeding (8th week) than at the 0th week (SAL group: 23.1833±4.3259 vs 31.6833±1.593, P = 0.0003; MET group:0.15.8667±5.4283 vs 27.8167±4.2879, P =0.0035).
 |
Figure 1 Different types of drug treatments alter the levels of diabetes-related parameters. (A) Blood glucose curve of mice (***P < 0.001, other group vs MD group based on one-way ANOVA). (B) Body weight curve of mice (**P < 0.01, ****P < 0.0001, other group vs MD group based on one-way ANOVA). (C) Histogram of mouse insulin levels (*P < 0.05, other group vs MD group based on one-way ANOVA). (D) Histogram of mouse C-peptide levels. (E) The pathological picture of the liver of mice in the 4 groups (HE x200). Black arrows: Hepatocytes were degenerated, swollen, loose and lightly stained in the cytoplasm; red arrows: necrotic foci were common, and a large number of hepatocyte nuclei were fragmented and dissolved or fused with surrounding tissues to form unstructured eosinophils; blue arrow: with abundant granulocyte infiltration. (F) Kidney pathological pictures of mice in the 4 groups (HE x200). Red arrows: with extensive necrosis of renal tubules and collecting ducts, necrosis and shedding of renal tubular epithelial cells, and necrotic cell debris and granulocytes in the lumen; black arrows: tubular epithelial cells were degenerated and swollen, with loose and lightly stained cytoplasm; purple arrows: the presence of vacuoles in the cytoplasm was common; Orange arrows: granulocytes rarely infiltrated the glomerulus. (G) Pancreatic pathological pictures of mice in the 4 groups (HE x200). Black arrow: massive acinar cell invasion. |
At the same time, SAL reduced diabetic kidney and liver damage. Liver cells in db/db mice showed vesicular degeneration, steatosis and inflammatory cell infiltration (Figure 1E). The abovementioned pathological indicators in the two treatment groups were better than in the MD group, especially in the SAL group. This finding indicates that SAL can alleviate inflammatory injury, lipid accumulation and inflammatory changes in the diabetic liver. In db/db mice, glomerular damage was severe, renal tubular epithelial cells were shed, the renal tubules became bare basement membranes, and renal interstitial edema exhibited obvious inflammatory cell infiltration (Figure 1F). In the SAL group, the pathological changes were weakened, the renal tubules and renal interstitial were damaged, the epithelial cells of renal tubules were flat and exfoliated, the tubules were expanded in a zigzag shape, and the interstitial edema was accompanied by inflammatory cell infiltration. In the MET group, the lesion was further weakened; these mice exhibited mild lesions.
The volume of islets in the MD group was enlarged, and they were irregular in shape; acinar cell invasion was observed in a large number of islets (black arrows) (Figure 1G). The above pathological indicators were better in both treatment groups than in the MD group. This finding indicates that SAL and MET can reduce the inflammatory injury, swelling and necrosis associated with diabetic liver; reduce the levels of renal tubular necrosis, renal tubular epithelial cell degeneration and swelling; improve the volume and morphology of pancreatic islets; and reduce the effect of acinar invasion.
SAL Alters Gut Microbiota Diversity in db/db Mice
In this study, Illumina MiSeq was used to sequence the V4 variable region of 16S rDNA of the intestinal microbiota. A total of 8035 OTUs were available from 24 samples for classification analysis.
Alpha diversity was used to characterize the species richness in each group of samples. Alpha diversity indexes such as Simpson, Shannon, and invsimpson were used in this study for diversity analysis, and box plots were drawn to illustrate the diversity of communities (Figure 2A). The alpha diversity index in the MD group was lower than that in the NC group, and the community diversity in the drug-administered (SAL and MET) groups was also lower. To assess the degree of difference in bacterial community composition between samples. PCA was used. The microbiota composition in the NC group was significantly different from that in the MD, SAL and MET groups (Figure 2B). There were also some differences in the microbial composition in the MD group and the SAL and MET groups (Figure 2B). The heatmap shows the top 50 genera with the most significant differences in abundance across the 4 groups (Figure 2C).
 |
Figure 2 Drug treatment of diabetic mice significantly altered gut microbiota diversity and microbiota function. The V4 region of the 16S amplicon was sequenced for bioinformatic analysis to assess gut microbial makeup. (A) Box plots of α-diversity index (observed OTUs, Shannon, Simpson, and invsimpson). (B) PCA 3D plot. (C) Heatmap shows the abundance of the top 50 genera for each cluster. (D) Taxa with differences in abundance across groups identified using the LEfSe method. The circles radiating from the inside to the outside represent the taxonomic levels from phylum to genus. Each small circle at a different taxonomic level represents a taxonomy at that level, and the diameter of the small circle is proportional to the relative abundance. (E) The bacterial genus with the most significant differences between the MD group and the NC group. The histogram shows the difference in the abundance of genus between the two groups. The dotted bar graph shows the percentage of all genera of this genus in the two groups of samples, respectively. (F) The bacterial genus with the most significant differences between the SAL group and the MD group. The histogram shows the difference in the abundance of genus between the two groups. The dotted bar graph shows the percentage of all genera of this genus in the two groups of samples, respectively. (G) Heatmap of the most important level 3 KO pathways identified by Tax4Fun analysis in four groups. |
LEfSe is an analysis tool for discovering and interpreting high-latitude data biomarkers (taxa, pathways, genes). We used LEfSe analysis to identify significant differences between groups, and 68 significantly different bacteria were identified at linear discriminant analysis (LDA) values >3 (Figure 2D).
STAMP software was used to identify the differential bacterial genera among the four groups. The genera with the greatest difference between the MD group and NC group were Lachnospiraceae UCG-004, Odoribacter, Rikenella, Alistipes, Ralstonia, and Rikenellaceae RC9 gut groups (Figure 2E). The genera Mycoplasma, Candidatus arthromitus, and Lachnospiraceae UCG-006 were significantly different between the MD group and SAL groups (Figure 2F). There were some changes in the microbiota of the SAL group and the MET group with the different administration times.
The administration of drugs to diabetic mice results in modest changes in gut microbial community metabolism. We assessed the functional differences between the 4 groups of microbial communities by using Tax4Fun for microbial community function prediction (Figure 2G). A total of 273 KEGG pathways were compared at level 3, which identified the top 25 KEGG categories that differed significantly across the 4 groups. The prediction results showed that the intestinal flora of db/db mice was different from that of healthy mice in terms of metabolism and DNA damage repair. The abundances of bacterial taxa involved in oxidative phosphorylation (ko00190), bacterial chemotaxis (ko02030), cell cycle caulobacter (ko04112), and alanine aspartate and glutamate metabolism (ko00250) were lower in the gut of salidroside-administered mice than in the gut of mice in the MD group. Specifically, this finding suggests that fecal microbiota functional alterations, especially in metabolism, may play key roles in the pathogenesis and development of T2DM.
Changes in Gut Microbiota are Closely Related to Physiological Parameters in db/db Mice
Recent studies have shown that different treatments affect the intestinal microbiota of mice, but whether the differences in the intestinal microbiota of db/db mice in the administration group were related to the changes in these physiological and biochemical indexes was unknown. In this study, RDA was performed to evaluate the relationship between diabetes-related physiological and biochemical markers and the gut microbiota. RDA is a combination of correspondence analysis and multiple regression analysis that is used to evaluate the relationship between environmental factors and the gut microbiota. According to the length of the connection between the environmental factors and the origin, blood glucose levels, body weight and insulin levels had the greatest influence on the microbiota structure in diabetic mice (Figure 3). In addition, there was mutual influence between different environmental factors, and blood glucose levels was negatively correlated with INS and C-P levels. The RDA analyses suggested that the key functional bacteria associated with T2DM are actively involved in the regulation of blood glucose and body weight in diabetic mice.
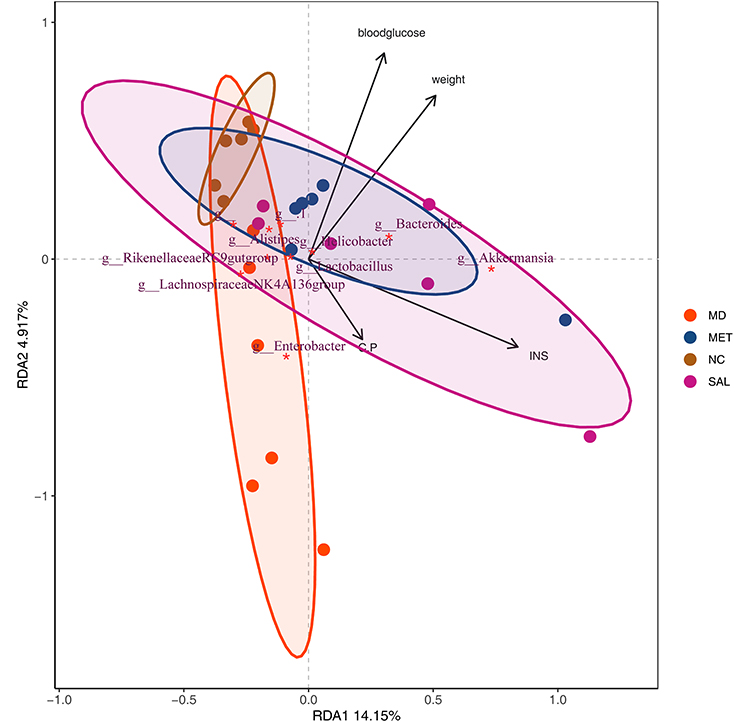 |
Figure 3 Redundancy analysis (RDA) of relative abundance of bacteria with environmental factors in each group. *Top 10 genera responding to environmental variables. Notes: The arrows represent the relative positions of different environmental factors on the plane, and the longer the arrow, the greater the effect. The angle between the arrow and the line connecting the center of the sample represents the relationship between the sample and environmental factors, the acute angle indicates a positive correlation between the two species classifications, and the obtuse angle is a negative correlation. |
Identification of Key Bacterial Genera Associated with Diabetes in db/db Mice by the Random Forest Method
This study has previously demonstrated that SAL modulates the physiological and metabolic balance of diabetic mice and significantly affects the structure of the microbial community. Different drug treatments resulted in significant changes in the relative abundances of 69 species of bacteria (Figure 2D). However, it is difficult to distinguish their importance, so we used a random forest algorithm to identify the characteristic microbiota in response to diabetes, ranked the microbiota according to MeanDecreaseAccuracy, and selected the top 7 genera with the highest accuracy contribution as the major bacteria involved in diabetes (Figure 4A). The Pearson method was used to analyze the correlation between the abundance of 7 genera and diabetes-related indicators (Figure 4B). A predictive model was generated based on their relative abundances to identify target samples. Characteristic microbiota were identified in this study using ROC curves, which can be used to classify the performance of biomarker analysis (Figure 4c). The comprehensive results showed that Staphylococcus (AUC: 0.944), Candidatus arthromitus (AUC: 0.931), and Odoribacter (AUC: 0.833) were the most critical genera related to diabetes, and the abundances of these three key genera were significantly correlated with the levels of physiological parameters. Although the AUC value achieved using Staphylococcus abundance was very high, Staphylococcus abundance had a strong correlation with INS in the correlation analysis, but it did not appear in the heatmap (Figure 2C) or STAMP (Figure 2E and F), so it was not regarded as a key genus.
 |
Figure 4 Identification of the signature gut microbiota, associated with diabetes, by random forest method. (A) The relative abundance of each bacterial genus was analyzed by random forest method in the 24 samples, ranked according to Mean decrease accuracy. (B) Pearson correlation analysis between the top 7 genera and environmental factors with the highest mean decrease accuracy value (*P < 0.05; **P < 0.01; ***P < 0.001). (C) ROC analysis of the top 7 genera with the highest mean decrease accuracy value. |
Changes in the Abundances of Key Bacteria in Disease
To further determine the relationship between key taxa and diabetes, and to evaluate their possible roles and functions in diabetes treatment, we assessed the abundances of Candidatus arthromitus and Odoribacter in obese and diabetic patients from the gutMEGA and Disbiome databases (Tables 1 and 2). No disease data related to Candidatus arthromitus and diabetes were found in the Disbiome database, but the related sequences belonging to Candidatus arthromitus were found to be highly expressed in obese patients in the gutMEGA database, which was consistent with the results of this study. In both the gutMEGA and Disbiome databases, Odoribacter was found to be in a state of decreased relative abundance in both obese and diabetic patients, which is consistent with our findings.
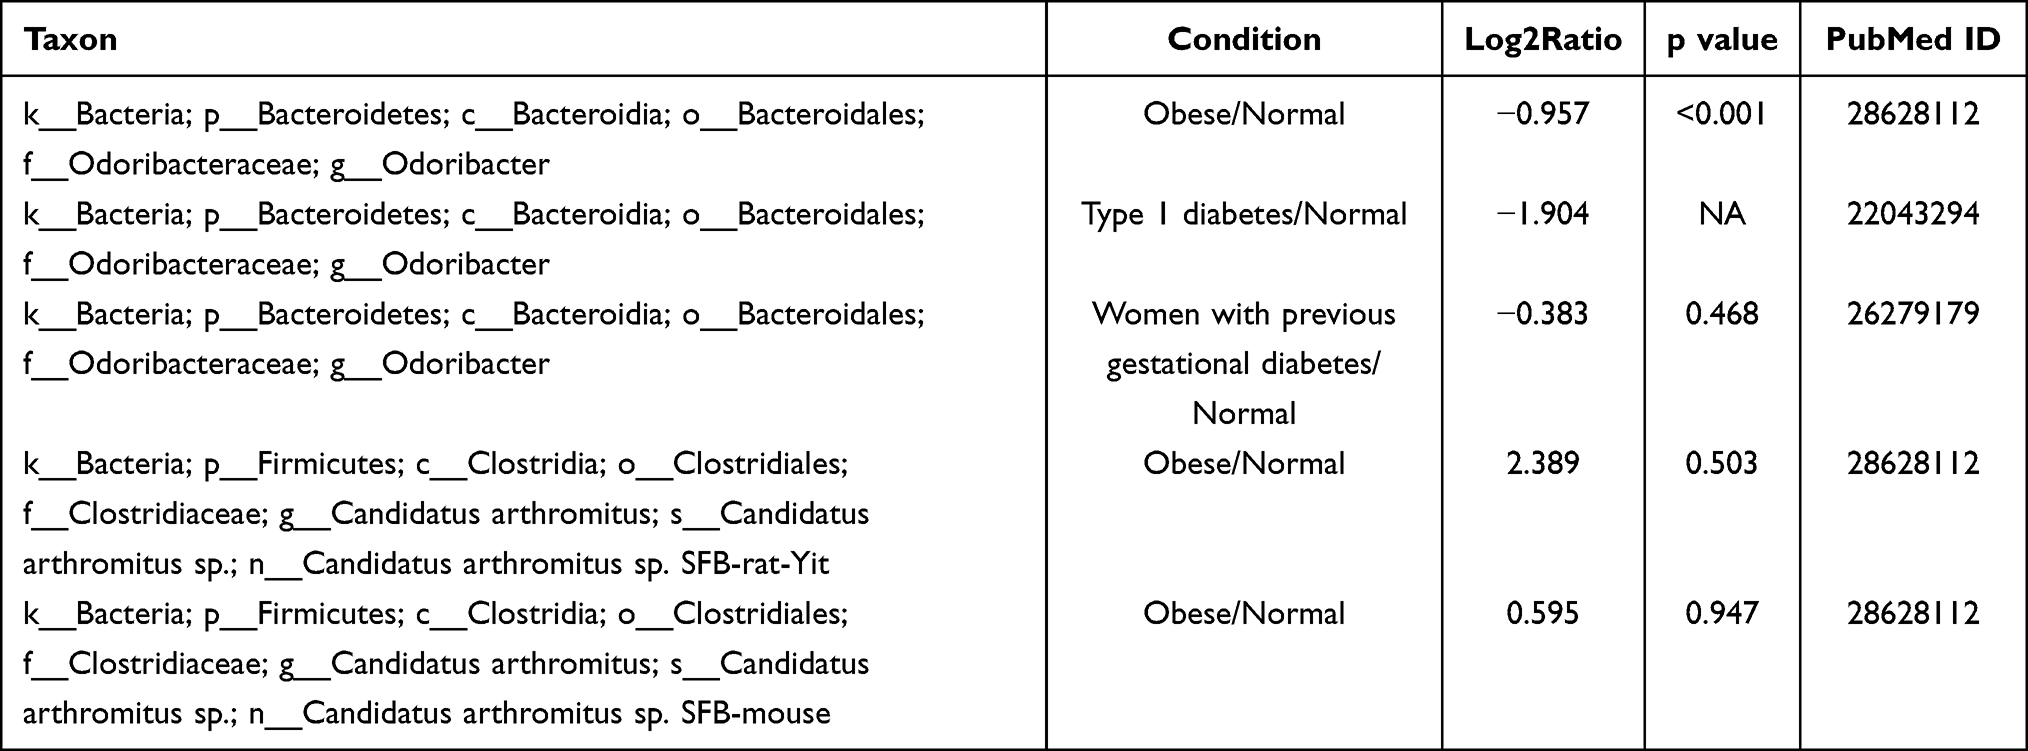 |
Table 1 Abundance and Disease Data of Candidatus arthromitus and Odoribacter Obtained Through gutMEGA Database |
 |
Table 2 Abundance and Disease Data of Odoribacter Obtained Through the Disbiome Database |
Discussion
Type 2 diabetes is the most prevalent of all metabolic disorders. Genetic mutations, obesity, physical inactivity, and imbalances in the gut microbiome are the underlying causes of type 2 diabetes.19 Factors affecting the structure of the human gut microbiota include age,20 host genotype,21 environment,22 and antibiotics.23 Factors affecting the structure of the human gut microbiota include age, host genotype, environment, and antibiotics. The composition and function of the gut microbiota are altered in patients with type 2 diabetes mellitus (T2DM).24 Disruption of gut microbiota function and composition may lead to metabolic diseases such as diabetes25 and obesity.26 Improving gut microbial metabolism and function can improve host physiology and reduce diabetes and obesity.27 Studies have proven that SAL can significantly change the diversity of intestinal microbes,28 and SAL can improve nonalcoholic steatohepatitis through the mycolic acid-FXR axis in microbes.18 In most cases, the higher the diversity and richness of the intestinal microbiota are, the more abundant the types of microorganisms, and the dynamic balance that is formed by different components of the microbiota is the basis for normal metabolism in the host. There are different components of the microbiota between mice with type 2 diabetes and mice subjected to MET monotherapy, with unique microbial metabolism pathways.29 The gut microbiota may play an important role in linking n-6 PUFA metabolism and the etiology of type 2 diabetes.30 SAL has a protective effect on myocardial apoptosis and ventricular remodeling in diabetic mice,8 and liver injury in the diabetic mice.9 SAL can effectively improve abnormal liver lipids during the progression of atherosclerosis.31 It can improve diabetic nephropathy in mice,32 but SAL can also alleviate the occurrence of diabetes symptoms by regulating the structure of intestinal microbiota. We speculate that SAL can restore the balance of intestinal microorganisms, improve the permeability of the intestinal mucosa and alleviate the occurrence and development of diseases in the treatment of diabetes.
In this study, SAL and MET did have an effect on the gut microbiota of db/db mice. Microbial α-diversity analysis showed that the community diversity in mice in the MD and drug administration groups was lower than that in healthy mice, indicating that diabetes alters the diversity of intestinal microbiota in mice. Studies have shown that the intestinal microbiota diversity of obese patients was significantly lower than that in the normal group.33 Wilmanski et al34 found an association between metabolic disturbances, host metabolites and gut microbiota alpha diversity in extremely obese individuals. Some previous studies have shown that the intestinal microbiota of women with gestational diabetes mellitus (GDM) shows low alpha diversity at the species level,35 and the alpha diversity of the gut microbiota of HIV-infected T2DM patients is reduced,36 which is consistent with our results. During the study, the intervention of SAL and MET both sdecreased the α diversity of intestinal microbiota. Our PCA could be used to distinguish mice with T2DM from healthy controls, but the drug-treated and model groups could not be completely distinguished, indicating that the intestinal microbiota profiles of the drug-treated groups were similar. The study by Liu et al37 suggested that changes in body composition are associated with metabolic abnormalities, and metabolic disorders exist in patients with T2DM. Differential KO pathway enrichment analysis showed that multiple pathways were related to metabolism, indicating that diabetes is indeed related to metabolic disorders and suggesting that SAL and MET can alleviate the symptoms of type 2 diabetes by regulating the body’ s metabolism.
Our RDA results indicated that insulin levels, body weight, and blood glucose levels were significantly associated with changes in gut microbiota at the genus level. Studies have shown that insulin levels,38 body weight39 and blood glucose levels40 are highly correlated with the development and treatment of diabetes. The ratio of mean blood glucose to fasting blood glucose levels is associated with insulin resistance in young adults with diabetes.40 A study by Chen et al41 found that waist-to-hip ratio, body fat percentage, and visceral fat area were key factors associated with the incidence of type 2 diabetes in Chinese adults. The ratio of fat to muscle is positively associated with metabolic disturbances in T2DM patients.37 Patients with poor glycemic control in type 2 diabetes have a greater burden and vulnerability of intracranial atherosclerotic plaques.42
T2DM is also accompanied by a large number of complications and physical damage. Almost all patients with T2DM or metabolic syndrome (MS) in the study by Masarone et al43 had nonalcoholic fatty liver disease (NAFLD). Abnormal liver function, hepatic steatosis and inflammation have been observed in db/db mice.44 Approximately 40% of T2DM patients have chronic kidney disease.45 DB/DB diabetic mice exhibit renal tubular damage that results in folding and rupture of the tubular basement membrane.46 In a study by Hu et al47 it was found that islet integrity in db/db diabetic mice was disrupted and the border was uneven. In this study, the liver, kidney and pancreas of db/db mice were damaged, which was consistent with the results of previous studies. Both SAL and MET have protective and reparative effects on the liver, kidney and pancreas damage caused by diabetes in db/db mice, and can alleviate and improve the pathological process of diabetes.
In this study, RDA analysis showed that insulin level, body weight and blood glucose level could significantly affect the changes in gut microbiota at the genus level. It was demonstrated that insulin levels, body weight, and blood glucose play crucial roles in the separation and aggregation of each group of samples, and these three physiological parameters are highly correlated with the development and treatment of diabetes. Studies have shown that the insulin level in db/db mice was higher than that in normal mice. In this study, the blood glucose levels, body weight and insulin levels in db/db mice treated with SAL were lower than those in MD mice. H&E-stained sections of liver and kidney tissues provided evidence that SAL had protective and reparative effects on liver and kidney damage caused by diabetes in db/db mice, and could alleviate and improve the pathological process of diabetes.
Specifically, we found that Candida arthromitus and Odoribacter were the most important taxa of T2DM and thus could be potential therapeutic targets. The relative abundances of Candidatus arthromitus and Odoribacter showed large differences among the groups in the differential bacterial heatmap (Figure 2C), LEfSe (Figure 2D) and STAMP (Figure 2E and F) analyses. Analysis of the correlation between abundance and diabetes-related insulin levels, body weight and blood sugar levels revealed that Candidatus arthromitus and Odoribacter abundances were significantly correlated with blood sugar levels and body weight (P < 0.001). When using the ROC curve to discriminate the characteristic microbiota, the use of the three microbiota components performed equally well (AUCs greater than 0.8). Odoribacter is a short-chain fatty acid (SCFAs) -producing genus of Bacteroidetes.48 SCFAs influence energy homeostasis, glucose homeostasis, and psychiatric disorders through the gut-brain axis or directly through the central pathway.49 The relative abundance of Odoribacter was found to be significantly reduced in the gut microbiota of high-fat, high-sugar diet-induced obese mice.50 The abundance of Odoribacter was decreased in the MD group in this study, and the relative abundance of Odoribacter was increased in db/db mice after treatment with SAL and MET. This finding implies that Odoribacter directly affects the occurrence of T2DM. Candidatus arthromitus is a candidate gut-protective organism with metabolic and/or immune interactions.51 The relative abundance of Candidatus arthromitus was found to be significantly increased in the feces of depressed rats52 and nonobese diabetic (NOD)53 mice. Candidatus arthromitus abundance was increased in the MD group, which is consistent with previous studies (Tables 1 and 2). After SAL administration, the abundance of Candidatus arthromitus decreased. This findings suggests that the changes in the genus Candidatus arthromitus may be caused by T2DM, and that SAL regulates the key microbiota related to diabetes and improves the disease pathology. These microbiota components are inextricably linked to diabetes mellitus, and correcting the imbalance in the intestinal microbiota may become a new goal for the prevention and treatment of T2DM. It is worth mentioning that although this study describes changes in the gut microbiome and physiopathology and the relationship between the two in db/db mice after SAL and MET treatment, we cannot directly explain their causal relationship. We hope to investigate further in the future in more in-depth molecular mechanism studies.
Conclusion
Using SAL and MET intervention in diabetic mice, we found that SAL can significantly improve kidney, liver and pancreatic damage in diabetic mice, thereby playing a protective role. SAL has a certain effect on the structure and function of the intestinal microbiota of mice. After administration, the structure and function of the intestinal microbiota of db/db mice changed, and the activation levels of multiple metabolic pathways changed. Candidatus arthromitus and Odoribacter are highly associated with T2DM and may be potential targets for the treatment of diabetes. Our study can serve as a new perspective for future diabetes treatment through targeted and precise modulation of the microbiota.
Acknowledgments
Qin Zhao and Jing Shi should be considered co-first authors. This study was supported by Research Project of Sichuan Medical Association (S19072); Natural Science Foundation of Tibet Autonomous Region (XZ202101ZR0101G); Key Research Projects of Hospital of Chengdu Office of People’s Government of Tibetan Autonomous Region (Hospital.C.T.) (QH-1(2019)-03). The samples are stored in Biobank of Hospital of Chengdu Office of People’s Government of Tibetan Autonomous Region.
Disclosure
The authors report no conflicts of interest in this work.
References
1. Yan Z, Ley SH, Hu FB. Global aetiology and epidemiology of type 2 diabetes mellitus and its complications. Nat Rev Endocrinol. 2018;14(2):88–98. doi:10.1038/nrendo.2017.151
2. Association DBo CM. Guideline for the prevention and treatment of type 2 diabetes mellitus in China (2020 edition). Chin J Diabetes. 2021;13(4):95.
3. Stepanova A, Malunova M, Salamaikina S, Selimov R, Solov’Eva A. Establishment of rhodiola quadrifida hairy roots and callus culture to produce bioactive compounds. Phyton-Int J Exp Bot. 2021;90(2):10.
4. Xie H, Shen CY, Jiang JG. The sources of salidroside and its targeting for multiple chronic diseases. J Funct Foods. 2019;64:103648. doi:10.1016/j.jff.2019.103648
5. Li H, Huang D, Hang S. Salidroside inhibits the growth, migration and invasion of Wilms’ tumor cells through down-regulation of miR-891b. Life Sci. 2019;222:60–68. doi:10.1016/j.lfs.2019.02.052
6. Li Y, Wei X, Liu SL, et al. Salidroside protects cardiac function in mice with diabetic cardiomyopathy via activation of mitochondrial biogenesis and SIRT3. Phytother Res. 2021;35(8):4579–4591. doi:10.1002/ptr.7175
7. Zheng T, Wang Q, Bian F, et al. Salidroside alleviates diabetic neuropathic pain through regulation of the AMPK-NLRP3 inflammasome axis. Toxicol Appl Pharmacol. 2021;416:115468. doi:10.1016/j.taap.2021.115468
8. Ni J, Li Y, Xu Y, Guo R. Salidroside protects against cardiomyocyte apoptosis and ventricular remodeling by AKT/HO-1 signaling pathways in a diabetic cardiomyopathy mouse model. Phytomedicine. 2021;82:153406. doi:10.1016/j.phymed.2020.153406
9. Yang L, Zhou L, Wang X, Wang W, Wang J. Inhibition of HMGB1 involved in the protective of salidroside on liver injury in diabetes mice. Int Immunopharmacol. 2020;89(Pt A):106987. doi:10.1016/j.intimp.2020.106987
10. Feng J, Zhang Q, Mo W, et al. Salidroside pretreatment attenuates apoptosis and autophagy during hepatic ischemia-reperfusion injury by inhibiting the mitogen-activated protein kinase pathway in mice. Drug Des Devel Ther. 2017;11:1989–2006. doi:10.2147/DDDT.S136792
11. Shati AA. Salidroside ameliorates diabetic nephropathy in rats by activating renal AMPK/SIRT1 signaling pathway. J Food Biochem. 2020;44(4):e13158. doi:10.1111/jfbc.13158
12. Dabke K, Hendrick G, Devkota S. The gut microbiome and metabolic syndrome. J Clin Invest. 2019;129(10):4050–4057. doi:10.1172/JCI129194
13. Gomes AC, Hoffmann C, Mota JF. The human gut microbiota: metabolism and perspective in obesity. Gut Microbes. 2018;9(4):308–325. doi:10.1080/19490976.2018.1465157
14. Aron-Wisnewsky J, Warmbrunn MV, Nieuwdorp M, Clément K. Metabolism and metabolic disorders and the microbiome: the intestinal microbiota associated with obesity, lipid metabolism, and metabolic health-pathophysiology and therapeutic strategies. Gastroenterology. 2021;160(2):573–599. doi:10.1053/j.gastro.2020.10.057
15. Scheithauer TPM, Rampanelli E, Nieuwdorp M, et al. Gut microbiota as a trigger for metabolic inflammation in obesity and type 2 diabetes. Front Immunol. 2020;11:571731. doi:10.3389/fimmu.2020.571731
16. Thaiss CA, Levy M, Grosheva I, et al. Hyperglycemia drives intestinal barrier dysfunction and risk for enteric infection. Science. 2018;359(6382):1376–1383. doi:10.1126/science.aar3318
17. Junjie Q, Li Y, Cai Z, et al. A metagenome-wide association study of gut microbiota in type 2 diabetes. Nature. 2012;490(7418):55–60. doi:10.1038/nature11450
18. Li H, Xi Y, Xin X, Tian H, Hu Y. Salidroside improves high-fat diet-induced non-alcoholic steatohepatitis by regulating the gut microbiota–bile acid–farnesoid X receptor axis. Biomed Pharmacother. 2020;124:109915. doi:10.1016/j.biopha.2020.109915
19. Arora A, Behl T, Sehgal A, et al. Unravelling the involvement of gut microbiota in type 2 diabetes mellitus. Life Sci. 2021;273:119311. doi:10.1016/j.lfs.2021.119311
20. Claesson MJ, Cusack S, O’Sullivan O, et al. Composition, variability, and temporal stability of the intestinal microbiota of the elderly. Proc Natl Acad Sci USA. 2011;108(S1):4586–4591. doi:10.1073/pnas.1000097107
21. Turnbaugh PJ, Hamady M, Yatsunenko T, et al. A core gut microbiome in obese and lean twins. Nature. 2009;457(7228):480–484. doi:10.1038/nature07540
22. Zhang Z, Zhu L, Ma Y, et al. Study on the characteristics of intestinal flora composition in gastric cancer patients and healthy people in the Qinghai-Tibet plateau. Appl Biochem Biotechnol. 2022;194(4):1510–1526. doi:10.1007/s12010-021-03732-4
23. Vijay-Kumar M, Aitken JD, Carvalho FA, et al. Metabolic syndrome and altered gut microbiota in mice lacking Toll-like receptor 5. Science. 2010;328(5975):228–231. doi:10.1126/science.1179721
24. Liu W, Luo Z, Zhou J, Sun B. Gut microbiota and antidiabetic drugs: perspectives of personalized treatment in type 2 diabetes mellitus. Front Cell Infect Microbiol. 2022;12:853771. doi:10.3389/fcimb.2022.853771
25. Pascale A, Marchesi N, Govoni S, Coppola A, Gazzaruso C. The role of gut microbiota in obesity, diabetes mellitus, and effect of metformin: new insights into old diseases. Curr Opin Pharmacol. 2019;49:1–5. doi:10.1016/j.coph.2019.03.011
26. Arnoriaga-Rodríguez M, Mayneris-Perxachs J, Contreras-Rodríguez O, et al. Obesity-associated deficits in inhibitory control are phenocopied to mice through gut microbiota changes in one-carbon and aromatic amino acids metabolic pathways. Gut. 2021;70(12):2283–2296. doi:10.1136/gutjnl-2020-323371
27. Megur A, Daliri EB, Baltriukienė D, Burokas A. Prebiotics as a tool for the prevention and treatment of obesity and diabetes: classification and ability to modulate the gut microbiota. Int J Mol Sci. 2022;23(11):6097. doi:10.3390/ijms23116097
28. Yuan Y, Wu X, Zhang X, Hong Y, Yan H. Ameliorative effect of salidroside from Rhodiola Rosea L. on the gut microbiota subject to furan-induced liver injury in a mouse model. Food Chem Toxicol. 2019;125:333–340. doi:10.1016/j.fct.2019.01.007
29. Hung WW, Peng P, Tsai YC, Jhou PS, Hung WC. Gut microbiota compositions and metabolic functions in type 2 diabetes differ with glycemic durability to metformin monotherapy. Diabetes Res Clin Pract. 2021;174:108731. doi:10.1016/j.diabres.2021.108731
30. Miao Z, Lin JS, Mao Y, Chen GD, Zheng JS. Erythrocyte n-6 polyunsaturated fatty acids, gut microbiota, and incident type 2 diabetes: a prospective cohort study. Diabetes Care. 2020;43(10):dc200631. doi:10.2337/dc20-0631
31. Wen SY, Chen YY, Lu JX, et al. Modulation of hepatic lipidome by rhodioloside in high-fat diet fed apolipoprotein E knockout mice. Phytomedicine. 2020;69:152690. doi:10.1016/j.phymed.2018.09.225
32. Haiyan X, Li P, Luo Y, et al. Salidroside stimulates the Sirt1/PGC-1α axis and ameliorates diabetic nephropathy in mice. Phytomedicine. 2019;54:240–247. doi:10.1016/j.phymed.2018.10.031
33. Fu C, Wang W, Zhang B. Research on the intestinal flora of the 239 patients in the elderly non-intestinal diseases. Chongqing Med. 2012;41(23):
34. Wilmanski T, Rappaport N, Earls JC, et al. Blood metabolome predicts gut microbiome α-diversity in humans. Nat Biotechnol. 2019;37(10):1217–1228. doi:10.1038/s41587-019-0233-9
35. Wu Y, Bible PW, Long S, Ming WK, Wang Z. Metagenomic analysis reveals gestational diabetes mellitus-related microbial regulators of glucose tolerance. Acta Diabetol. 2019;57(4):569–581. doi:10.1007/s00592-019-01434-2
36. Hoel H, Hove-Skovsgaard M, Hov JR, et al. Impact of HIV and type 2 diabetes on gut microbiota diversity, tryptophan catabolism and endothelial dysfunction. Sci Rep. 2018;8(1). doi:10.1038/s41598-018-25168-3
37. Liu D, Zhong J, Ruan Y, et al. The association between fat-to-muscle ratio and metabolic disorders in type 2 diabetes. Diabetol Metab Syndr. 2021;13(1):129. doi:10.1186/s13098-021-00748-y
38. Garg SS, Gupta J. Polyol pathway and redox balance in diabetes. Pharmacol Res. 2022;182:106326. doi:10.1016/j.phrs.2022.106326
39. Xu C, Zhong J, Zhu H, et al. Independent and interactive associations of heart rate and body mass index or blood pressure with type 2 diabetes mellitus incidence: a prospective cohort study. J Diabetes Investig. 2019;10(4):1068–1074. doi:10.1111/jdi.12999
40. Guo J, Lei S, Zhou Y, Pan C. The ratio of estimated average glucose to fasting plasma glucose level as an indicator of insulin resistance in young adult diabetes: an observational study. Medicine. 2020;99(40):e22337. doi:10.1097/MD.0000000000022337
41. Chen Y, He D, Yang T, et al. Relationship between body composition indicators and risk of type 2 diabetes mellitus in Chinese adults. BMC Public Health. 2020;20(1):452. doi:10.1186/s12889-020-08552-5
42. Jiao S, Huang J, Chen Y, et al. Impacts of glycemic control on intracranial plaque in patients with type 2 diabetes mellitus: a Vessel Wall MRI Study. AJNR Am J Neuroradiol. 2021;42(1):75–81. doi:10.3174/ajnr.A6878
43. Masarone M, Rosato V, Aglitti A, et al. Liver biopsy in type 2 diabetes mellitus: steatohepatitis represents the sole feature of liver damage. PLoS One. 2017;12(6):e0178473. doi:10.1371/journal.pone.0178473
44. Wang A, Gong Y, Pei Z, et al. Paeoniflorin ameliorates diabetic liver injury by targeting the TXNIP-mediated NLRP3 inflammasome in db/db mice. Int Immunopharmacol. 2022;109:108792. doi:10.1016/j.intimp.2022.108792
45. Lerma EV, Wilson DJ. Finerenone: a mineralocorticoid receptor antagonist for the treatment of chronic kidney disease associated with type 2 diabetes. Expert Rev Clin Pharmacol. 2022;3:1–13.
46. Feng X, Wang S, Sun Z, et al. Ferroptosis enhanced diabetic renal tubular injury via HIF-1α/HO-1 pathway in db/db mice. Front Endocrinol. 2021;12:626390. doi:10.3389/fendo.2021.626390
47. Hu X, Zhang H, Zhuang L, et al. Ubiquitin-fold modifier-1 participates in the diabetic inflammatory response by regulating NF-κB p65 nuclear translocation and the ubiquitination and degradation of IκBα. Drug Des Devel Ther. 2020;14:795–810. doi:10.2147/DDDT.S238695
48. Li N, Wang X, Sun C, et al. Change of intestinal microbiota in cerebral ischemic stroke patients. BMC Microbiol. 2019;19(1):191. doi:10.1186/s12866-019-1552-1
49. Luo P, Lednovich K, Xu K, et al. Central and peripheral regulations mediated by short-chain fatty acids on energy homeostasis. Transl Res. 2022;S1931–5244(22):00135–00139.
50. Cheng W, Lu J, Lin W, et al. Effects of a galacto-oligosaccharide-rich diet on fecal microbiota and metabolite profiles in mice. Food Funct. 2018;9(3):1612–1620. doi:10.1039/C7FO01720K
51. Cox LM, Yamanishi S, Sohn J, et al. Altering the intestinal microbiota during a critical developmental window has lasting metabolic consequences. Cell. 2014;158(4):705–721. doi:10.1016/j.cell.2014.05.052
52. Yu M, Jia HM, Qin LL, Zou ZM. Gut microbiota and gut tissue metabolites involved in development and prevention of depression. J Affect Disord. 2022;297:8–17. doi:10.1016/j.jad.2021.10.016
53. Zhou Y, Li YY, Liu Y. 粪菌移植对非肥胖糖尿病小鼠发生1型糖尿病的影响及其机制探讨. [Effect of fecal microbiota transplantation on type 1 diabetes mellitus in non-obese diabetic mice and its underlying mechanism]. Zhonghua Yi Xue Za Zhi. 2022;102(16):1224–1231. Chinese. doi:10.3760/cma.j.cn112137-20210907-02043
 © 2022 The Author(s). This work is published and licensed by Dove Medical Press Limited. The
full terms of this license are available at https://www.dovepress.com/terms
and incorporate the Creative Commons Attribution
- Non Commercial (unported, 3.0) License.
By accessing the work you hereby accept the Terms. Non-commercial uses of the work are permitted
without any further permission from Dove Medical Press Limited, provided the work is properly
attributed. For permission for commercial use of this work, please see paragraphs 4.2 and 5 of our Terms.
© 2022 The Author(s). This work is published and licensed by Dove Medical Press Limited. The
full terms of this license are available at https://www.dovepress.com/terms
and incorporate the Creative Commons Attribution
- Non Commercial (unported, 3.0) License.
By accessing the work you hereby accept the Terms. Non-commercial uses of the work are permitted
without any further permission from Dove Medical Press Limited, provided the work is properly
attributed. For permission for commercial use of this work, please see paragraphs 4.2 and 5 of our Terms.