Back to Journals » Diabetes, Metabolic Syndrome and Obesity » Volume 16
Roux-en-Y Gastric Bypass Improves Insulin Sensitivity in Obese Rats with Type 2 Diabetes Mellitus by Regulating the Grin3a/AMPK Signal Axis in Hypothalamic Arcuate Nucleus
Authors Zhang LH, Wang J, Tan BH, Yin YB, Kang YM
Received 10 August 2023
Accepted for publication 21 October 2023
Published 10 November 2023 Volume 2023:16 Pages 3617—3629
DOI https://doi.org/10.2147/DMSO.S430445
Checked for plagiarism Yes
Review by Single anonymous peer review
Peer reviewer comments 2
Editor who approved publication: Prof. Dr. Juei-Tang Cheng
Li-Hai Zhang,1,2 Jiao Wang,1,2 Bai-Hong Tan,2 Yan-Bin Yin,2 Yu-Ming Kang1
1Department of Physiology and Pathophysiology, Xi’an Jiaotong University School of Basic Medical Sciences, Xi’an, People’s Republic of China; 2Six Wards of General Surgery, The First Affiliated Hospital of Jiamusi University, Jiamusi, People’s Republic of China
Correspondence: Yu-Ming Kang, Email [email protected]
Objective: The objective of this study was to explore the effects and related mechanisms of Roux-en-Y gastric bypass (RYGB) on insulin sensitivity in obese rats with type 2 diabetes mellitus (T2DM).
Methods: The obese T2DM rat model was constructed by feeding a high-fat diet and injecting streptozotocin (STZ), and treated with RYGB. Grin3a shRNA was injected into the bilateral hypothalamic arcuate nucleus (ARC) to knockdown the Grin3a expression on T2DM rats. Eight weeks after operation, the body weight, fasting blood glucose (FBG), fasting serum insulin (FSI), homeostatic model assessment of insulin resistance (HOMA-IR), and plasma triglyceride (TG) levels were assessed. Hematoxylin & eosin (H&E) staining was adopted to observe the white adipose tissue (WAT) of rats. Western blot and qRT-PCR were used to detect the expression of Grin3a, adenosine 5′ monophosphate-activated protein kinase (AMPK) and p-AMPK in ARC of rats. Later, the plasmid over-expressing or knocking down Grin3a was transfected into differentiated 3T3-L1 adipocytes, and the TG level and the formation of lipid droplets in adipocyte were assessed by TG kit and oil red O staining. The expression of lipogenic transcription factors in cells was detected by qRT-PCR.
Results: RYGB reduced FBG, FSI, HOMA-IR and plasma TG levels in T2DM rats while increasing Grin3a expression and p-AMPK/AMPK ratio in ARC. Knockdown of Grin3a not only reversed the decrease of FBG, FSI, HOMA-IR and plasma TG levels in T2DM rats induced by RYGB, but also reversed the up-regulation of p-AMPK/AMPK ratio in ARC affected by RYGB. Moreover, knocking down Grin3a significantly increased the TG level, promoted the formation of lipid droplets and up-regulated the expressions of lipogenic transcription factors in adipocytes.
Conclusion: RYGB improved the insulin sensitivity, reduced the plasma TG level and lessens the fat accumulation in obese T2DM rats by regulating the Grin3a/AMPK signal in ARC.
Keywords: Roux-en-Y gastric bypass, RYGB, obesity, type 2 diabetes mellitus, Grin3a/AMPK
Corrigendum for this paper has been published.
Introduction
With the development of the economy and changes in lifestyle, the number of patients with obesity has been increasing year by year. It is reported that about one-third of adults worldwide are overweight or obese.1 Obesity is one of the major risk factors for the development of type 2 diabetes mellitus (T2DM).2 Obesity-associated T2DM is a chronic metabolic disorder characterized by hyperglycemia, insulin resistance, and relative insulin deficiency.3 Insulin resistance, caused by the failure of insulin target tissues to respond properly to insulin, is a main characteristic of most obese patients with T2DM.4 Roux-en-Y gastric bypass (RYGB) is an effective therapy for obesity and T2DM. The clinical data showed that the cure rate of RYGB for obesity and T2DM patients was more than 80%.5 Besides, Camastra et al claimed that RYGB increased liver and peripheral insulin sensitivity in obese patients with T2DM, which may be associated with energy intake restriction and weight loss.6 Fabbrini et al discovered that RYGB increased the liver and skeletal muscle insulin sensitivity of obese patients.7 However, the mechanism of RYGB on insulin sensitivity is not clarified.
Adenosine 5′ monophosphate-activated protein kinase (AMPK) plays a vital role in the regulation of energy homeostasis and glucolipid metabolism. For example, the AMPK signal can regulate the expression of glucose transporter and glucolipid metabolism.8 Moreover, the AMPK signal increases insulin sensitivity and improves insulin resistance by promoting fatty acid oxidation, increasing glucose uptake, inhibiting liver glucose output, and reducing the production of lipids and triglycerides (TGs).9 Located in the 9p34 region, the Grin3a gene contains nine exons and encodes an N- methyl -D-aspartate receptor (NMDAR) subunit 3a. Grin3a is involved in the activation and postsynaptic events of NMDA receptors. In fact, Grin3a has been proved to affect the development of neural circuits, works during synaptic refinement, and limit spinal maturation and growth.10 Shi et al pointed out that Grin3a was closely correlated with the cAMP-PKA pathway and could stimulate nerve overgrowth in macrodactyly.11 Fujihara et al proposed that Grin3a may also be involved in the regulation of periodontal ligament cell differentiation.12 In addition, the expression of Grin3a was significantly increased in the white adipose tissue (WAT) of obese rats with T2DM after receiving RYGB.13 There are no previous studies reporting the effect of Grin3a on fat metabolism, however, the direction of calcium ion flow has been reported to affect fat anabolism by some researches. Furthermore, the concentration of intracellular calcium ion may affect adiponectin secretion and insulin sensitivity in adipocytes.14 Nevertheless, it is temporarily unclear whether Grin3a improves lipid accumulation and insulin sensitivity in obese-induced T2DM rats by affecting lipid metabolism. We speculate that AMPK signaling is involved in the role of Grin3a in lipid metabolism. Therefore, a high-fat diet was fed to T2DM rats for the construction of T2DM rat model in this study. Also, the effect of RYGB on insulin sensitivity in T2DM rats was observed. Besides, the correlation between RYGB and the Grin3a/AMPK signal axis in hypothalamic arcuate nucleus (ARC) was explored.
Materials and Methods
Construction of T2DM Rat Model and Grouping
A total of 48 male Sprague Dawley (SD) rats, 8 weeks of age and weighing 180–220g, were purchased from GemPharmatech Co. Ltd. (NanJing, China). All animal experiments were approved by the Experimental animal ethics committee of Guangdong Medical Experimental Center (C202206-03) and carried out in accordance with the National Institute of Health’s Guide for the Care and Use of Laboratory Animals. After 1 week of acclimatization period, rats were randomly divided into five groups as follows: Control group, T2DM group, RYGB group, RYGB+shNC group and RYGB+sh-Grin3a group.
The rat model of T2DM was established by a high-fat diet.13–15 Rats in the Control group were fed a standard diet (18% fat, 25% protein, and 57% carbohydrates). Rat in the other four groups were fed a high-fat diet (40% fat, 13% protein, and 47% carbohydrates). After 4 weeks of feeding, rats receiving high-fat diets were intraperitoneally injected with 35 mg/kg streptozotocin (STZ; Sigma, USA); rats in the Control group were intraperitoneally injected with an equal amount of sodium citrate buffer (0.1 mol/L, pH = 7.4; Solarbio, China). Upon 4 weeks of feeding again, the blood samples were collected from the tail vein of rats, and the blood glucose was measured by a blood glucose meter (Abbott, USA). The blood glucose of rats receiving a high-fat diet higher than 16.7 mmol/L indicated successful establishment of the T2DM rat model.15
Referring to the previous literature, RYGB was performed on T2DM model rats.13 After anesthesia, rats in the T2DM group only underwent laparotomy and did not receive RYGB; rats in the RYGB group, RYGB+shNC group and RYGB+sh-Grin3a group received RYGB after successful construction of the T2DM model. Upon receiving RYGB, negative shRNA(shNC) and Grin3a shRNA (sh-Grin3a) were injected into bilateral hypothalamic ARC of rats in the RYGB+shNC and RYGB+sh-Grin3a groups, respectively. The injection was completed by virtue of a micro injector. At week 8 postoperatively, the body weight of each group of rats was measured and the groin WAT, plasma and hypothalamic ARC were collected. Subsequently, the fasting blood glucose (FBG) and fasting serum insulin (FSI) levels of rats were measured using glucose meters (Abbott, USA) and insulin kits (Nanjing Jiancheng Bioengineering Institute, China), respectively. The formula for calculating HOMA-IR (homeostatic model assessment of insulin resistance) was shown as follows: HOMA-IR = (FBG × FSI)/22.5.
Cell Culture and Transfection
Cell samples (3T3-L1 cells) were purchased from the National collection of Authenticated Cell Cultures (Shanghai, China). They were cultured in a dulbecco’s modified eagle medium (DMEM, Solarbio, China) containing 10% newborn bovine serum (NBS, Gibco, USA) in an incubator with 95% humidity, 5% CO2 and a temperature of 37 °C.
After the confluence reached 100%, induction of differentiation was performed on 3T3-L1 cells.16 The old culture medium was discarded, and the cells were cultured in a DMEM containing 10% fetal bovine serum (FBS, Gibco, USA), 10 μg/mL insulin, 1 μM dexamethasone and 0.5 mM IBMX (3-Isobutyl-1-methylxanthine). After 48 h, the medium was replaced with a DMEM containing 10% FBS and 10 μg/mL insulin, and the cells were cultured for another 48 h. Next, the cells were transferred to a DMEM containing 10% FBS for further culture. The medium was changed every 2 days until fully differentiated adipocytes were formed.
Differentiated 3T3-L1 cells were digested with trypsin (China) and then seeded into a 6-well plate. When the confluency of cells reached 70%-80%, cell transfection was performed. Negative over-expression vector (Vector group), pcDNA3.1-Grin3a (Grin3a group), negative shRNA (shNC group) and sh-Grin3a (sh-Grin3a group) were all synthesized by BGI. The above fragments were transfected into 3T3-L1 cells according to the instructions of Lipofectamine 2000TM (Thermo Fisher Scientific, USA). The transfected cells were incubated in an incubator containing 5% CO2 at 37 °C.
Determination of Triglycerides (TGs)
Differentiated 3T3-L1 cells were washed 3 times with PBS, then lysed in lysis buffer (0.15 M NaCl, 10 mM EDTA, 0.1% TritonTM X-100, 50 mM Tris buffer, pH 7.5) for 30 minutes. After the cell lysates were centrifuged (12,000 × g, 4 °C, 10 min), the supernatant was collected. Next, the content of TG in rat plasma and cells was measured according to the instructions of TG Determination Kit (Nanjing Jiancheng Bioengineering Institute, China).
Hematoxylin & Eosin (H&E) Staining
The WATs were fixed with fatty tissue fixative solution (Servicebio, China). After dehydration, the tissue was embedded in paraffin and cut into 5 μm continuous sections. The sections were deparaffinized with xylene then stained with hematoxylin and eosin (Solarbio, China). Finally, the treated sections were observed under a microscope and photographed.
Oil Red O Staining
Differentiated 3T3-L1 cells were washed with PBS and fixed in 10% formalin. After 20 min, the fixative solution was aspirated and the cells were incubated with 60% isopropyl alcohol for 30s. Then, the isopropyl alcohol was aspirated, and the cells were stained with oil red O staining solution (Solarbio, China) at ambient temperature for 30 min. Next, the cell samples were observed under an inverted microscope and photographed. Subsequently, the oil red O in the cells was dissolved by adding isopropyl alcohol extraction. The treated cells were stood at ambient temperature for 20 min, then the absorbance at 490 nm was measured with a microplate reader.
qRT-PCR
The RNA was extracted from tissue and cell samples with TRIzol reagent (Beyotime, China), and the concentration and purity of the extracted RNA were detected with NanoDrop. Next, RNA was reversely transcribed into cDNA according to the instructions of the cDNA Synthesis Kit (Tiangen, China). Subsequently, the target gene sequences were synthesized in the Roche LightCyclerⓇ96 system referring to the instructions of SYBR greenER qPCR SuperMix (TaKaRa, Japan). Besides, β-actin was regarded as an internal control, and the relative expression level of the target gene was calculated using the 2−ΔΔCt method. The primer sequences used in this study were shown in Table 1.
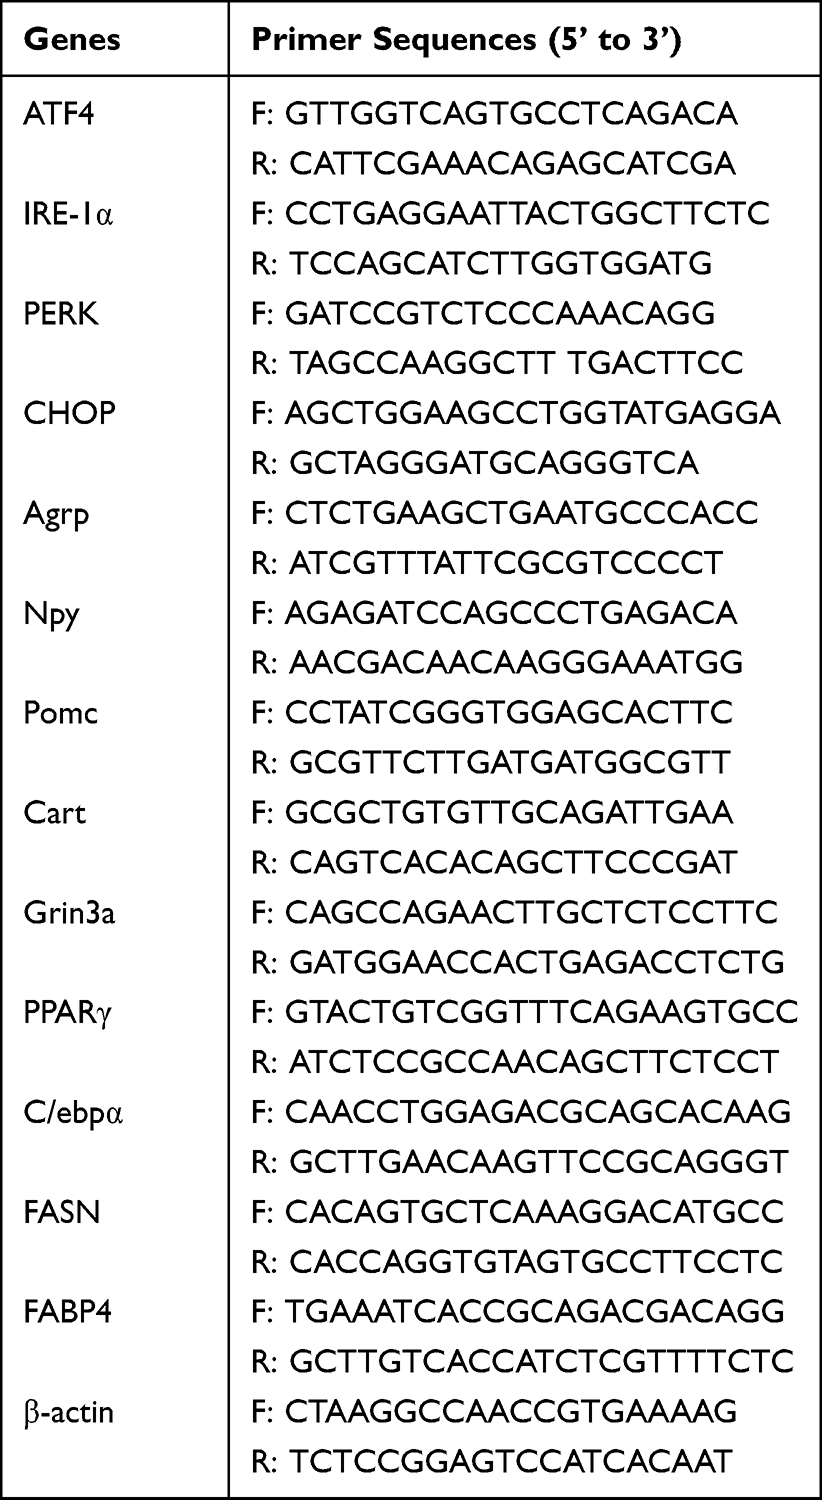 |
Table 1 Primer Sequences of qRT-PCR |
Western Blot
The total protein of adipose tissue was extracted by an adipose tissue protein extraction kit (Solarbio, China), and the total protein of ARC tissue was extracted with RIPA lysis buffer (Solarbio, China). Next, the BCA kit (Solarbio, China) was utilized to determine the concentration of total protein. Later, the protein samples were separated by Sodium Dodecyl Sulfate-Poly Acrylamide Gel Electrophoresis (SDS-PAGE) and transferred onto polyvinylidene fluoride (PVDF) membranes (Bio-Rad, USA). The membranes were sealed with 5% skimmed milk for 1 h. Subsequently, primary antibodies (Grin3a, p-AMPK, AMPK, β-actin; Abcam, USA) were added into the membranes for incubation at 4 °C overnight. Washed with TBST, the membranes were incubated with secondary antibody (Abcam, USA) for 1 h at ambient temperature. Next, enhanced chemiluminescent (ECL) substrates were uniformly dropwise added to the membrane, and the FliorchemHD2 imaging system was used for scanning and image acquisition. Gray value analysis was performed using Image J. The relative expression level of proteins was calculated by taking β-actin as an internal reference protein.
Statistical Analysis
SPSS 10.0 software was used for statistical analysis, and GraphPad prism 9 for plotting. All results were expressed as mean ± standard deviation (SD). Independent t-test analysis was employed for comparison between two groups, and one-way analysis of variance for comparison among multiple groups. P < 0.05 indicated significantly different.
Results
RYGB Improves Insulin Resistance and Reduces Fat Accumulation in Obese Rats with T2DM
To investigate the effects of RYGB on rats with T2DM, the body weight, FBG, FSI, and HOMA-IR of rats were measured in this study. Briefly speaking, compared with the control group, rats in the T2DM group exhibited significantly increased body weight, FBG, FSI, and HOMA-IR. RYGB decreased the body weight, FBG, FSI and HOMA-IR of T2DM rats (Figure 1A–D). Besides, the level of TG was also measured. In comparison with the control group, the TG level in the T2DM group was notably up-regulated (P < 0.01). RYGB reduced TG levels in plasma of rats with T2DM (P < 0.01) (Figure 1E). According to the outcomes of H&E staining, significant proliferation and notably increased size were observed in adipocytes in WATs of T2DM rats; while RYGB could reduce the proliferation and number of adipocytes (Figure 1F). Therefore, RYGB could improve insulin resistance and reduce fat accumulation in obese T2DM rats.
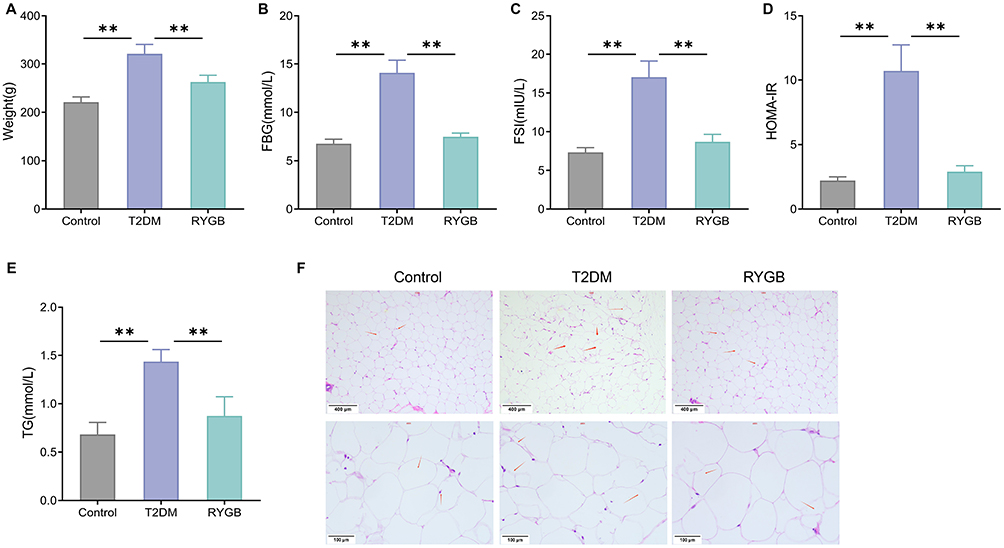 |
Figure 1 RYGB ameliorates insulin resistance and lessens fat accumulation in rats with T2DM. (A) Body weights of rats in each group; (B) The FBG of rats was detected by blood glucose meter; (C) The FSI of rats was tested by kits; (D) HOMA-IR of rats; (E) The changes of plasma TG level of rats were measured by TG kit; (F) The morphological changes of WATs were observed by H&E staining, red arrows represent adipocyte. **P < 0.01. Abbreviations: FBG, fasting blood glucose; FSI, fasting serum insulin; HOMA-IR, homeostatic model assessment of insulin resistance; TG, triglyceride; WAT, white adipose tissue; H&E, hematoxylin and eosin. |
RYGB Regulates Endoplasmic Reticulum Stress and Neuropeptide Levels in Arcuate Nucleus of Obese T2DM Rats
Subsequently, we investigated the effects of RYGB on the levels of endoplasmic reticulum stress (ATF4, IRE-1α, PERK, and CHOP) and neuropeptides (Agrp, Npy, Pomc, and Cart) in ARC of T2DM rats. Specifically, the mRNA expression levels of ATF4, IRE-1α, PERK and CHOP in ARC of T2DM rats were significantly higher than those in the control group (P < 0.01). RYGB reduced the expression levels of ATF4, IRE-1α, PERK, and CHOP in ARC of T2DM rats (P < 0.01) (Figure 2A–D). In addition, compared with the Control group, the mRNA expression levels of Agrp and Npy were significantly increased (P < 0.01) while the mRNA expression levels of Pomc and Cart were markedly decreased (P < 0.01) in hypothalamic ARC of T2DM rats. Relative to rats in the T2DM group, the RYGB group rats exhibited notably decreased mRNA expression levels of Agrp and Npy while markedly raised mRNA expression levels of Pomc and Cart in ARC of rats (P < 0.01) (Figure 2E–H). Collectively, RYGB regulated endoplasmic reticulum stress and neuropeptide levels in ARC of obese T2DM rats.
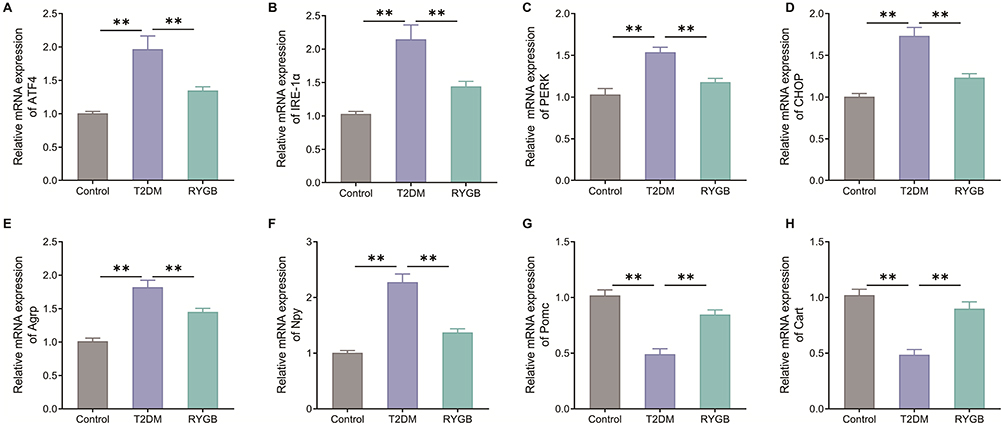 |
Figure 2 RYGB regulates endoplasmic reticulum stress and neuropeptide levels in arcuate nucleus of T2DM rats. (A–H) qRT-PCR to assess the effects of RYGB on mRNA expression levels of ATF4 (A), IRE-1α (B), PERK (C), CHOP (D), Agrp (E), Npy (F), Pomc (G) and Cart (H) in the arcuate nucleus of hypothalamus in T2DM rats. **P < 0.01. |
RYGB Up-Regulates Grin3a Expression in White Adipose Tissue and Arcuate Nucleus of Obese T2DM Rats
Previous studies have shown that Grin3a may be the key gene for the therapeutic role of RYGB plays.13 Therefore, the expression of Grin3a in WAT and ARC of rats was measured in this study. Compared with the Control group, the protein expression levels of Grin3a in WAT and hypothalamic ARC of T2DM rats were remarkably reduced (P < 0.01). However, RYGB could increase the Grin3a protein expression level in tissue samples (Figure 3A and B). Moreover, the mRNA expression level of Grin3a in ARC of T2DM rats was much lower than that in the Control group, while RYGB increased the mRNA expression level of Grin3a in ARC of T2DM rats (Figure 3C). Overall, RYGB up-regulated Grin3a expression in WAT and ARC of obese T2DM rats.
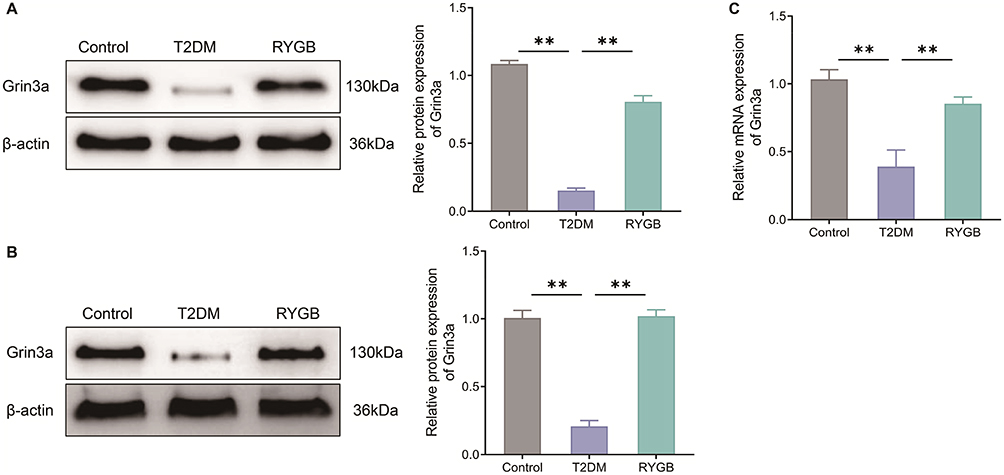 |
Figure 3 RYGB up-regulates Grin3a expression in white adipose tissue and arcuate nucleus of T2DM rats. (A and B) Western blot to measure the expression levels of Grin3a protein in white adipose tissue (A) and arcuate nucleus tissue (B) of rats in each group; (C) qRT-PCR to test the mRNA expression level of Grin3a in arcuate nucleus of rats. **P < 0.01. |
RYGB Activates AMPK Signal in Arcuate Nucleus of Obese T2DM Rats
The AMPK signaling pathway is related to the pathological mechanism of obesity and T2DM.9 Hence, the changes of AMPK signals in ARC of rats were observed by Western blot. In contrast to the control group, the expression level of p-AMPK in ARC of rats in the T2DM group was decreased, as well as the ratio of p-AMPK/AMPK (P < 0.01). Compared with the T2DM group, the expression level of p-AMPK and the ratio of p-AMPK/AMPK were significantly increased in ARC of rats in the RYGB group (P < 0.01) (Figure 4). All in all, RYGB could activate AMPK signal in ARC of obese T2DM rats.
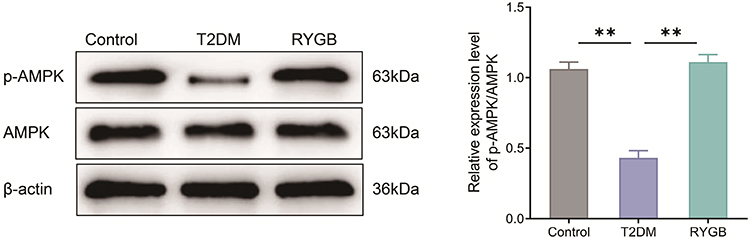 |
Figure 4 RYGB activates AMPK signals in the arcuate nucleus of T2DM rats. The protein expression levels of p-AMPK and AMPK in the arcuate nucleus of rats in each group were detected by Western blot. **P < 0.01. Abbreviation: AMPK, adenosine 5′ monophosphate-activated protein kinase. |
Knockdown of Grin3a Promotes Lipid Accumulation and Production in 3T3-L1 Cells
To further explore the effect of Grin3a on lipid metabolism, Grin3a was knocked down or over-expressed in differentiated 3T3-L1 adipocytes. Compared with the Vector group, the expression level of Grin3a in the Grin3a group was notably increased; in comparison with the shNC group, the expression level of Grin3a in the sh-Grin3a group is remarkably reduced (Figure 5A). The above outcomes indicated successful knockdown or over-expression of Grin3a in differentiated 3T3-L1 adipocytes by transfection. Besides, levels of TG in the Grin3a group were significantly reduced compared with those in the Vector group, while the TG level in the sh-Grin3a group was notably higher than that in the shNC group (Figure 5B). The outcomes of oil red O staining displayed that the lipid accumulation in the Grin3a group was obviously lower than that in the Vector group; however, the lipid accumulation in the sh-Grin3a group was remarkably higher than that in the shNC group (Figure 5C). The above findings indicated that knocking down Grin3a promoted lipid accumulation in 3T3-L1 cells.
 |
Figure 5 Knocking down Grin3a promotes lipid accumulation and production in 3T3-L1 cells. (A) The expression level of Grin3a in each group was detected by qRT-PCR; (B) TG level in cells of each group was checked by TG kit; (C) the formation of lipid droplets in 3T3-L1 cells was observed by oil red O staining; (D–G) The mRNA expression levels of PPARγ (D), C/ebpα (E), FASN (F) and FABP4 (G) were determined by qRT-PCR. *P < 0.05, **P < 0.01. |
Additionally, we measured changes in gene expression levels associated with lipid production in each group of cells. To be specific, compared with the Vector group, the expression levels of PPARγ, C/ebpα, FASN and FABP4 in the Grin3a group decreased significantly (P < 0.05). Relative to the shNC group, the expression levels of PPARγ, C/ebpα, FASN, and FABP4 in the sh-Grin3a group were markedly increased (P < 0.05) (Figure 5D–G). Above all, Grin3a could regulate lipid accumulation and production in differentiated 3T3-L1 cells.
Knocking Down Grin3a Reverses the Reducing Effect of RYGB on Insulin Resistance and Fat Accumulation in Obese T2DM Rats
To verify the role of Grin3a in RYGB treating insulin resistance and fat accumulation in T2DM rats, we knocked down the expression of Grin3a in tissues of the bilateral hypothalamic ARC in T2DM rats. The results of qRT-PCR revealed that the expression level of Grin3a in ARC of the RYGB+sh-Grin3a group was much lower than that in the RYGB+shNC group (Figure 6A). The above outcome suggested that the expression of Grin3a in ARC tissues in T2DM rats was successfully knocked down. In addition, plasma TG levels were remarkably up-regulated in the RYGB+sh-Grin3a group compared with that in the RYGB+shNC group (Figure 6B). Also, the body weight, FBG, FSI, and HOMA-IR of the RYGB+sh-Grin3a group were significantly higher than those of the RYGB+shNC group (Figure 6C–F). H&E staining results showed that, relative to the T2DM group, the proliferation and THE size of adipocytes in WAT of rats in the RYGB group were significantly reduced. In contrast to the RYGB+shNC group, the proliferation level and the size of adipocytes were notably increased in WAT in the RYGB+sh-Grin3a group (Figure 6G). The above findings indicated that knockdown of Grin3a reversed the reducing effects of RYGB on insulin resistance and fat accumulation in obese T2DM rats.
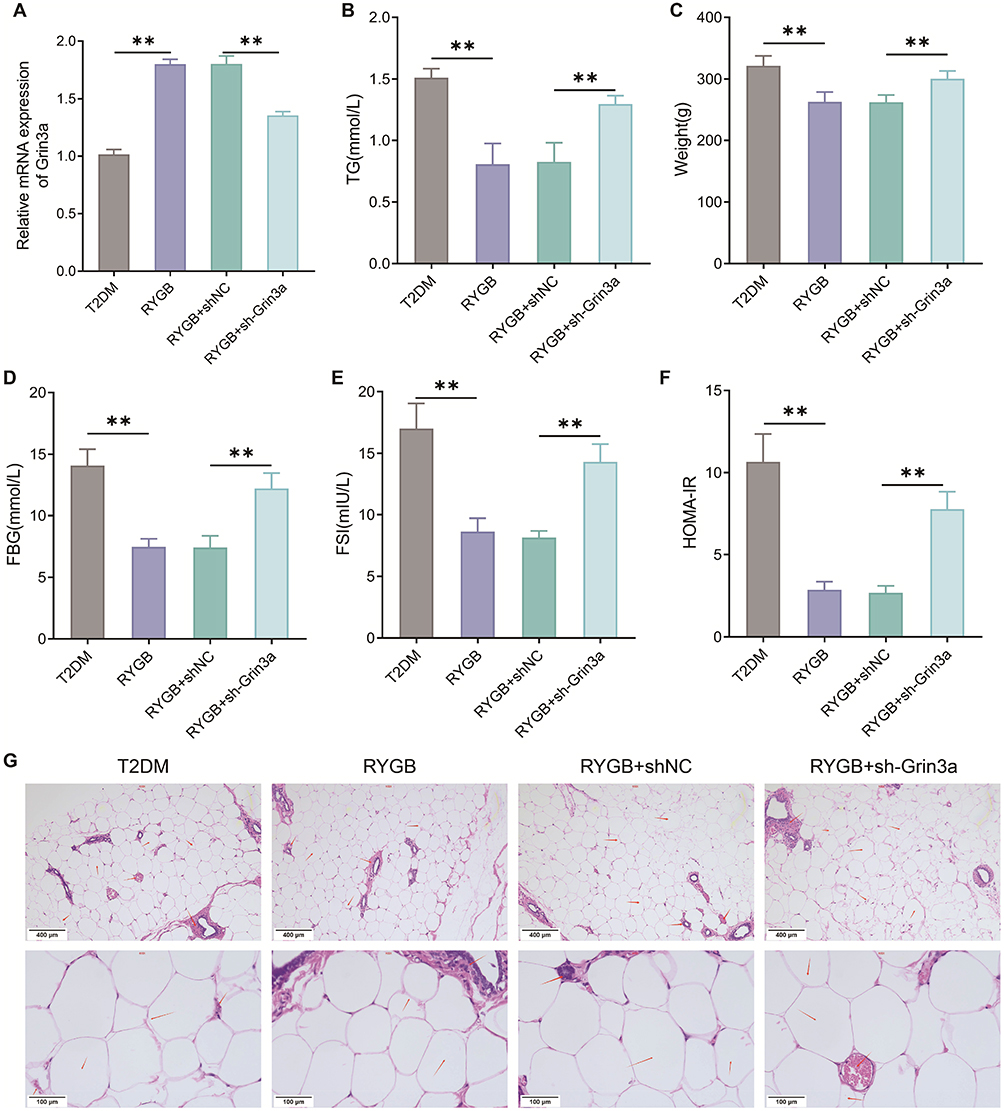 |
Figure 6 Knocking down Grin3a reverses the role of RYGB in reducing insulin resistance and fat accumulation in T2DM rats. (A) The expression level of Grin3a in arcuate nucleus of rats was detected by qRT-PCR; (B) Body weight of rats; (C) The FBG levels of rats were measured by blood glucose meter; (D) The FSI levels of rats in each group were checked by kits; (E) HOMA-IR of rats; (F) TG kit to test the level of TG in plasma of rats; (G) The WAT of rats in each group was observed by H&E staining, red arrows represent adipocyte. **P < 0.01. Abbreviations: FBG, fasting blood glucose; FSI, fasting serum insulin; HOMA-IR, homeostatic model assessment of insulin resistance; TG, triglyceride; WAT, white adipose tissue; H&E, hematoxylin and eosin. |
Knockdown of Grin3a Reverses the Impact of RYGB on Endoplasmic Reticulum Stress and Neuropeptide Levels in Arcuate Nucleus of Obese Rats with T2DM
Next, the influence of knocking down Grin3a on endoplasmic reticulum stress and neuropeptide levels in ARC of T2DM rats was investigated in this paper. In brief, relative to the RYGB+shNC group, the expression levels of ATF4, IRE-1α, PERK, and CHOP in ARC of the RYGB+sh-Grin3a group rats climbed a lot (P < 0.01) (Figure 7A–D). Furthermore, in comparison with the RYGB+shNC group, the expression levels of Agrp and Npy were markedly increased (P < 0.01) while those of Pomc and Cart were obviously decreased in ARC of the RYGB+sh-Grin3a group rats (P < 0.01) (Figure 7E–H). Hence, knockdown of Grin3a reversed the effect of RYGB on endoplasmic reticulum stress and neuropeptide levels in ARC of obese T2DM rats.
 |
Figure 7 Knocking down Grin3a reverses the impact of RYGB on endoplasmic reticulum stress and neuropeptide levels in arcuate nucleus of T2DM rats. The mRNA expression levels of ATF4 (A), IRE-1α (B), PERK (C), CHOP (D), Agrp (E), Npy (F), Pomc (G) and Cart (H) in arcuate nucleus tissue of rats in each group were measured by qRT-PCR. **P < 0.01. |
RYGB Improves Insulin Resistance in Obese T2DM Rats by Regulating Grin3a/AMPK Signal Axis
As AMPK signal was involved in the regulation of RYGB on insulin resistance in T2DM rats, the effect of knocking down Grin3a on AMPK signal in ARC was examined. Relative to the RYGB+shNC group, the RYGB+sh-Grin3a group displayed a significantly decreased Grin3a expression and p-AMPK/AMPK ratio (P < 0.01, Figure 8). Such a result indicated that knocking down Grin3a reversed the activation of AMPK signal in ARC by RYGB. All in all, RYGB improved insulin resistance in obese T2DM rats by regulating the Grin3a/AMPK signaling axis.
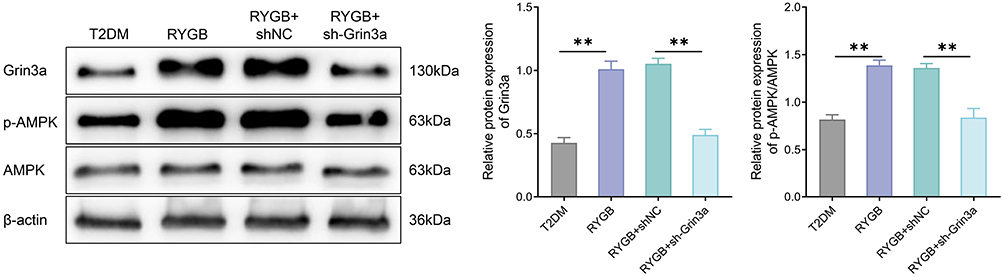 |
Figure 8 RYGB improves insulin resistance in T2DM rats by regulating Grin3a/AMPK signal axis. Western blot was employed to measure the protein expression changes of Grin3a, AMPK and p-AMPK in rats of each group. **P < 0.01. |
Discussion
T2DM, characterized by insulin resistance, is a common chronic disease with or without insulin secretion deficiency. Insulin resistance makes human organs and tissues less sensitive to insulin, resulting in reduced utilization of glucose by the body and increased production of endogenous glucose.17 RYGB, whose effective rate of clinical treatment is higher than 80%, can effectively control blood glucose of obese T2DM patients.5 Moreover, RYGB is able to increase insulin sensitivity in obese and T2DM patients. In this research, RYGB reduced body weight, blood glucose, insulin levels and insulin resistance of obese T2DM rats, consistent with the results of previous studies.13,18,19
The Grin3A gene encodes the subunit 3a of NMDAR. Activation of Grin3a facilitates the binding to glutamic acid or alanine, unbinds the coupling between the NMDA receptor and the magnesium ions, and opens the calcium channel. The opening of the calcium channel results in a massive influx of calcium ions or making them signaling as second messengers.20,21 RNA-Seq sequencing in previous studies revealed that Grin3a might be involved in the related mechanism of RYGB in improving insulin resistance in T2DM rats.13 This study further verified the role of Grin3a in improving insulin resistance in T2DM rats by RYGB. Specifically, RYGB up-regulated the expression of Grin3a in adipose tissue and ARC of T2DM rats. Knocking down Grin3a reversed the inhibition of RYGB on blood glucose, insulin level and insulin resistance in T2DM rats. In general, RYGB reduced insulin resistance in obese T2DN rats by regulating the Grin3a expression.
The AMPK signal can regulate lipid metabolism and improve insulin sensitivity by affecting the expression of downstream target genes.9,22,23 The activation of AMPK contributes to reducing the lipid accumulation in liver tissues of hyperlipidemia rats.24 Moreover, AMPK is also a potential target for anti-diabetic drugs such as metformin.25 Studies have pointed out that AMPK signal can up-regulate the level of glucose transporter 4 (GLUT4), promote the uptake of glucose by muscle cells, and improve insulin sensitivity.26 In this study, RYGB activated AMPK signal and improved insulin resistance in ARC of T2DM rats. Previous studies have reported that RYGB increases the insulin sensitivity in patients with T2DM and up-regulates the level of AMPK phosphorylation in their abdominal subcutaneous adipose tissues.27 RYGB reduced FBG, insulin, and HOMA-IR, and up-regulated the AMPK/ SIRT1/ PGC-1α pathway in Zucker diabetic fatty rats.28 These results were consistent with the conclusions of our study. In addition, knocking down Grin3a inhibited the activation of AMPK signals, indicating that the AMPK signal in ARC of T2DM rats might be regulated by Grin3a.
Lipid accumulation is also an important inducing factor for T2DM.29 The expression of genes related to adipogenesis is involved in the differentiation of adipocytes.30 In this research, the effects of Grin3a on adipocytes were explored by knocking down or over-expressing Grin3a in differentiated 3T3-L1 adipocytes. We discovered that Grin3a not only significantly reduced lipid droplet formation and TG content in 3T3-L1 adipocytes, but also down-regulated the expression of lipogenic transcription factors (PPARγ, C/ebpα, FASN, and FABP4). Notably, PPARγ is a key lipogenic transcription factor that regulates lipogenesis. Shortly speaking, PPARγ initiates TG formation and lipid droplet accumulation by inducing C/EBPα expression.31 Besides, it’s reported that erucic acid inhibited adipogenesis of 3T3-L1 adipocytes by down-regulating PPARγ, C/ebpα and FAS expression.32 It’s worth noting that the effect of Grin3a on lipid accumulation has not been reported yet. Our study demonstrated that Grin3a could regulate the transcription levels of PPARγ, C/ebpα, FASN, and FABP4 in 3T3-L1 adipocytes.
There are still some demerits in this study. For example, neither the regulation mechanism of Grin3a on AMPK signal nor the related mechanism of AMPK regulating downstream target signal to improve insulin sensitivity was deeply discussed in this research. Additionally, the conclusions of this study still needed to be further verified, such as over-expression of Grin3a or inhibition of AMPK signal.
Conclusion
To sum up, RYGB can improve insulin sensitivity and fat accumulation and reduce plasma TG level and insulin level in obese rats with T2DM by regulating the Grin3a/AMPK signal axis in hypothalamic ARC.
Data Sharing Statement
The data used to support the findings of this study are available from the corresponding author upon request.
Ethics Statement
All animal experiments were approved by the Experimental animal ethics committee of Guangdong Medical Experimental Center (C202206-03) and carried out in accordance with National Institute of Health’s Guide for the Care and Use of Laboratory Animals.
Acknowledgments
We thanks to the Guangdong Medical Experimental Center for providing the site for the animal experiments.
Funding
This study is supported by Natural Science Foundation of Heilongjiang Province (LH2021H105); Basic Research Funds of Education Department of Heilongjiang Province (2019-KYYWF-1348).
Disclosure
The authors declare that they have no competing interests.
References
1. Chooi YC, Ding C, Magkos F. The epidemiology of obesity. Metabolism. 2019;92:6–10. doi:10.1016/j.metabol.2018.09.005
2. Wondmkun YT. Obesity, insulin resistance, and type 2 diabetes: associations and therapeutic implications. Diabetes Metab Syndr Obes. 2020;13:3611–3616. doi:10.2147/DMSO.S275898
3. Golay A, Ybarra J. Link between obesity and type 2 diabetes. Best Pract Res Clin Endocrinol Metab. 2005;19(4):649–663. doi:10.1016/j.beem.2005.07.010
4. Choi K, Kim YB. Molecular mechanism of insulin resistance in obesity and type 2 diabetes. Korean J Intern Med. 2010;25(2):119–129. doi:10.3904/kjim.2010.25.2.119
5. Yan Y, Sha Y, Yao G, et al. Roux-en-Y gastric bypass versus medical treatment for type 2 diabetes mellitus in obese patients: a systematic review and meta-analysis of randomized controlled trials. Medicine. 2016;95(17):e3462. doi:10.1097/MD.0000000000003462
6. Camastra S, Gastaldelli A, Mari A, et al. Early and longer term effects of gastric bypass surgery on tissue-specific insulin sensitivity and beta cell function in morbidly obese patients with and without type 2 diabetes. Diabetologia. 2011;54(8):2093–2102. doi:10.1007/s00125-011-2193-6
7. Fabbrini E, Tamboli RA, Magkos F, et al. Surgical removal of omental fat does not improve insulin sensitivity and cardiovascular risk factors in obese adults. Gastroenterology. 2010;139(2):448–455. doi:10.1053/j.gastro.2010.04.056
8. Hardie DG. Sensing of energy and nutrients by AMP-activated protein kinase. Am J Clin Nutr. 2011;93(4):891S–896S. doi:10.3945/ajcn.110.001925
9. Entezari M, Hashemi D, Taheriazam A, et al. AMPK signaling in diabetes mellitus, insulin resistance and diabetic complications: a pre-clinical and clinical investigation. Biomed Pharmacother. 2022;146:112563. doi:10.1016/j.biopha.2021.112563
10. Zgheib NK, El-Khoury H, Maamari D, Basbous M, Saab R, Muwakkit SA. A GRIN3A polymorphism may be associated with glucocorticoid-induced symptomatic osteonecrosis in children with acute lymphoblastic leukemia. Per Med. 2021;18(5):431–439. doi:10.2217/pme-2020-0167
11. Shi X, Lu L, Jin X, et al. GRIN3A and MAPT stimulate nerve overgrowth in macrodactyly. Mol Med Rep. 2016;14(6):5637–5643. doi:10.3892/mmr.2016.5923
12. Fujihara C, Yamada S, Ozaki N, et al. Role of mechanical stress-induced glutamate signaling-associated molecules in cytodifferentiation of periodontal ligament cells. J Biol Chem. 2010;285(36):28286–28297. doi:10.1074/jbc.M109.097303
13. Zhang LH, Wang J, Tan BH, Yin YB, Kang YM. The association of lncRNA and mRNA changes in adipose tissue with improved insulin resistance in type 2 obese diabetes mellitus rats after Roux-en-Y gastric bypass. Dis Markers. 2022;2022:8902916. doi:10.1155/2022/8902916
14. Nagao H, Nishizawa H, Bamba T, et al. Increased dynamics of tricarboxylic acid cycle and glutamate synthesis in obese adipose tissue: in vivo metabolic turnover analysis. J Biol Chem. 2017;292(11):4469–4483. doi:10.1074/jbc.M116.770172
15. Zhou H, Li YJ, Wang M, et al. Involvement of RhoA/ROCK in myocardial fibrosis in a rat model of type 2 diabetes. Acta Pharmacol Sin. 2011;32(8):999–1008. doi:10.1038/aps.2011.54
16. Fang XK, Gao J, Zhu DN. Kaempferol and quercetin isolated from Euonymus alatus improve glucose uptake of 3T3-L1 cells without adipogenesis activity. Life Sci. 2008;82(11–12):615–622. doi:10.1016/j.lfs.2007.12.021
17. Petersen MC, Shulman GI. Mechanisms of Insulin Action and Insulin Resistance. Physiol Rev. 2018;98(4):2133–2223. doi:10.1152/physrev.00063.2017
18. Yan Y, Zhou Z, Kong F, et al. Roux-en-Y gastric bypass surgery suppresses hepatic gluconeogenesis and increases intestinal gluconeogenesis in a T2DM rat model. Obes Surg. 2016;26(11):2683–2690. doi:10.1007/s11695-016-2157-5
19. Yan Y, Sha Y, Huang X, et al. Roux-en-Y gastric bypass improves metabolic conditions in association with increased serum bile acids level and hepatic farnesoid X receptor expression in a T2DM rat model. Obes Surg. 2019;29(9):2912–2922. doi:10.1007/s11695-019-03918-0
20. Christian DT, Stefanik MT, Bean LA, et al. GluN3-containing NMDA receptors in the rat nucleus accumbens core contribute to incubation of cocaine craving. J Neurosci. 2021;41(39):8262–8277. doi:10.1523/JNEUROSCI.0406-21.2021
21. De Berardis D, Tomasetti C, Pompili M, et al. An update on glutamatergic system in suicidal depression and on the role of esketamine. Curr Top Med Chem. 2020;20(7):554–584. doi:10.2174/1568026620666200131100316
22. Ruderman NB, Carling D, Prentki M, Cacicedo JM. AMPK, insulin resistance, and the metabolic syndrome. J Clin Invest. 2013;123(7):2764–2772. doi:10.1172/JCI67227
23. Zhang R, Qin X, Zhang T, et al. Astragalus polysaccharide improves insulin sensitivity via AMPK activation in 3T3-L1 adipocytes. Molecules. 2018;23(10):2711. doi:10.3390/molecules23102711
24. Li X, Hu X, Pan T, et al. Kanglexin, a new anthraquinone compound, attenuates lipid accumulation by activating the AMPK/SREBP-2/PCSK9/LDLR signalling pathway. Biomed Pharmacother. 2021;133:110802. doi:10.1016/j.biopha.2020.110802
25. Agius L, Ford BE, Chachra SS. The metformin mechanism on gluconeogenesis and AMPK activation: the metabolite perspective. Int J Mol Sci. 2020;21(9):3240. doi:10.3390/ijms21093240
26. Shamshoum H, Vlavcheski F, MacPherson REK, Tsiani E. Rosemary extract activates AMPK, inhibits mTOR and attenuates the high glucose and high insulin-induced muscle cell insulin resistance. Appl Physiol Nutr Metab. 2021;46(7):819–827. doi:10.1139/apnm-2020-0592
27. Xu XJ, Apovian C, Hess D, Carmine B, Saha A, Ruderman N. Improved insulin sensitivity 3 months after RYGB surgery is associated with increased subcutaneous adipose tissue AMPK activity and decreased oxidative stress. Diabetes. 2015;64(9):3155–3159. doi:10.2337/db14-1765
28. Huang H, Aminian A, Hassan M, et al. Gastric bypass surgery improves the skeletal muscle ceramide/S1P ratio and upregulates the AMPK/SIRT1/PGC-1α pathway in Zucker diabetic fatty rats. Obes Surg. 2019;29(7):2158–2165. doi:10.1007/s11695-019-03800-z
29. Krssak M, Roden M. The role of lipid accumulation in liver and muscle for insulin resistance and type 2 diabetes mellitus in humans. Rev Endocr Metab Disord. 2004;5(2):127–134. doi:10.1023/B:REMD.0000021434.98627.dc
30. Ribeiro MBT, Guzzoni V, Hord JM, et al. Resistance training regulates gene expression of molecules associated with intramyocellular lipids, glucose signaling and fiber size in old rats. Sci Rep. 2017;7(1):8593. doi:10.1038/s41598-017-09343-6
31. Madsen MS, Siersbaek R, Boergesen M, Nielsen R, Mandrup S. Peroxisome proliferator-activated receptor gamma and C/EBPalpha synergistically activate key metabolic adipocyte genes by assisted loading. Mol Cell Biol. 2014;34(6):939–954. doi:10.1128/MCB.01344-13
32. John CM, Arockiasamy S. Sinapic acid prevents adipogenesis by regulating transcription factors and exerts an anti-ROS effect by modifying the intracellular anti-oxidant system in 3T3-L1 adipocytes. Iran J Basic Med Sci. 2022;25(5):611–620. doi:10.22038/IJBMS.2022.62590.13847
 © 2023 The Author(s). This work is published and licensed by Dove Medical Press Limited. The
full terms of this license are available at https://www.dovepress.com/terms
and incorporate the Creative Commons Attribution
- Non Commercial (unported, 3.0) License.
By accessing the work you hereby accept the Terms. Non-commercial uses of the work are permitted
without any further permission from Dove Medical Press Limited, provided the work is properly
attributed. For permission for commercial use of this work, please see paragraphs 4.2 and 5 of our Terms.
© 2023 The Author(s). This work is published and licensed by Dove Medical Press Limited. The
full terms of this license are available at https://www.dovepress.com/terms
and incorporate the Creative Commons Attribution
- Non Commercial (unported, 3.0) License.
By accessing the work you hereby accept the Terms. Non-commercial uses of the work are permitted
without any further permission from Dove Medical Press Limited, provided the work is properly
attributed. For permission for commercial use of this work, please see paragraphs 4.2 and 5 of our Terms.
Recommended articles
Research Progress of Duodenal-Jejunal Bypass Liner in the Treatment of Obesity and Type 2 Diabetes Mellitus
Chen JH, Yu ZH, Liu QLF, Meng QG, Chen X
Diabetes, Metabolic Syndrome and Obesity 2022, 15:3319-3327
Published Date: 28 October 2022