")
Back to Journals » Neuropsychiatric Disease and Treatment » Volume 13
Role of SIRT1/PGC-1α in mitochondrial oxidative stress in autistic spectrum disorder
Authors Bu XS, Wu D, Lu XM, Yang L, Xu XY, Wang J, Tang JL
Received 30 November 2016
Accepted for publication 18 January 2017
Published 23 June 2017 Volume 2017:13 Pages 1633—1645
DOI https://doi.org/10.2147/NDT.S129081
Checked for plagiarism Yes
Review by Single anonymous peer review
Peer reviewer comments 3
Editor who approved publication: Professor Wai Kwong Tang
Xiaosong Bu, De Wu, Xiaomei Lu, Li Yang, Xiaoyan Xu, Juan Wang, Jiulai Tang
Department of Pediatrics, The First Affiliated Hospital of Anhui Medical University, Hefei, People’s Republic of China
Abstract: Autistic spectrum disorder (ASD) is a neurodevelopmental disorder and has a high prevalence in children. Recently, mitochondrial oxidative stress has been proposed to be associated with ASD. Besides, SIRT1/PGC-1α signaling plays an important role in combating oxidative stress. In this study, we sought to determine the role of SIRT1/PGC-1α signaling in the ASD lymphoblastoid cell lines (LCLs). In this study, the mRNA and protein expressions of SIRT1/PGC-1α axis genes were assessed in 35 children with ASD and 35 healthy controls (matched for age, gender, and IQ). An immortalized LCL was established by transforming lymphocytes with Epstein–Barr virus. Next, we used ASD LCLs and control LCLs to detect SIRT1/PGC-1α axis genes expression and oxidative damage. Finally, the effect of overexpression of PGC-1α on oxidative injury in the ASD LCLs was determined. SIRT1/PGC-1α axis genes expression was downregulated at RNA and protein levels in ASD patients and LCLs. Besides, the translocation of cytochrome c and DIABLO from mitochondria to the cytosol was found in the ASD LCLs. Moreover, the intracellular reactive oxygen species (ROS) and mitochondrial ROS and cell apoptosis were increased in the ASD LCLs. However, overexpression of PGC-1α upregulated the SIRT1/PGC-1α axis genes expression and reduced cytochrome c and DIABLO release in the ASD LCLs. Also, overexpression of PGC-1α reduced the ROS generation and cell apoptosis in the ASD LCLs. Overexpression of PGC-1α could reduce the oxidative injury in the ASD LCLs, and PGC-1α may act as a target for treatment.
Keywords: autistic spectrum disorder, PGC-1α, SIRT1, mitochondria, oxidative stress
Introduction
Autistic spectrum disorder (ASD) is a neurodevelopmental disorder that is characterized by stereotypical behaviors and by impairments in social and language skills.1 Furthermore, children with ASD have a very high prevalence of comorbid mental health conditions, such as learning disabilities, attention-deficit hyperactivity disorder, emotional disorders, and chronic tic disorder.2,3 Besides, the prevalence of the ASD is 1 in 88 children in population4 In addition, the prevalence of the ASD in male population is almost five times more than that in female population.5 ASD has a genetic component6 and may be exacerbated by environmental factors, such as diet quality7 and environmental chemicals.8 Nowadays, ASD has become a major public health issue, and many researches focus on it. However, the underlying etiology of ASD is still unknown.
Oxidative stress is defined as a homeostatic imbalance between a increase in reactive oxygen species (ROS) and a decrease in the ability of the endogenous antioxidant defense systems to scavenge free radicals.9 Oxidative stress induces the secretion of many vasoactive and proinflammatory molecules,10 which leads to neuroinflammation.11 Moreover, oxidative stress has been implicated in some psychiatric disorders, such as schizophrenia12 and Alzheimer’s disease.13 Oxidative stress has also been associated with some individuals with ASD.14,15
Mitochondria are a major source of intracellular ROS production, and ROS have been considered as second messengers that participate in physiological processes such as apoptosis.16 During apoptosis a variety of cellular signals from the mitochondria, membrane, and cytosol are activated by stimuli.17 Additionally, mitochondria may sense these cellular signals and then lead to cell apoptosis by releasing proapoptotic factors into the cytosol, such as Smac-DIABLO and cytochrome c (cyto c).18 Moreover, the apoptosis induced by mitochondrial oxidative stress has been proposed to be associated with ASD.19
Peroxisome proliferator-activated receptor-γ co-activator 1α (PGC-1α) is a major regulator for mitochondrial function in many tissues, including the nervous system.20 And the activity of PGC-1α can be modulated by NAD+-dependent deacetylation through the functionally interactive metabolic biosensors sirtuin-1 (SIRT1).21 In addition, PGC-1α activates transcriptional factors such as nuclear respiratory factor 1 (NRF1) and mitochondrial transcription factor A (TFAM), which induce the respiration proteins of mitochondria.22 However, the role of SIRT1/PGC-1α in mitochondrial oxidative stress in ASD has not been investigated.
In this study, we sought to determine the role of SIRT1/PGC-1α signaling in the ASD lymphoblastoid cell lines (LCLs). First, we examined the expression of SIRT1–PGC-1α axis genes in ASD patients and LCLs. Then, we measured the intracellular ROS and mitochondrial ROS generation and cell apoptosis in the ASD LCLs. Finally, we detected the effect of PGC-1α on the ROS generation and cell apoptosis in the ASD LCLs. For the first time, we demonstrated that overexpression of PGC-1α could reduce the oxidative injury in the ASD LCLs and that PGC-1α may act as a target for treatment.
Materials and methods
Participants
Two groups, each consisting of 35 Chinese Han male children between the ages of 6 and 12 years, participated in the study. For the autism group, patients were diagnosed with ASD according to international standard diagnostic tests, which consist of meeting criteria on the social and communication domains and algorithm total of the Autism Diagnostic Observation Schedule-Generic (ADOS-G)23 and on two of three algorithm domains of the Autism Diagnostic Interview Revised.24 For the control group, the healthy controls were normally developing, healthy children unrelated to the autistic subjects and without mental (eg, schizophrenia) or genetic disorders (eg, fragile X syndrome). IQ was evaluated with the standardized Raven test25 for the two groups (mean IQ: ASD, M =103.4, standard deviation [SD] =12.6; healthy control, M =109.3, SD =14.5). Written informed consent was obtained from all participants or their legal guardians. The study was approved by the Ethics Committee of the First Affiliated Hospital of Anhui Medical University. Five milliliters of the whole blood was taken from all participants for further studies. The characteristics of participants (n=35 in each group) who volunteered for the study are listed in Table 1.
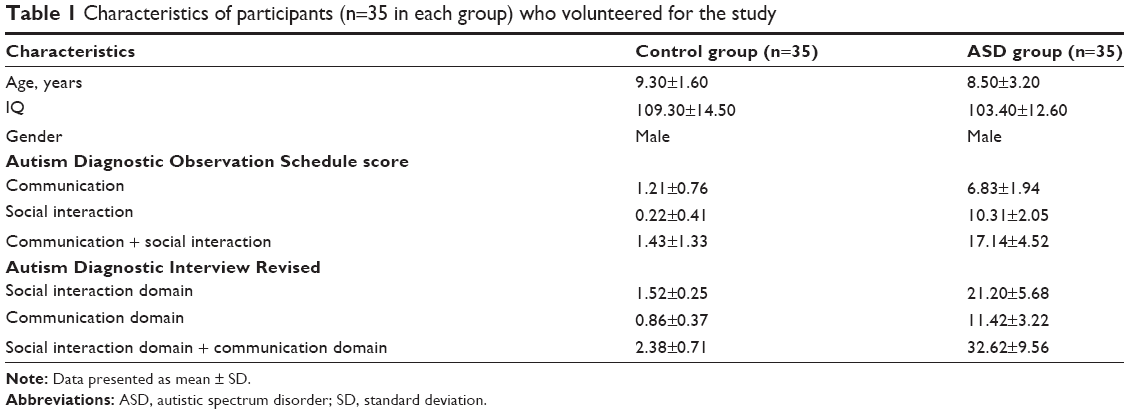 | Table 1 Characteristics of participants (n=35 in each group) who volunteered for the study |
Lymphoblastoid cell lines and cell culture
Ten ASD LCLs were derived from 35 ASD patients, and ten control LCLs were derived from 35 healthy controls. Immortalized LCLs were established by transforming lymphocytes with Epstein–Barr virus (EBV) following previously described procedures.26 In brief, 5 mL whole blood was drawn from ten ASD patients and ten healthy controls. After centrifugation at 3,000 rpm for 15 minutes, the Buffy coat layer was drawn and diluted with HBSS (Hanks-balanced salt solution). Then, the lymphocytes were isolated by using Ficoll gradient centrifugation. After washing with HBSS, the lymphocytes were cultured in Roswell Park Memorial Institute (RPMI) 1640 culture medium (Gibco, BRL, Thermo Fisher Scientific, Waltham, MA, USA) with phytohemagglutinin and then transformed with EBV suspension. The cells were studied at passage 12 on average. Because at this low passage number, genomic stability is very high.27 Cells were incubated in RPMI 1640 culture medium with 10% fetal bovine serum and 1% penicillin/streptomycin (Invitrogen, Carlsbad, CA, USA) at 37°C with 5% CO2 in a humidified chamber.
Cell transfection
Three ASD LCLs randomly selected from ten ASD LCLs were used for cell transfection. A PGC-1α overexpression plasmid, pCIG-PGC-1α, was commercially constructed by GenePharma (Suzhou, People’s Republic of China), and the empty pCIG vector was used as the control. These two plasmids were transfected into ASD LCLs using the Lipofectamine 2000 Transfection Reagent (Invitrogen) according to the manufacturer’s instructions.
Quantitative real-time polymerase chain reaction (PCR)
Total RNA was isolated using TRIzol (Invitrogen) following the manufacturer’s instructions. Total RNA was reverse transcribed using Superscript II reverse transcriptase (Invitrogen). Quantitative real-time PCR was performed in an Agilent Technologies (Santa Clara, CA, USA) Bioanalyzer by using SYBR Green PCR Master Mix (Roche, Pleasanton, CA, USA). Relative mRNA levels were calculated using the 2−ΔΔCt method. GAPDH was used as an internal control. A complete list of primer sets is given below:
PGC-1α Forward: 5′-CACCAGCCAACACTCAGCTA-3′
PGC-1α Reverse: 5′-GTGTGAGGAGGGTCATCGTT-3′
SIRT1 Forward: 5′-GCAACAGCATCTTGCCTGAT-3′
SIRT1 Reverse: 5′-GTGCTACTGGTCTCACTT-3′
NRF1 Forward: 5′-GGTGCCTAGTGAGAGTGAGTCCCCC-3′
NRF1 Reverse: 5′-TCGGGGCTGAAGAGGGAGAAGTC-3′
TFAM Forward: 5′-GGAGGCAAAGGATGATTCGG-3′
TFAM Reverse: 5′-TCGTCCAACTTCAGCCATCT-3′
GAPDH Forward: 5′-TCCCAGCACACTTAACTTAGC-3′
GAPDH Reverse: 5′-AGCCACAAGAAACACTCAGG-3′
Mitochondria-free cytosolic fractionation
Mitochondria-free cytosolic protein fractions were prepared as described previously.28 Briefly, cells were lysed in ice-cold extraction buffer (20 mM 4-(2-hydroxyethyl)-1-piperazineëthanesulfonic acid, 250 mM sucrose, 10 mM KCl, 1.5 mM MgCl2, 0.1 mM phenylmethylsulfonyl fluoride, 1 mM ethylene diamine tetraacetic acid, 1 mM ethylene glycol tetraacetic acid, and 1 mM dithiothreitol, pH 7.4) supplemented with protease inhibitor cocktail. After homogenization in a small glass homogenizer with Teflon pestle, the homogenates were first centrifuged at 800× g for 10 minutes at 4°C to remove the nuclei and cell debris. Then, the supernatants were centrifuged twice at 16,000× g for 20 minutes at 4°C to remove the mitochondria. The final supernatants were collected as mitochondria-free cytosolic protein fractions.
Western blot analysis
The total protein extracts were prepared as described previously.29 In brief, cells were lysed in cold radioimmunoprecipitation assay buffer with protease and phosphatase inhibitor cocktail (Roche). Equal amounts of protein samples were separated on SDS-PAGE, and then transferred onto nitrocellulose membranes (Millipore, Billerica, MA, USA). Then, membranes were probed with anti-PGC-1α (1:2,000; Santa Cruz Biotechnology, Dallas, TX, USA), anti-TFAM (1:16,000; Novus Bio, Littleton, CO, USA), anti-NRF1 (1:1,000; Santa Cruz Biotechnology), anti-SIRT1 (1:2,000; Sigma-Aldrich, St Louis, MO, USA), anti-cyto c (1:2,000; eBioscience, San Diego, CA, USA), anti-DIABLO (1:1,000; Cell Signaling Technologies, Danvers, MA, USA), and anti-GAPDH antibodies (1:1,000; Cell Signaling Technologies). The blots were then analyzed by chemiluminescence detection (ECL, Amersham, GE Healthcare Life Sciences, Chicago, IL, USA).
Mitochondrial transmembrane potential (ΔΨm) assay
JC-1 is a fluorescent probe that is sensitive to mitochondrial membrane potential (ΔΨm).30 When the mitochondrial membrane potential is low, JC-1 cannot concentrate in the mitochondria matrix, the JC-1 monomer emits green fluorescence. And when the mitochondrial membrane potential is high, JC-1 concentrates in the mitochondrial matrix, which forms J-aggregates to produce red fluorescence. A decrease in red/green ratio indicates apoptosis.31 LCLs were seeded into 12-well plates (105 cells per well). Change in ΔΨm was detected using a MitoProbe JC-1 Assay Kit (Invitrogen) according to the manufacturer’s instructions. The images were then taken using a confocal laser scanning microscopy (FV1200; Olympus, Tokyo, Japan). Fluorescence was measured at 530 nm excitation/590 nm emission. Finally, the ratio of red/green fluorescence was examined by using imaging software ImageJ.
Intracellular ROS and mitochondrial ROS generation assay
Dichloro-dihydro-fluorescein diacetate (DCFH-DA) can be cleaved intracellularly by nonspecific esterase and then oxidized by ROS to turn to high fluorescence.32 Intracellular ROS levels were determined with fluorescent DCFH-DA. Briefly, cells at a density of 105/mL were plated in each 35-mm culture plate (Thermo Fisher Scientific). Then, they were incubated in DCFH-DA (10 μmol/L; Sigma-Aldrich). The DCFH-DA fluorescence intensities were determined using a confocal laser scanning microscopy (FV1200; Olympus). Fluorescence was measured at 490 nm excitation/520 nm emission. The average fluorescence intensities of DCFH-DA in the cells were analyzed using imaging software ImageJ.
Mitochondrial ROS generation was evaluated by the use of the probe MitoSOX Red. Cells were seeded at a density of 105/mL in glass bottom culture dishes (NEST, 801001). Then, they were incubated with 2.5 μM MitoSOX Red for 30 minutes at 37°C. After that, cells were treated with 200 nM MitoTracker green for 15 minutes to stain mitochondria. Subsequently, cells were examined under a confocal laser scanning microscopy (FV1200; Olympus). Fluorescence was measured at 510 nm excitation/585 nm emission. ImageJ software was used to analyze the image to determine the average optical density.
Complex activity assay
Mitochondrial extracts were obtained by using a proprietary mitochondria isolation kit (BioChain Institute, Newark, CA, USA) according to the manufacturer’s instructions. To measure mitochondrial complex I activity, an NADH oxidation assay was used.33 The buffer used for complex I assay was 2 mM KCN, 35 mM potassium phosphate, pH 7.2, 5 mM MgCl2, 2.5 mg/mL free fatty acid–bovine serum albumin, and 2 μg/mL antimycin. Then, 10 μmol NADH was made up freshly in this buffer, and 15 mM coenzyme Q1 was prepared in 100% ethanol. After that, 10 μL NADH and 4 μL coenzyme Q1 were added to the reaction mixture. The reaction was started with 20 μg of mitochondrial extracts. Then, complex I activity was measured at 450 nm.
Mitochondrial complex III activity was measured by monitoring the reduction of cyto c by ubiquinol as described previously.34 The reaction mixture contained 1 mM KCN, 35 mM potassium phosphate buffer pH 7.2, 5 mM MgCl2, 1 mM ethylene diamine tetraacetic acid, 15 mM cyto c, 5 mM rotenone, and 20 μg of mitochondrial extracts. The reaction was initiated by 15 μM ubiquinol. The activity of complex III due to the reduction of cyto c was measured by the increase in absorbance at 550 nm.
Flow cytometry analysis
Cells apoptosis were analyzed using an Annexin V-FITC Apoptosis Detection Kit (Sigma-Aldrich). Cells were analyzed by flow cytometry using a FACSCalibur (Becton Dickinson, Franklin Lakes, NJ, USA). Viable (annexin−/PI−), necrotic nonviable (annexin−/PI+), apoptotic (annexin+/PI−), and late apoptotic/necrotic (annexin+/PI+) cells were characterized based on the methods described previously.35
Immunophenotyping analysis
All cell lines were tested for cell surface antigen expression by direct immunofluorescence and flow cytometric analysis. The cells were stained with CD19-PE and CD20-FITC in the dark for 30 minutes. IgG1-FITC and IgG1-PE were used as isotype-matched controls. Cells were analyzed by flow cytometry using a FACSCalibur (Becton Dickinson).
Statistics
Data were expressed as means ± SD. Statistical significance of the data were performed by Student’s t-test. Values were considered to be statistically significant at P<0.05. All experiments were repeated at least for three times.
Results
Cell surface immunophenotyping
The lymphotropic virus of EBV is routinely used in the laboratory to transform B lymphocytes and generate B LCLs.36 The EBV-LCLs of ASD patients and healthy controls were characterized for cell surface markers by direct immunostaining and fluorescent-activated cell sorting (FACS) analysis. Figure 1 showed both EBV-LCLs were positive for B cell markers CD19 and CD20, indicating EBV-LCLs was established successfully.
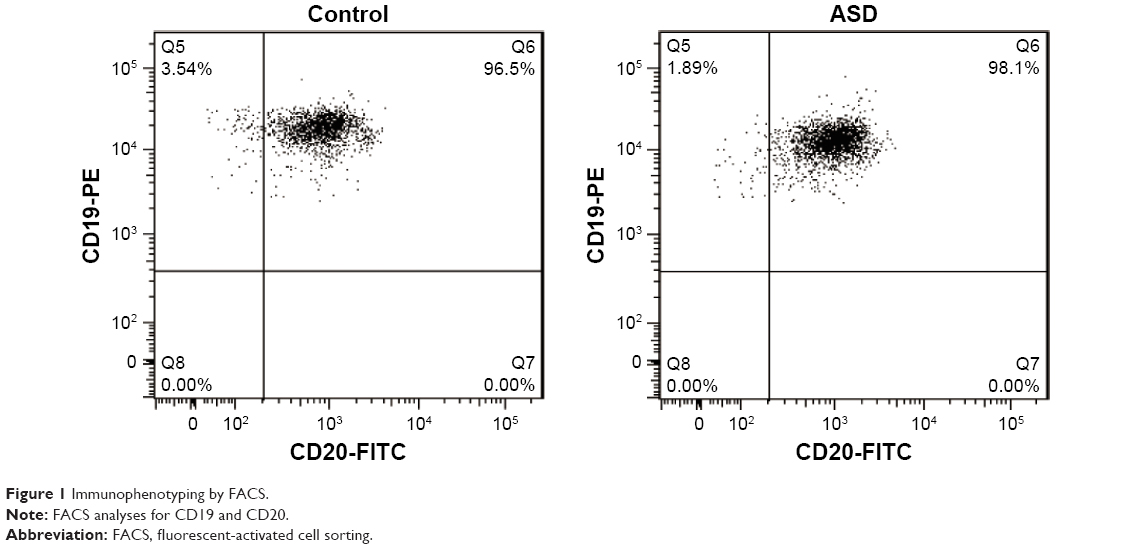 | Figure 1 Immunophenotyping by FACS. |
Expression of SIRT1–PGC-1α axis genes in ASD patients
To determine the expression of SIRT1, PGC-1α, NRF1, and TFAM in the ASD patients, qRT-PCR and Western blot assays were used. Our data found that the SIRT1, PGC-1α, NRF1, and TFAM mRNA were significantly decreased in the ASD patients compared with that in the healthy controls (Figure 2A–D). The same results were also observed for the protein expressions (Figure 2E). Thus, our results indicated that SIRT1/PGC-1α axis genes expression was downregulated at RNA and protein levels in ASD patients.
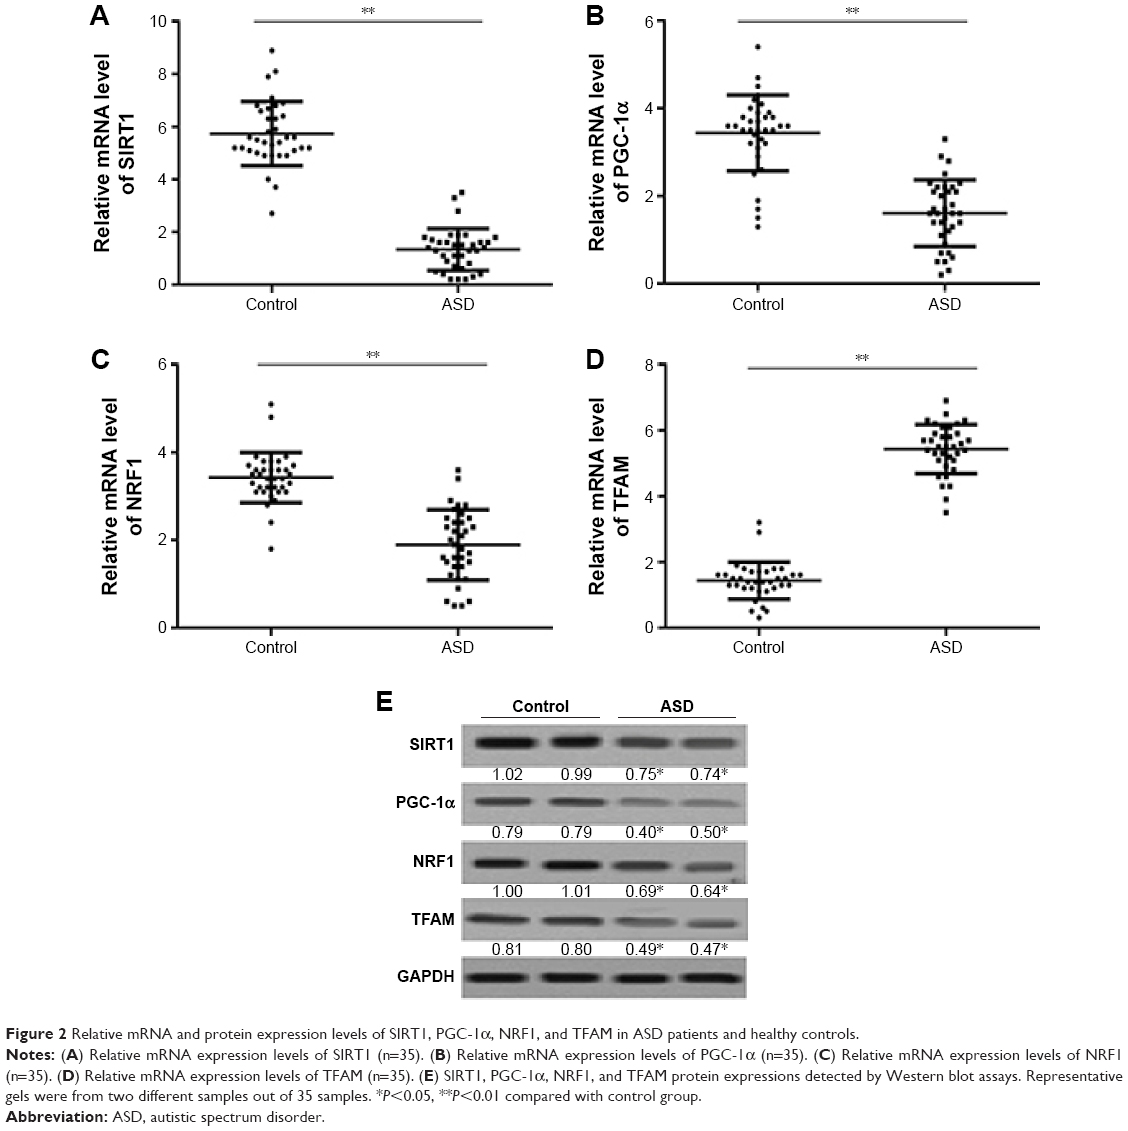 | Figure 2 Relative mRNA and protein expression levels of SIRT1, PGC-1α, NRF1, and TFAM in ASD patients and healthy controls. |
Expression of SIRT1–PGC-1α axis genes and translocation of apoptogenic proteins in the ASD LCLs
Next, the expression of SIRT1, PGC-1α, NRF1, and TFAM in the ASD LCLs were measured. As shown in Figure 3A–E, the expression of SIRT1, PGC-1α, NRF1, and TFAM in the ASD LCLs was reduced at both RNA and protein levels.
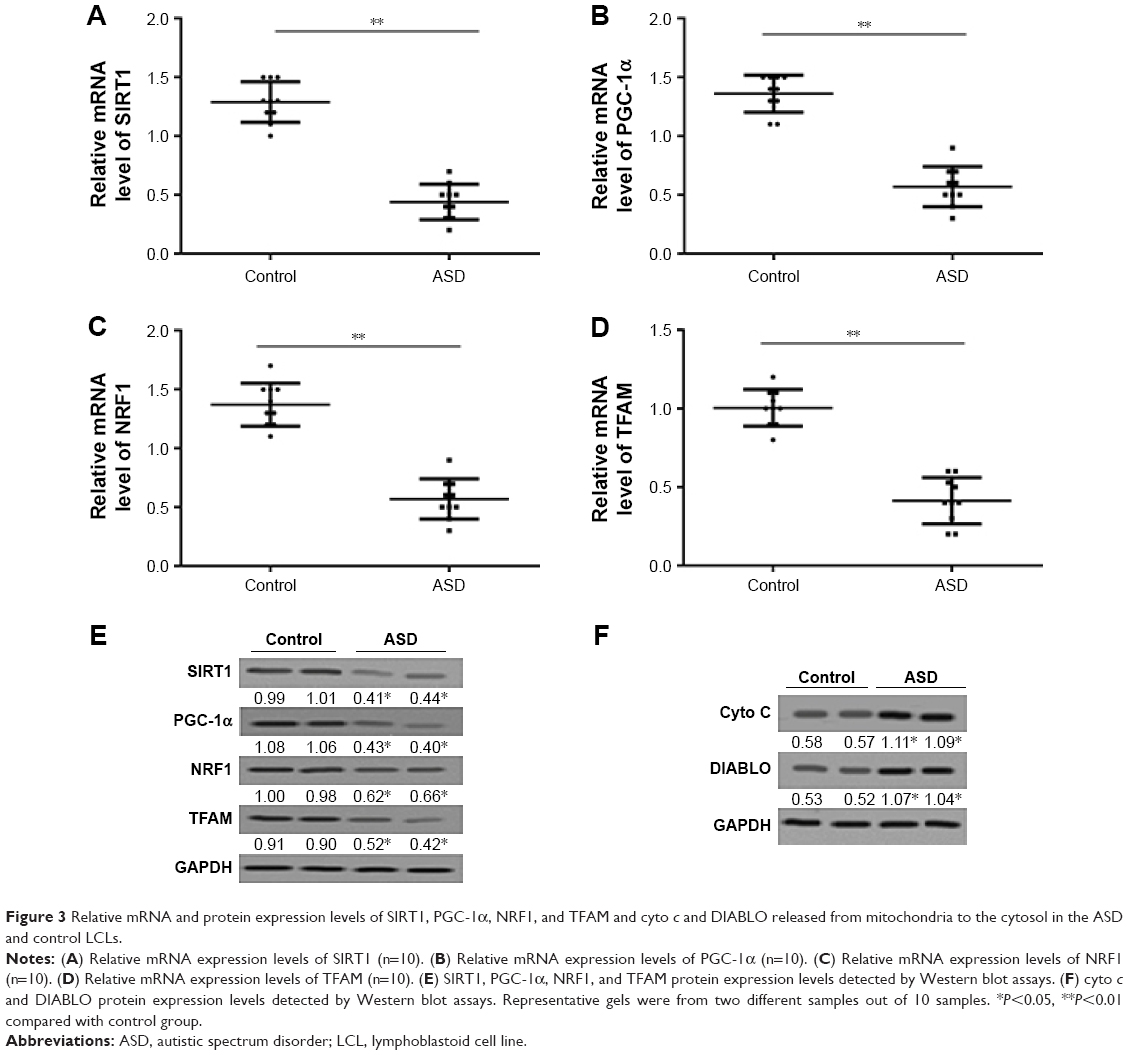 | Figure 3 Relative mRNA and protein expression levels of SIRT1, PGC-1α, NRF1, and TFAM and cyto c and DIABLO released from mitochondria to the cytosol in the ASD and control LCLs. |
During mitochondria-mediated apoptosis, the outer mitochondrial membrane becomes permeable, which leads to the release of apoptogenic protein.37 cyto c and DIABLO proteins are released to cytosol from mitochondria in response to apoptosis.38 As shown in Figure 3F, a significant increase in the expression levels of cyto c and DIABLO proteins, which were detected from mitochondria-free cytosolic proteins, was observed in the ASD LCLs. These results demonstrated that the expression of genes in the SIRT1/PGC-1α axis was downregulated as was cyto c and DIABLO released from mitochondria to the cytosol in the ASD LCLs.
Cell apoptosis in the ASD LCLs
To elucidate cell apoptosis in the ASD LCLs, we used JC-1 staining to evaluate the loss of ΔΨm. In the ASD LCLs, JC-1 red/green fluorescence ratio decreased significantly compared with that in the control LCLs (Figure 4A). And, the feeble mitochondrial membrane potential indicated the primary change of cell apoptosis in the ASD LCLs.
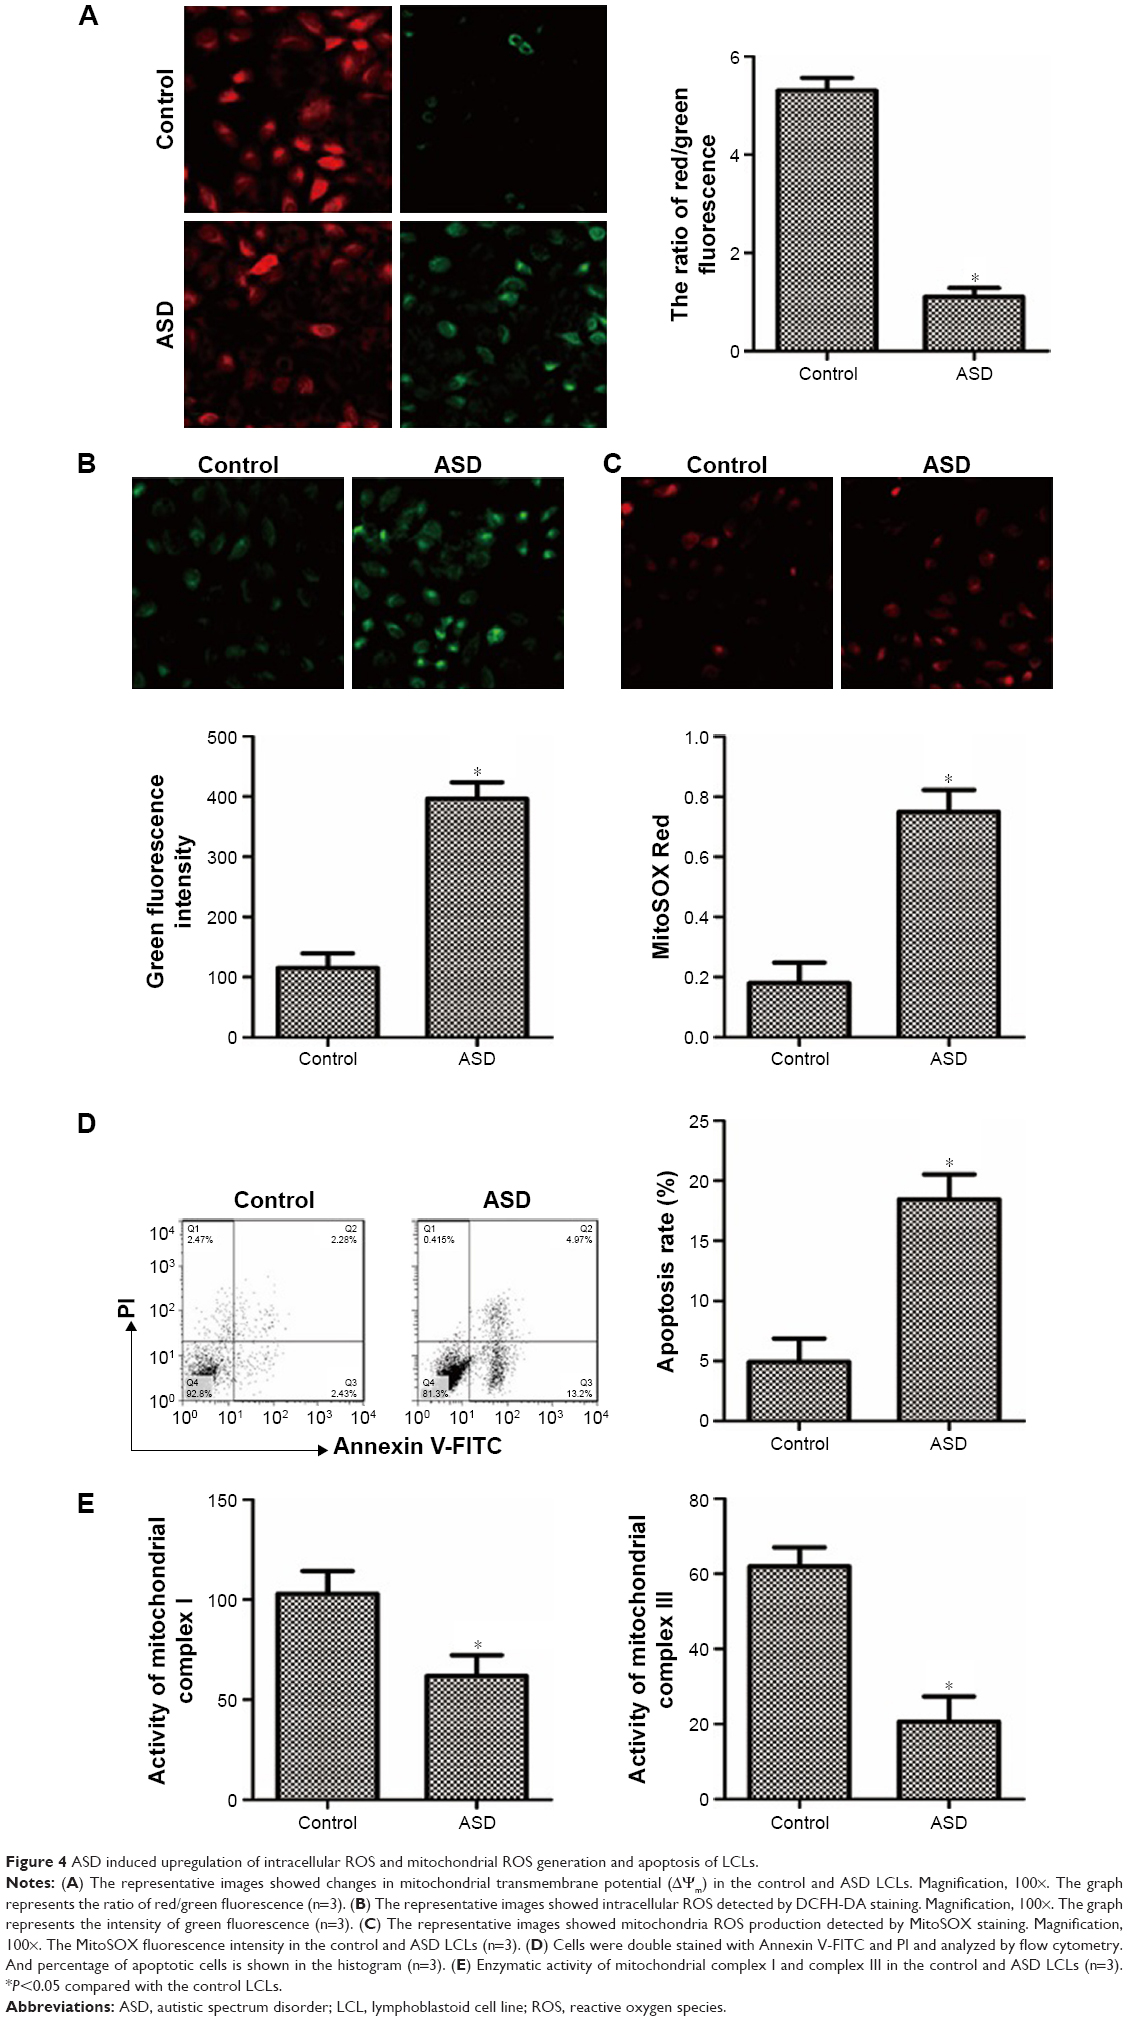 | Figure 4 ASD induced upregulation of intracellular ROS and mitochondrial ROS generation and apoptosis of LCLs. |
Subsequently, apoptosis of ASD LCLs was further confirmed by using Annexin V-FITC staining and FACS analysis. A representative FACS analysis plot is depicted in Figure 4D. In comparison with control LCLs, ASD LCLs displayed a significant increase in apoptosis (annexin+/PI−). These results revealed that ASD induced cell apoptosis in the LCLs.
Intracellular ROS and mitochondrial ROS generation in the ASD LCLs
Increased ROS generation is involved in the induction of apoptosis.39 To examine the intracellular ROS and mitochondrial ROS in the ASD LCLs, DCFH-DA and MitoSOX Red staining were used. The DCFH-DA is a H2O2-sensitive fluorescence probe and can be applied to assess the intracellular H2O2.40 MitoSOX Red is a live-cell permeant dye that can selectively and rapidly target mitochondria and is used to detect mitochondrial O2.41 As shown in Figure 4B, cells stained with DCFH-DA demonstrated a significant increase in intracellular ROS production in the ASD LCLs compared with that in the control LCLs. In addition, to evaluate mitochondrial superoxide, we used MitoSOX Red probe. The results demonstrated that the mitochondrial ROS generation also increased in the ASD LCLs (Figure 4C).
Activities of mitochondrial respiratory complexes in the ASD LCLs
As excessive production of ROS impairs the activities of respiratory chain complexes,42 we next measured the activities of respiratory chain complexes, complexes I and III. In Figure 4E, the results showed the activities of complexes I and III were significantly decreased in the ASD LCLs than that in the control LCLs. Thus, the results demonstrated that ROS induced damage to the mitochondrial respiratory chain in the ASD LCLs.
Effect of PGC-1α on the expression of SIRT1–PGC-1α axis genes and translocation of apoptogenic proteins in the ASD LCLs
To investigate the effect of PGC-1α on the expression of SIRT1, PGC-1α, NRF1, and TFAM in the ASD LCLs, the ASD LCLs were transfected with PGC-1α overexpression vector and empty vector. As shown in Figure 5A–E, overexpression of PGC-1α increased the expression of SIRT1, PGC-1α, NRF1, and TFAM in the ASD LCLs at both RNA and protein levels. Moreover, overexpression of PGC-1α decreased the expression levels of cyto c and DIABLO proteins in the ASD LCLs (Figure 5F). These results revealed that overexpression of PGC-1α upregulated the SIRT1/PGC-1α axis genes expression and reduced cyto c and DIABLO release in the ASD LCLs.
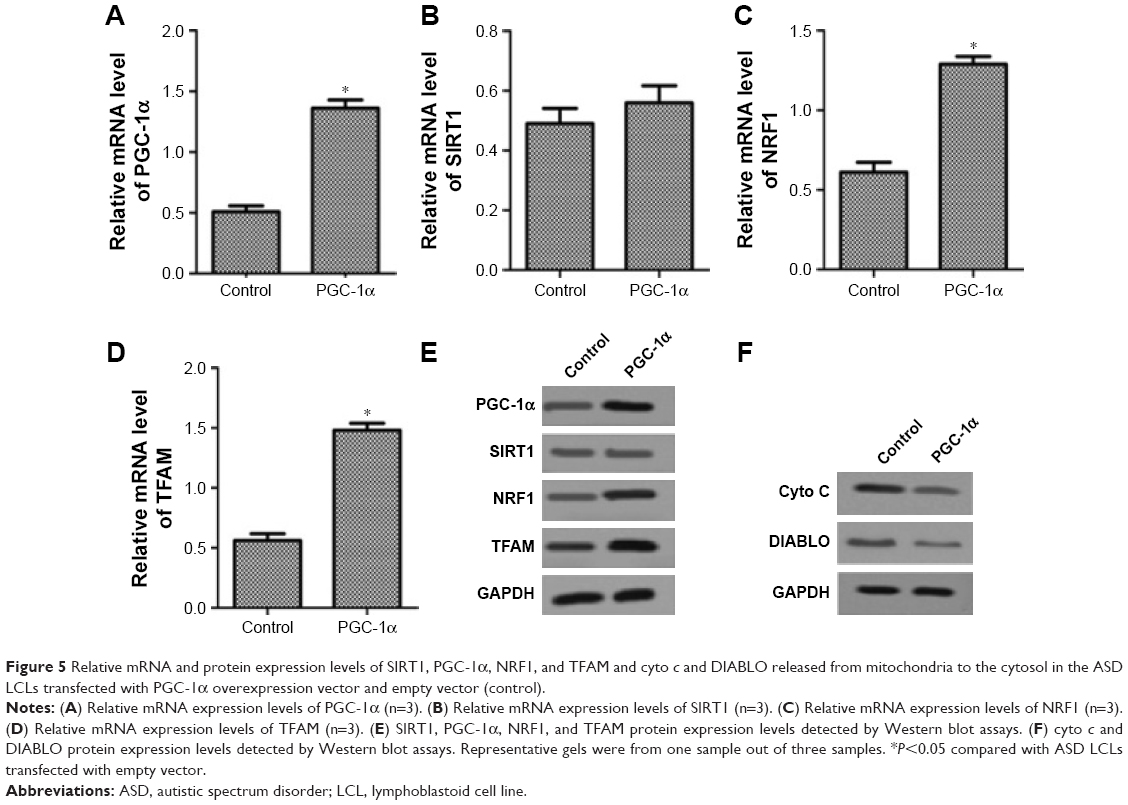 | Figure 5 Relative mRNA and protein expression levels of SIRT1, PGC-1α, NRF1, and TFAM and cyto c and DIABLO released from mitochondria to the cytosol in the ASD LCLs transfected with PGC-1α overexpression vector and empty vector (control). |
Effect of PGC-1α on the cell apoptosis in the ASD LCLs
To detect the effect of PGC-1α on cell apoptosis in the ASD LCLs, JC-1 staining was used to evaluate the loss of ΔΨm. The mitochondrial membrane potential was significantly higher in PGC-1α overexpression group than that in the control group (Figure 6A). Thus, overexpression of PGC-1α inhibited cell apoptosis in the ASD LCLs. In addition, identical results were showed by Annexin V/PI staining (Figure 6D).
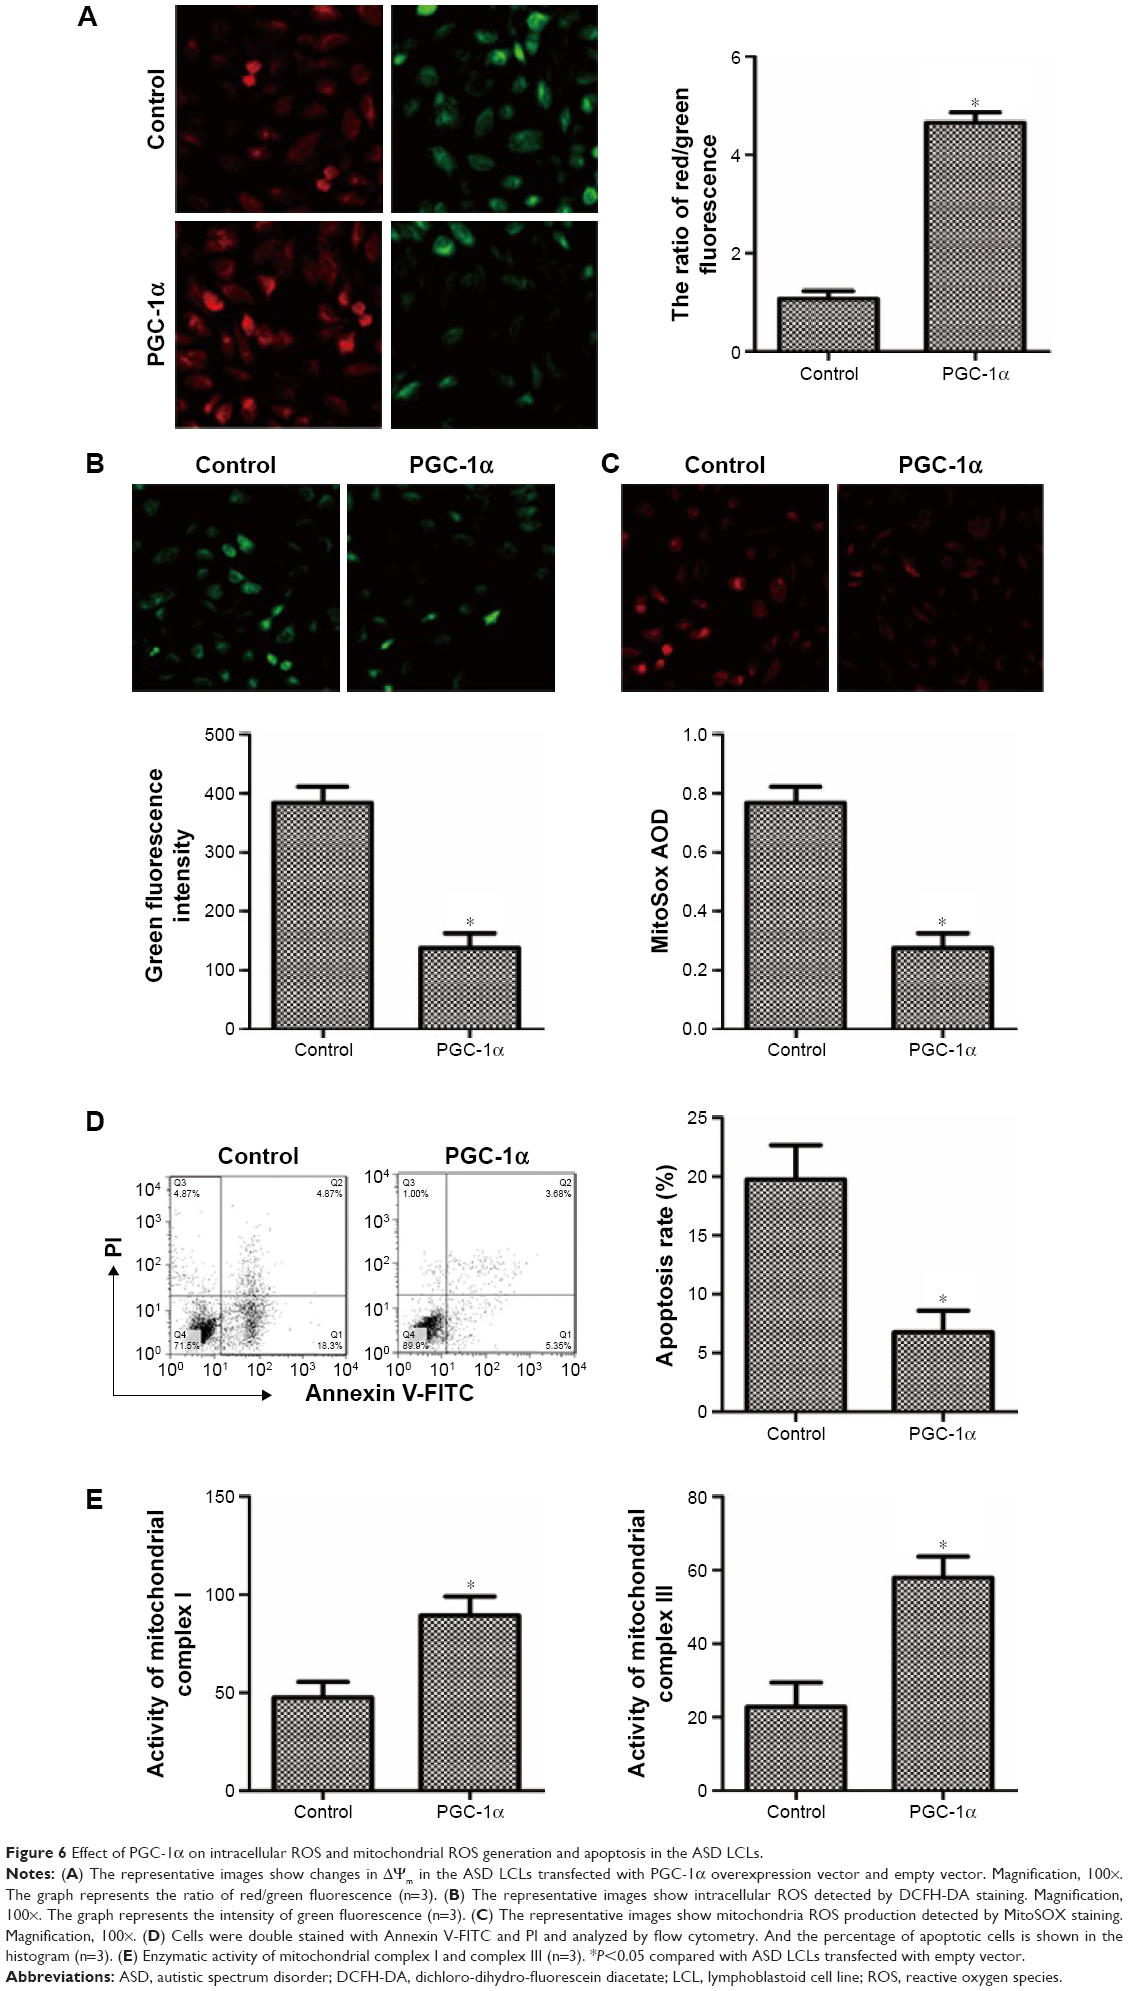 | Figure 6 Effect of PGC-1α on intracellular ROS and mitochondrial ROS generation and apoptosis in the ASD LCLs. |
Effect of PGC-1α on intracellular ROS and mitochondrial ROS generation in the ASD LCLs
To examine the effect of PGC-1α on intracellular ROS and mitochondrial ROS in the ASD LCLs, DCFH-DA and MitoSOX Red staining were used. As shown in Figure 6B and C, a significant decrease in intracellular ROS and mitochondrial ROS in the ASD LCLs transfected with PGC-1α overexpression vector was observed compared with that in control group.
Effect of PGC-1α on activities of mitochondrial respiratory complexes in the ASD LCLs
Subsequently, we evaluated the effect of PGC-1α on the activities of respiratory chain complexes, complexes I and III. The results showed that overexpression of PGC-1α dramatically increased the activities of complexes I and III in the ASD LCLs compared with the control group (Figure 6E). These results demonstrated overexpression of PGC-1α could repress ROS-induced damage to the mitochondrial respiratory chain in the ASD LCLs.
Discussion
ASD is a complex neurodevelopmental disorder that is thought to occur as a result of interaction between epigenetic effects, variable susceptibility genes, and environmental factors.43–45 And previous studies indicated that oxidative stress might contribute to the pathogenesis of ASD.46 Tang et al47 found elevated levels of biomarkers of oxidative stress in the temporal cortex of the ASD group and in the same brain region where mitochondrial electron transport chain (ETC) complex deficiencies exist. Chauhan and Chauhan48 demonstrated the presence of markers of oxidative stress in urine and blood in the individuals with ASD. However, the studies associated with the molecular mechanisms of oxidative stress in ASD are limited. Therefore, our study aimed to find the damage of mitochondrial oxidative stress and the effect of SIRT1/PGC-1α signaling on oxidative stress in ASD.
Increasing evidence has shown that mitochondrial dysfunction occurs in many neurodegenerative diseases, such as Parkinson’s disease,49 schizophrenia,50 and Alzheimer’s disease.51 Recent researches have indicated that mitochondrial abnormalities may also affect the developing of brain and trigger a cascade of events, resulting in neurodevelopmental disorders like autism.52,53 ROS can activate immune cells, which leads to mitochondrial dysfunction.54 Thus, the mitochondrial oxidative stress may be one of the potential etiologic factors in ASD.
Previous studies demonstrated that LCLs derived from children with autistic disorder had higher levels of ROS and exhibited a significant decrease in both intracellular and mitochondrial glutathione redox capacity than that in control LCLs.55 Besides, children with autism are more sensitive to necrosis caused by oxidative stress than their nonautistic siblings.56 In the present study, we found that intracellular ROS (mainly hydrogen peroxide and hydroxyl radicals) and mitochondrial ROS, mainly superoxide anion, were accumulated at higher levels in the ASD LCLs compared to that in the control LCLs. As a result, oxidative stress existed in the ASD LCLs.
The mitochondrial respiratory chain is an important structural and functional part of mitochondria and is located in the inner mitochondrial membrane.57 Moreover, the production of mitochondrial superoxide radicals occurs manly at two discrete points in the ETC, namely, at complex I and complex III.58 Indeed, mitochondria are a major source of ROS as well as the target for ROS-mediated damage.59 The ETC complex I dysfunction can produce high levels of ROS.60 In turn, ROS can suppress the function of ETC, such as complex I activity,61 leading to mitochondrial dysfunction. Our results showed the activities of complexes I and III were significantly decreased in the ASD LCLs than in the control LCLs, suggesting oxidative stress impaired mitochondrial respiratory chain in the ASD LCLs.
In addition, ROS are considered to participate in various cellular functions, including cell differentiation, proliferation, and apoptosis.62 Additionally, the increase of ROS production can directly and indirectly lead to impairments in mitochondrial respiratory chain63 and activate mitochondrial and non-mitochondrial-dependent biochemical cascades that lead to cell apoptosis.64 JC-1 is widely used in detection of ΔΨm in various cells or tissues.65 Besides, changes in fluorescence from red to green induced by JC-1 indicated the decline of the membrane potential, and a decrease in ΔΨm implied early apoptosis.66 Our study showed that the red fluorescence intensity was decreased, whereas the green fluorescence intensity was increased. The results indicated that the ΔΨm declined and that apoptosis was activated in the ASD LCLs.
It has been reported that SIRT1/PGC-1α signaling plays an important role in neuronal survival based on the fact that transgenic mice in which the expression of PGC-1α is silenced have neurodegenerative lesions.67 PGC-1α is a master regulator of cell metabolism, oxidative stress, and mitochondrial biogenesis.20 Recently, an important function of PGC-1α in dopaminergic neurons to defend against oxidative stress and increase neuronal viability in Parkinson’s disease has been discovered.68 Furthermore, lack of PGC-1α increased the sensitivity of brain neurons against oxidative stress.20 In this study, we showed that overexpressing of PGC-1α protected against ROS generation and inhibited cell apoptosis in the ASD LCLs, which suggested a key role of SIRT1/PGC-1α signaling in the ASD LCLs.
In conclusion, we demonstrated mitochondrial oxidative stress may affect a significant subgroup of ASD children and that the SIRT1/PGC-1α signaling pathway may be a promising medical treatment for ASD.
Acknowledgment
The authors are thankful for the financial support from the National Natural Science Foundation of China (81472167).
Disclosure
The authors report no conflicts of interest in this work.
References
Cocks G, Curran S, Gami P, et al. The utility of patient specific induced pluripotent stem cells for the modelling of autistic spectrum disorders. Psychopharmacology (Berl). 2014;231(6):1079–1088. | ||
Bradley E, Bolton P. Episodic psychiatric disorders in teenagers with learning disabilities with and without autism. Br J Psychiatry. 2006;189(4):361–366. | ||
Simonoff E, Pickles A, Charman T, Chandler S, Loucas T, Baird G. Psychiatric disorders in children with autism spectrum disorders: prevalence, comorbidity, and associated factors in a population-derived sample. J Am Acad Child Adolesc Psychiatry. 2008;47(8):921–929. | ||
Walsh KS, Vélez JI, Kardel PG, et al. Autism spectrum disorder (ASD) symptomatology in a neurofibromatosis type 1 (NF1) population. Dev Med Child Neurol. 2013;55(2):131–138. | ||
Baio J. Prevalence of autism spectrum disorders-Autism and Developmental Disabilities Monitoring Network, 14 sites, United States, 2008. MMWR Surveill Summ. 2007;56(SS-1):67–68. | ||
Grice DE, Buxbaum JD. The genetics of autism spectrum disorders. Neuromolecular Med. 2006;8(4):451–460. | ||
Kohlboeck G, Sausenthaler S, Standl M, et al. Food intake, diet quality and behavioral problems in children: results from the GINI-plus/LISA-plus studies. Ann Nutr Metab. 2012;60(4):247–256. | ||
Miller CS. The compelling anomaly of chemical intolerance. Ann N Y Acad Sci. 2001;933(1):1–23. | ||
Rossignol DA, Frye RE. A review of research trends in physiological abnormalities in autism spectrum disorders: immune dysregulation, inflammation, oxidative stress, mitochondrial dysfunction and environmental toxicant exposures. Mol Psychiatry. 2012;17(4):389–401. | ||
Theoharides TC, Kempuraj D, Redwood L. Autism: an emerging ‘neuroimmune disorder’ in search of therapy. Expert Opin Pharmacother. 2009;10(13):2127–2143. | ||
Rose S, Melnyk S, Pavliv O, et al. Evidence of oxidative damage and inflammation associated with low glutathione redox status in the autism brain. Transl Psychiatry. 2012;2(7):e134. | ||
Prabakaran S, Swatton JE, Ryan MM, et al. Mitochondrial dysfunction in schizophrenia: evidence for compromised brain metabolism and oxidative stress. Mol Psychiatry. 2004;9(7):684–697. | ||
Barnham KJ, Masters CL, Bush AI. Neurodegenerative diseases and oxidative stress. Nat Rev Drug Discov. 2004;3(3):205–214. | ||
Mcginnis WR. Oxidative stress in autism. Pathophysiology. 2006;13(3):171–181. | ||
Sajdel-Sulkowska EM, Xu M, Mcginnis W, Koibuchi N. Brain region-specific changes in oxidative stress and neurotrophin levels in autism spectrum disorders (ASD). Cerebellum. 2011;10(1):43–48. | ||
Banh S, Wiens L, Sotiri E, Treberg JR. Mitochondrial reactive oxygen species production by fish muscle mitochondria: potential role in acute heat-induced oxidative stress. Comp Biochem Physiol B Biochem Mol Biol. 2016;191:99–107. | ||
Seo YW, Shin JN, Ko KH, et al. The molecular mechanism of noxa-induced mitochondrial dysfunction in p53-mediated cell death. J Biol Chem. 2003;278(48):48292–48299. | ||
Pérez-Rodríguez R, Fuentes MP, Oliván AM, et al. Mechanisms of nitric oxide-induced apoptosis in bovine chromaffin cells: role of mitochondria and apoptotic proteins. J Neurosci Res. 2007;85(10):2224–2238. | ||
Yui K, Sato A, Imataka G. Mitochondrial dysfunction and its relationship with mTOR signaling and oxidative damage in autism spectrum disorders. Mini Rev Med Chem. 2015;15(5):373–389. | ||
St-Pierre J, Drori S, Uldry M, et al. Suppression of reactive oxygen species and neurodegeneration by the PGC-1 transcriptional coactivators. Cell. 2006;127(2):397–408. | ||
Lagouge M, Argmann C, Gerhart-Hines Z, et al. Resveratrol improves mitochondrial function and protects against metabolic disease by activating SIRT1 and PGC-1α. Cell. 2006;127(6):1109–1122. | ||
Kelly DP, Scarpulla RC. Transcriptional regulatory circuits controlling mitochondrial biogenesis and function. Genes Dev. 2004;18(4):357–368. | ||
Lord C, Risi S, Lambrecht L, et al. The Autism Diagnostic Observation Schedule–generic: a standard measure of social and communication deficits associated with the spectrum of autism. J Autism Dev Disord. 2000;30(3):205–223. | ||
Lord C, Rutter M, Couteur AL. Autism diagnostic interview-revised: a revised version of a diagnostic interview for caregivers of individuals with possible pervasive developmental disorders. J Autism Dev Disord. 1994;24(5):659–685. | ||
Fornasari L, Chittaro L, Ieronutti L, et al. Navigation and exploration of an urban virtual environment by children with autism spectrum disorder compared to children with typical development. Res Autism Spectr Disord. 2013;7(8):956–965. | ||
Huang CH, Chen MY, Tsai MT, Chen CH. Elevated adrenomedullin mRNA in lymphoblastoid cells from schizophrenic patients. Neuroreport. 2004;15(9):1443–1446. | ||
Oh JH, Kim YJ, Moon S, et al. Genotype instability during long-term subculture of lymphoblastoid cell lines. J Hum Genet. 2012;58(1):16–20. | ||
Rokhlin OW, Glover RA, Taghiyev AF, et al. Bisindolylmaleimide IX facilitates tumor necrosis factor receptor family-mediated cell death and acts as an inhibitor of transcription. J Biol Chem. 2002;277(36):33213–33219. | ||
Monsalve M, Wu Z, Adelmant G, Puigserver P, Fan M, Spiegelman BM. Direct coupling of transcription and mRNA processing through the thermogenic coactivator PGC-1. Mol Cell. 2000;6(2):307–316. | ||
Ahamad MS, Siddiqui S, Jafri A, Ahmad S, Afzal M, Arshad M. Induction of apoptosis and antiproliferative activity of naringenin in human epidermoid carcinoma cell through ROS generation and cell cycle arrest. PLoS One. 2014;9(10):1276–1279. | ||
Yang X, Yang S, Chai H, et al. A novel isoquinoline derivative anticancer agent and its targeted delivery to tumor cells using transferrin-conjugated liposomes. PLoS One. 2015;10(8):e0136649. | ||
Cai J, Niu X, Chen Y, et al. Emodin-induced generation of reactive oxygen species inhibits RhoA activation to sensitize gastric carcinoma cells to anoikis. Neoplasia. 2008;10(1):41–51. | ||
Haas RH, Nasirian F, Nakano K, et al. Low platelet mitochondrial complex I and complex II/III activity in early untreated Parkinson’s disease. Ann Neurol. 1995;37(6):714–722. | ||
Pramanik KC, Boreddy SR, Srivastava SK. Role of mitochondrial electron transport chain complexes in capsaicin mediated oxidative stress leading to apoptosis in pancreatic cancer cells. PLoS One. 2012;6(5):1573–1574. | ||
Zanotto-Filho A, Braganhol E, Battastini AMO, Moreira JCF. Proteasome inhibitor MG132 induces selective apoptosis in glioblastoma cells through inhibition of PI3K/Akt and NFkappaB pathways, mitochondrial dysfunction, and activation of p38-JNK1/2 signaling. Invest New Drugs. 2012;30(6):2252–2262. | ||
Neitzel H. A routine method for the establishment of permanent growing lymphoblastoid cell lines. Hum Genet. 1986;73(4):320–326. | ||
Yang J, Liu X, Bhalla K, et al. Prevention of apoptosis by Bcl-2: release of cytochrome c from mitochondria blocked. Science. 1997;275(5303):1129–1132. | ||
Dejean LM, Ryu SY, Martinez-Caballero S, Teijido O, Peixoto PM, Kinnally KW. MAC and Bcl-2 family proteins conspire in a deadly plot. Biochim Biophys Acta. 2011;1797(6–7):1231–1238. | ||
Zhang R, Humphreys I, Sahu R, Shi Y, Srivastava S. In vitro and in vivo induction of apoptosis by capsaicin in pancreatic cancer cells is mediated through ROS generation and mitochondrial death pathway. Apoptosis. 2008;13(12):1465–1478. | ||
Sun L, Shukair S, Naik TJ, Moazed F, Ardehali H. Glucose phosphorylation and mitochondrial binding are required for the protective effects of hexokinases I and II. Mol Cell Biol. 2008;28(3):1007–1017. | ||
Josey BJ, Inks ES, Wen X, Chou CJ. Structure-activity relationship study of vitamin k derivatives yields highly potent neuroprotective agents. J Med Chem. 2013;56(3):1007–1022. | ||
Sudheesh NP, Ajith TA, Janardhanan KK. Ganoderma lucidum ameliorate mitochondrial damage in isoproterenol-induced myocardial infarction in rats by enhancing the activities of TCA cycle enzymes and respiratory chain complexes. Int J Cardiol. 2013;165(1):117–125. | ||
Keller F, Persico AM. The neurobiological context of autism. Mol Neurobiol. 2003;28(1):1–22. | ||
Beaudet AL. Is medical genetics neglecting epigenetics? Genet Med. 2002;4(5):399–402. | ||
Stubbs G, Litt M, Lis E, et al. Adenosine deaminase activity decreased in autism. J Am Acad Child Psychiatry. 1982;21(1):71–74. | ||
Alrubaye F, Morad T. Purine metabolism and oxidative stress in children with autistic spectrum disorders. J Exp Integr Med. 2013;3(4):293–297. | ||
Tang G, Gutierrez RP, Kuo SH, et al. Mitochondrial abnormalities in temporal lobe of autistic brain. Neurobiol Dis. 2013;54(6):349–361. | ||
Chauhan A, Chauhan V. Oxidative stress in autism. Pathophysiology. 2006;13(3):171–181. | ||
Xie W, Wan OW, Chung KKK. New insights into the role of mitochondrial dysfunction and protein aggregation in Parkinson’s disease. Biochim Biophys Acta. 2010;1802(11):935–941. | ||
Bubber P, Tang J, Haroutunian V, et al. Mitochondrial enzymes in schizophrenia. J Mol Neurosci. 2004;24(2):315–321. | ||
Wang X, Su B, Zheng L, Perry G, Smith MA, Zhu X. The role of abnormal mitochondrial dynamics in the pathogenesis of Alzheimer’s disease. J Neurochem. 2009;109 (Suppl 1):153–159. | ||
Haas RH. Autism and mitochondrial disease. Dev Disabil Res Rev. 2010;16(2):144–153. | ||
Gargus JJ, Imtiaz F. Mitochondrial energy-deficient endophenotype in Autism. Am J Biochem Biotechnol. 2008;4(2):198–207. | ||
Frye RE, Rossignol DA. Mitochondrial dysfunction can connect the diverse medical symptoms associated with autism spectrum disorders. Pediatr Res. 2011;69(2):41R–47R. | ||
James SJ, Rose SS, Melnyk S, et al. Cellular and mitochondrial glutathione redox imbalance in lymphoblastoid cells derived from children with autism. FASEB J. 2009;23(8):2374–2383. | ||
Main PA, Thomas P, Esterman A, Fenech MF. Necrosis is increased in lymphoblastoid cell lines from children with autism compared with their non-autistic siblings under conditions of oxidative and nitrosative stress. Mutagenesis. 2013;28(4):475–484. | ||
Douarre C, Sourbier C, Rosa ID, et al. Mitochondrial topoisomerase I is critical for mitochondrial integrity and cellular energy metabolism. PLoS One. 2012;7(7):e41094. | ||
Selivanov VA, Votyakova TV, Pivtoraiko VN, et al. Reactive oxygen species production by forward and reverse electron fluxes in the mitochondrial respiratory chain. PLoS Comput Biol. 2011;7(3):e1001115. | ||
Rossignol DA, Frye RE. Mitochondrial dysfunction in autism spectrum disorders: a systematic review and meta-analysis. Mol Psychiatry. 2012;17(3):290–314. | ||
Koopman WJ, Nijtmans LG, Dieteren CE, et al. Mammalian mitochondrial complex I: biogenesis, regulation, and reactive oxygen species generation. Antioxid Redox Signal. 2010;12(12):1431–1470. | ||
Chinta SJ, Andersen JK. Nitrosylation and nitration of mitochondrial complex I in Parkinson’s disease. Free Radic Res. 2011;45(1):53–58. | ||
Jacobson MD. Reactive oxygen species and programmed cell death. Trends Biochem Sci. 1996;21(3):83–86. | ||
Calabrese V, Lodi R, Tonon C, et al. Oxidative stress, mitochondrial dysfunction and cellular stress response in Friedreich’s ataxia. J Neurol Sci. 2005;233(1–2):145–162. | ||
Roberts RA, Laskin DL, Smith CV, et al. Nitrative and oxidative stress in toxicology and disease. Toxicol Sci. 2009;112(1):4–16. | ||
Garner DL, Thomas CA, Joerg HW, Dejarnette JM, Marshall CE. Fluorometric assessments of mitochondrial function and viability in cryopreserved bovine spermatozoa. Biol Reprod. 1997;57(6):1401–1406. | ||
Weng H, Tan ZJ, Hu YP, et al. Ursolic acid induces cell cycle arrest and apoptosis of gallbladder carcinoma cells. Cancer Cell Int. 2014;14(1):96. | ||
Michan S, Sinclair D. Sirtuins in mammals: insights into their biological function. Biochem J. 2007;404(1):1–13. | ||
Mudò G, Mäkelä J, Liberto VD, et al. Transgenic expression and activation of PGC-1α protect dopaminergic neurons in the MPTP mouse model of Parkinson’s disease. Cell Mol Life Sci. 2012;69(7):1153–1165. |
 © 2017 The Author(s). This work is published and licensed by Dove Medical Press Limited. The full terms of this license are available at https://www.dovepress.com/terms.php and incorporate the Creative Commons Attribution - Non Commercial (unported, v3.0) License.
By accessing the work you hereby accept the Terms. Non-commercial uses of the work are permitted without any further permission from Dove Medical Press Limited, provided the work is properly attributed. For permission for commercial use of this work, please see paragraphs 4.2 and 5 of our Terms.
© 2017 The Author(s). This work is published and licensed by Dove Medical Press Limited. The full terms of this license are available at https://www.dovepress.com/terms.php and incorporate the Creative Commons Attribution - Non Commercial (unported, v3.0) License.
By accessing the work you hereby accept the Terms. Non-commercial uses of the work are permitted without any further permission from Dove Medical Press Limited, provided the work is properly attributed. For permission for commercial use of this work, please see paragraphs 4.2 and 5 of our Terms.