")
Back to Journals » Journal of Inflammation Research » Volume 17
Role of Chemotaxis of Vδ2 T Cells to the Synovium in the Pathogenesis of Acute Gouty Arthritis
Authors Di H, Han X, Yin Y, Zhang Y, Zeng X
Received 22 November 2023
Accepted for publication 23 January 2024
Published 7 February 2024 Volume 2024:17 Pages 721—736
DOI https://doi.org/10.2147/JIR.S449329
Checked for plagiarism Yes
Review by Single anonymous peer review
Peer reviewer comments 2
Editor who approved publication: Professor Ning Quan
Hong Di,* Xinxin Han,* Yue Yin, Yun Zhang, Xuejun Zeng
Department of Family Medicine & Division of General Internal Medicine, Department of Medicine, Peking Union Medical College Hospital, Chinese Academy of Medical Sciences, State Key Laboratory of Complex Severe and Rare Diseases (Peking Union Medical College Hospital), Beijing, People’s Republic of China
*These authors contributed equally to this work
Correspondence: Yun Zhang; Xuejun Zeng, Department of Family Medicine & Division of General Internal Medicine, Department of Medicine, Peking Union Medical College Hospital, Chinese Academy of Medical Sciences, State Key Laboratory of Complex Severe and Rare Diseases (Peking Union Medical College Hospital), Beijing, 100730, People’s Republic of China, Tel/Fax +8610-69156098, Email [email protected]; [email protected]
Background: This study aimed to explore the potential roles of Vδ 2 T cells in the pathogenesis of acute gouty arthritis.
Methods: Patients with gout (n=86), rheumatoid arthritis (n=7), osteoarthritis (n=9), and healthy controls (n=40) were enrolled. γδT cell frequency, chemokine receptor expression and production of pro-inflammatory cytokines in cells from peripheral blood and synovial fluid samples were quantified by flow cytometry. The chemotaxis ability of Vδ 2 T cells was determined by transwell migration assay. The levels of chemokines were also detected by enzyme-linked immunosorbent assay.
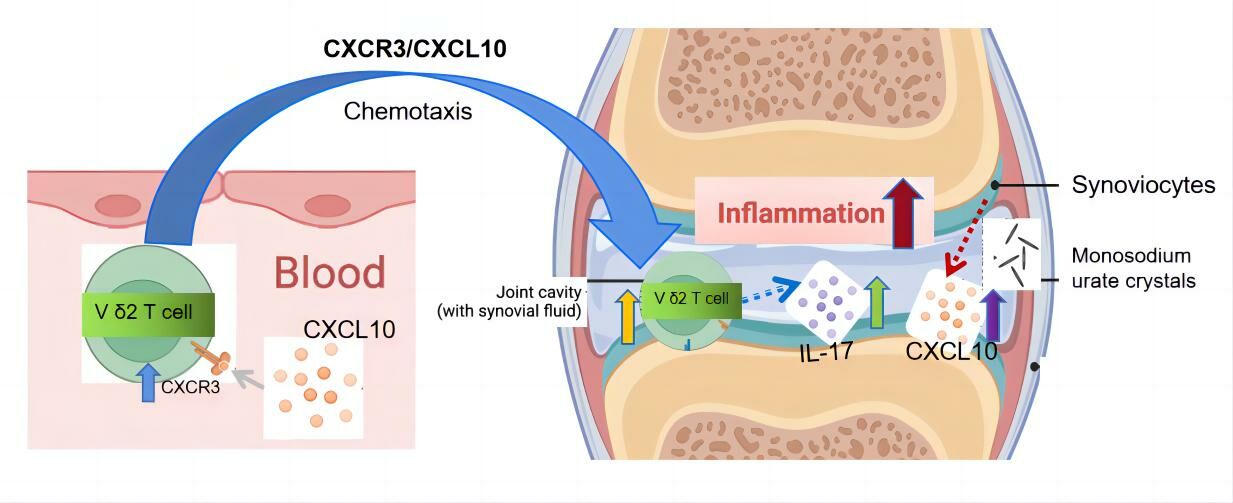
Results: Peripheral Vδ 2 T cells had significantly lower frequencies in acute gout patients than that in healthy controls (P< 0.001). These peripheral Vδ 2 T cells were negatively correlated with inflammatory markers. Vδ 2 T cells from acute gout patients accumulated in synovial fluid, as evidenced by a higher abundance of Vδ 2 T cells in it than that in the serum (P< 0.01). And Vδ 2 T cells expressed a high level of C-X-C chemokine receptor 3 (P=0.035), and its corresponding chemokine C-X-C motif chemokine ligand 10 showed a high concentration in synovial fluid (P< 0.05). Vδ 2 T cells from synovial fluid of acute gout patients produced a high level of interleukin-17 (P=0.033).
Conclusion: The up-regulated expression of C-X-C chemokine receptor 3 on Vδ 2 T cells potentially facilitates their infiltration into synovial fluid during acute gouty arthritis. Further production of interleukin-17 by Vδ 2 T cells may contribute to the pathogenesis of gout. This study sheds new light on developing novel Vδ 2 T cells-based therapeutic strategies for gout treatment.
Keywords: acute gouty arthritis, γδT cells, Vδ 2 T cells, Interleukin-17, CXCR3, CXCL10
Graphical Abstract:
Introduction
Gout, the most prevalent form of inflammatory arthritis, is caused by the deposition of monosodium urate (MSU) crystals in articular and non-articular structures.1 MSU crystals, a kind of damage-associated molecule, can stimulate innate immune pathways. Activation of the NOD-like receptor thermal protein domain associated protein 3 (NLRP3) inflammasome in macrophages and monocytes by MSU crystals is of particular relevance for the initiation of the gout flare, and neutrophils also play an important role in this process. Interleukin-1β (IL-1β) can lead to the subsequent release of various pro-inflammation cytokines and chemokines to prompt the progression of gout.2
Acute gouty inflammation is mediated mainly by the innate immune cells and corresponding cytokines.3 Innate immune cells are mainly composed of monocytes, macrophages, neutrophils, natural killer T-like (NKT-like) cells, γδT cells, and innate lymphoid cells (ILC). Among these, γδT cells are a subset of T cells with distinctive T cell receptor (TCR), which is composed of one γ chain and one δ chain. Differed by the chains expressed by γδT cells, two main subsets have been defined in human, namely Vγ9/Vδ2 and Vδ1.4 Vγ9/Vδ2 T cells are mainly distributed in peripheral blood and lymphatic system, and Vδ1 T cells are mainly distributed on epithelial and mucosal surfaces. In normal human peripheral blood, 70–90% of γδT cells are Vγ9/Vδ2 T cells, accounting for 1–5% of the total T cells.5 Different distributions of specific subsets of γδT cells are associated with distinct immunological functions.6 It is well established that these cells play regulatory roles in many physiological and pathological processes, such as diabetes, rheumatoid arthritis (RA),7 psoriatic arthritis (PsA),8 multiple sclerosis and anxiety.9 γδT cells are recognized for their robust anti-tumor functions, and also play a protective role during successful pregnancies through the regulation of several cytokines.10–12 In patients with RA, Vδ2 T cells exhibit heightened chemotaxis potential and express elevated levels of chemokine receptors C-C chemokine receptor 5 (CCR5) and C-X-C chemokine receptor 3 (CXCR3), which potentially facilitate the infiltration of Vδ2 T cells into the synovium and contributed to the disease progression of RA.7
Interleukin-17 (IL-17) is an effective proinflammatory cytokine, and its elevated level was found harmful in autoimmune diseases and cancer.13 IL-17 attracts neutrophils that induce inflammation, stimulates formation of bone-resorbing osteoclasts, and augments cytokine and enzyme production from joint resident cells.14–16 Over the years, more cell types, including Th17 cells, mast cells, neutrophils, cluster of differentiation (CD) 8+ cells and γδT cells, have been found to be able to produce IL-17.17–19 The levels of serum IL-17 elevated in patients with acute gouty arthritis (AGA), and γδT cells are one of the major sources of IL-17 in serum of patients with AGA.3 Similarly, several recent studies have demonstrated that IL-17-producing γδT-helper 17 (γδ Th17) cells are a major innate cellular source of IL-17 in collagen-induced arthritis (CIA) models.20,21 Moreover, it has been confirmed that Vδ2 T cells from RA could infiltrated into the synovium from peripheral blood and played crucial roles in the pathogenesis of RA.7 However, whether and how the IL-17-producing γδT cells contribute to the disease progression of AGA has not been intensively elucidated so far.
Nowadays, the main managements of acute gouty arthritis are pain control and uric acid lowering.1,22,23 For gout patients, it is important to take anti-inflammatory drugs timely and use uric acid-lowering drugs regularly. Recently, several studies have newly found that both anti-inflammatory drugs (such as ibuprofen) and 5-aminoorotic acid could serve as new inhibitors to xanthine oxidase.24,25 However, over the past few decades, the progress in drug research to treat gout was slow. Moreover, the traditional treatment mainly focuses on the control of the clinical manifestation – high level of inflammation, but pays little attention to the immune disorders related to the pathogenesis of AGA. Therefore, it is of great interest to explore the mechanism of immune cell disorder associated with AGA, which may be act as a potential therapeutic target. In recent study, the differences in peripheral T cell populations have been shown to be associated with the development of Mediterranean fever, chronic granulomas disease and gout. As a result, peripheral T cells, such as γδT cells, may be a potential target for the treatment of gout.26
This study investigated the abundance of innate immune cells, especially γδT cells, in peripheral blood and synovial fluid (SF) from patients with gout and explored their possible connections with the development of gout.
Materials and Methods
Patients and Samples
In this retrospective study, a total of 86 gout patients’ samples (including 49 acute gouty arthritis patients’ samples, 11 remission period of gout patients’ samples, and 26 intercritical period of gout patients’ samples), 7 rheumatoid arthritis patients’ samples, 9 osteoarthritis (OA) patients’ samples, and 40 healthy control subjects, were collected. Among them, SF was collected from acute gouty arthritis patients (n=18), rheumatoid arthritis patients (n=7) and osteoarthritis patients (n=9). All gout patients were male and were either hospital inpatients or clinical attendees at the Peking Union Medical College Hospital (PUMCH) between December 2019 and April 2022. All patients met the 1977 American Rheumatism Association Preliminary gout classification criteria27 as well as the 2015 American College of Rheumatology/European League Against Rheumatism gout classification criteria.28 Patients with infections, tumors, and other immune diseases were excluded. Acute gouty arthritis, also called gout flare, was defined as a clinically evident episode of acute inflammation induced by MSU crystals and characterized as joint pain, swelling, erythema and tenderness. Remission period was defined as the period of alleviation or absence of clinically evident inflammation after episodes of acute flare. Intercritical period was defined as the asymptomatic period after or between gout flares, despite the persistence of MSU crystals.29,30 Healthy controls (HCs) were defined as gout-free male subjects with no other arthritis-related diseases, and controls were age and sex matched with the gout patients. Peripheral blood samples were collected from patients after overnight fasting during different gout periods and from HCs. SF samples from patients were obtained from arthrocentesis. Written informed consent was obtained from all participants. This study was approved by the Ethics Committee of PUMCH (ethics approval number JS-2339) and conducted in accordance with the clinical guidelines of the 1975 Declaration of Helsinki.
Clinical and Laboratory Examinations
The clinical characteristics of patients with AGA, OA, RA and healthy controls are summarized in Tables 1 and 2.
 |
Table 1 Clinical Characteristics of Gout Patients and Healthy Controls |
 |
Table 2 Clinical Characteristics of RA and OA Patients |
Flow Cytometry
Peripheral blood mononuclear cells (PBMCs) and synovial fluid mononuclear cells (SFMCs) from gout patients and HCs were isolated using Ficoll gradient centrifugation (Dakewe, Beijing, China).31 Subsequently, these cells were used for flow cytometry analysis. Fluorescein isothiocyanate (FITC)-conjugated anti-human CD14, phycoerythrin (PE)-conjugated anti-human CD16, allophycocyanine (APC)-conjugated anti-human CD192 (CCR2), PE-conjugated anti-human CD294 (CRTH2), APC-conjugated anti-human CD127 (IL-7Rα), peridinin-chlorophyll-protein/cyanine5.5 (PerCP/Cy5.5) – conjugated anti-human CD117 (c-kit), FITC-conjugated anti-human Lineage Cocktail (CD3, CD14, CD19, CD20, CD56), PerCP/Cy5.5-conjugated anti-human CD3, APC-conjugated anti-human CD57, PerCP-conjugated anti-human CD8, PE/Cy7-conjugated anti-human CD56 (NCAM), FITC-conjugated anti-human CD3, PE-conjugated anti-human TCR γ/δ, APC anti-human TCR Vδ2, PerCP/Cy5.5-conjugated anti-human CD3, FITC-conjugated anti-human TCR Vδ2, APC-conjugated anti-human IL-1β, APC-conjugated anti-human IL-17, APC-conjugated anti-human tumor necrosis factor (TNF) -α, APC-conjugated anti-human interferon (IFN) -γ, PE/Cy7-conjugated anti-human C-X-C chemokine receptor 3 (CXCR3), and APC/Fire 750-conjugated anti-human C-C chemokine receptor 5 (CCR5) antibodies were purchased from BD Biosciences (Franklin Lakes, NJ, USA). PerCP/Cy5.5-conjugated anti-human TCR Vδ1 was purchased from Thermo Fisher Scientific (Waltham, MA, USA). γδT cells were defined as CD3+ TCRγ/δ+; Vδ1 T cells were defined as CD3+ TCR Vδ1+ TCR Vδ2-; Vδ2 T cells were defined as CD3+ TCR Vδ1- TCR Vδ2+; innate lymphoid cells were defined as CD127+Lineage-; natural killer T-like cells were defined as CD3+CD56+; monocytes were defined as CD14++ CD16- CCR2+ or CD14+ CD16+ CCR2+ or CD14+ CD16++ CCR2-.
For the staining of surface markers, PBMCs and SFMCs were rinsed with phosphate buffered saline (PBS) (Solarbio, Beijing, China) containing 1% bovine serum albumin (BSA) (Solarbio) and were incubated in various combinations of monoclonal antibodies (mAbs) for 30 minutes at 4°C. Then, the cells were washed and suspended in PBS. The stained cells were promptly analyzed using a Cytoflex Flow Cytometer (Beckman Coulter, CA, USA) or were fixed in 1% paraformaldehyde and analyzed within 24 hours. Data analysis was performed using FlowJo V10.8.1 Software (BD Biosciences).
For the detection of IFN -γ, TNF-α, IL-1β and IL-17 in Vδ2 T cells, the cells were pre-treated with Leukocyte Activation Cocktail (1 μL/mL) for 4 hours at 37°C in 5% CO2. Then, the cells were washed twice with PBS containing 1% BSA and stained for surface markers of CD3 and Vδ2. After washing twice with PBS containing 1% BSA, the cells were fixed and permeabilized using BD Cytofix/Cytoperm solution (BD Biosciences). The cells were then washed with permeabilization solution before staining with anti-human IFN-γ, TNF-α, IL-1β and IL-17 antibodies (BioLegend, San Diego, CA, USA). The cells were incubated at 4°C in the dark for 30 minutes, then washed twice with permeabilization solution before analysis using a Cytoflex Flow Cytometer (Beckman Coulter). Data analysis was performed using FlowJo V10.8.1 Software (BD Biosciences).
Cytokine Detection
Venous blood samples were collected into tubes containing separating gel and centrifuged at 4000 g at 4°C for 20 minutes to isolate the serum. The synovial fluids were centrifuged at 1800g at 4°C for 10 minutes to obtain the supernatant for analysis. The cytokine detection reagents were provided by Jiangxi Saiji Biotechnology Limited company (calibrator lot number: 20220101; Jiangxi, China). Ten cytokines, including interleukin (IL) −1, IL-2, IL-4, IL-5, IL-10, IL-12, IL-17, TNF-α, IFN-α and IFN-γ, were detected by multiple microsphere flow immuno-fluorescence according to the manufacturer’s instructions. Fluorescent detection of the microsphere mixture was performed on a calibrated CytoFLEX Flow Cytometer (Beckman Coulter) for each sample in sequence. Data analysis was performed using FlowJo V10.8.1 Software (BD Biosciences).
Enzyme-Linked Immunosorbent Assay (ELISA)
The concentrations of C-X-C motif chemokine ligand (CXCL) 9, CXCL10, CXCL11, C-C motif chemokine ligand (CCL) 3, CCL4 and CCL5 in SFs and serum were analyzed by ELISA kits (Multisciences Biotech, Hangzhou, China) according to the manufacturer’s instructions (Supplementary Materials: Methods). Briefly, for each test, a 96-well polystyrene microplate was used, and each well was pre-coated with monoclonal antibody specific for each cytokine. After incubation with samples, each well was added the detection antibody that can bind to the immobilized target protein. After washing away excess detection antibody and addition of horseradish peroxidase (HRP) conjugate, HRP substrate was added to wells for indirect detection of bound protein. The optical density (OD) was measured within 30 minutes after final washing, using a microplate reader set to 450 nm or 630 nm.
Transwell Chemotaxis Assay
Chemoattractant activity was assessed in a 24-well transwell or cell culture dish with 5μm-pore-size polycarbonate filters (Corning, NY, USA). PBMCs were resuspended in RPMI 1640 (Solarbio, Beijing, China), supplemented with 1% BSA and 1×10⁶ PBMCs in 0.1 mL of the resuspension medium were added to the upper compartment of each chamber. Then, 0.6 mL of SFs or serum from AGA, RA, or OA patients were added to the lower compartment. After a 24 hours incubation at 37°C under 5% CO2 atmosphere, cells were harvested from the lower chambers, γδT cell subsets that migrated to the lower chambers were counted by flow cytometry.
Statistical Analysis
The SPSS software version 23.0 (IBM Corp., Armonk, New York, US) and GraphPad Prism version 9 (GraphPad Software, Inc.; San Diego, California, US) were used for statistical analysis. Normally distributed data were judged using the Shapiro–Wilk method. The Levene method was used to test homogeneity of variance. Two sets of data that met normal distribution and homogeneity of variance were analyzed using Student’s t-test. Multi-group comparisons of means were carried out by a one-way analysis of variance (ANOVA) test. Data that did not meet homogeneity of variance or normal distribution were compared using Kruskal–Wallis and Mann–Whitney non-parametric tests. P-values <0.05 were considered statistically significant.
Results
Patients with Acute Gouty Arthritis Have a Low Percentage of Vδ2 T Cells in Peripheral Blood
We assessed the frequency of γδT cells and their sub-types among HCs and AGA patients, and the gating strategy is showed in (Figure 1A). The results revealed a significant reduction in the proportion of peripheral total γδT cells among lymphocytes in the AGA group (the absolute numbers of cells/mL were shown in Table 1) [AGA vs HC, 2.14% (1.49–3.08%) vs 3.13% (1.89–3.85%); P=0.026] (Figure 1B, Table 3). This decrease was due to the significant reduction in percentage of peripheral Vδ2 T cells [AGA vs HC, 30.40% (16.83–54.13%) vs 66.05% (57.45–78.93%); P<0.001], while the percentages of Vδ1 T cells in peripheral blood were similar between the two groups (P=0.2) (Figure 1C, Table 3). These findings are consistent with those of RA.7 No significant disparity in peripheral abundance between the AGA and HC groups was observed for the other three types of innate immune cells, including monocytes, ILCs and NKT-like cells (Figure S1). The percentages of peripheral Vδ2 T cells in the AGA group were negatively correlated with the level of C-reactive protein (CRP), erythrocyte sedimentation rate (ESR) and neutrophil counts (P=0.037, 0.034, 0.011 respectively) (Figure 1D). No obvious correlation was observed between the percentages of total γδT cells or Vδ1 T cells and the inflammation-related indicators (Figure S2).
 |
Table 3 The Proportions of γδT Cells and Their Subtypes in Gout Patients and Healthy Controls |
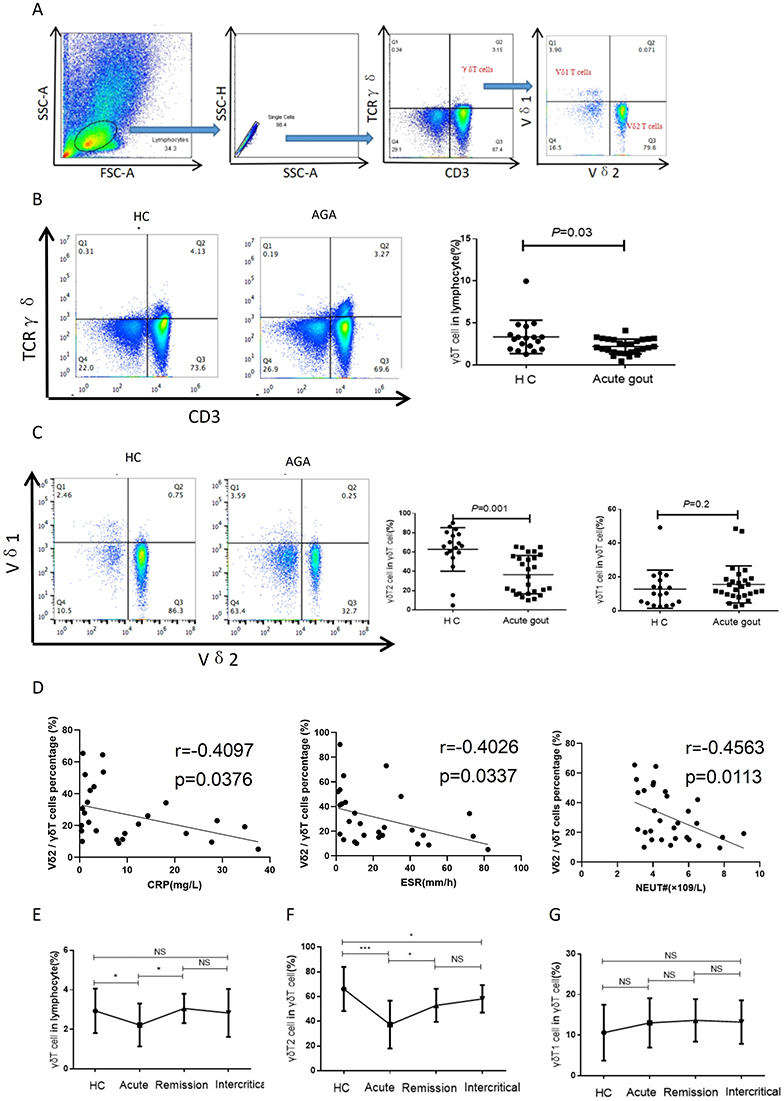 |
Figure 1 Patients with AGA had low levels of peripheral Vδ2 T cells. (A) Illustrated in this figure are representative scatter plots delineating the gating strategy employed for the detection of γδ T cells, Vδ1 T cells, and Vδ2 T cells. Lymphocytes are identified by their forward scatter (FSC) and side scatter (SSC) characteristics, with single cells isolated based on side scatter area (SSC-A) and side scatter height (SSC-H) parameters. Subsequent gating is conducted for γδ T cells using CD3 and TCR γδ markers, and for Vδ1 and Vδ2 T cells using Vδ1 and Vδ2 markers, respectively. (B-C) Peripheral blood mononuclear cells derived from HCs and patients with AGA were subjected to staining with anti-CD3, anti-γδ TCR, anti-Vδ1 or anti-Vδ2 monoclonal antibodies (mAbs) for subsequent flow cytometry analysis. The left panels show representative flow cytometry profiles of γδ T cells (B), and Vδ1 T cells and Vδ2 T cells (C). The right panels show bar graphs of the percentage of the respective cell populations. The sample size consists of n=18 for the HC group, and n=27 for the AGA group. (D) The percentage of peripheral Vδ2 T cells in AGA shows a negative correlation with the concentration of CRP, value of ESR and the count of neutrophils (n=21). (E-G) Depicted herein are alternations in the percentages of γδ T cells, Vδ2 T cells and Vδ1 T cells across HCs and different stages of gout. Data from HC (n=18), acute period (n=27), remission period (n=11) and intercritical period (n=26) are shown. Results are expressed as mean±SEM. ns, no significance; *P<0.05, and ***P<0.001 signify significance as determined through two-tailed unpaired t-test. Correlations are calculated using Spearman correlation analysis. Abbreviations: FSC, forward scatter; SSC, side scatter; SSC-A, side scatter area; SSC-H, side scatter height; mAbs, monoclonal antibodies; NEUT, neutrophils; CRP, C reactive protein; ESR, erythrocyte sedimentation rate; HC, healthy control; AGA, acute gouty arthritis; TCR, T cell receptor. |
Compared to healthy controls, the patients with AGA had a significant reduction in the proportion of peripheral total γδT cells (P<0.05), while the patients with remission gout showed a significant increase in the percentage of total γδT cells in comparison to the those with AGA [Remission vs Acute, 2.89% (2.52%–3.34%) vs 2.14% (1.49%–3.08%); P=0.016] (Figure 1E, Table 3). The trend in the variations of peripheral Vδ2 T cell percentages mirrored that of total γδT cells (P<0.001; P=0.016, respectively) (Figure 1F, Table 3), while no significant difference was observed in the percentage of Vδ1 T cells among different disease stage groups (Figure 1G, Table 3).
Vδ2 T Cells Accumulate in Synovial Fluid of Patients with AGA
A previous study showed the accumulation of γδT cells in RA synovial effusions.32 The percentage of γδT cells in lymphocytes from SFMC of AGA patients was notably higher than that from patients with OA (P<0.001) (Figure 2A). In addition, we further examined the percentages of Vδ1 T cells and Vδ2 T cells within the total γδT cell population, and observed a significant increase in Vδ2 T cells (P<0.01), but not in Vδ1 T cells (P>0.05) (Figure 2B). We subsequently explored whether a correlation existed between the quantities of γδT cells in gout PBMC and SFMC. Our findings indicated that the percentage of γδT cells in lymphocytes from SFMC appeared slightly higher compared to that from PBMC of the same gout patients, though this difference was not statistically significant (Figure 2C). Moreover, the results showed a marked increase in the proportion of Vδ2 T cells in total γδT cells from SFMC, in comparison to those from PBMC [SFMC vs PBMC, 49.01% (45.1–56.53%) vs 23.58% (11.99–29.7%); P=0.001] (Figure 2D). Conversely, there was no significant difference in the percentages of Vδ1 T cells between gout SFMC and PBMC (Figure 2D). These findings provide evidence that Vδ2 T cells in AGA patients could migrate from peripheral blood to synovial fluid.
 |
Figure 2 Vδ2 T cells accumulated in gout synovial fluid. (A and B) The proportions of γδ T cells within the lymphocytes subset (A) and the ratios of Vδ2 T cells and Vδ1 T cells among the total γδ T cells populations (B) were quantified through flow cytometry analyses for OA-SFMC samples (n=9) and AGA-SFMC samples (n=9). Representative flow profiles are shown and the percentages were summarized. (C and D) The left panels show representative flow profiles of γδ T cells (C), Vδ1 T cells and Vδ2 T cells (D) derived from both PBMC, and SFMC from patients with gout (n=8). The right panels show bar graphs of the percentage of corresponding cells within the indicated populations. Results are expressed as mean±SEM. ns, no significance; **P<0.01, and ***P<0.001 signify significance as determined through two-tailed paired t-test. Abbreviations: TCR, T cell receptor; PBMC, peripheral blood mononuclear cell; SFMC, synovial fluid mononuclear cell; OA, osteoarthritis. |
CXCR3 and CXCL10 Potentially Drive the Chemotaxis of Vδ2 T Cells to the Synovial Fluid of Patients with AGA
Gout SF, analogous to RA SF (utilized as a positive control for chemotaxis), significantly promoted the recruitment of γδT cells (both Vδ1 T cells and Vδ2 T cells, more remarkable for Vδ2 T cells) from AGA patients, as compared to both OA SF (used as a negative control) and gout serum (Figure 3A). These results suggested the migration of Vδ2 T cells into the synovial fluid during the disease progression of gout.
 |
Figure 3 CXCR3 and CXCL10 may be associated with the chemotaxis of Vδ2 T cell in AGA. (A) Transwell migration assay demonstrated a pronounced capacity of chemotaxis in Vδ2 T cells isolated from AGA patients. Data were pooled from three independent experiments. (B) Comparison of the proportion of CXCR3-positive cells in Vδ2 T cells from HCs and AGA patients. (C) Comparison of the proportion of CXCR3-positive cells in Vδ2 T cells and Vδ1 T cells from AGA patients. (D) Comparison of the proportion of CCR5-positive cells in Vδ2 T cells from HCs and AGA patients. Data of HC (n=8) and AGA (n=10) are shown. (E and F) The concentrations of established ligands of CXCR3 and CCR5 were quantified within SF of gout patients (n=18), RA patients (n=7), OA patients (n=7), and serum of gout patients (n=49). Results are expressed as mean±SEM. *P<0.05, **P<0.01, and ***P<0.001 signify significance as determined through the Mann–Whitney U-test (A and E) and two-tailed unpaired t-test (B–D). Abbreviations: AGA, acute gouty arthritis; HC, healthy control; OA, osteoarthritis; RA, rheumatoid arthritis; SF, synovial fluid; CXCR 3, C-X-C chemokine receptor 3; CCR5, C-C chemokine receptor. |
The recruitment of leucocytes to specific target tissues is regulated by chemokines and their corresponding receptors.33 Considering that the previous study had showed higher expressions of CCR5 and CXCR3 on Vδ2 T cells in RA patients compared to OA patients and HCs,7 we compared the expressions of CCR5 and CXCR3 on Vδ2 T cells derived from AGA patients and HCs. However, we found a notable increase in CXCR3 expression on Vδ2 T cells from AGA patients (P=0.0005, Figure 3B) along with a comparable expression of CXCR5 (Figure 3D), when compared with those from HCs. Additionally, Vδ2 T cells from AGA patients showed a higher expression of CXCR3 compared to Vδ1 T cells from AGA patients (P=0.0014, Figure 3C). Subsequently, we quantified the concentrations of various chemokines (ligands of CXCR3 or CCR5) in SF and serum samples from patients with AGA, employing SF samples from RA patients and OA patients as controls for comparison. We found that CXCL10 was the sole chemokine displaying a significantly heightened concentration within gout SF, when compared to its concentration in gout serum (P<0.05, Figure 3E and F). The cut-off values of different ELISA kits were showed in Table 4.34 Collectively, these findings indicated that the up-regulation of CXCR3 on Vδ2 T cells in AGA patients, in combination with a higher level of its ligand CXCL10 in SF environment, may work cooperatively to promote the recruitment of Vδ2 T cells to the affected joints in patients with AGA.
 |
Table 4 The Cut-off Values of Different ELISA Kits |
Vδ2 T Cells from Patients with AGA Produce Aberrantly High Levels of IL-17
Vδ2 T cells exhibit highly cytotoxic activity and produce proinflammatory cytokines, including IFN-γ, TNF-α, IL-1β and IL-17.10,32 Initially, we found a higher proportion of IL-17-producingVδ2 T cells relative to total Vδ2 T cells in AGA patients compared to HCs (P=0.004, Figure 4A). However, no significant difference was observed in the proportions of TNF-α+, IFN-γ+ and IL-1β+ Vδ2 T cells between blood samples from HCs and patients with AGA (Figure S3). Subsequently, we quantified diverse cytokine levels in SF samples from AGA patients as well as serum samples from both AGA patients and HCs. In comparison to serum samples from HCs, those from AGA patients exhibited a minor and non-significant elevation in IL-17 concentrations; while compared to AGA serum samples, AGA SF samples revealed significantly elevated IL-17 concentration (AGA SF vs AGA serum, 33.92±20.76 (pg/mL) vs 12.4±4.97 (pg/mL); P=0.033) (Figure 4B). Furthermore, higher concentrations of IL-2, IL-4, IL-10, TNF-α, IFN-γ, IL-1 and IL-12 were discerned in AGA SF samples compared to AGA serum (Figure 4B). To elucidate further the role of Vδ2 T cells in the increased IL-17 secretion within gout SF, we separately quantified both the proportion of IL-17-producing Vδ2 T cells relative to total Vδ2 T cells and IL-17-producing Th17 cells relative to Th17 cells within gout SF and AGA peripheral blood by intracellular staining. The results heightened a higher proportion of IL-17-producing Vδ2 T cells within gout SFMC compared to PBMC (P=0.008, Figure 4C). In contrast, no significant difference was observed in the proportion of IL-17-producing cells among Th17 cells from gout SFMC and PBMC (Figure 4D). These findings suggest that Vδ2 T cells from AGA patients can excessively secrete elevated levels of IL-17, potentially contributing to the pathogenesis of AGA.
 |
Figure 4 Vδ2 T cells in patients with AGA secreted high levels of IL-17. (A) Flow cytometry analyses were conducted to assess intracellular IL-17 staining in Vδ2 T cells sourced from peripheral blood samples of both HCs and AGA patients. The right panels show the percentage of positively stained cells among Vδ2 T cells. Data of HCs (n=7) and AGA (n=9) are shown. (B) Statistical graph showed the levels of various types of cytokines in gout SF (n=6), serum from patients with AGA (n=7) and serum from HCs (n=7). (C and D) Flow cytometry analyses of the intracellular staining of IL-17 in Vδ2 T cells (C) and in Th17 cells (D) of PBMC and SFMC from patients with gout were performed. The right panels show the percentage of positively stained cells among the indicated populations. Data of both groups (n=8) are shown. Results are expressed as mean±SEM. ns, no significance; *P<0.05, **P<0.01, and ***P<0.001 signify significance as determined through by two-tailed unpaired t-test. Abbreviations: FSC, forward scattering; PBMC, peripheral blood mononuclear cell; SFMC, synovial fluid mononuclear cell; IFN-α, interferon-α; IFN-γ, interferon-γ; IL-1β, interleukin-1β; IL-2, interleukin-2; IL-4, interleukin-4; IL-5, interleukin-5; IL-10, interleukin-10; IL-12, interleukin-12; IL-17, interleukin-17; TNF-α, tumor necrosis factor-α. |
Discussion
γδT cells, contributing a minority of the total human circulating T-cell pool, are associated with other immune cells and have potential regulatory roles in various diseases, such as infection, autoimmunity, cancer and other diseases.10 In our study, we initially observed a markedly diminished proportion of peripheral γδT cells, predominantly the Vδ2 T cell subset, among patients with AGA. This phenomenon could potentially arise from their substantial accumulation within synovial tissues, rather than being attributed to aberrant cellular apoptosis or compromised proliferative capacity. This trend resonates with analogous observations in the context of RA,7 chronic inflammatory bowel disease35 and chronic human immunodeficiency virus (HIV) infection.36 Since no significant difference in population abundance was observed in monocytes, NKT-like cells, nor ILC between AGA patients and HCs, Vδ2 T cells seem to represent a previously unrecognized innate immune cell subset that undergoes modulation during the progression of gout. Consequently, we conducted further comparisons of γδT cell proportions across varying gout stages. The proportion of total γδT cells and Vδ2 T cells in peripheral blood decreased during the acute stage of gout, while increased during the remission stage, indicating that γδT cells, notably Vδ2 T cells, were involved in acute gouty inflammation. Significantly, during the intermittent phase, the proportion of γδT cells surged to a level insignificantly different from that of HCs, although the proportion of Vδ2 T cells remained below that of HCs. It is speculated that Vδ2 T cells may have played a certain role in the development of acute gouty arthritis into chronic gouty arthritis (CGA). In line with our observations, Vδ2 T cells represent the predominant sub-populations within γδT cells in chronic arthritis diseases including RA,7 psoriatic arthritis,37 and ankylosing spondylitis,38 actively participating in the occurrence and progression of these diseases. Collectively, our findings propose that gout disrupts equilibrium within circulating γδT-cell subsets, characterized by a specific depletion of circulating Vδ2 T cells, and targeting Vδ2 T cells might be a promising approach to treat gout.
Chemokine receptors are expressed in various types of cells and interact with chemokines to promote homing of cells to target tissues.33 Chemokines are implicated in a wide range of diseases with prominent inflammatory components. For instance, elevated levels of C-C chemokines, particularly CCL2, CCL3, and CCL5, within the joints of RA patients coincide with the recruitment of monocytes and T cells into synovial tissues.39 In context of asthma, the chemokine CCL11 (eotaxin) and its receptor, CCR3, contribute to the recruitment of eosinophils to the pulmonary environment. Furthermore, CXCR3 has also been implicated in the recruitment of T cells to inflamed skin.40 Considering the analogous phenomenon observed in γδT cells in both gout and RA, our focus shifted to the investigation of two specific chemokine receptors: CXCR3 and CCR5, which exhibited elevated expression in Vδ2 T cells in RA.7 However, we found that only CXCR3, which characterizes subsets of T cells associated with certain inflammatory reactions,41 exhibited pronounced expression on Vδ2 T cells. Conversely, CCR5 demonstrated a slight elevation but not statistically significantly up-regulation on Vδ2 T cells of AGA patients. This difference might stem from the distinct pathogenic mechanisms underlying AGA and RA, especially the unique feature of MSU deposition in AGA that could contribute to the divergent observations on chemokine receptor expressions between AGA and RA patients.
CXCR3 is a receptor predominantly expressed on the surfaces of monocytes, T cells, NK cells, dendritic cells, and cancer cells. Additionally, we confirmed that the corresponding agonistic ligand CXCL10 was significantly elevated in SF of gout patients compared to their serum levels. This elevation presumably facilitates the migration of circulating Vδ2 T cells. CXCL-10 is mainly secreted by monocytes, endothelial cells, fibroblasts, mesenchymal stromal cell (MSC)42 and cancer cells in response to IFN-γ, which is synergistically enhanced by TNF-α. The activation of IFN-regulatory factor 3, toll-like receptors (TLR), retinoic acid-inducible gene (RIG)-I, and melanoma differentiation-associated gene (MDA)-5 synergistically collaborates with IFNs to induce CXCL10 induction.43,44 As we did not observe an augmented production of TNF-α and IFN-γ from peripheral blood Vδ2 T cells, it is likely that a multiple of mechanisms, rather than an autocrine-mediated feedback loop, contribute to the increased concentration of CXCL10 in synovial fluid during the onset of AGA. Furthermore, a prior investigation indicated that the accumulation of γδT cells, which represents an autoimmune response to infections or cancers, was regulated by CXCL9/CXCR3 axis-dependent mechanisms.45 This implies that different chemokines binding to CXCR3 can assume distinct roles across various diseases, although inflammation-associated immune responses are involved in all these diseases. Intriguingly, we noticed that CXCL11 and CCL5 had significantly higher levels in gout serum than in gout SF, and their roles in the pathogenesis of gout need further investigation in the future. Collectively, these findings suggest that the up-regulated CXCR3 expression on Vδ2 T cells in AGA potentially orchestrated with elevated chemokine CXCL10 to promote the migration of Vδ2 T cells to the synovial fluid.
Peripheral blood Vδ2 T cells from AGA patients exhibited a higher proportion of IL-17+ Vδ2 T cells than those from HCs. However, due to the decreased Vδ2 T cell count, the IL-17 level in AGA serum did not display a significant increase compared with that in serum from HCs. A previous study showed that serum IL-17 levels in AGA patients rise as early as 8 hours after an acute gout attack,3 yet our results show no significant difference in serum IL-17 levels between AGA patients and HCs. These disparate outcomes could stem from divergent criteria for study group inclusion or variations in the acute stages at the time of sample collection. Regrettably, the mechanisms behind enhanced IL-17 secretion in Vδ2 T cells remain unexplored in our study. Recent literature, however, has unveiled the participation of the IL-23/IL-17 axis in several inflammatory arthropathies, such as psoriasis, PsA and spondyloarthritis (SpA).46 It has been elucidated that Vδ2 T cells are able to generate IL-17-type cytokines dependent on IL-23/IL-23R signaling.47 Moreover, the expression of IL-23R on γδT cells in crystal-induced arthritis patients surpasses that in healthy controls,38 hinting that the augmented IL-17 secretion by Vδ2 T cells in AGA might also hinge on the IL-23/IL-17 axis, which is worthy refining in future studies. IL-17 alone is often poorly active, but it can synergize with other inflammatory cytokines such as TNF-α, IL-1β, IL-22, IFN-γ, and granulocyte-macrophage colony-stimulating factor (GM-CSF), fostering increased production of inflammatory mediators like IL-6 and IL-8.48–50 In line with this, SF samples from AGA patients showed significantly increased levels of IL-4, IL-10, TNF-α, IFN-γ, IL-1, and IL-12, in contrast to their serum sample. This suggests that the potential synergistic effects of IL-17 and other soluble factors might collectively contribute to the progression of AGA. Additionally, IL-17-producing γδT cells might prime αβT cells to produce IL-17, thus augmenting the function of Th17 cells, which helps establish a positive feedback loop to amplify the production of IL-17. In congruence with this hypothesis, our previous study suggested that gout patients with a lengthier disease duration and involvement of a large number of joints were more prone to exhibit elevated serum IL-17 levels.51 Hence, these collective findings indicated that AGA distorts the cytokine production in γδT cells directly, and IL-17-producing Vδ2 T cells might wield a pivotal role in the pathogenesis of gout.
The principle strength of our study lies in its pioneering exploration of the role of Vδ2 T cells in gout, especially in context of AGA. Furthermore, our study is grounded in translational research, thus facilitating the application of these findings in clinical diagnostics and treatment. However, our study is not without limitations. Initially, the precise functional contributions of Vδ2 T cells to the pathogenesis of acute gouty arthritis remain incompletely elucidated. Nevertheless, we have undertaken a comprehensive depiction of the dynamic shifts in Vδ2 T cell proportions within peripheral blood across distinct phases of gout. Furthermore, we have conducted experiments to investigate the underlying mechanisms driving these alterations and the functional role of Vδ2 T cells in this context. Subsequent investigations will delve deeper into uncovering the precise functional attributes of Vδ2 T cells in AGA. Additionally, we have not exhaustively examined the expression of all potential chemokines that could prompt the migration of Vδ2 T cells, owing to the challenges associated with procuring synovial fluid from gout patients within clinical practice. Nevertheless, we have validated the participation of the CXCR3/CXCL10 axis in the migration of Vδ2 T cells in AGA through the assessment of presumed chemokines and their corresponding receptors. The involvement of other chemokines will be subjected to further scrutiny in subsequent studies.
Conclusions
In summary, our study unveils that γδT cells, predominantly Vδ2 T cells, exhibit diminished presence in peripheral blood but accumulate within gout-affected joints during acute phases. Intriguingly, their levels exhibit a partial recovery toward normalcy during intermittent phases. Furthermore, Vδ2 T cells exhibit an escalation in the secretion of pro-inflammatory cytokines, notably IL-17, suggesting their potential involvement in the pathogenesis of AGA. The chemotactic migration of Vδ2 T cells towards gout patients’ synovial fluid is associated with the heightened expression of surface CXCR3 and the increased concentration of its ligand, CXCL10, within the synovial fluid. The elucidation of the roles played by Vδ2 T cells in gout not only advances our comprehension of the intricate pathogenic mechanisms underpinning gout but also promotes the exploration of novel avenues for developing promising therapeutics centered around Vδ2 T cells for the treatment of gout patients.
Abbreviations
AGA, acute gouty arthritis; IL-17, interleukin-17; MSU, monosodium urate; NLRP3, NOD-like receptor thermal protein domain associated protein 3; IL-1β, interleukin-1β; NKT-like cells, natural killer T-like cells; ILC, innate lymphoid cells; TCR, T cell receptor; RA, rheumatoid arthritis; PsA, psoriatic arthritis; γδ Th 17, γδT-helper 17; CIA, collagen-induced arthritis; SF, synovial fluid; HCs, healthy controls; PBMCs, peripheral blood mononuclear cells; SFMCs, synovial fluid mononuclear cells; FITC, fluorescein isothiocyanate; PE, phycoerythrin; APC, allophycocyanin; PerCP/Cy5.5, peridinin-chlorophyll-protein/cyanine5.5; PBS, phosphate buffered saline; BSA, bovine serum albumin; CD, cluster of differentiation; CXCR, C-X-C chemokine receptor; CCR, C-C chemokine receptor; IFN-γ, interferon-γ; TNF-α, tumor necrosis factor-α; HRP, horseradish peroxidase; OD, optical density; OA, osteoarthritis; CRP, C reactive protein; ESR, erythrocyte sedimentation rate; CXCL, C-X-C motif chemokine ligand; CCL, C-C motif chemokine ligand; MIP, macrophage inflammatory protein; MCP, monocyte chemoattractant protein; HIV, human immunodeficiency virus; CGA, Chronic gouty arthritis; MSC, mesenchymal stromal cell; TLR, toll-like receptors; RIG, retinoic acid-inducible gene; MDA, melanoma differentiation-associated gene; GM-CSF, granulocyte-macrophage colony-stimulating factor.
Data Sharing Statement
The corresponding author will, on request, detail the restrictions and any conditions under which access to some data may be provided.
Ethics Approval
This study complies with the Declaration of Helsinki, and human specimen experiments were approved by the Ethics Committee of Peking Union Medical College Hospital, with informed written consent provided by all participants (JS-2339).
Consent to Participate
Informed consent was obtained from all individual participants included in the study.
Acknowledgments
The authors extend their gratitude to all patients for their cooperation. Additionally, we wish to express our appreciation to Dr. Jiahuan Chen and Dr. Xiaoling Liu from State Key Laboratory of Common Mechanism Research for Major Disease, Institute of Basic Medical Sciences CAMS, School of Basic Medicine PUMC, for their invaluable guidance in the field of flow cytometry. The graphical abstract was Created using PowerPoint.
Funding
This work was supported by the National Natural Science Foundation of China (Grant No. 81901667 and 82071841) and National High Level Hospital Clinical Research Funding (2022-PUMCH-B-044).
Disclosure
The authors declare that they have no conflicts of interest.
References
1. Dalbeth N, Gosling AL, Gaffo A, Abhishek A. Gout. Lancet. 2021;397:1843–1855.
2. Dalbeth N, Choi HK, Joosten LAB, et al. Gout. Nat Rev Dis Primers. 2019;5:69. doi:10.1038/s41572-019-0115-y
3. Liu Y, Zhao Q, Yin Y, McNutt MA, Zhang T, Cao Y. Serum levels of IL-17 are elevated in patients with acute gouty arthritis. Biochem Biophys Res Commun. 2018;497(3):897–902. doi:10.1016/j.bbrc.2018.02.166
4. Morita CT, Verma S, Aparicio P, Martinez C, Spits H, Brenner MB. Functionally distinct subsets of human gamma/delta T cells. Eur J Immunol. 1991;21:2999–3007. doi:10.1002/eji.1830211215
5. Bonneville M, O’Brien RL, Born WK. Gammadelta T cell effector functions: a blend of innate programming and acquired plasticity. Nat Rev Immunol. 2010;10:467–478. doi:10.1038/nri2781
6. Latha TS, Reddy MC, Durbaka PV, Rachamallu A, Pallu R, Lomada D. gammadelta T cell-mediated immune responses in disease and therapy. Front Immunol. 2014;5:571. doi:10.3389/fimmu.2014.00571
7. Mo WX, Yin SS, Chen H, et al. Chemotaxis of Vdelta2 T cells to the joints contributes to the pathogenesis of rheumatoid arthritis. Ann Rheum Dis. 2017;76:2075–2084. doi:10.1136/annrheumdis-2016-211069
8. Nguyen CT, Furuya H, Das D, et al. Peripheral gammadelta T cells regulate neutrophil expansion and recruitment in experimental psoriatic arthritis. Arthritis Rheumatol. 2022;74:1524–1534. doi:10.1002/art.42124
9. Alves de lima K, Rustenhoven J, Da Mesquita S, et al. Meningeal gammadelta T cells regulate anxiety-like behavior via IL-17a signaling in neurons. Nat Immunol. 2020;21:1421–1429. doi:10.1038/s41590-020-0776-4
10. Lu H, Li DJ, Jin LP. gammadeltaT cells and related diseases. Am J Reprod Immunol. 2016;75:609–618. doi:10.1111/aji.12495
11. Li Y, Li G, Zhang J, Wu X, Chen X. The dual roles of human gammadelta T cells: anti-tumor or tumor-promoting. Front Immunol. 2020;11:619954. doi:10.3389/fimmu.2020.619954
12. Park JH, Lee HK. Function of gammadelta T cells in tumor immunology and their application to cancer therapy. Exp Mol Med. 2021;53:318–327. doi:10.1038/s12276-021-00576-0
13. Iwakura Y, Ishigame H, Saijo S, Nakae S. Functional specialization of interleukin-17 family members. Immunity. 2011;34:149–162. doi:10.1016/j.immuni.2011.02.012
14. Pelletier M, Maggi L, Micheletti A, et al. Evidence for a cross-talk between human neutrophils and Th17 cells. Blood. 2010;115:335–343. doi:10.1182/blood-2009-04-216085
15. van Hamburg JP, Asmawidjaja PS, Davelaar N, et al. Th17 cells, but not Th1 cells, from patients with early rheumatoid arthritis are potent inducers of matrix metalloproteinases and proinflammatory cytokines upon synovial fibroblast interaction, including autocrine interleukin-17A production. Arthritis Rheum. 2011;63:73–83. doi:10.1002/art.30093
16. Shigeru Kotake NT. IL-17 in synovial fluids from patients with rheumatoid arthritis is a potent stimulator of osteoclastogenesis. J Clin Invest. 1999;103:8.
17. Hueber AJ, Asquith DL, Miller AM, et al. Mast cells express IL-17A in rheumatoid arthritis synovium. J Immunol. 2010;184:3336–3340. doi:10.4049/jimmunol.0903566
18. Lin AM, Rubin CJ, Khandpur R, et al. Mast cells and neutrophils release IL-17 through extracellular trap formation in psoriasis. J Immunol. 2011;187:490–500. doi:10.4049/jimmunol.1100123
19. Sutton CE, Lalor SJ, Sweeney CM, Brereton CF, Lavelle EC, Mills KH. Interleukin-1 and IL-23 induce innate IL-17 production from gammadelta T cells, amplifying Th17 responses and autoimmunity. Immunity. 2009;31:331–341. doi:10.1016/j.immuni.2009.08.001
20. Yang X, Zhan N, Jin Y, et al. Tofacitinib restores the balance of gammadeltaTreg/gammadeltaT17 cells in rheumatoid arthritis by inhibiting the NLRP3 inflammasome. Theranostics. 2021;11:1446–1457. doi:10.7150/thno.47860
21. McKenzie DR, Kara EE, Bastow CR, et al. IL-17-producing gammadelta T cells switch migratory patterns between resting and activated states. Nat Commun. 2017;8:15632. doi:10.1038/ncomms15632
22. Shi C, Zhou Z, Chi X, et al. Recent advances in gout drugs. Eur J Med Chem. 2023;245. doi:10.1016/j.ejmech.2022.114890
23. Zeng X. Agents for the treatment of gout: current advances and future perspectives. J Med Chem. 2023;66:14474–14493. doi:10.1021/acs.jmedchem.3c01710
24. Bou-Salah L, Benarous K, Linani A, et al. Anti-inflammatory drugs as new inhibitors to xanthine oxidase: in vitro and in silico approach. Mol Cell Probes. 2021;58:101733. doi:10.1016/j.mcp.2021.101733
25. Todorov L, Saso L, Benarous K, et al. Synthesis, structure and impact of 5-aminoorotic acid and its complexes with Lanthanum(III) and Gallium(III) on the activity of xanthine oxidase. Molecules. 2021;26(15):4503. doi:10.3390/molecules26154503
26. Al B, Bruno M, Röring RJ, et al. Peripheral T cell populations are differentially affected in familial Mediterranean fever, chronic granulomatous disease, and gout. J Clin Immunol. 2023;43:2033–2048. doi:10.1007/s10875-023-01576-7
27. Wallace SL, Robinson H, Masi AT, Decker JL, McCarty DJ, Yü TF. Preliminary criteria for the classification of the acute arthritis of primary gout. Arthritis Rheum. 1977;20:895–900. doi:10.1002/art.1780200320
28. Neogi T, Jansen TLTA, Dalbeth N, et al. 2015 gout classification criteria: an American College Of Rheumatology/European League Against Rheumatism collaborative initiative. Arthritis Rheumatol. 2015;67:2557–2568. doi:10.1002/art.39254
29. Bursill D, Taylor WJ, Terkeltaub R, et al. Gout, Hyperuricaemia and Crystal-Associated Disease Network (G-CAN) consensus statement regarding labels and definitions of disease states of gout. Ann Rheum Dis. 2019;78(11):1592–1600. doi:10.1136/annrheumdis-2019-215933
30. Bursill D, Taylor WJ, Terkeltaub R, et al. Gout, hyperuricemia, and crystal-associated disease network consensus statement regarding labels and definitions for disease elements in gout. Arthritis Care Res. 2019;71(3):427–434. doi:10.1002/acr.23607
31. Fuss IJ, Kanof ME, Smith PD, Zola H. Isolation of whole mononuclear cells from peripheral blood and cord blood. Curr Protoc Immunol Chapter. 2009;7:1.
32. Bank I. The role of gamma delta t cells in autoimmune rheumatic diseases. Cells. 2020;9:1.
33. Hughes CE, Nibbs RJB. A guide to chemokines and their receptors. FEBS J. 2018;285:2944–2971. doi:10.1111/febs.14466
34. Lardeux F, Torrico G, Aliaga C. Calculation of the ELISA’s cut-off based on the change-point analysis method for detection of Trypanosoma cruzi infection in Bolivian dogs in the absence of controls. Memórias Inst Oswaldo Cruz. 2016;111(8):501–504. doi:10.1590/0074-02760160119
35. Lo Presti E, Mocciaro F, Mitri RD, et al. Analysis of colon-infiltrating γδ T cells in chronic inflammatory bowel disease and in colitis-associated cancer. J Leukoc Biol. 2020;108(2):749–760. doi:10.1002/JLB.5MA0320-201RR
36. Li Z, Jiao Y, Hu Y, et al. Distortion of memory Vdelta2 gammadelta T cells contributes to immune dysfunction in chronic HIV infection. Cell Mol Immunol. 2015;12(5):604–614. doi:10.1038/cmi.2014.77
37. Blauvelt A, Chiricozzi A. The immunologic role of IL-17 in psoriasis and psoriatic arthritis pathogenesis. Clin Rev Allergy Immunol. 2018;55(3):379–390. doi:10.1007/s12016-018-8702-3
38. Venken K, Jacques P, Mortier C, et al. RORgammat inhibition selectively targets IL-17 producing iNKT and gammadelta-T cells enriched in Spondyloarthritis patients. Nat Commun. 2019;10:9. doi:10.1038/s41467-018-07911-6
39. Szekanecz Z, Vegvari A, Szabo Z, Koch AE. Chemokines and chemokine receptors in arthritis. Front Biosci. 2010;2:153–167. doi:10.2741/s53
40. Ransohoff IFCARM. The many roles of chemokines and chemokine receptors in inflammation. New Engl J Med. 2006;354:13.
41. Shixin Qin JBR, Myers P, Kassam N, et al. The chemokine receptors CXCR3 and CCR5 mark subsets of T cells associated with certain inflammatory reactions. J Clin Invest. 1998;101:8.
42. McCoy SS, Parker M, Gurevic I, Das R, Pennati A, Galipeau J. Ruxolitinib inhibits IFNgamma-stimulated Sjogren’s salivary gland MSC HLA-DR expression and chemokine-dependent T cell migration. Rheumatology. 2022;61:4207–4218. doi:10.1093/rheumatology/keac111
43. Qian C, An H, Yu Y, Liu S, Cao X. TLR agonists induce regulatory dendritic cells to recruit Th1 cells via preferential IP-10 secretion and inhibit Th1 proliferation. Blood. 2007;109:3308–3315. doi:10.1182/blood-2006-08-040337
44. Wang Q, Nagarkar DR, Bowman ER, et al. Role of double-stranded RNA pattern recognition receptors in rhinovirus-induced airway epithelial cell responses. J Immunol. 2009;183(11):6989–6997. doi:10.4049/jimmunol.0901386
45. Patil RS, Shah SU, Shrikhande SV, Goel M, Dikshit RP, Chiplunkar SV. IL17 producing gammadeltaT cells induce angiogenesis and are associated with poor survival in gallbladder cancer patients. Int, J, Cancer. 2016;139:869–881. doi:10.1002/ijc.30134
46. Bianchi E, Vecellio M, Rogge L. Editorial: role of the IL-23/IL-17 pathway in chronic immune-mediated inflammatory diseases: mechanisms and targeted therapies. Front Immunol. 2021;12:770275. doi:10.3389/fimmu.2021.770275
47. Cuthbert RJ, Watad A, Fragkakis EM, et al. Evidence that tissue resident human enthesis gammadeltaT-cells can produce IL-17A independently of IL-23R transcript expression. Ann Rheum Dis. 2019;78:1559–1565. doi:10.1136/annrheumdis-2019-215210
48. Onishi RM, Gaffen SL. Interleukin-17 and its target genes: mechanisms of interleukin-17 function in disease. Immunology. 2010;129:311–321. doi:10.1111/j.1365-2567.2009.03240.x
49. Martine C. Enhancing Effect of IL-17 on IL-1-Induced IL-6 and Leukemia Inhibitory Factor Production by Rheumatoid Arthritis Synoviocytes and Its Regulation by Th2 Cytokines. J Immunol. 1998;161:6.
50. Zrioual S, Ecochard R, Tournadre A, Lenief V, Cazalis MA, Miossec P. Genome-wide comparison between IL-17A- and IL-17F-induced effects in human rheumatoid arthritis synoviocytes. J Immunol. 2009;182:3112–3120. doi:10.4049/jimmunol.0801967
51. Bai J. Study on the levels of IL-17 in serum and tissues of gouty arthritis patients. Bei Jing Xie He Yi Xue Yuan. 2015;11:1–79.
 © 2024 The Author(s). This work is published and licensed by Dove Medical Press Limited. The full terms of this license are available at https://www.dovepress.com/terms.php and incorporate the Creative Commons Attribution - Non Commercial (unported, v3.0) License.
By accessing the work you hereby accept the Terms. Non-commercial uses of the work are permitted without any further permission from Dove Medical Press Limited, provided the work is properly attributed. For permission for commercial use of this work, please see paragraphs 4.2 and 5 of our Terms.
© 2024 The Author(s). This work is published and licensed by Dove Medical Press Limited. The full terms of this license are available at https://www.dovepress.com/terms.php and incorporate the Creative Commons Attribution - Non Commercial (unported, v3.0) License.
By accessing the work you hereby accept the Terms. Non-commercial uses of the work are permitted without any further permission from Dove Medical Press Limited, provided the work is properly attributed. For permission for commercial use of this work, please see paragraphs 4.2 and 5 of our Terms.