Back to Journals » Cancer Management and Research » Volume 11
Robust analysis of novel mRNA–lncRNA cross talk based on ceRNA hypothesis uncovers carcinogenic mechanism and promotes diagnostic accuracy in esophageal cancer
Authors Chen LP, Wang H, Zhang Y, Chen QX, Lin TS, Liu ZQ, Zhou YY
Received 9 August 2018
Accepted for publication 21 November 2018
Published 27 December 2018 Volume 2019:11 Pages 347—358
DOI https://doi.org/10.2147/CMAR.S183310
Checked for plagiarism Yes
Review by Single anonymous peer review
Peer reviewer comments 2
Editor who approved publication: Professor Harikrishna Nakshatri
Li-Ping Chen,1,2 Hong Wang,1 Yi Zhang,2 Qiu-Xiang Chen,3 Tie-Su Lin,4 Zong-Qin Liu,5 Yang-Yang Zhou1
1Department of Rheumatology and Immunology, The Second Affiliated Hospital and Yuying Children’s Hospital of Wenzhou Medical University, Wenzhou, Zhejiang 325000, China; 2Chemical Biology Research Center, Department of Pharmaceutical Sciences, Wenzhou Medical University, Wenzhou, Zhejiang 325000, China; 3Department of Ultrasonography, The First Affiliated Hospital of Wenzhou Medical University, Wenzhou, Zhejiang 325000, China; 4Department of Gastroenterology, The First Affiliated Hospital of Wenzhou Medical University, Wenzhou, Zhejiang 325000, China; 5Department of Laboratory Medicine, Wenzhou Medical University, Wenzhou, Zhejiang 325000, China
Background: ceRNAs have emerged as pivotal players in the regulation of gene expression and play a crucial role in the physiology and development of various cancers. Nevertheless, the function and underlying mechanisms of ceRNAs in esophageal cancer (EC) are still largely unknown.
Methods: In this study, profiles of DEmRNAs, DElncRNAs, and DEmiRNAs between normal and EC tumor tissue samples were obtained from the Cancer Genome Atlas database using the DESeq package in R by setting the adjusted P<0.05 and |log2(fold change)|>2 as the cutoff. The ceRNA network (ceRNet) was initially constructed to reveal the interaction of these ceRNAs during carcinogenesis based on the bioinformatics of miRcode, miRDB, miRTarBase, and TargetScan. Then, independent microarray data of GSE6188, GSE89102, and GSE92396 and correlation analysis were used to validate molecular biomarkers in the initial ceRNet. Finally, a least absolute shrinkage and selection operator logistic regression model was built using an oncogenic ceRNet to diagnose EC more accurately.
Results: We successfully constructed an oncogenic ceRNet of EC, crosstalk of hsa-miR372-centered CADM2-ADAMTS9-AS2 and hsa-miR145-centered SERPINE1-PVT1. In addition, the risk-score model −0.0053*log2(CADM2)+0.0168*log2(SERPINE1)-0.0073*log2(ADAMTS9-AS2)+0.0905*log2(PVT1)+0.0047*log2(hsa-miR372)–0.0193*log2(hsa-miR145), (log2[gene count]) could improve diagnosis of EC with an AUC of 0.988.
Conclusion: We identified two novel pairs of ceRNAs in EC and its role of diagnosis. The pairs of hsa-miR372-centered CADM2-ADAMTS9-AS2 and hsa-miR145-centered SERPINE1-PVT1 were likely potential carcinogenic mechanisms of EC, and their joint detection could improve diagnostic accuracy.
Keywords: competitive endogenous RNA network, esophagus cancer, LASSO regression model, diagnosis
Introduction
miRNAs are sncRNAs 21–23 nucleotides in length that widely exist in eukaryotic cells and are evolutionarily conserved.1 miRNAs are extremely important gene-regulatory substances that regulate transcription of approximately 30% of human genes and control many important physiological processes, such as cell differentiation, proliferation, and programmed cell death.2,3 miRNAs perform these functions by affecting the stability of mRNA or suppressing translation by binding to miRNA-response elements (MREs) on the 3’ untranslated regions of mRNAs, thus leading to the regulation of protein expression.3,4 In addition to the traditional miRNA–mRNA regulatory mechanism, emerging research has shown that other ncRNAs, including pseudogenes, circRNAs, and lncRNAs, can also interact with miRNAs to form complex RNA communication systems. 5 These ncRNAs also have many MREs similar to mRNAs.6,7 The ceRNA hypothesis posited that all kinds of RNAs (including mRNA and ncRNAs) have the same or similar MREs that can interact to compete for the limited pool of miRNAs, which generates changes in their respective expressions.8 The RNAs that harbor MERs act as ceRNAs and are also known as molecular sponges.
With the discovery of ceRNAs, miRNAs were no longer regarded as separate elements in disease. The function of the ceRNA network (ceRNet) in various human diseases is gradually gaining importance, and compelling evidence has emerged indicating that ceRNA cross talk is involved in the development of several diseases and crucially relevant in various cancers.9,10 We defined ceRNA-mediated cross talk by sponging miRNAs in oncogenesis as oncocers.11 The analysis of oncocers has become a powerful tool to identify functions in tumorigenesis, such as gastrointestinal cancer, breast cancer, thyroid cancer, clear-cell renal carcinoma, lung cancer, and lymphoma.12–17 Systematic construction and analysis of ceRNet may have a profound impact on the diagnosis and treatment of cancer.
Esophageal cancer (EC) is the sixth-leading cause of cancer-related death globally and particularly prevalent in eastern Asia.18,19 Therapeutic options, including surgery, chemotherapy, and radiotherapy, appear to be beneficial for patients with EC. However, due to the lack of early symptoms, most affected patients are diagnosed at an advanced stage, which can diminish the effects of therapy. Also, the 5-year survival rate is <15%.19,20
Molecular and biological alterations are likely to occur long before significant morphological lesions are apparent in EC patients.21 A complete understanding of the molecular changes between normal and cancerous tissue will be important for the treatment of EC. Over the past several years, studies have focused on the molecular biomarkers of cancer.22 The aforementioned ceRNA hypothesis has been effective in helping clinicians to select diagnostic markers and has been successfully applied in various cancers.10,23 However, there have been relatively few studies on the roles of ceRNAs in EC. Use of the ceRNA hypothesis could be valuable in EC for the identification of oncocers.
In the present study, which is based on the ceRNA hypothesis, we hypothesized that oncocers could be an underlying mechanism for the development of EC and also be potential biomarkers for EC. We identified DEmRNAs, DElncRNAs, and DEmiRNAs between normal and EC tumor tissues from the Cancer Genome Atlas (TCGA) database. We then predicted DEmiRNAs and their targets according to bioinformatic analysis using miRcode, miRDB, miRTarBase, and TargetScan to build an initial ceRNet. Microarray data of GSE6188, GSE89102, and GSE92396 and correlation analysis were used to identify oncocers. In addition, we built a least absolute shrinkage and selection operator (LASSO) model to combine oncocers to improve the diagnosis of EC. The results revealed EC-associated oncocers and clarified their clinical significance.
Methods
Microarray-data information
The transcriptome profiles of mRNA, lncRNA, and miRNA of the EC training set were acquired from TCGA. The profiles contained eleven normal and 162 EC tissue samples. The miRNA profile GSE6188,24 lncRNA profile GSE89102, and mRNA profile GSE92396 were obtained from the Gene Expression Omnibus database (http://www.ncbi.nlm.nih.gov/gds) as independent validation sets to verify the results from TCGA. The clinical data of patients was downloaded from cBioPortal (http://www.cbioportal.org).25,26
Construction and validation of ceRNA network
A flowchart of the construction and validation of the ceRNA network is presented in Figure 1. Initially, we separated lncRNA and mRNA according to their gene labels. The R language package DESeq (http://bioconductor.org/packages/release/bioc/html/DESeq.html) was used to identify DEmRNAs, DElncRNAs, and DEmiRNAs from TCGA, with settings adjusted to P<0.05 and |log2(fold change)|>2 as the cutoff. According to miRcode (http://www.mircode.org), used to predict human microRNA targets, we analyzed the possible relationship between miRNAs and DElncRNAs. Thereafter, we identified the intersections of DEmiRNAs and miRNAs predicted from miRcode to discern the initial relationship between miRNAs and lncRNAs. Secondly, we predicted targets of DEmiRNAs using miRDB (http://www.mirdb.org),27,28 miRTarBase (http://mirtarbase.mbc.nctu.edu.tw/php/index.php),29 and TargetScan (http://www.targetscan.org/mamm_31).30,31 mRNAs were identified only when relationships between DEmiRNAs and predicted mRNAs were coincident in miRDB, miRTarBase, and TargetScan. We obtained the initial relationship between miRNAs and mRNAs by taking the intersections of DEmRNAs and predicted mRNAs. The initial ceRNet results were visualized using Cytoscape version 3.5.1.32 We then validated the elements of the initial ceRNet from three independent data sets (GSE6188, GSE89102, and GSE92396) and acquired a validated ceRNet. Finally, using the acquired ceRNet, we analyzed correlations between lncRNA and mRNA that competed for the same miRNAs in TCGA to identify the final oncocers. It was mandatory for these candidates that the relationship between lncRNA and mRNA conformed to the ceRNA hypothesis.
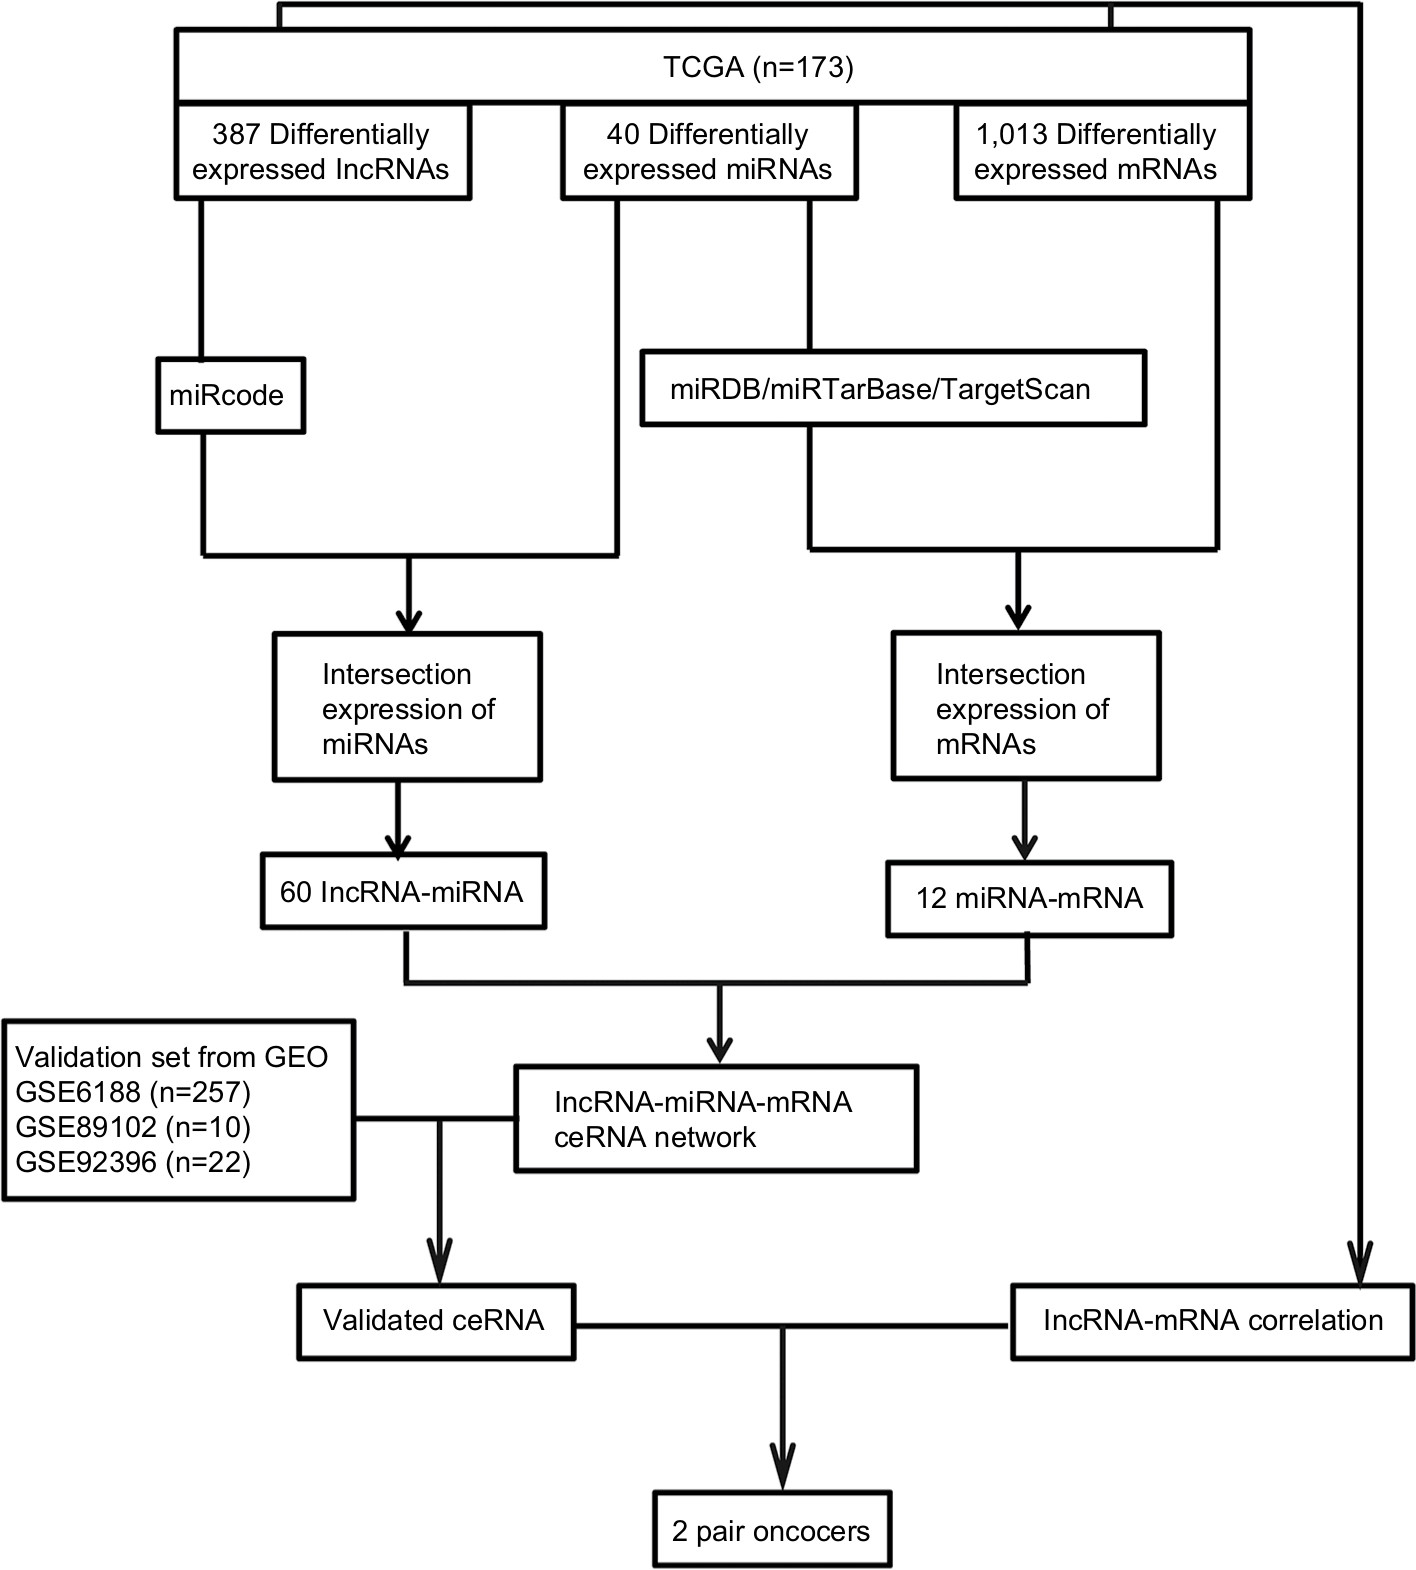 | Figure 1 Flowchart of construction and validation of ceRNA network. Notes: Profiles of GSE6188, GSE89102, and GSE92396 downloaded from GEO. Abbreviations: GEO, Gene Expression Omnibus; TCGA, the Cancer Genome Atlas. |
Functional analysis
The Database for Annotation, Visualization, and Integrated Discovery (DAVID) (https://david.ncifcrf.gov)33 was used to obtain Kyoto Encyclopedia of Genes and Genomes (KEGG) pathways. The Gene Ontology Consortium (http://www.geneontology.org)34–36 was used to analyze molecular activities of the gene products.
Statistical analysis
Statistical differences in expression data between normal and tumor groups were examined with Student’s t-test, setting 0.05 as the cutoff. Expression data and correlation analyses were performed using GraphPad Prism 5.0 software (GraphPad, La Jolla, CA, USA). The LASSO regression model was built by the “lars” package (R version 3.3.3).37,38 To estimate the sensitivity and specificity of ceRNAs and the risk-score model, receiver operating characteristic (ROC) analysis was conducted and area under the curve (AUC) values used to assess prognostic performance.
Results
DEmRNAs, DElncRNAs, DEmiRNAs, and enrichment analysis
There were 1,013 DEmRNAs between normal and EC tumor tissue: 372 high-expression genes and 641 low-expression genes (Figure 2A). Additionally, 387 DElncRNAs containing 169 upregulated and 218 downregulated genes were detected in the two groups (Figure 2B). The few DEmiRNAs included 23 high-expression and 17 low-expression genes (Figure 2C). KEGG is a bioinformatic resource that is useful in understanding the biological function of genome sequences and other high-throughput data.39,40 The present KEGG results revealed that protein digestion and absorption were the most highly enriched pathways, indicating that the function of the digestive tract had significantly changed (Figure 2D). In addition, neuroactive ligand–receptor interaction, gastric acid secretion, pancreatic secretion, extracellular matrix–receptor interaction, the calcium signaling pathway, and the cAMP signaling pathway also ranked as the top enrichment pathways. Concerning the molecular function of the mRNA Gene Ontology analysis, voltage-gated ion channel activity was the most enriched function, followed by metallopeptidase activity, chemokine activity, ion channel activity, extracellular matrix structural constituent, transmembrane receptor protein, and celladhesion molecule activity (Figure 2E).
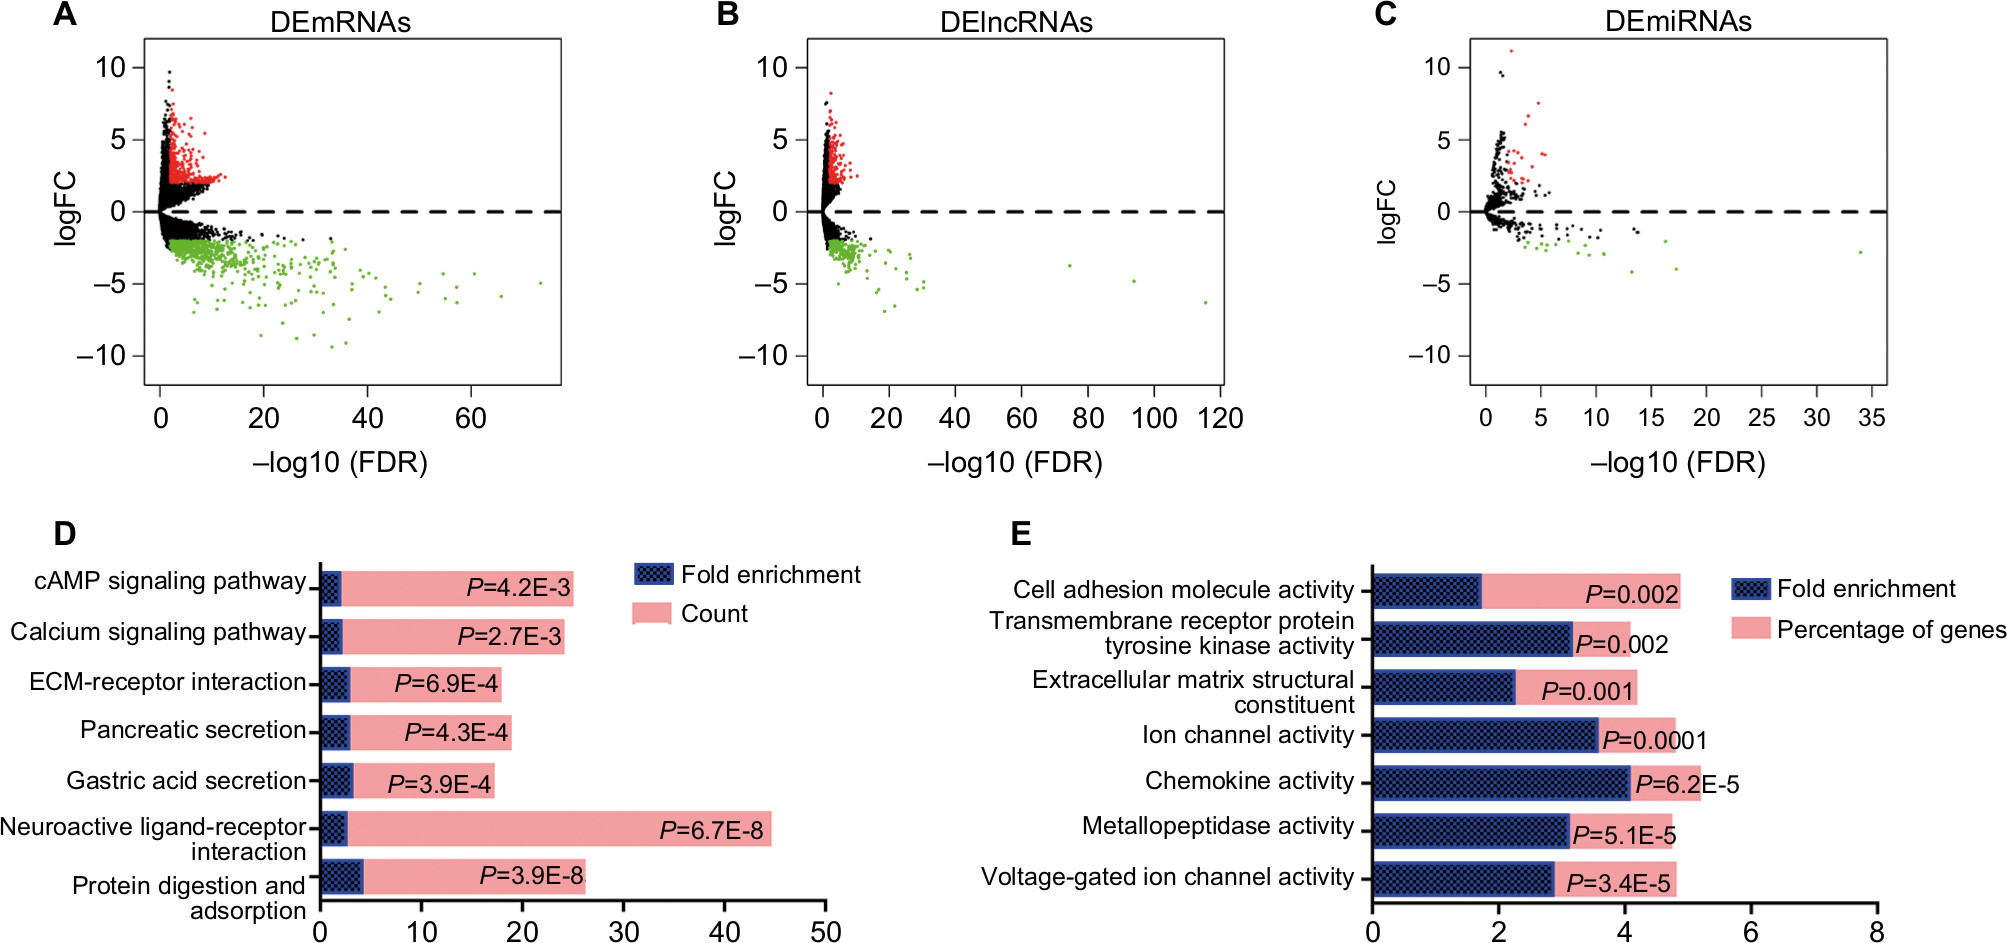 | Figure 2 Aberrantly expressed mRNAs, lncRNAs, and miRNAs in esophagus cancer and their enrichment analysis. Notes: (A) Volcano plot of DEmRNAs between normal and tumor groups. Horizontal axis represents –log(false discovery rate [FDR]), and vertical axis represents log2(fold change [FC]). Red dots represent high-expression genes and green dots low-expression genes (adjusted P<0.05 and |log2(FC)|>2). (B) Volcano plot of DElncRNAs between normal and tumor group of esophagus cancer ( adjusted P<0.05, |log2(FC)|>2). (C) Volcano plot of DEmiRNAs between normal and tumor groups ( adjusted P<0.05, |log2(FC)|>2). (D) Significantly enriched KEGG pathways analysis of DEmRNAs. (E) Significantly enriched molecular function analysis of DEmRNAs. Abbreviations: KEGG, Kyoto Encyclopedia of Genes and Genomes; FC, fold change. |
ceRNA network analysis
ceRNAs share the same MREs to regulate RNA transcripts as a consequence of competing for the limited pool of miRNAs. Based on the expression profiles of DEmRNAs, DElncRNAs, and DEmiRNAs of patients with EC, an initial ceRNA network was built using R language and visualized by Cytoscape (Figure 3A). Nineteen DElncRNAs, eleven DEmRNAs, and six DEmiRNAs were selected by predicting targets of miRNAs from the multiple databases (Table 1). Moreover, the miRNA profile GSE6188, lncRNA profile GSE89102, and mRNA profile GSE92396 were independent validation sets that allowed verification of the initial ceRNet. Four DEmRNAs (CADM2, MEST, HOXC8, and SERPINE1), five DElncRNAs (POU6F2-AS2, ADAMTS9-AS1, ADAMTS9-AS2, PVT1, and RMST), and four DEmiRNAs (hsa-miR372, hsa-miR301b, hsa-miR375, and hsa-miR145) displayed the same tendency and statistical difference between normal and tumor groups in both the training and validation sets (Figure 4 and Table 1). Therefore, the ceRNet was confirmed and simplified (Figure 3B). To confirm further that lncRNAs interacted with mRNAs based on the ceRNA hypothesis, we performed a correlation analysis between lncRNAs and mRNAs of any miRNA in the validated ceRNet. Only two positive correlations were revealed between the expressed ceRNAs. CADM2 interacted with ADAMTS9-AS2, which was mediated by hsa-miR372, and SERPINE1 interacted with PVT1, which was mediated by hsa-miR145 (Figure 5, A and B). These were defined as two pairs of oncocers in EC.
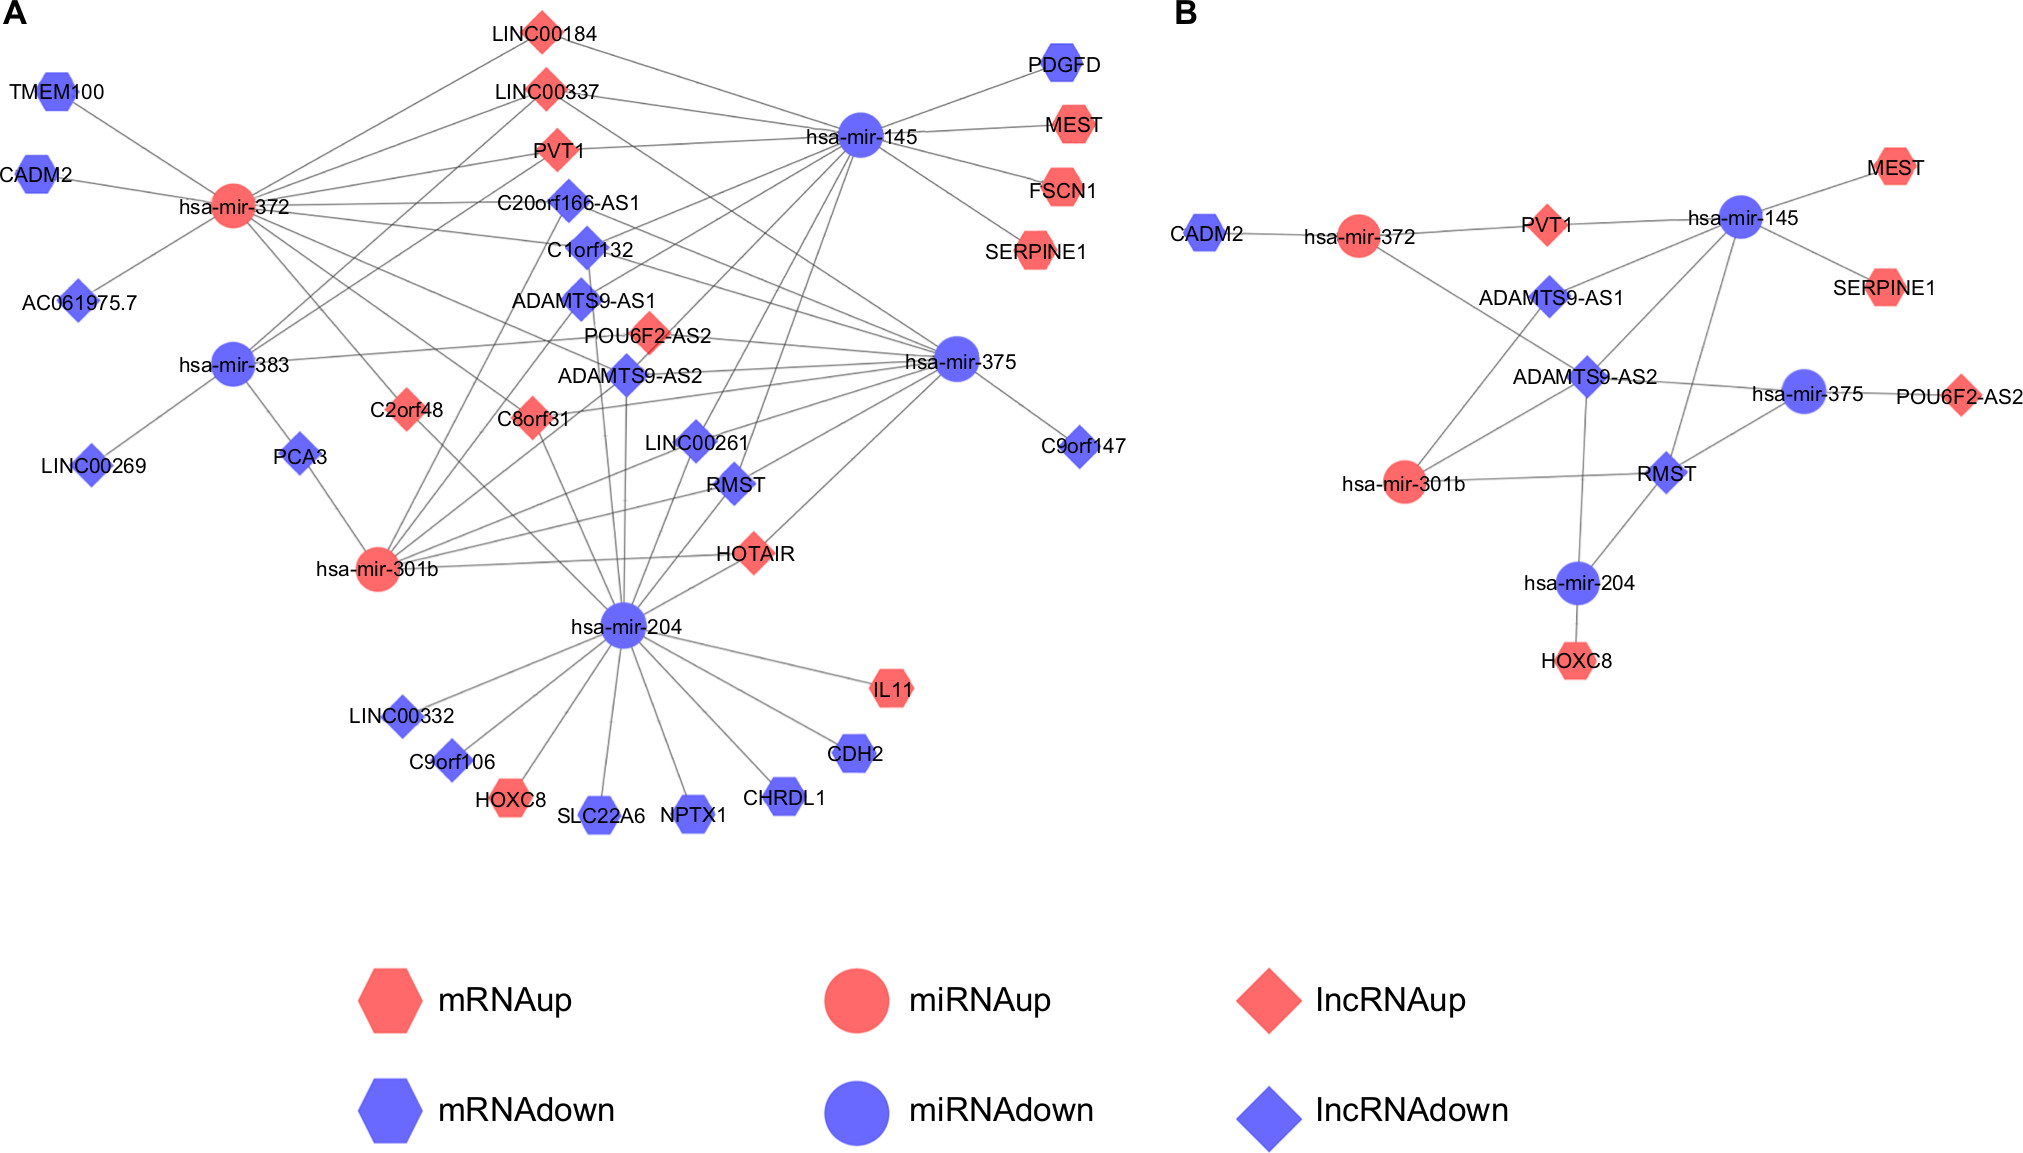 | Figure 3 Visualization of initial ceRNA network and validated ceRNA network. Notes: (A) Initial ceRNA network. (B) Validated ceRNA network. Hexagons represent mRNA, circles miRNA, and diamonds lncRNA. Red represents high expression and blue low expression. |
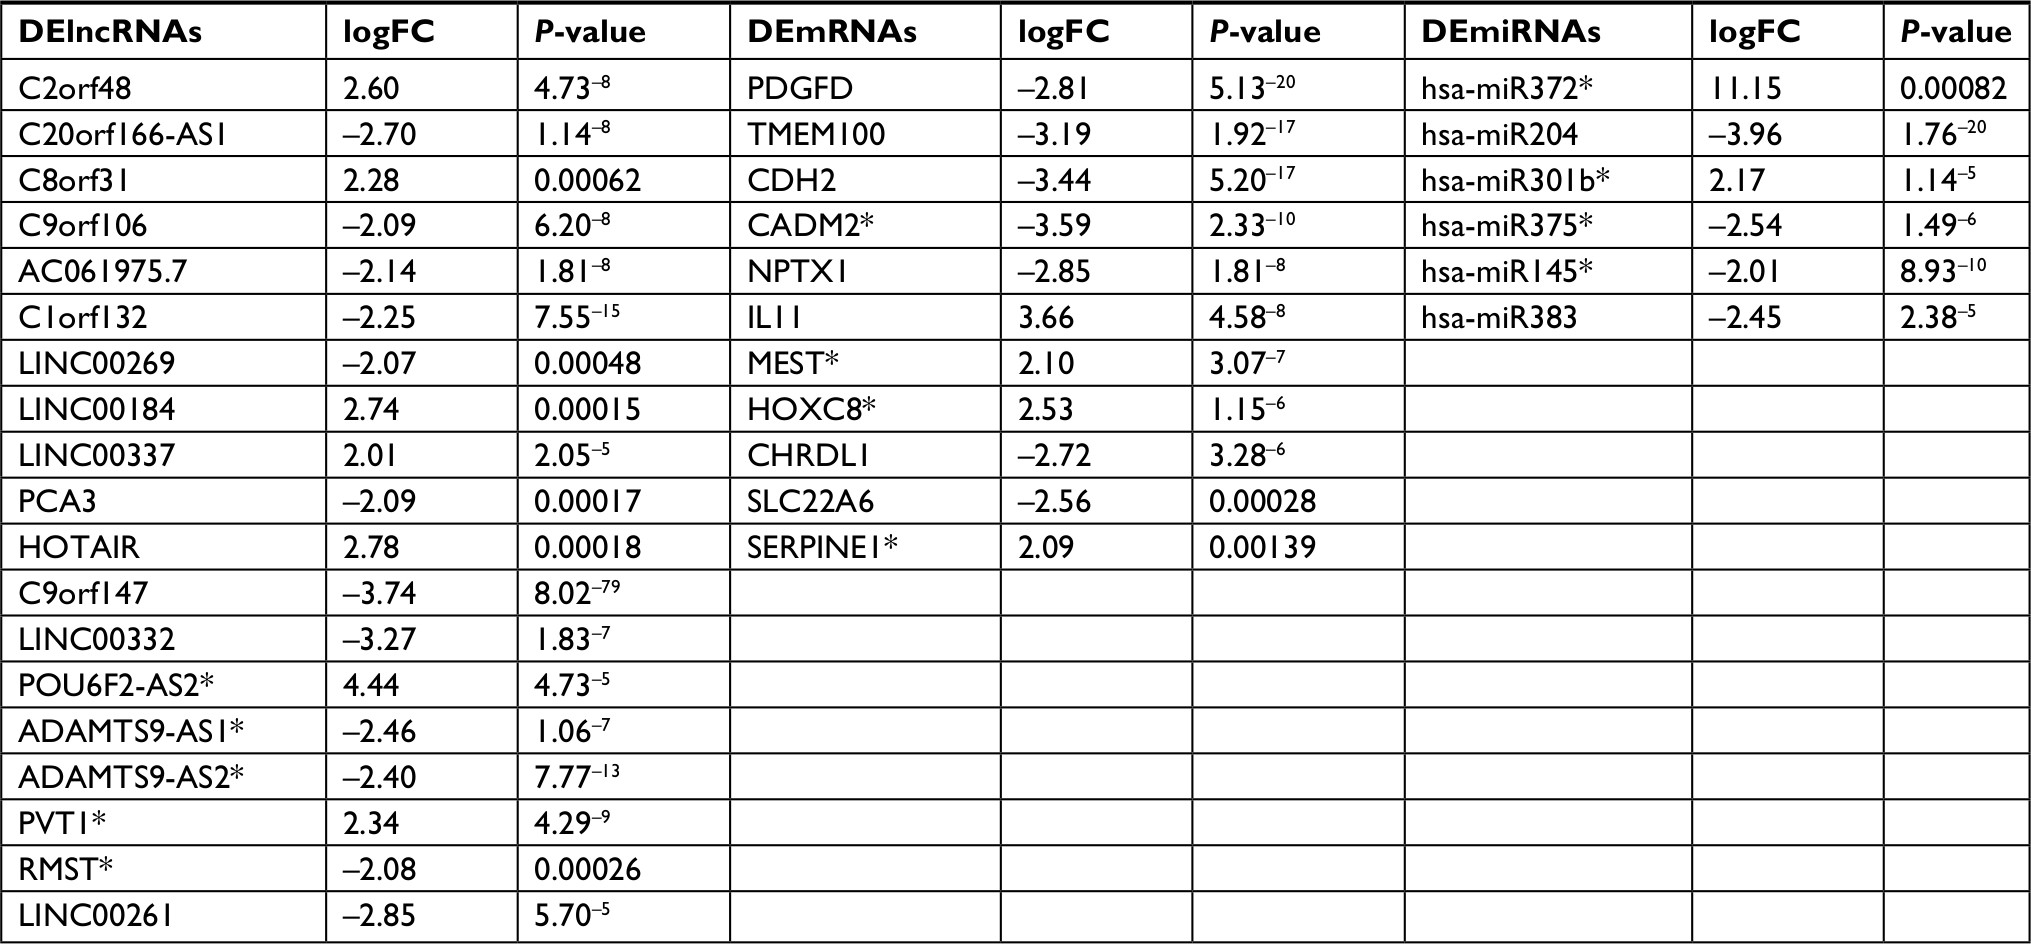 | Table 1 Molecular markers of initial ceRNA network and validated ceRNA network Notes: The Cancer Genome Atlas was used to identify initial ceRNA network, including DElncRNAs, DEmRNAs and DEmiRNAs. *A able to be validated in independent data sets. DElncRNAs were verified by GSE89102, DEmRNAs by GSE92396, and DEmiRNAs by GSE6188. Abbreviation: FC, fold change. |
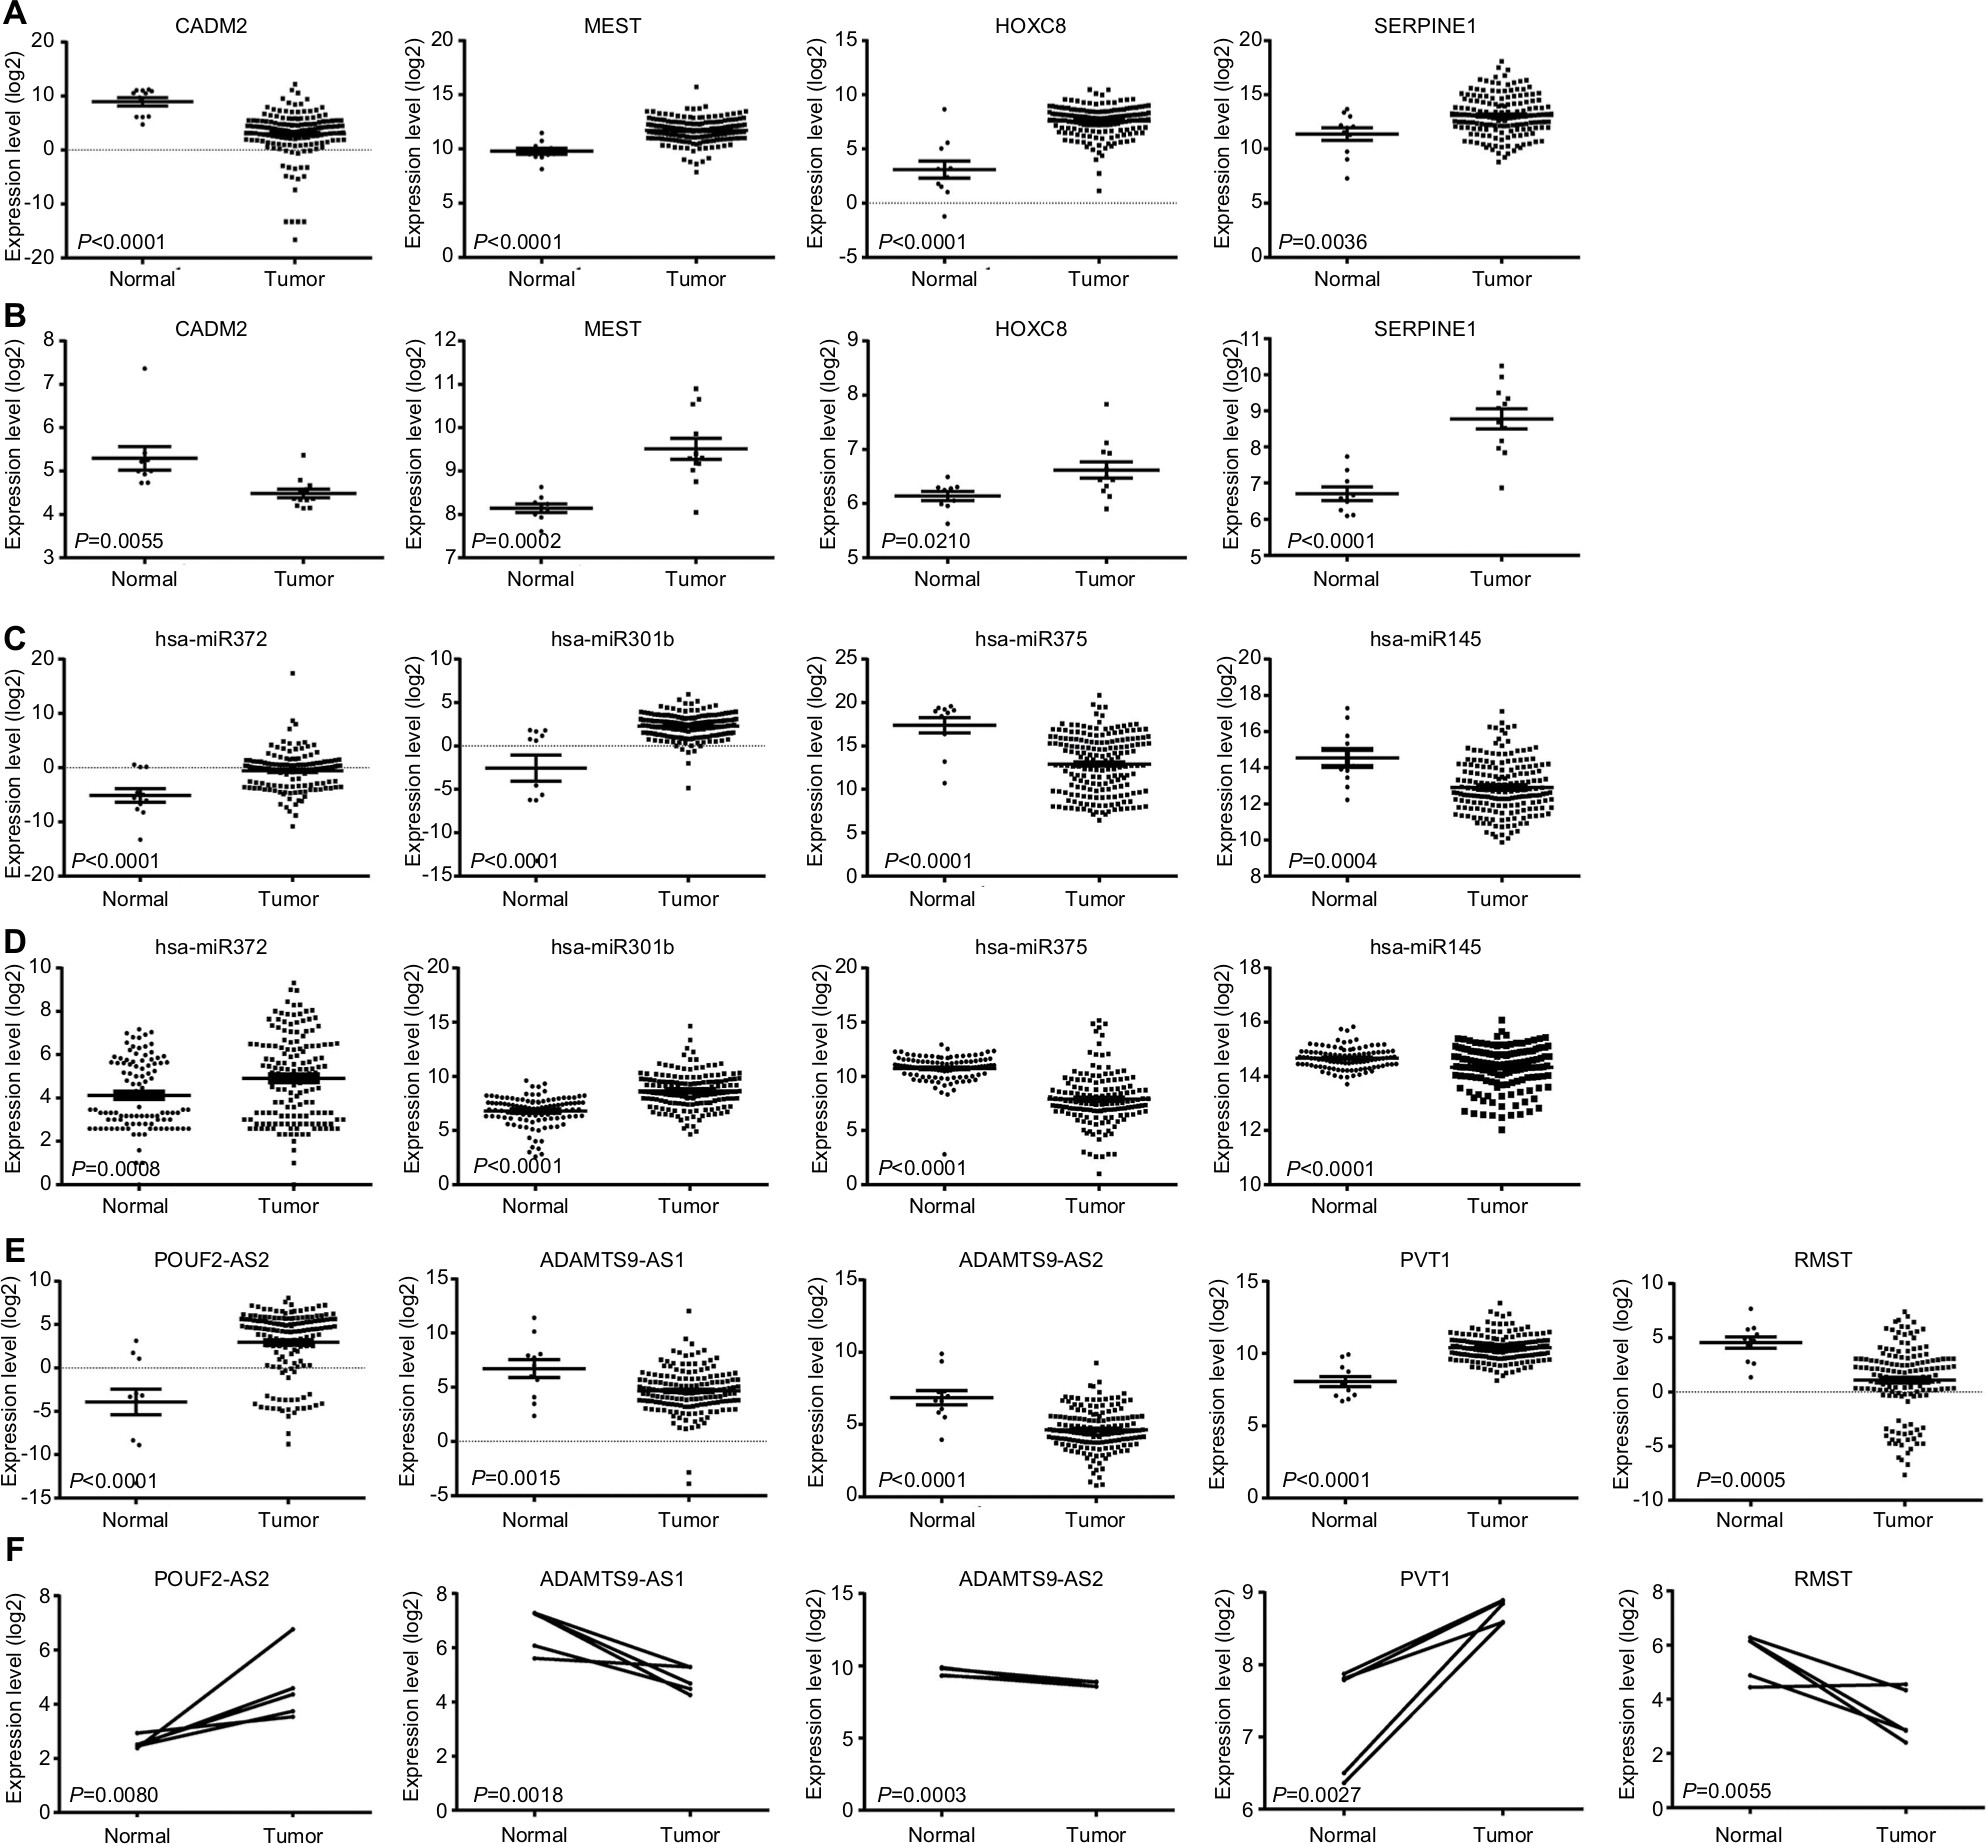 | Figure 4 Construction and validation of ceRNA network. Notes: (A) Expression levels of DEmRNAs between normal and tumor groups from the Cancer Genome Atlas database. (B) Expression levels of DEmRNAs between normal and tumor groups from validation set GSE92396. (C) Expression levels of DEmiRNAs between normal and tumor groups from Cancer Genome Atlas. (D) Expression levels of DEmiRNAs between normal and tumor groups from validation set GSE6188. (E) Expression levels of DElncRNAs between normal and tumor groups from Cancer Genome Atlas. (F) Expression levels of DElncRNAs between normal and tumor groups from validation set GSE89102. |
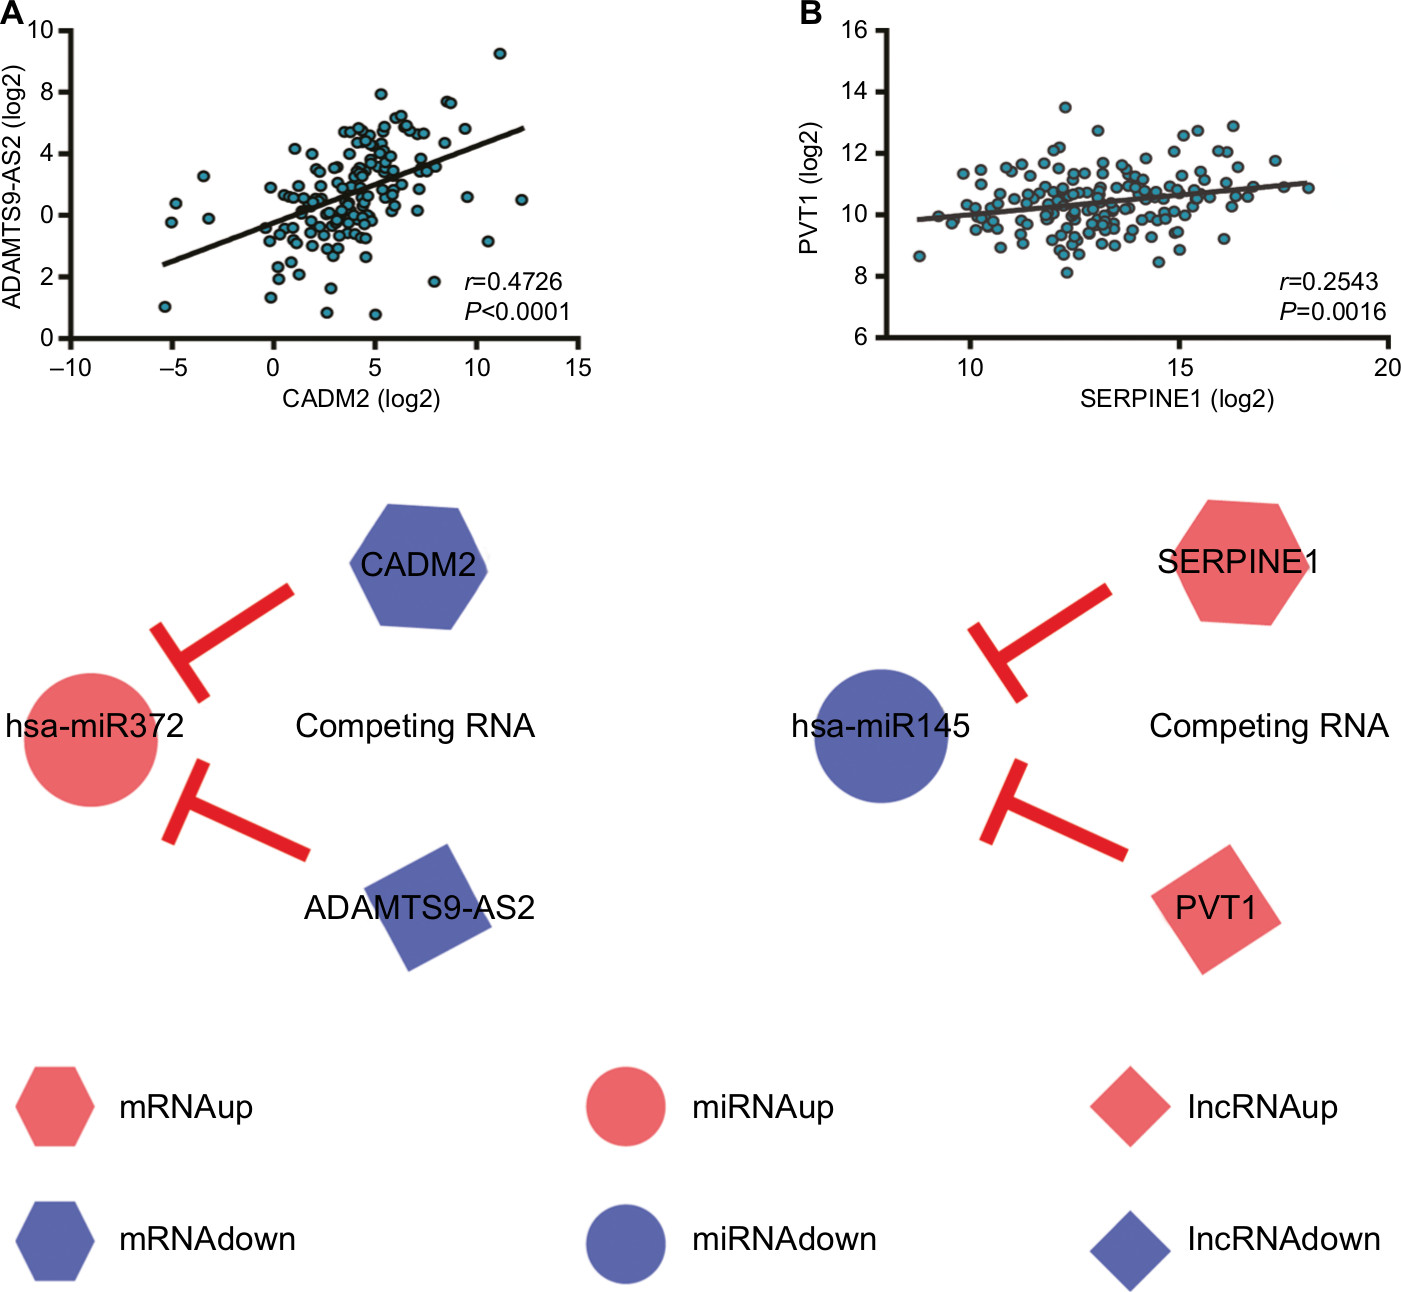 | Figure 5 Correlation analysis of oncocer-expression levels. Notes: (A) ADAMTS9-AS2 vs CADM2. (B) PVT1 vs SERPINE1. Hexagons represent mRNA, circles miRNA, and diamonds lncRNA. Red represents high expression and blue low expression. Oncocers: ceRNA-mediated cross talk by sponging miRNAs in oncogenesis. |
Diagnostic value of oncocers
A total of 162 EC tumor-tissue and eleven normal-tissue samples were examined. Approximately two-thirds of the patients (109 of 162) were >55 years of age, 85.8% (139 of 162) were male, 42.1% (67 of 162) were overweight, and nearly all were smokers (Table 2). Most (77.8%) had been diagnosed with symptoms of EC, indicating that early EC-diagnosis performance was still poor. Medical records revealed Barrett’s esophagus in only 14.8% (24 of 162) of patients. Other details on patients’ characteristics and treatment are summarized in Table 2. We performed ROC analysis of the defined oncocers to assess their diagnostic value in EC. As shown in Figure 6A, none had an AUC >0.95, indicating that they were not diagnostic when used alone. Therefore, we constructed a LASSO regression model in R. The risk-model equation was –0.0053×log2(CADM2) +0.0168×log2(SERPINE1)–0.0073×log2(ADAMTS9-AS2)+0.0905×log2(PVT1)+0.0047×log2(hsa-miR372)–0.0193×log2(hsa-miR145), (log2[gene count]) (Figure 6, B and C). Each person was assigned a risk score according to the LASSO regression model. The distribution of risk scores between the normal and tumor groups is shown in Figure 6D. The ROC analysis indicated excellent performance of the risk score in diagnosing EC, with an AUC of 0.988 (P<0.0001; Figure 6E). Additionally, we evaluated the diagnostic performance of the risk-score model in different TNM stages (Figure 6F), tumor grade (Figure 6G), and in the presence and absence of symptoms (Figure 6H).
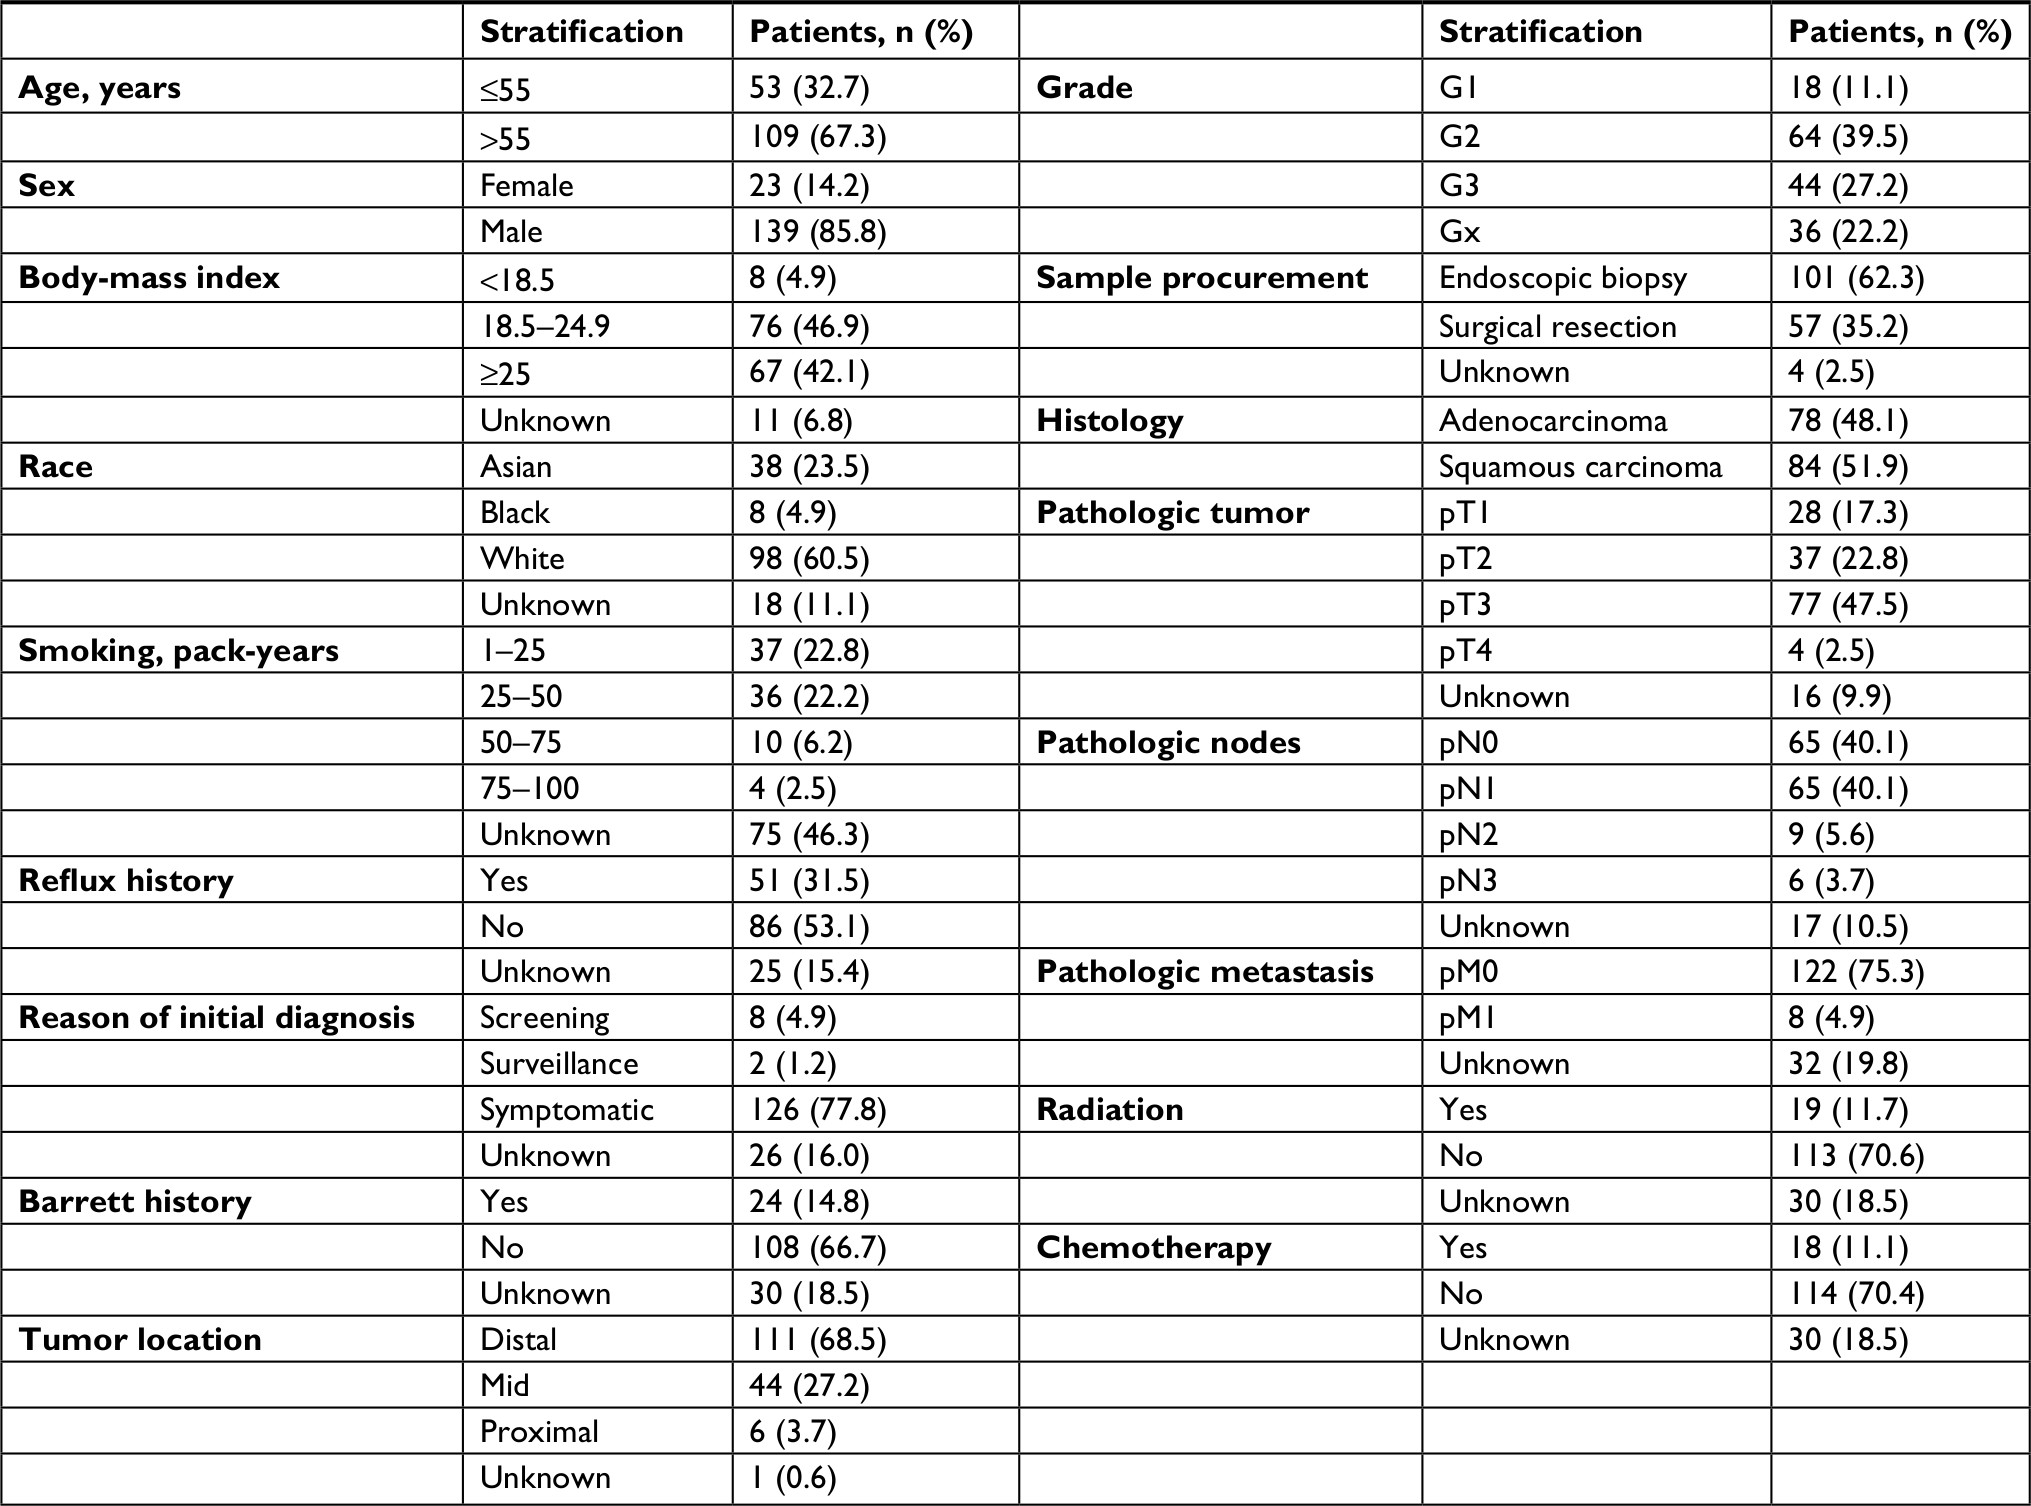 | Table 2 Clinical characteristics of esophageal cancer samples |
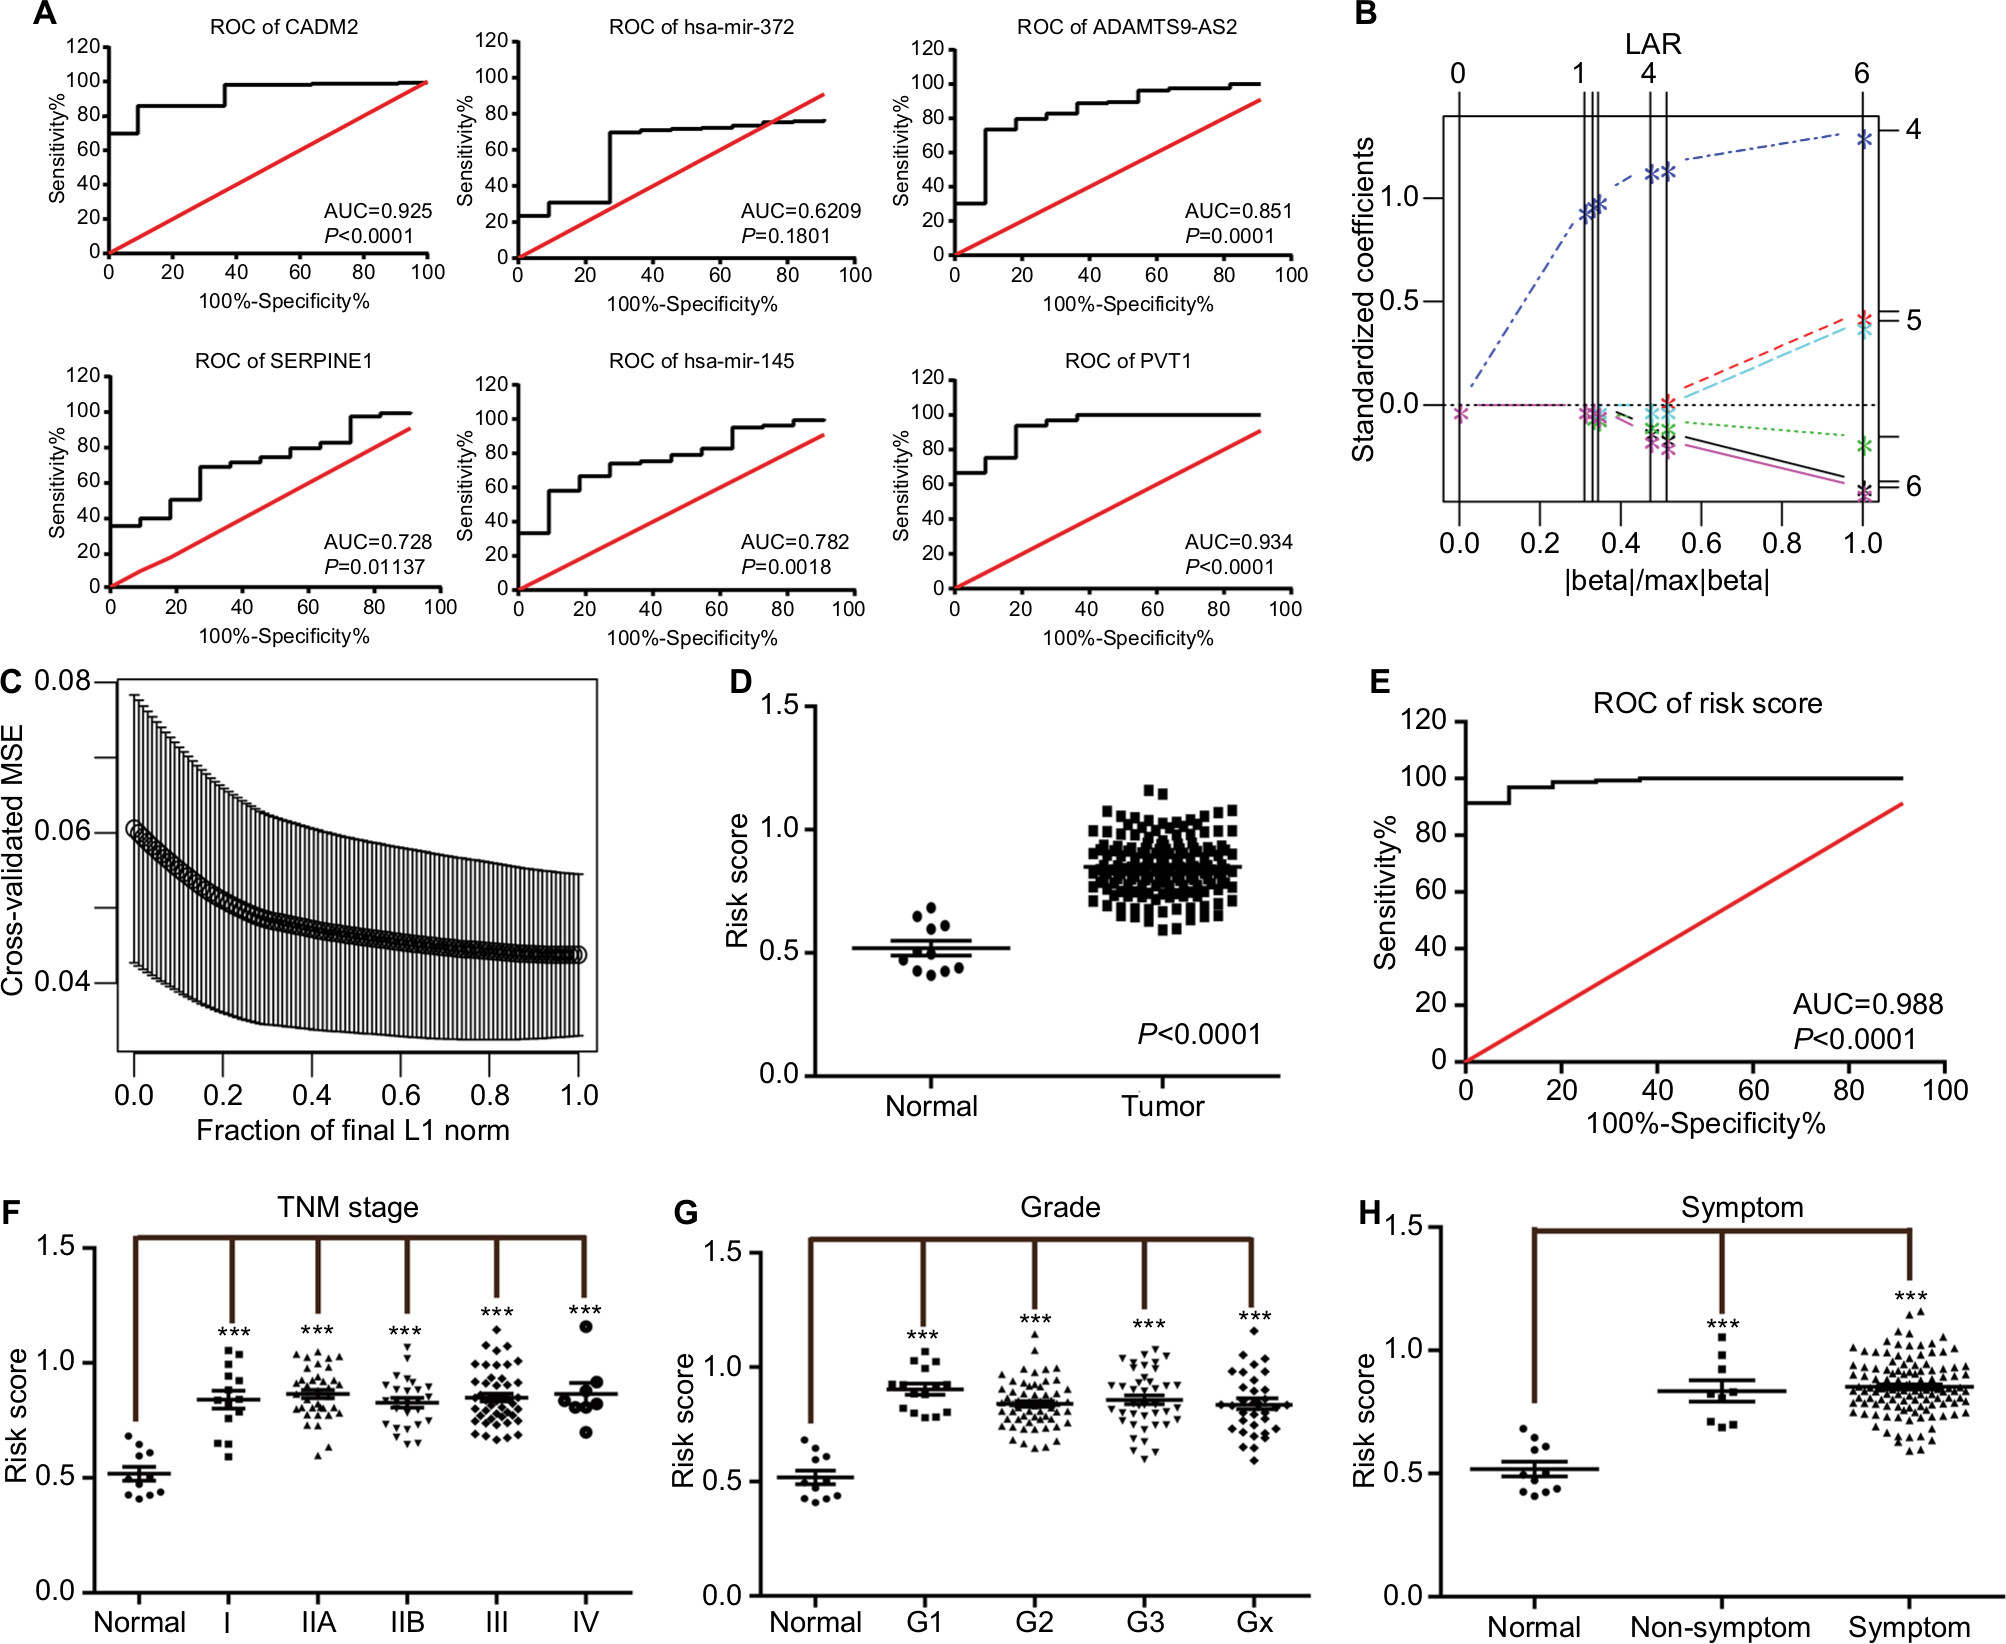 | Figure 6 ROC curves of risk model for the diagnosis of esophagus cancer. Notes: (A) ROC curve of each element of the identified oncocers. Red line represents sensitivity curve, black line represents identity line. (B) Solution paths of LASSO regression model. The numbers on the right represent variables that each path corresponds to. The vertical lines indicates the event times for comparison between various solution paths. (C) The relationship between cross-validated MSE and model size. The confidence bars were made by the R function “lars”. The horizontal axis represents fraction of final L1 norm, which refers to the ratio of the L1 norm of the coefficient vector relative to the norm at the full least-squares solution for the model with the maximum steps used. (D) Distribution of risk scores of normal and tumor groups. (E) ROC curve of risk scores for distinguishing tumor from normal tissue. (F) Distribution of risk scores of different TNM stages. (G) Distribution of risk scores of different grades. (H) Distribution the risk scores in the presence and absence of symptoms. Oncocers: ceRNA-mediated crosstalk by sponging miRNAs in oncogenesis. ***P<0.001. Abbreviations: ROC, receiver-operating characteristic; AUC, area under the curve; LASSO, least absolute shrinkage and selection operator; MSE, mean square error. |
Discussion
There is a delicate balance between ceRNAs and miRNAs that is closely related to cell type and differentiation degree, and this balance is maintained by a variety of kinetic factors.41 Once the expression of ceRNAs differs due to chromosomal or genetic mutations, the balance can be destroyed. Following the expression of the affected miRNAs, the expression of target genes regulated by miRNAs will also change, leading to the occurrence of a variety of diseases, including tumors. Therefore, the analysis of disordered ceRNets in tumor tissue provides a new perspective on the mechanism of cancer.
Changes in ceRNA expression have been found in various tumor-tissue types. For example, ZEB2 mRNA levels are decreased in melanoma cells,42 the pseudogene PTENP1 is reduced in kidney carcinoma,43 the expression of PTCSC3 lncRNA is downregulated in thyroid cancer,44 and pseudogene OCT4-pg4 is highly expressed in hepatocellular carcinoma.45 These changes in expression are often associated with progression and prognosis of cancers. So far, however, few studies have analyzed the relevance between ceRNAs and EC. One study described a change in ceRNA expression in EC cell lines through high-throughput RNA sequencing and microarray data.19 A subsequent study systematically constructed a ceRNet in EC based on analysis of miRNA, lncRNA, and mRNA expression.46 Nevertheless, the existing knowledge of ceRNAs and EC is incomplete. This prompted us to explore the regulation of ceRNAs in EC further.
In this study, we systematically analyzed expression data in EC tumors and normal tissue using TCGA. The analysis revealed that the mRNAs, lncRNAs, and miRNAs involved in tumor progression all exhibited variance from normal tissue. To uncover the interaction amongst these DEmRNAs, DEmiRNAs, and DElncRNAs, four databases, namely miRcode, miRDB, miRTarBase, and TargetScan, were used to construct an EC ceRNet. This showed the central involvement of miRNAs in the ceRNet, and they had the most important informational link with mRNAs and lncRNAs. We further found that four DEmRNAs (CADM2, MEST, HOXC8, and SERPINE1), five DElncRNAs (POU6F2-AS2, ADAMTS9-AS1, ADAMTS9-AS2, PVT1, and RMST), and four DEmiRNAs (hsa-miR372, hsa-miR301b, hsa-miR375, and hsa-miR145) were verified in the independent sets. In addition, only the interaction of hsa-miR372-centered CADM2-ADAMTS9-AS2 and hsa-miR145-centered SERPINE1-PVT1 were confirmed by the correlation analysis. As such, two pairs of oncocers were revealed in EC.
It was a new discovery that hsa-miR372 was upregulated in tumors, implicating it as a target for cancer treatment. As for other oncocers, increasing evidence has indicated that they all affect the progression of various tumors. CADM2, which belongs to the family of cell adhesion molecules, has been reported to serve as a tumor suppressor.47 It is lost or expressed in low levels in many cancerous tissue types, including prostate cancer, renal-cell carcinoma, and hepatocellular carcinoma.47–50 In EC, the role of CADM2 has been initially evaluated. CADM2 is strikingly reduced and regulated by miR21 in EC.51 The overexpression of CADM2 can inhibit proliferation and induce apoptosis of EC cells. However, there have been no reports to date regarding the CADM2-related ceRNA pair via the construction of an EC ceRNet. ADAMTS9-AS2, an antisense transcript of the protein coding gene ADAMTS9, has been screened out and recognized as a key oncocer in cervical squamous-cell carcinoma through the construction of a ceRNet.52 Nevertheless, the role of ADAMTS9-AS2 in EC remains unclear, despite its functions in breast, lung, and glioma cancers.53–55 ADAMTS9-AS2–hsa-miR372-CADM2 cross talk has not yet been reported in any tumors. Moreover, another pair of hsa-miR145-centered SERPINE1-PVT1 was first acquired in tumors. Hsa-miR145 is significantly downregulated in colorectal cancer and Ewing’s sarcoma.56,57 Its association with carcinogenesis in EC has been unclear. SERPINE1, which is located on chromosome 7, has been studied widely in a variety of tumors, including thyroid, colorectal, and ECs.58–60 It was identified as a promising prognostic gene involved in multiple physiological processes. Consistent with our research, the high expression of SERPINE1 may be a potential cause for the invasion and metastasis of EC. The downregulation of SERPINE1 may be useful in treatment for EC patients. PVT1 has been reported to inhibit the expression of miR200a, miR200b, miR199a5p, miR497, miR152, miR186, and miR214 by acting as a ceRNA and also promoted cell invasion.61 The mechanism of PVT1 mediating tumorigenesis still requires further study.62,63
The pair of hsa-miR145-centered SERPINE1-PVT1 that we identified could provide reference data for subsequent research on the mechanisms of PVT1 in EC or other cancers. Additionally, the joint detection of these two ceRNA pairs was more significant for the diagnosis of EC in comparison to the detection of single ceRNAs. The combined use of these two pairs provided higher predictive accuracy of 98.8% (AUC) for EC, while the AUC for detection of CADM2, hsa-miR372, ADAMTS9-AS2, SERPINE1, hsa-miR145, and PVT1 alone was only 92.5%, 62.09%, 85.1%, 72.8%, 78.2%, and 93.4%, respectively. The low rate of diagnosis of early-stage EC is a major factor affecting the survival rate of patients.19,20 Improvement in early diagnosis is needed urgently for improved treatment of EC. As shown in Figure 6, F–H, we have reasons to believe that the risk-score model is potentially valuable in the early diagnosis of EC. The use of these two pairs of ceRNAs to guide the diagnosis and treatment of EC may be very fruitful.
This study was subject to a major limitation. Due to the lack of supporting molecular biology data, correlations among CADM2, hsa-miR372, ADAMTS9-AS2, SERPINE1, hsa-miR145, and PVT1 were determined based only on EC patient information available in databases. Our findings will have to be validated through a cluster of cases in our own institute and other institutes.
Conclusion
The hsa-miR372-centered CADM2-ADAMTS9-AS2 and hsa-miR145-centered SERPINE1-PVT1 are implicated in the carcinogenic mechanism of EC, and their joint detection could improve the diagnostic accuracy of EC.
Abbreviations
AUC, area under the curve; ceRNAs, competitive endogenous RNAs; ceRNet, ceRNA network; circRNAs, circular RNAs; DAVID, database for annotation, visualization, and integrated discovery; DElncRNAs, differentially expressed long noncoding RNAs; DEmiRNAs, differentially expressed microRNAs; DEmRNAs, differentially expressed mRNAs; EC, esophageal cancer; GEO, Gene Expression Omnibus; GO, Gene Ontology; KEGG, Kyoto Encyclopedia of Genes and Genomes; LASSO, least absolute shrinkage and selection operator; miRNAs, microRNAs; MREs, miRNA response elements; TCGA, the Cancer Genome Atlas; ROC, receiver-operating characteristic; UTRs, untranslated regions.
Acknowledgments
This research did not receive any specific grant from funding agencies in the public, commercial, or not-for-profit sectors. We are very grateful to the TCGA project team.
Disclosure
The authors report no conflicts of interest in this work.
References
Li Z, Rana TM. Therapeutic targeting of microRNAs: current status and future challenges. Nat Rev Drug Discov. 2014;13(8):622–638. | ||
Syed DN, Lall RK, Mukhtar H. MicroRNAs and photocarcinogenesis. Photochem Photobiol. 2015;91(1):173–187. | ||
Truini A, Coco S, Alama A, et al. Role of microRNAs in malignant mesothelioma. Cell Mol Life Sci. 2014;71(15):2865–2878. | ||
Thomas M, Lieberman J, Lal A. Desperately seeking microRNA targets. Nat Struct Mol Biol. 2010;17(10):1169–1174. | ||
Kartha RV, Subramanian S. Competing endogenous RNAs (ceRNAs): new entrants to the intricacies of gene regulation. Front Genet. 2014;5:8–16. | ||
Futreal PA, Coin L, Marshall M, et al. A census of human cancer genes. Nat Rev Cancer. 2004;4(3):177–183. | ||
Xiao-Jie L, Ai-Mei G, Li-Juan J, Jiang X. Pseudogene in cancer: real functions and promising signature. J Med Genet. 2015;52(1):17–24. | ||
Salmena L, Poliseno L, Tay Y, Kats L, Pandolfi PP. A ceRNA hypothesis: the Rosetta Stone of a hidden RNA language? Cell. 2011;146(3):353–358. | ||
de Giorgio A, Krell J, Harding V, Stebbing J, Castellano L. Emerging roles of competing endogenous RNAs in cancer: insights from the regulation of PTEN. Mol Cell Biol. 2013;33(20):3976–3982. | ||
Qi X, Zhang DH, Wu N, Xiao JH, Wang X, Ma W. ceRNA in cancer: possible functions and clinical implications. J Med Genet. 2015;52(10):710–718. | ||
Ergun S, Oztuzcu S. Oncocers: ceRNA-mediated cross-talk by sponging miRNAs in oncogenic pathways. Tumour Biol. 2015;36(5):3129–3136. | ||
Chen X, Chen Z, Yu S, et al. Long noncoding RNA Linc01234 functions as a competing endogenous RNA to regulate CBFB expression by sponging miR-204-5p in gastric cancer. Clin Cancer Res. 2018;24(8):2002–2014. | ||
Zheng L, Li X, Chou J, et al. StarD13 3’-untranslated region functions as a ceRNA for TP53INP1 in prohibiting migration and invasion of breast cancer cells by regulating miR-125b activity. Eur J Cell Biol. 2018;97(1):23–31. | ||
Liang L, Xu J, Wang M, et al. LncRNA HCP5 promotes follicular thyroid carcinoma progression via miRNAs sponge. Cell Death Dis. 2018;9(3):372–383. | ||
Yu G, Yao W, Gumireddy K, et al. Pseudogene PTENP1 functions as a competing endogenous RNA to suppress clear-cell renal cell carcinoma progression. Mol Cancer Ther. 2014;13(12):3086–3097. | ||
Tay Y, Karreth FA, Pandolfi PP. Aberrant ceRNA activity drives lung cancer. Cell Res. 2014;24(3):259–260. | ||
Karreth FA, Reschke M, Ruocco A, et al. The BRAF pseudogene functions as a competitive endogenous RNA and induces lymphoma in vivo. Cell. 2015;161(2):319–332. | ||
Torre LA, Bray F, Siegel RL, Ferlay J, Lortet-Tieulent J, Jemal A. Global cancer statistics, 2012. CA Cancer J Clin. 2015;65(2):87–108. | ||
Sun J, Yan J, Yuan X, et al. A computationally constructed ceRNA interaction network based on a comparison of the SHEE and SHEEC cell lines. Cell Mol Biol Lett. 2016;21:21–33. | ||
Huang J, Zhang SY, Gao YM, et al. MicroRNAs as oncogenes or tumour suppressors in oesophageal cancer: potential biomarkers and therapeutic targets. Cell Prolif. 2014;47(4):277–286. | ||
Shang L, Wang M. Molecular alterations and clinical relevance in esophageal squamous cell carcinoma. Front Med. 2013;7(4):401–410. | ||
Nagaraja V, Eslick GD. Advances in biomarkers for esophageal cancer. Expert Rev Anticancer Ther. 2013;13(10):1169–1180. | ||
Sanchez-Mejias A, Tay Y. Competing endogenous RNA networks: tying the essential knots for cancer biology and therapeutics. J Hematol Oncol. 2015;8:30–38. | ||
Guo Y, Chen Z, Zhang L, et al. Distinctive microRNA profiles relating to patient survival in esophageal squamous cell carcinoma. Cancer Res. 2008;68(1):26–33. | ||
Gao J, Aksoy BA, Dogrusoz U, et al. Integrative analysis of complex cancer genomics and clinical profiles using the cBioPortal. Sci Signal. 2013;6(269):pl1. | ||
Cerami E, Gao J, Dogrusoz U, et al. The cBio cancer genomics portal: an open platform for exploring multidimensional cancer genomics data. Cancer Discov. 2012;2(5):401–404. | ||
Wong N, Wang X. miRDB: an online resource for microRNA target prediction and functional annotations. Nucleic Acids Res. 2015;43(Database issue):D146–D152. | ||
Wang X. Improving microRNA target prediction by modeling with unambiguously identified microRNA-target pairs from CLIP-ligation studies. Bioinformatics. 2016;32(9):1316–1322. | ||
Chou CH, Shrestha S, Yang CD, et al. miRTarBase update 2018: a resource for experimentally validated microRNA-target interactions. Nucleic Acids Res. 2018;46(D1):D296–D302. | ||
Lewis BP, Burge CB, Bartel DP. Conserved seed pairing, often flanked by adenosines, indicates that thousands of human genes are microRNA targets. Cell. 2005;120(1):15–20. | ||
Lewis BP, Shih IH, Jones-Rhoades MW, Bartel DP, Burge CB. Prediction of mammalian microRNA targets. Cell. 2003;115(7):787–798. | ||
Shannon P, Markiel A, Ozier O, et al. Cytoscape: a software environment for integrated models of biomolecular interaction networks. Genome Res. 2003;13(11):2498–2504. | ||
Jiao X, Sherman BT, Huang da W, et al. DAVID-WS: a stateful web service to facilitate gene/protein list analysis. Bioinformatics. 2012;28(13):1805–1806. | ||
Ashburner M, Ball CA, Blake JA, et al. Gene ontology: tool for the unification of biology. The Gene Ontology Consortium. Nat Genet. 2000;25(1):25–29. | ||
The Gene Ontology Consortium. Expansion of the Gene Ontology knowledgebase and resources. Nucleic Acids Res. 2017;45(D1):D331–D338. | ||
Mi H, Huang X, Muruganujan A, et al. PANTHER version 11: expanded annotation data from Gene Ontology and Reactome pathways, and data analysis tool enhancements. Nucleic Acids Res. 2017;45(D1):D183–D189. | ||
Zhao Y, Simon R. Development and validation of predictive indices for a continuous outcome using gene expression profiles. Cancer Inform. 2010;9:105–114. | ||
Xiao W, Wu Y, Zhou H. ConvexLAR: an extension of least angle regression. J Comput Graph Stat. 2015;24(3):603–626. | ||
Tanabe M, Kanehisa M. Using the KEGG database resource. Curr Protoc Bioinformatics. 2012;Chapter 1(Unit1):12. | ||
Kanehisa M, Goto S, Sato Y, Kawashima M, Furumichi M, Tanabe M. Data, information, knowledge and principle: back to metabolism in KEGG. Nucleic Acids Res. 2014;42(Database issue):D199–D205. | ||
Figliuzzi M, de Martino A, Marinari E. RNA-based regulation: dynamics and response to perturbations of competing RNAs. Biophys J. 2014;107(4):1011–1022. | ||
Karreth FA, Tay Y, Perna D, et al. In vivo identification of tumor- suppressive PTEN ceRNAs in an oncogenic BRAF-induced mouse model of melanoma. Cell. 2011;147(2):382–395. | ||
Yu G, Yao W, Gumireddy K, et al. Pseudogene PTENP1 functions as a competing endogenous RNA to suppress clear-cell renal cell carcinoma progression. Mol Cancer Ther. 2014;13(12):3086–3097. | ||
Fan M, Li X, Jiang W, Huang Y, Li J, Wang Z. A long non-coding RNA, PTCSC3, as a tumor suppressor and a target of miRNAs in thyroid cancer cells. Exp Ther Med. 2013;5(4):1143–1146. | ||
Wang L, Guo ZY, Zhang R, et al. Pseudogene OCT4-pg4 functions as a natural micro RNA sponge to regulate OCT4 expression by competing for miR-145 in hepatocellular carcinoma. Carcinogenesis. 2013;34(8):1773–1781. | ||
Xue WH, Fan ZR, Li LF, et al. Construction of an oesophageal cancer-specific ceRNA network based on miRNA, lncRNA, and mRNA expression data. World J Gastroenterol. 2018;24(1):23–34. | ||
Li D, Zhang Y, Zhang H, et al. CADM2, as a new target of miR-10b, promotes tumor metastasis through FAK/AKT pathway in hepatocellular carcinoma. J Exp Clin Cancer Res. 2018;37(1):46–56. | ||
Yang S, Yan HL, Tao QF, et al. Low CADM2 expression predicts high recurrence risk of hepatocellular carcinoma patients after hepatectomy. J Cancer Res Clin Oncol. 2014;140(1):109–116. | ||
Berger MF, Lawrence MS, Demichelis F, et al. The genomic complexity of primary human prostate cancer. Nature. 2011;470(7333):214–220. | ||
He W, Li X, Xu S, et al. Aberrant methylation and loss of CADM2 tumor suppressor expression is associated with human renal cell carcinoma tumor progression. Biochem Biophys Res Commun. 2013;435(4):526–532. | ||
Li X, Chen D, Li M, Gao X, Shi G, Zhao H. The CADM2/Akt pathway is involved in the inhibitory effect of miR-21-5p downregulation on proliferation and apoptosis in esophageal squamous cell carcinoma cells. Chem Biol Interact. 2018;288:76–82. | ||
Song J, Ye A, Jiang E, et al. Reconstruction and analysis of the aberrant lncRNA-miRNA-mRNA network based on competitive endogenous RNA in CESC. J Cell Biochem. 2018;119(8):6665–6673. | ||
Yao J, Zhou B, Zhang J, et al. A new tumor suppressor LncRNA ADAMTS9-AS2 is regulated by DNMT1 and inhibits migration of glioma cells. Tumour Biol. 2014;35(8):7935–7944. | ||
Liu C, Yang Z, Deng Z, et al. Upregulated lncRNA ADAMTS9-AS2 suppresses progression of lung cancer through inhibition of miR-223-3p and promotion of TGFBR3. IUBMB Life. 2018;70(6):536–546. | ||
Ocak Z, Acar M, Gunduz E, et al. Effect of hypericin on the ADAMTS-9and ADAMTS-8gene expression in MCF7 breast cancer cells. Eur Rev Med Pharmacol Sci. 2013;17(9):1185–1190. | ||
Tan YG, Zhang YF, Guo CJ, Yang M, Chen MY. Screening of differentially expressed microRNA in ulcerative colitis related colorectal cancer. Asian Pac J Trop Med. 2013;6(12):972–976. | ||
Ban J, Jug G, Mestdagh P, et al. Hsa-miR145 is the top EWS-FLI1-repressed microRNA involved in a positive feedback loop in Ewing’s sarcoma. Oncogene. 2011;30(18):2173–2180. | ||
Yu XM, Jaskula-Sztul R, Georgen MR, et al. Notch1 signaling regulates the aggressiveness of differentiated thyroid cancer and inhibits SERPINE1 expression. Clin Cancer Res. 2016;22(14):3582–3592. | ||
Mazzoccoli G, Pazienza V, Panza A, et al. ARNTL2 and SERPINE1: potential biomarkers for tumor aggressiveness in colorectal cancer. J Cancer Res Clin Oncol. 2012;138(3):501–511. | ||
Klimczak-Bitner AA, Kordek R, Bitner J, Musiał J, Szemraj J. Expression of MMP9, SERPINE1 and miR-134 as prognostic factors in esophageal cancer. Oncol Lett. 2016;12(5):4133–4138. | ||
Pan X, Zheng G, Gao C. LncRNA PVT1: a novel therapeutic target for cancers. Clin Lab. 2018;64(5):655–662. | ||
Cui M, You L, Ren X, Zhao W, Liao Q, Zhao Y. Long non-coding RNA PVT1 and cancer. Biochem Biophys Res Commun. 2016;471(1):10–14. | ||
Colombo T, Farina L, Macino G, Paci P. PVT1: a rising star among oncogenic long noncoding RNAs. Biomed Res Int. 2015;2015:1–10. |
 © 2018 The Author(s). This work is published and licensed by Dove Medical Press Limited. The
full terms of this license are available at https://www.dovepress.com/terms
and incorporate the Creative Commons Attribution
- Non Commercial (unported, 3.0) License.
By accessing the work you hereby accept the Terms. Non-commercial uses of the work are permitted
without any further permission from Dove Medical Press Limited, provided the work is properly
attributed. For permission for commercial use of this work, please see paragraphs 4.2 and 5 of our Terms.
© 2018 The Author(s). This work is published and licensed by Dove Medical Press Limited. The
full terms of this license are available at https://www.dovepress.com/terms
and incorporate the Creative Commons Attribution
- Non Commercial (unported, 3.0) License.
By accessing the work you hereby accept the Terms. Non-commercial uses of the work are permitted
without any further permission from Dove Medical Press Limited, provided the work is properly
attributed. For permission for commercial use of this work, please see paragraphs 4.2 and 5 of our Terms.