")
Back to Journals » OncoTargets and Therapy » Volume 9
RNA interference-mediated silencing of speckle-type POZ protein promotes apoptosis of renal cell cancer cells
Received 24 June 2015
Accepted for publication 10 November 2015
Published 20 April 2016 Volume 2016:9 Pages 2393—2402
DOI https://doi.org/10.2147/OTT.S91097
Checked for plagiarism Yes
Review by Single anonymous peer review
Peer reviewer comments 3
Editor who approved publication: Dr Faris Farassati
Xiaoxia Liu, Guiling Sun, Xiuju Sun
Department of Nephrology, Affiliated Hospital of Weifang Medical University, Weifang, People’s Republic of China
Abstract: This study aimed to investigate the effects of silencing the speckle-type POZ protein (SPOP) gene on renal cell cancer (RCC) cells and to explore its possible mechanism. The A498 and ACHN RCC cells were transfected with small interference RNA (siRNA)-SPOP by lipofection methods. The silencing efficiency was monitored by quantitative real-time polymerase chain reaction and Western blot. The effects of SPOP silencing on cell apoptosis, cell viability, colony formation ability, cell migration ability, and chemosensitivity to Sorafenib were assessed by flow cytometry, an MTT assay, a colony formation assay, a trans-well migration assay, and a CCK-8 assay, respectively. Its effects on the expression of several cytokines were determined by a protein microarray. Relevant signaling pathways were also analyzed. Compared with the control group, the cell apoptosis rate was significantly higher; the cell viability, the colony formation, and migration ability were significantly decreased in the siRNA-SPOP group. The protein microarray screening showed that the expression of vascular endothelial growth factor receptor, matrix metallopeptidase-9, vascular cell adhesion molecule-1, and stromal cell-derived factor-1 in the siRNA group was significantly decreased and that the expression of granulocyte–macrophage colony-stimulating factor and E-cadherin was significantly increased (P<0.05). The relevant signaling pathways were the integrin-mediated cell surface interactions pathway and extracellular matrix organization signal pathway. SPOP gene silencing induced cell apoptosis, decreased cell viability, colony formation, and migration ability, and elevated the drug sensitivity in the RCC cells. A possible mechanism is that silencing SPOP induces the differential expression of E-cadherin, vascular endothelial growth factor receptor, matrix metallopeptidase-9, and vascular cell adhesion molecule, which are related to the integrin-mediated cell surface interactions and extracellular matrix organization signaling pathway.
Keywords: signaling pathway, colony formation, antitumor, cytokines
Introduction
Renal cell cancer (RCC) is one of the most common genitourinary malignancies and accounts for ~3% of all adult malignancies.1 Approximately 30% of renal cell carcinoma patients are diagnosed in late stage with metastatic disease due to a lack of early warning clinical manifestations.2,3 In addition, RCC is resistant to radiotherapy and chemotherapy.4,5 Currently, the main therapy is a radical nephrectomy. However, recurrence remains high even after a radical nephrectomy, or a radical nephrectomy combined with immunotherapy and targeted therapy as adjunctive therapy.1 Therefore, a broadened and deepened understanding of the molecular mechanisms underlying RCC progression and a further exploration of novel biomarkers as well as novel therapeutic targets for the diagnosis and prognosis of RCC are of high importance.
Speckle-type POZ protein (SPOP) is a BTB/POZ domain protein, which contains a substrate-binding MATH domain and a CUL3-binding BTB domain, and has been identified as an adaptor for E3 ligase Cullin3 (Cul3).6 It has been indicated that dysregulation of the ubiquitin–proteasome pathway is involved in cancer pathogenesis.7,8 SPOP has been linked to ubiquitination of several substrates in Drosophila and human, such as Ci/Gli transcription factor, MacroH2A, death domain-associated protein (Dax), and steroid receptor coactivator-3.9 In Drosophila and humans, SPOP knockdown can promote the ubiquitination and degradation of the Gli to regulate the Hedgehog and tumor necrosis factor pathways.10,11 Furthermore, SPOP genomic locus assays have revealed that a high percentage of genomic loss or loss of heterozygosity occurs in breast cancers. Restoration of SPOP expression inhibits steroid receptor coactivator-3-mediated oncogenic signaling and tumorigenesis, thus positioning SPOP as a tumor suppressor in breast cancers.12 In prostate cancer, it has also been reported that SPOP is frequently mutated and its expression is often downregulated.13–15
However, it has been demonstrated that the SPOP protein is overexpressed in 85% of kidney cancers and that ~100% of primary and metastatic clear cell RCCs (ccRCCs) exhibit SPOP accumulation.10 This indicates that SPOP may be a useful biomarker to identify ccRCC as the site of primary tumors in cases of metastases from an unknown origin. Recently, Li et al found that hypoxia could drive the cytoplasmic accumulation of SPOP and that the accumulation of SPOP contributed to tumorigenesis in ccRCC by connecting a hypoxia response and ubiquitin-mediated degradation of tumor suppressors.16 These findings suggest that SPOP may be an oncogenic factor in RCC and a potential biomarker of or drug target for RCC. Therefore, further research to confirm the role of SPOP in RCC and to explore its possible mechanism is urgently needed.
In the present study, the comprehensive effects of silencing SPOP using small interference RNA (siRNA) technology on cell apoptosis, colony formation, migration ability, and drug sensitivity of RCC cells were assessed. Furthermore, a possible mechanism was explored by evaluating the differential expression of cytokines and performing a relevant signaling pathway analysis.
Materials and methods
Cell culture
Human kidney cancer cells A498 and ACHN were purchased from Cell Research Institute of Chinese Academy of Sciences (Shanghai, People’s Republic of China). The cells were maintained in Dulbecco’s Modified Eagle’s Medium (DMEM) supplemented with 10% fetal bovine serum (FBS) and cultured at 37°C under 5% CO2. As all human kidney cancer cells A498 and ACHN samples used in the study were purchased, the ethics committee of the Affiliated Hospital of Weifang Medical University decided the study did not need ethical approval.
Cell transfection
Once in the exponential growth phase, the A498 and ACHN cells were seeded in a six-well plate at a density 2×10⁵ and left to attach overnight. The cells were then divided into the following groups (four wells per group): control group (nontreatment group), negative control group (transfected with nonspecific siRNA-SPOP: sense 5′-UUCUCCGAACGUGUCACGUTT-3′, antisense 3′-TTAAGAGGCUUGCACAG-5′), and siRNA-SPOP group (siRNA1: sense 5′-AGAUCAAGGUAGUGAAAUUUU-3′, antisense 3′-AAUUUCACUACCUUGAUCUUU-5′; siRNA2: sense 5′-GGUGAAGAGGGAACAGAAAUU-3′, antisense 3′-UUCCACUUCUCCCUUGUCUUU-5′). The siRNA sequence was constructed by GE Dharmacon (GE Healthcare Ltd, Little Chalfont, UK). After washing with DMEM free of FBS, the cells were transfected with siRNA-SPOP and siRNA-SPOP negative control using Lipofectamine 2000 (Invitrogen, Carlsbad, CA, USA) according to the manufacturer’s instructions. After an incubation for 4 hours at 37°C, the medium was replaced with DMEM supplemented with 10% FBS.
Quantitative real-time polymerase chain reaction
The silencing efficiency of SPOP at RNA level was assessed by quantitative real-time polymerase chain reaction (PCR). The glyceraldehyde-3-phosphate dehydrogenase (GAPDH) gene served as the internal reference. Total cellular RNA was extracted using a TRIZOL reagent (Invitrogen). The cDNA was synthesized according to a reverse transcription kit (Takara, Kusatsu, Japan). SYBR Green real-time PCR was performed using a Light Cycler 2.0 Real-Time PCR System (Roche, Basel, Switzerland) with SYBR Green Real-Time PCR Master Mix (Toyobo Co., Ltd., Osaka, Japan) according to the manufacturer’s instructions. The PCR was initiated with a 10-second pre-denaturation at 95°C. Amplification was carried out for 40 cycles of denaturation for 10 seconds at 95°C, annealing (SPOP, 62°C; GAPDH, 58°C) for 5 seconds, and extension for 10 seconds at 72°C. Primers were designed by primer 5 and synthesized by SBS Genetech Co. Ltd (Beijing, People’s Republic of China). The primer of SPOP was F 5′-GCCCCGTAGCTGAGAGTTG-3′ and R 5′-ACTCGCAAACACCATTTCAGT-3′. The primer of GAPDH was F 5′-GCACCGTCAAGGCTGAGAAC-3′ and R 5′-TGGTGAAGACGCCAGTGGA-3′. The expression level was determined by a 2−ΔΔCt analysis.
Western blot
The silence efficiency of SPOP at the protein level was assessed by a Western blot. The concentration of total protein was measured by a BCA Protein Assay Kit (Keygen, Nanjing, People’s Republic of China). Equal amounts (50 μg) of lysis proteins were separated on sodium dodecyl sulfate polyacrylamide gels. GAPDH was used as an internal loading control. After incubating with the primary antibody for anti-SPOP or anti-GAPDH (Santa Cruz Biotechnology, Dallas, TX, USA) at a dilution of 1:1,000 at 4°C overnight, the membranes were probed with secondary antibodies at a dilution of 1:5,000 at room temperature for 2 hours. The signals were detected using an enhanced chemiluminescence detection system (Multimager; Alpha Innotech, San Leandro, CA, USA). The gray value of the protein bands was assessed by ImageJ software.17
Cell apoptosis analysis by flow cytometry
Cells in exponential growth were seeded in the six-well plate at a density 1×10⁶/mL for 24 hours to enable attachment. After transfecting with the siRNA for 48 hours, the cells were digested with 0.25% trypsin and centrifuged at 5,000× g for 5 minutes. The cell precipitate was washed three times with phosphate-buffered saline (PBS) and fixed by 70% cold ethanol for 30 minutes on ice. The cells were then washed twice with PBS, and the cellular precipitation was resuspended and added to 50 μL propidium iodide. After incubating for 15 minutes at room temperature in the dark, cell cycle distribution was detected by a flow cytometer (Elite Esp; Beckman Coulter, Brea, CA, USA).
Cell viability assay
The effect of SPOP silencing on cell viability was detected by 3-(4,5-dimethylthiazol-2-yl)-2,5-diphenyltetrazolium bromide (MTT) assay. Briefly, the cells seeded in the 96-well plate were incubated with 0.5 mg/mL MTT (Sigma-Aldrich, St Louis, MO, USA) at 37°C for 4 hours. The medium was then removed, and 150 μL dimethylsulfoxide (DMSO) was added to each well. The formazan product was dissolved in the DMSO and measured colorimetrically at 490 nm by a microplate reader (Biotek Instruments, Winooski, VT, USA). The background was measured at 650 nm after an extraction with 150 μL DMSO.
Soft agar colony formation assay
Cells in exponential growth were harvested using 0.25% trypsin and resuspended to a single-cell suspension of 1×10⁶/mL cells with DMEM supplemented with 20% FBS. A bottom layer (1.2% low-melt agarose) was prepared equally with 2× DMEM supplemented with 15% FBS and 1.2% low-melt agarose (1:1). A top layer (0.7% low-melt agarose) was prepared equally with the same medium and 0.7% low-melt agarose plus 0.2 mL of the indicated cells. After incubating for ~2 weeks at 37°C under 5% CO2 in a humidified incubator, the numbers of colonies were counted. The colony-forming efficiency (%) = colony numbers/cell inoculation numbers ×100.
Trans-well migration assay
Cells were adjusted to a single-cell suspension of 5×10⁵/mL cells. A 100 μL cell suspension was then placed in each insert chamber containing medium free of FBS, while the medium in the lower chamber contained 10% FBS. After incubating for 6 hours, the chamber was washed twice with PBS, and the cells on the apical side of each insert were scraped off using Q-tips. The cells that had migrated and attached to the lower surface of the insert were fixed with 4% formaldehyde and stained with crystal violet for 20 minutes. After washing with PBS and air drying, the number of cells that had migrated through the Matrigel membrane was counted randomly in five scopes under a microscope (×400). The migration rate was calculated using the following formula: migration rate (%) = the cell migrated numbers/cell inoculation numbers ×100.
Drug sensitivity assay
To assess the chemosensitivity of cells to the chemotherapy drug Sorafenib, the cells were seeded on 96-well plates at 1×10⁴ cells/well in triplicate. They were treated with serial concentrations of Sorafenib (0, 3.125, 6.25, 12.5, 25, 50, 100, and 200 nmol/L) for 24 hours. The cells were then treated with CCK-8 for 4 hours according to the CCK-8 kit instructions (Dojindo, Kumamoto, Japan). The absorbance was measured at 450 nm by a microplate reader (Biotek Instruments). The inhibitory rate of Sorafenib on the cells was calculated using the following formula: inhibitory rate (%) = (1 – A/B) ×100, where A represents the optical density value of experimental group and B represents the optical density value of control group. The half maximal inhibitory concentration (IC50) of the cells to Sorafenib was obtained from a dose–response curve.
Protein microarray
The effects of SPOP silencing on the expression of cytokine were analyzed by an AAH-CUST-G antibody array based on a double-monocloned antibody. Equal amounts (50 μg) of proteins were used for the analysis. A total of 30 cytokine antibodies were immobilized on glass slides: chemokine (C-X-C motif) receptor 4 (CXCR4), interleukin (IL)-2, matrix metallopeptidase (MMP)-2, MMP-9, stromal cell-derived factor-1 (SDF-1), Survivine, vascular cell adhesion molecule (VCAM)-1, vascular endothelial growth factor (VEGF), VEGF receptor (VEGFR), L-selectin, macrophage colony-stimulating factor, MMP-1, MMP-13, granulocyte–macrophage colony-stimulating factor (GM-CSF), growth-related oncogene alpha, IL-1 alpha, IL-1 beta, IL-3, E-cadherin, intercellular adhesion molecule-1, IL-6, IL-10, tumor necrosis factor-α, transforming growth factor-β, interferon-γ, epidermal growth factor, Angiogenin, P-Selectin, hepatocyte growth factor, and brain-derived neurotrophic factor. The procedure was performed according to an AAH-CUST-G antibody array kit (RayBiotech, Norcross, GA, USA). Briefly, the arrays (membranes) were first blocked with blocking buffer at 4°C overnight. After decanting the blocking buffer, 100 μL samples were added to each well and incubated at 4°C overnight on a shaker. After washing four times with a wash buffer (5 minutes per wash), 1 mL biotin-conjugated antibody was added and incubated at room temperature for 2 hours. After washing, 1 mL horse radish peroxidase-conjugated streptavidin was added and then incubated at room temperature for 1.5 hours. The fluorescence signal was scanned at 532 nm by a GenePix® Microarray Scanner (Molecular Devices, Sunnyvale, CA, USA), and the signal value was extracted by GenePix 4000B software. The signal value was normalized to a positive control.
The analysis of differential genes-related signaling pathways
To identify the signaling pathway related to the differential cytokines induced by SPOP silencing, a signaling pathway analysis using KOBAS 2.0 software was performed as described in a previous study.18,19 Pathways with false discovery rate-corrected P-values <0.05 were considered statistically significant.
Statistical analysis
Statistical data were expressed as means ± standard deviation. Comparisons between the different groups were performed using Student’s t-test. P<0.05 was considered statistically significant. All data were analyzed by SPSS 20.0 software.
Results
The silencing efficiency of SPOP in the A498 and ACHN cells
The expression of SPOP after the transfection with siRNA-SPOP was detected by quantitative real-time polymerase chain reaction and Western blot. As the results show in Figure 1A, the SPOP mRNA levels in the A498 cells after the transfection with siRNA1 or siRNA2 were 0.023±0.008 and 7.39±0.19, respectively, which were significantly decreased compared with the negative control group (9.35±0.11) and the blank control group (9.69±0.12) (P<0.01). Consistently, the SPOP protein level in the A498 cells (Figure 1B) after the transfection with siRNA1 was 0.039±0.011, which was significantly lower than that in the siRNA2 group (9.39±0.26), negative control group (10.11±0.21), and blank control group (9.98±0.09) (P<0.01). These results showed that the interference efficiency of siRNA1 was superior to siRNA2 at the mRNA and protein levels. Moreover, no significant difference was observed between the negative control group and the blank control group. Similar results were found in the ACHN cells (Figure 1C and D). Therefore, siRNA1 was used for the following transfection experiments.
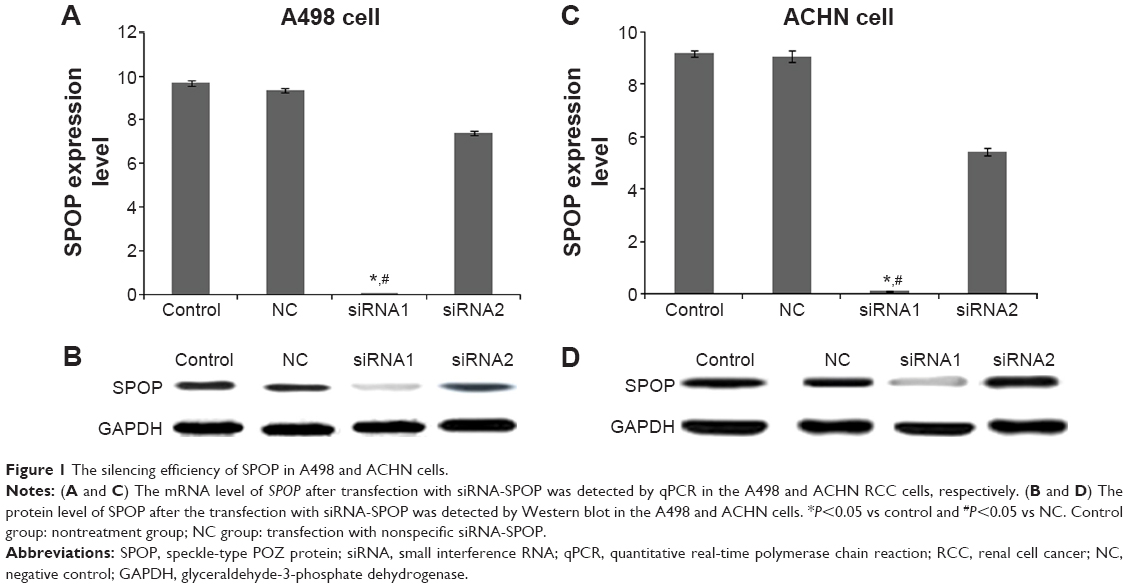 | Figure 1 The silencing efficiency of SPOP in A498 and ACHN cells. |
The effects of SPOP silencing on cell apoptosis
The flow cytometry assay showed that the cell apoptosis rate in the A498 cells (Figure 2A and B) after being transfected with siRNA1-SPOP was 70%±2.34%, which was significantly higher than that in the negative control group (12.27%±1.76%, P<0.05) and the blank control group (12.27%±1.76%, P<0.05). No significant difference was present between the negative control group and the blank control group. In addition, similar results were found in the ACHN cells (Figure 2A and C). These results suggested that SPOP silencing induced the apoptosis of the kidney cancer cells. The MTT assay revealed that the transfection of siRNA1-SPOP also induced a remarkable decrease in cell viability in the A498 and ACHN cells (Figure 2D and E, P<0.05).
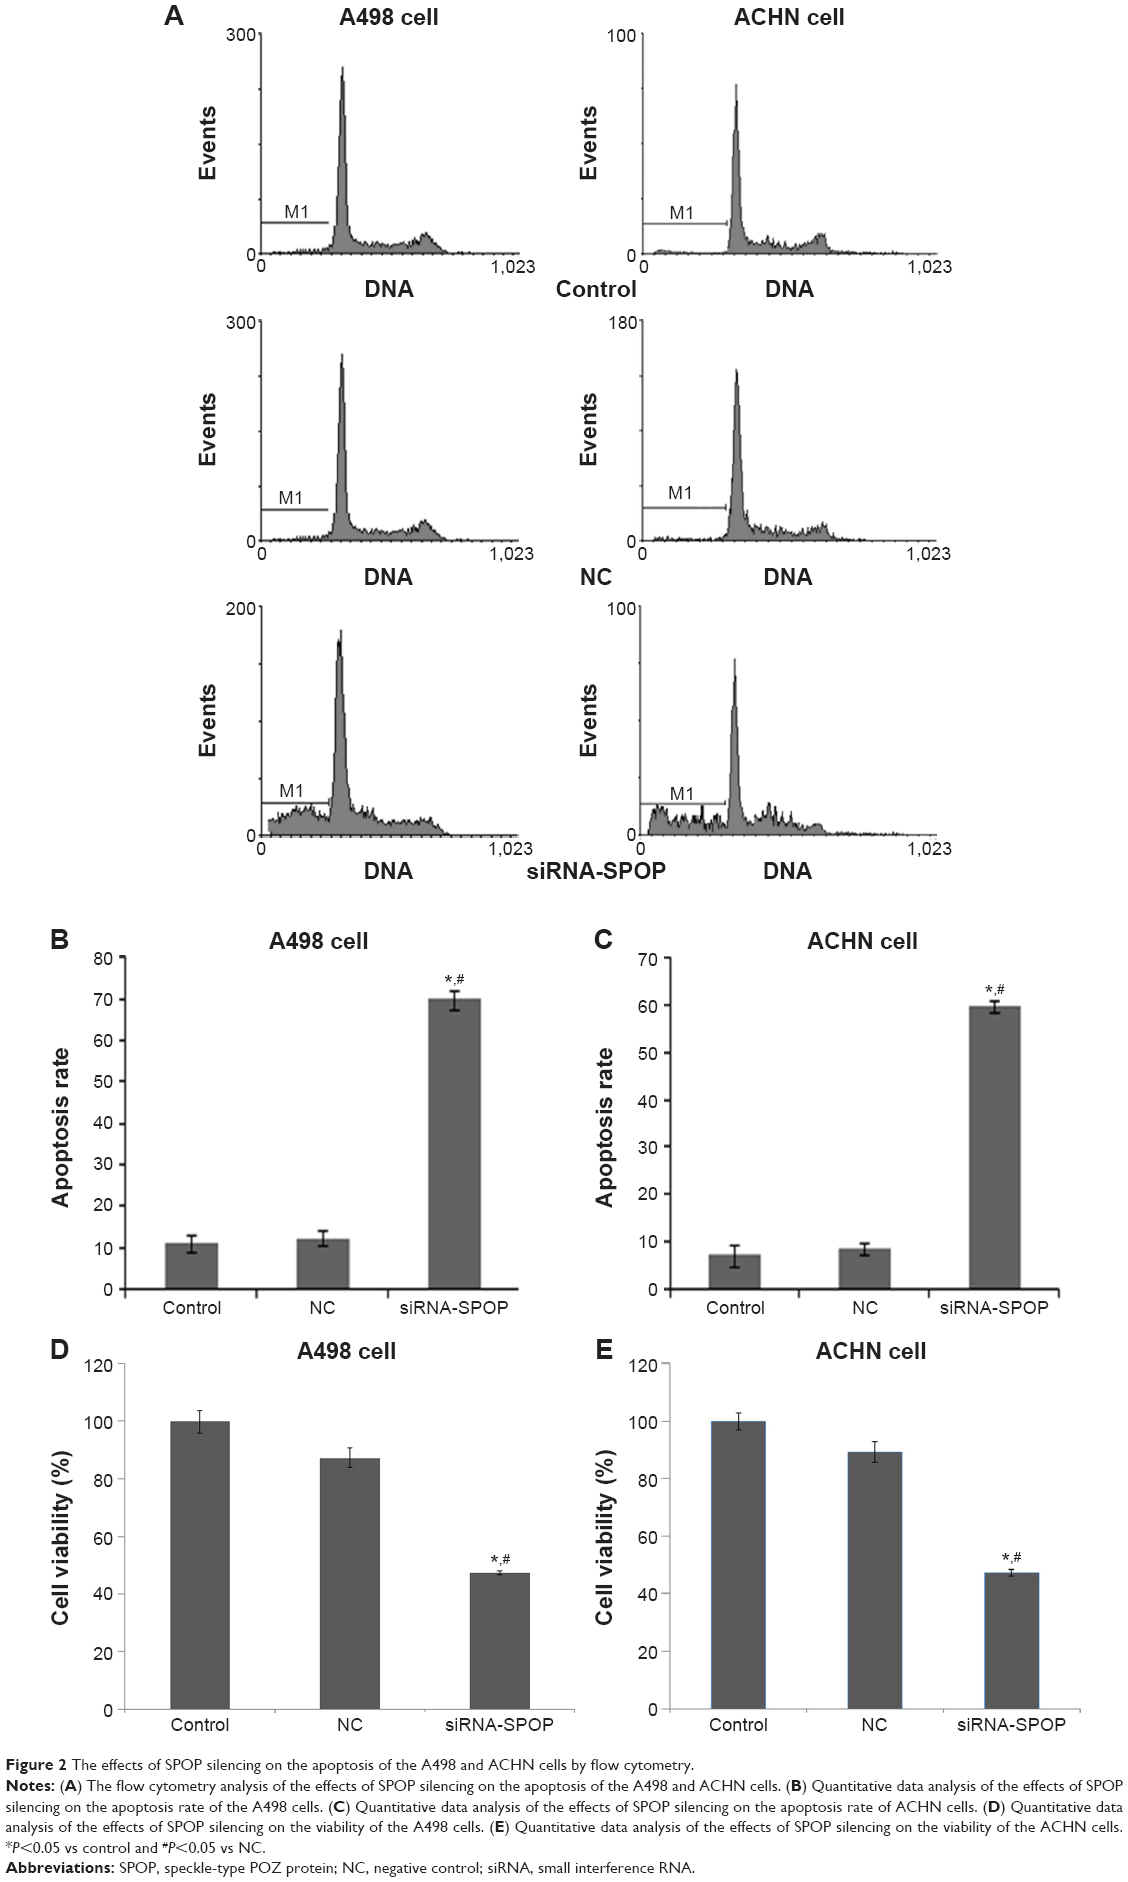 | Figure 2 The effects of SPOP silencing on the apoptosis of the A498 and ACHN cells by flow cytometry. |
The effects of SPOP silencing on colony formation of the kidney cancer cells
Colony formation is considered a key characteristic of cancer cells and is commonly used in in vitro cancer research.20 The results of the colony formation assay showed that the colony formation efficiency in the A498 cells after the transfection with siRNA1-SPOP was 30%±1.2%, which was significantly reduced compared with the negative control group (79%±2.1%) and the blank control group (86%±2.3%) (P<0.05). There was no significant difference between the negative control group and the blank control group. Similarly in the ACHN cells, the SPOP silencing markedly reduced the colony formation compared with the negative control group and the blank control group (Figure 3A and B). These results suggested that the SPOP silencing inhibited the colony formation of the RCC cells.
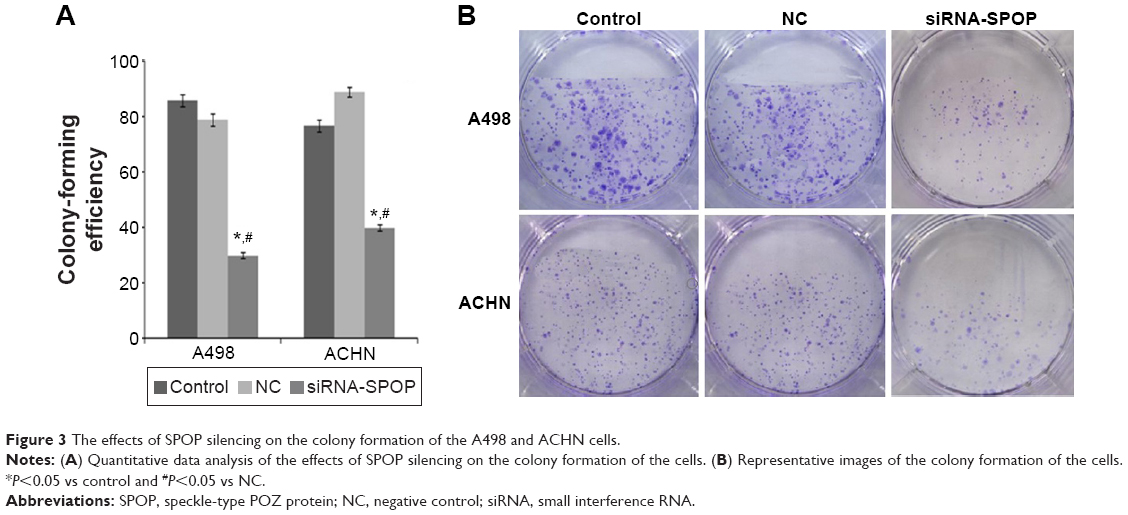 | Figure 3 The effects of SPOP silencing on the colony formation of the A498 and ACHN cells. |
The effects of SPOP silencing on the migration ability of the kidney cancer cells
The results of the trans-well migration assays (Figure 4A and B) showed that compared with the negative control group (79%±1.9%) and the blank control group (83%±3.1%) (P<0.01), a significantly decreased migration rate was found in the A498 cells after the transfection with siRNA1-SPOP (22%±0.3%). No significant difference between the negative control group and the blank control group was shown. The results in the ACHN cells coincidently displayed that the SPOP silencing decreased the cell migration ability.
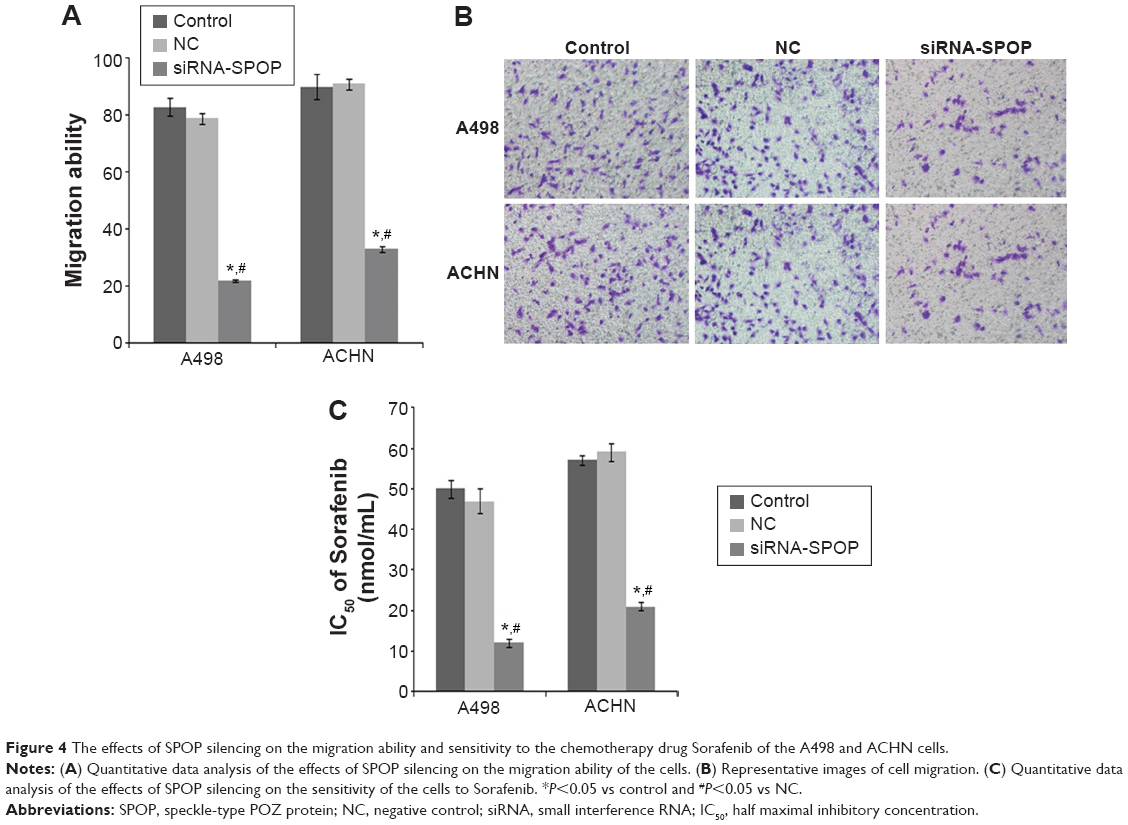 | Figure 4 The effects of SPOP silencing on the migration ability and sensitivity to the chemotherapy drug Sorafenib of the A498 and ACHN cells. |
The effects of SPOP silencing on the chemosensitivity of the RCC cells to the chemotherapy drug
The results showed that in the SPOP silencing group, the IC50 of Sorafenib was 12±1.13 nmol/mL. A significant discrepancy (P<0.01) was found between the negative control group (47±3.16 nmol/mL) and the blank control group (50±2.11 nmol/mL). In the ACHN cells, the results were similar to the A498 cells (Figure 4C). These data suggest that the SPOP silencing increased the chemosensitivity of the RCC cells to the chemotherapy drug Sorafenib.
The effects of SPOP silencing on the expression of cytokine
The results of the protein microarray demonstrated that, compared with the negative control group and the blank control group, the expression of VEGFR, MMP-9, VCAM-1, and SDF-1 was markedly downregulated and the expression of E-cadherin and GM-CSF was significantly upregulated in the SPOP silencing group (P<0.05) (Table 1).
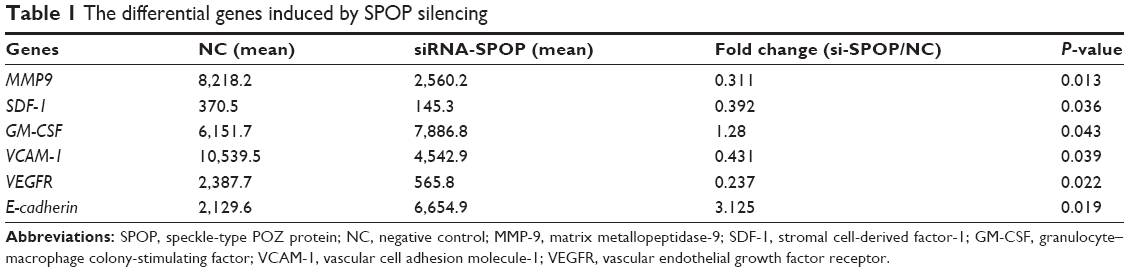 | Table 1 The differential genes induced by SPOP silencing |
Analysis of the differential cytokines involved in the signal pathway
The statistical analysis found that the differential expression of cytokines induced by silencing SPOP was significantly associated with 40 signaling pathways (P<0.05, Table 2). Two of the most important pathways were the integrin-mediated cell surface interactions and extracellular matrix organization signaling pathways (P<0.001).
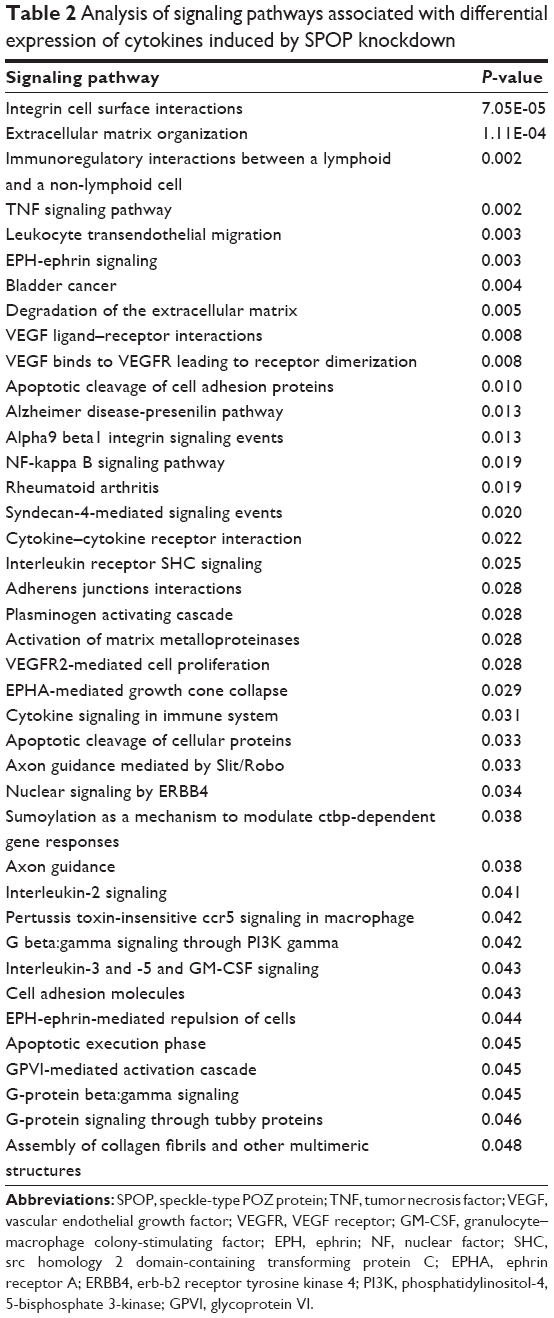 | Table 2 Analysis of signaling pathways associated with differential expression of cytokines induced by SPOP knockdown |
Discussion
Recently, various prognostic markers of RCC have been discovered on the basis of extensive clinical and basic research efforts. However, they are not specific or sensitive enough to accurately predict the survival of RCC patients.3,21 Therefore, finding additional prognostic biomarkers to identify RCC patients is highly imperative. Several studies have demonstrated that SPOP plays important roles during cell apoptosis, proliferation, and animal development.10,15 It has been reported that SPOP is highly expressed in RCC, but the function and mechanism of SPOP involved in RCC remain unclear. The current study systematically investigated the potential role of SPOP in RCC. The results indicated that SPOP gene silencing induced cell apoptosis, decreased cell viability, decreased colony formation and migration ability, and elevated drug sensitivity in the RCC cells. The possible mechanism we demonstrated was that SPOP silencing induced the downregulation of VEGFR, MMP-9, and VCAM and upregulation of E-cadherin, which were related to the integrin-mediated cell surface interactions and extracellular matrix organization signaling pathway.
Previous studies found that SPOP is predominately localized in the nucleus of HEK293 cells or normal kidney tissue but that it accumulates in the cytoplasm of RCC cells.16,22 SPOP accumulation in the cytoplasm is found to enhance cell proliferation and induce apoptosis in RCC cells.16 Therefore, in the present study, A498 cells and ACHN cells were the RCC cells chosen as the interference cell model. Expectedly, SPOP silencing in the A498 cells and ACHN cells significantly exacerbated cell apoptosis and decreased cell viability. In addition to cell apoptosis, SPOP also plays a regulatory role in cell migration and colony formation. For example, it has been reported that SPOP overexpression suppressed cell migration and clone formation of colorectal cancer cells.23 Similarly, SPOP has also been reported to inhibit the proliferation and migration of liver cancer cells.24 On the contrary, the results of the colony formation assay in the current study indicated that silencing SPOP inhibited the colony formation ability. The trans-well migration assay also indicated that silencing SPOP attenuated the migration ability of the RCC cells. All the above results demonstrated that SPOP exhibited an oncogenic role.
Sorafenib is a novel oral multiple-targeted agent that prevents tumor-cell proliferation and tumor angiogenesis by inhibiting multiple kinases, such as Raf kinase and VEGFR.25 Clinical trials have demonstrated that Sorafenib is effective in the treatment of patients with advanced renal cell carcinoma and significantly prolongs progression-free survival and overall survival of these patients.26,27 It has been approved to be used in the treatment of patients with advanced RCC. The current analysis further assessed the effects of silencing SPOP on the sensitivity of RCC cells to Sorafenib. The results indicated that silencing SPOP elevated the sensitivity of RCC cells to Sorafenib. The current results provide an insight that the combined application of Sorafenib and a gene therapy targeted to SPOP is likely to exert better clinical treatment effects on RCC.
The purpose of this study was to investigate the possible mechanism of SPOP in the development of RCC. The differential expression analysis revealed that silencing SPOP downregulated the expression of VEGFR, MMP-9, VCAM-1, and SDF-1, and upregulated the expression of E-cadherin and GM-CSF. These cytokines have been reported to be involved in the progression of RCC. For example, the VEGFR signal transduction pathway contributes to the growth and metastasis of RCC by promoting tumor angiogenesis.28 Sorafenib is an efficient inhibitor of VEGFR. This indicates that SPOP knockdown might strengthen the sensitivity of RCC cells to Sorafenib partly via downregulating VEGFR. Additionally, RCC has a high positive expression of VCAM-1 in comparison with other cancers or normal renal tissues. RCC may exploit VCAM-1 to escape from immune surveillance and attack.29 SDF-1 plays an important role in regulating RCC organ-specific metastasis via interaction with its receptor CXCR4.30 The high expression of MMP-9 in RCC is associated with a high frequency of metastases and poor survival.31 E-cadherin is the key factor in the epithelial-to-mesenchymal transition process which is tightly related to the metastasis of RCC.32 Furthermore, the relevant signal pathway analysis consistently indicated that SPOP might be involved in integrin-mediated cell surface interactions and extracellular matrix organization signaling pathway by inducing differential expression of some cytokines. The above data provide insights that SPOP may be involved in the progression of RCC by influencing the migration and invasion of RCC cells.
Previous studies have found that a hypoxic response mediated through hypoxia-inducible factors (HIFs) is particularly important in kidney cancers.33,34 Hypoxia leads to cytoplasmic accumulation of SPOP which further induces tumorigenesis.16 Meanwhile, several studies have found that HIFs can induce the expression of VEGF and CXCR4.35,36 Deregulation of HIFs is linked to downregulation of E-cadherin and induction of the epithelial-to-mesenchymal transition.37 These data suggest that the accumulation of SPOP induced by hypoxia may be involved in tumorigenesis by further inducing the differential expression of some cytokines and provide valuable evidence for the further research of the mechanism of SPOP in the development of RCC.
This preliminary study has some limitations. More studies are warranted to validate and extend the findings of the study. The role of SPOP in the chemosensitivity of RCC cells to Sorafenib will be further explored by performing a microarray analysis to compare the cells treated with Sorafenib and the siRNA1-SPOP-transfected cells treated with Sorafenib. Moreover, further studies should also address if the changes in the cytokines (VEGFR, MMP-9, VCAM-1, SDF-1, E-cadherin, and GM-CSF) were concurrent or downstream of SPOP silencing, or upstream regulators of cell apoptosis.
The results from this study suggest that SPOP gene silencing induces cell apoptosis, decreases cell viability, decreases colony formation and migration ability, and elevates drug sensitivity in RCC cells. One possible mechanism is that silencing SPOP induces differential expression of E-cadherin, VEGFR, MMP-9, and VCAM, which are related to the integrin-mediated cell surface interactions and extracellular matrix organization signaling pathways. These findings confirm the oncogenic role of SPOP in RCC and suggest that RNA interference-mediated SPOP silencing may be a promising and innovative anticancer therapy for RCC. However, for future clinical applications, the specific mechanism of SPOP in the progression of RCC needs further research.
Disclosure
All authors report no conflicts of interest in this work.
References
Zhang Z, Li J, Zheng H, et al. Expression and cytoplasmic localization of sam68 is a significant and independent prognostic marker for renal cell carcinoma. Cancer Epidemiol Biomarkers Prev. 2009;18:2685–2693. | ||
Ho PY, Chueh SC, Chiou SH, et al. Alphab-crystallin in clear cell renal cell carcinoma: tumor progression and prognostic significance. Urol Oncol. 2013;31:1367–1377. | ||
Wu XR, Sha JJ, Liu DM, et al. High expression of p53-induced ring-h2 protein is associated with poor prognosis in clear cell renal cell carcinoma. Eur J Surg Oncol. 2013;39:100–106. | ||
Rini BI, Atkins MB. Resistance to targeted therapy in renal-cell carcinoma. Lancet Oncol. 2009;10:992–1000. | ||
Belldegrun AS, Klatte T, Shuch B, et al. Cancer-specific survival outcomes among patients treated during the cytokine era of kidney cancer (1989–2005): a benchmark for emerging targeted cancer therapies. Cancer. 2008;113:2457–2463. | ||
Zhuang M, Calabrese MF, Liu J, et al. Structures of spop-substrate complexes: insights into molecular architectures of btb-cul3 ubiquitin ligases. Mol Cell. 2009;36:39–50. | ||
Hoeller D, Dikic I. Targeting the ubiquitin system in cancer therapy. Nature. 2009;458:438–444. | ||
Hoeller D, Hecker CM, Dikic I. Ubiquitin and ubiquitin-like proteins in cancer pathogenesis. Nat Rev Cancer. 2006;6:776–788. | ||
An J, Wang C, Deng Y, Yu L, Huang H. Destruction of full-length androgen receptor by wild-type spop, but not prostate-cancer-associated mutants. Cell Rep. 2014;6:657–669. | ||
Liu J, Ghanim M, Xue L, et al. Analysis of drosophila segmentation network identifies a jnk pathway factor overexpressed in kidney cancer. Science. 2009;323:1218–1222. | ||
Zhang Q, Zhang L, Wang B, et al. A hedgehog-induced btb protein modulates hedgehog signaling by degrading ci/gli transcription factor. Dev Cell. 2006;10:719–729. | ||
Li C, Ao J, Fu J, et al. Tumor-suppressor role for the spop ubiquitin ligase in signal-dependent proteolysis of the oncogenic co-activator src-3/aib1. Oncogene. 2011;30:4350–4364. | ||
Barbieri CE, Baca SC, Lawrence MS, et al. Exome sequencing identifies recurrent spop, foxa1 and med12 mutations in prostate cancer. Nat Genet. 2012;44:685–689. | ||
Berger MF, Lawrence MS, Demichelis F, et al. The genomic complexity of primary human prostate cancer. Nature. 2011;470:214–220. | ||
Kim MS, Je EM, Oh JE, Yoo NJ, Lee SH. Mutational and expressional analyses of spop, a candidate tumor suppressor gene, in prostate, gastric and colorectal cancers. APMIS. 2013;121:626–633. | ||
Li G, Ci W, Karmakar S, et al. Spop promotes tumorigenesis by acting as a key regulatory hub in kidney cancer. Cancer Cell. 2014;25:455–468. | ||
Abràmoff MD, Magalhães PJ, Ram SJ. Image processing with imagej. Biophoton Int. 2004;11:36–43. | ||
Xie C, Mao X, Huang J, et al. Kobas 2.0: a web server for annotation and identification of enriched pathways and diseases. Nucleic Acids Res. 2011;39:W316–W322. | ||
Shi YH, Zhu SW, Mao XZ, et al. Transcriptome profiling, molecular biological, and physiological studies reveal a major role for ethylene in cotton fiber cell elongation. Plant Cell. 2006;18:651–664. | ||
Peng HS, Liao MB, Zhang MY, et al. Synergistic inhibitory effect of hyperbaric oxygen combined with sorafenib on hepatoma cells. PLoS One. 2014;9:e100814. | ||
Eichelberg C, Junker K, Ljungberg B, Moch H. Diagnostic and prognostic molecular markers for renal cell carcinoma: a critical appraisal of the current state of research and clinical applicability. Eur Urol. 2009;55:851–863. | ||
Bunce MW, Boronenkov IV, Anderson RA. Coordinated activation of the nuclear ubiquitin ligase cul3-spop by the generation of phosphatidylinositol 5-phosphate. J Biol Chem. 2008;283:8678–8686. | ||
Xu J, Wang F, Jiang H, et al. Properties and clinical relevance of speckle-type poz protein in human colorectal cancer. J Gastrointest Surg. 2015;19:1484–1496. | ||
Huang Y, Tan N, Jia D, et al. Speckle-type poz protein is negatively associated with malignancies and inhibits cell proliferation and migration in liver cancer. Tumor Biol. 2015;36(12):9753–9761. | ||
Escudier B, Eisen T, Stadler WM, et al. Sorafenib in advanced clear-cell renal-cell carcinoma. N Engl J Med. 2007;356:125–134. | ||
Escudier B, Szczylik C, Hutson TE, et al. Randomized phase ii trial of first-line treatment with sorafenib versus interferon alfa-2a in patients with metastatic renal cell carcinoma. J Clin Oncol. 2009;27:1280–1289. | ||
Yang L, Shi L, Fu Q, et al. Efficacy and safety of sorafenib in advanced renal cell carcinoma patients: results from a long-term study. Oncol Lett. 2012;3:935–939. | ||
Wang X, Bullock AJ, Zhang L, et al. The role of angiopoietins as potential therapeutic targets in renal cell carcinoma. Transl Oncol. 2014;7:188–195. | ||
Wu TC. The role of vascular cell adhesion molecule-1 in tumor immune evasion. Cancer Res. 2007;67:6003–6006. | ||
Pan J, Mestas J, Burdick MD, et al. Stromal derived factor-1 (sdf-1/cxcl12) and cxcr4 in renal cell carcinoma metastasis. Mol Cancer. 2006;5:56. | ||
Cho NH, Shim HS, Rha SY, et al. Increased expression of matrix metalloproteinase 9 correlates with poor prognostic variables in renal cell carcinoma. Eur Urol. 2003;44:560–566. | ||
Banumathy G, Cairns P. Signaling pathways in renal cell carcinoma. Cancer Biol Ther. 2010;10:658–664. | ||
Chi J-T, Wang Z, Nuyten DSA, et al. Gene expression programs in response to hypoxia: cell type specificity and prognostic significance in human cancers. PLoS Med. 2006;3:e47. | ||
Schioppa T, Uranchimeg B, Saccani A, et al. Regulation of the chemokine receptor cxcr4 by hypoxia. J Exp Med. 2003;198:1391–1402. | ||
Kaelin WG Jr. The von hippel-lindau tumour suppressor protein: O2 sensing and cancer. Nat Rev Cancer. 2008;8:865–873. | ||
Zagzag D, Krishnamachary B, Yee H, et al. Stromal cell-derived factor-1alpha and cxcr4 expression in hemangioblastoma and clear cell-renal cell carcinoma: von hippel-lindau loss-of-function induces expression of a ligand and its receptor. Cancer Res. 2005;65:6178–6188. | ||
Esteban MA, Tran MG, Harten SK, et al. Regulation of e-cadherin expression by vhl and hypoxia-inducible factor. Cancer Res. 2006;66:3567–3575. |
 © 2016 The Author(s). This work is published and licensed by Dove Medical Press Limited. The full terms of this license are available at https://www.dovepress.com/terms.php and incorporate the Creative Commons Attribution - Non Commercial (unported, v3.0) License.
By accessing the work you hereby accept the Terms. Non-commercial uses of the work are permitted without any further permission from Dove Medical Press Limited, provided the work is properly attributed. For permission for commercial use of this work, please see paragraphs 4.2 and 5 of our Terms.
© 2016 The Author(s). This work is published and licensed by Dove Medical Press Limited. The full terms of this license are available at https://www.dovepress.com/terms.php and incorporate the Creative Commons Attribution - Non Commercial (unported, v3.0) License.
By accessing the work you hereby accept the Terms. Non-commercial uses of the work are permitted without any further permission from Dove Medical Press Limited, provided the work is properly attributed. For permission for commercial use of this work, please see paragraphs 4.2 and 5 of our Terms.