")
Back to Journals » Journal of Hepatocellular Carcinoma » Volume 11
Risks and Clinical Predictors of Hepatocellular Carcinoma in Chinese Populations: A Real-World Study of 10,359 Patients in Six Medical Centers
Authors Huang C , Xiao X, Tong L, Gao Z, Ji J, Zhou L, Li Y, Liu L, Feng H, Fang M, Gao C
Received 1 November 2023
Accepted for publication 7 February 2024
Published 27 February 2024 Volume 2024:11 Pages 411—425
DOI https://doi.org/10.2147/JHC.S447700
Checked for plagiarism Yes
Review by Single anonymous peer review
Peer reviewer comments 2
Editor who approved publication: Dr Ahmed Kaseb
Chenjun Huang,1,* Xiao Xiao,1,* Lin Tong,2,* Zhiyuan Gao,1 Jun Ji,2 Lin Zhou,3 Ya Li,4 Lijuan Liu,5 Huijuan Feng,5 Meng Fang,2 Chunfang Gao1,2
1Department of Clinical Laboratory Medicine Center, Yueyang Hospital of Integrated Traditional Chinese and Western Medicine, Shanghai University of Traditional Chinese Medicine, Shanghai, 200437, People’s Republic of China; 2Department of Laboratory Medicine, Shanghai Eastern Hepatobiliary Surgery Hospital, Shanghai, 200438, People’s Republic of China; 3Department of Laboratory Medicine, Shanghai Changzheng Hospital, Shanghai, 200003, People’s Republic of China; 4Department of Laboratory Medicine, The First Affiliated Hospital of Kunming Medical University, Kunming, 650032, People’s Republic of China; 5Department of Laboratory Medicine, Mengchao Hepatobiliary Hospital of Fujian Medical University, Fuzhou, 350025, People’s Republic of China
*These authors contributed equally to this work
Correspondence: Chunfang Gao, Department of Clinical Laboratory Medicine Center, Yueyang Hospital of Integrated Traditional Chinese and Western Medicine, Shanghai University of Traditional Chinese Medicine, Shanghai, 200437, People’s Republic of China, Tel +86-21-65161782-1210, Email [email protected]; [email protected]
Purpose: Early detection of hepatocellular carcinoma (HCC) through surveillance could reduce this cancer-associated mortality. We aimed to develop and validate algorithms using panel serum biomarkers to identify HCC in a real-world multi-center study in China.
Patients and Methods: A total of 10,359 eligible subjects, including HCCs and benign liver diseases (BLDs), were recruited from six Chinese medical centers. The three nomograms were built using logistic regression and their sensitivities and specificities were carefully assessed in training and validation cohorts. HCC patients after surgical resection were followed to determine the prognostic values of these algorithms. Prospective surveillance performance was assessed in a cohort of chronic hepatitis B patients during 144 weeks follow-up.
Results: Independent risk factors such as alpha-fetoprotein (AFP), lens cuinaris agglutinin-reactive fraction of AFP (AFP-L3), des-gamma-carboxy prothrombin (DCP), albumin (ALB), and total bilirubin (TBIL) obtained from train cohort were used to construct three nomograms (LAD, C-GALAD, and TAGALAD) using logistic regression. In the training and two validation cohorts, their AUCs were all over 0.900, and the higher AUCs appeared in TAGALAD and C-GALAD. Furthermore, the three nomograms could effectively stratify HCC into two groups with different survival and recurrence outcomes in follow-up validation. Notably, TAGALAD could predict HCC up to 48 weeks (AUC: 0.984) and 24 weeks (AUC: 0.900) before clinical diagnosis.
Conclusion: The proposed nomograms generated from real-world Chinese populations are effective and easy-to use for HCC surveillance, diagnosis, as well as prognostic evaluation in various clinical scenarios based on data feasibility.
Keywords: hepatocellular carcinoma, real-world data, diagnostic, prognosis, algorithm
Introduction
Hepatocellular carcinoma (HCC) is a growing public health problem and the third leading cause of cancer mortality worldwide,1 about half of which occur in China.2 Chronic hepatitis B virus (HBV) infection is closely associated with the development of HCC in China.3 The lack of surveillance and early diagnosis tools is blamed for the poor prognosis and high mortality of HCC.4,5 The imaging technology [such as computed tomography (CT) and ultrasonography (US)], together with serum α-fetoprotein (AFP), has been recommended by clinical guidelines for the screening of HCC.6 However, ultrasonography screening has been challenged when distinguishing small HCC from cirrhosis with an accuracy ranging from 47% to 63%.7,8 Similarly, the serum AFP as a vital tumor marker for HCC is elevated to varying degrees compared to healthy negative controls, and sensitivity is limited to 65%.7 Therefore, there is an unmet need for a single serum marker in detecting early-stage HCC.
As the amount of available high-throughput clinical data in medical centers continues to grow, an open question has arisen, ie how to make appropriate use of these large-scale data to achieve a comprehensive identification of cancer. Machine learning algorithms are powerful scientific mathematical tools and have provided valuable early diagnosis and prognosis evaluation methods for several human diseases.9 Recently, several algorithms, such as GALAD [derived from Gender, Age, AFP-L3, AFP, and Des-carboxy-prothrombin (DCP)] and HCC early detection screening (HES), have been introduced as important alternatives for HCC diagnosis and prognosis prediction.10–13 The diagnostic efficacy of the GALAD algorithm had been validated in international cohorts including the UK, Germany, and Japan.11–13 Previous studies indicated that the performances of biomarkers varied with geographical region and were affected by etiology in different areas.14 For example, HBV viral load could significantly influence the predictive value of AFP applied solely.15 Our previous study confirmed that the GALAD efficacy was diluted due to the low diagnostic efficacy of AFP in HBV DNA-positive populations.14 Thus, GALAD might require further optimization if applied to the Chinese population.14
Additionally, most of these designed studies were selective with inevitable sample bias and thus might not represent the “real-world” situation in most Chinese populations.16 In this context, we conducted a comprehensive multi-center study using the real-world setting, aiming to both train and validate the β coefficients for each variable of GALAD in the Chinese population. In addition, while accounting for differences in the accessibility of clinical laboratory indicators, we identified factors associated with the presence of HCC and proceeded to develop as well as validate the algorithms. The diagnostic, prognostic, and screening values of the models were also validated in a retrospective multicenter cohort, a longitudinal follow-up cohort of HCC, and a prospective follow-up cohort of chronic hepatitis B (CHB) patients with liver fibrosis/cirrhosis, respectively. Both the results from the cross-sectional and longitudinal real-world data indicate that our newly developed nomograms are feasible and effective in HCC predicting and monitoring. Clinical physicians can utilize digital outputs from model scenarios to assess patient conditions, thereby facilitating informed clinical decision-making.
Materials and Methods
Study Populations
The study cohort comprised a total of 10,359 eligible participants, with 8,222 individuals diagnosed with HCC and 2,137 patients with benign liver diseases (BLDs). These participants were recruited between June 2007 and December 2019 at various medical institutions, including Shanghai Eastern Hepatobiliary Surgery Hospital (EHBH), Yueyang Hospital of Integrated Traditional Chinese and Western Medicine of Shanghai University of Traditional Chinese Medicine (YY), Shanghai Changzheng Hospital (CZ), Mengchao Hepatobiliary Hospital at Fujian Medical University (FJ), First Affiliated Hospital of Kunming Medical University (KM), and Jing’an District Central Hospital of Shanghai (JA), within the framework of the Multi-center Cooperation Platform of Molecular Diagnostics in China (http://www.multico.com.cn/).
The enrollment of HCC and BLDs was based on a comprehensive range of etiologies, including chronic viral liver disease, chronic non-alcoholic fatty liver disease, and autoimmune liver disease. The inclusion criteria of HCC were as follows: (1) histological confirmation of HCC diagnosis, (2) absence of macroscopic hepatic vein tumor thrombus, extrahepatic spread, or distant metastases, (3) no concurrent malignancies, and (4) no prior anticancer treatment.
BLDs consisted of individuals previously diagnosed with chronic liver disease (CLD), liver fibrosis (LF), and cirrhosis (LC) with different etiology. Since 68.98% (1474/2137) BLD subjects were attributed to HBV infection, the CHB group was set up for comparison in addition to BLDs with broad etiology.
LC was diagnosed when one or more of following criteria17 were met: (1) histopathological evidence of cirrhosis; (2) platelet counts < 100 × 109/L; (3) evidence of portal hypertension that included liver cirrhosis upon US, CT, or MRI examinations and associated splenomegaly but no vascular thrombosis, thrombocytopenia with a platelet counts < 120 × 109/L, and/or presence of esophagogastric varices on endoscopic examination.
CHB was defined as having positive serum hepatitis B surface antigen (HBsAg) for at least 6 months, or HBV DNA titer exceeding 20,000 IU/mL in hepatitis B e antigen (HBeAg) positive patients, or HBV DNA titer surpassing 2000 IU/mL in HBeAg-negative patients.17
The study was approved by the institutional ethics committee at the leading study center (EHBHKY2018-1-010).
Study Design
We conducted a three-phase, real-world multi-center study to discover and validate the panel of serum biomarkers for HCC. Figure S1 showed the pipeline of the study.
Phase I (Training and Cross-Sectional Validation Phase)
During the training phase, we retrospectively gathered serum clinical laboratory test results from a case–control cohort of 7,729 Chinese subjects, comprising 5,998 HCC patients and 1,731 matched control subjects in EHBH, between January 2015 and December 2017 to identify candidate serum biomarkers. Subsequently, using the rms software package (http://www.r-project.org/), version 4.0 of R, we developed nomograms based on candidate serum biomarkers. The diagnostic performance among different algorithms was compared using the DeLong test.
The serum biomarkers AFP, AFP-L3, DCP, albumin (ALB), and total bilirubin (TBIL) had previously been proposed as biomarkers for HCC screening.12,14,18 Here, the AFP level was determined using the electro-chemiluminescence immunoassay (ECLIA) method on Cobas e601 (Roche Diagnostics, Alameda, CA, USA). Lens culinaris agglutinin (LCA) affinity-binding fraction solutions were obtained from all serum samples using the Hotgen Biotech glycosyl capture spin column (Hotgen Biotech Co., Ltd, Beijing, China). Both the serum samples and corresponding LCA-reactive fraction affinity-binding solutions were measured using the ECLIA method on Cobas e601 (Roche Diagnostics, Alameda, CA, USA) to determine the AFP-L3/AFP index (the ratio of AFP-L3 to total AFP). The DCP quantitation was performed using chemiluminescence enzyme immunoassay on the LUMIPULSE G1200 (FUJIREBIO, Tokyo, Japan). The concentrations of ALB and TBIL were detected using the bromocresol green colorimetry method and the vanadate microplate method on the Cobas c701 (Roche Diagnostics, Alameda, CA, USA), respectively.
We assessed the diagnostic performances of the nomogram in independent internal (HCC: n=2064; BLDs: n=253) and external (HCC: n=148; BLDs: n=129) validation cohorts. The data for internal validation were collected between January 2018 and December 2018 in EHBH, and this dataset was referred to as independent internal validation. The external validation dataset primarily comprised patients from four medical centers (CZ, KM, FJ, and YY) as described above collected between January 2016 and December 2019, defining it as a multi-center cohort or external validation cohort. To evaluate the diagnostic performance, we employed the receiver operating characteristic (ROC) curve and determined the cutoff value using the maximum Youden index (sensitivity + specificity – 1). Sensitivity, specificity, positive predictive value (PPV), and negative predictive value (NPV) were used to assess the diagnostic accuracies at the cutoff values.
Phase II (Follow-Up Validation Phase)
The prognostic value of the nomograms was verified in a follow-up study cohort comprising 204 HCC patients between January 2017 and December 2018 in EHBH. Each enrolled patient underwent follow-up evaluations every 3 months for the first 2 years after hepatectomy, and subsequently every 3–6 months until either death or withdrawal from the program. Overall survival (OS) was defined as the duration between hepatectomy and either death or the final follow-up program date, while recurrence-free survival (RFS) was defined as the period between hepatectomy and either recurrence, death, or the final follow-up program date. During this phase, the median postoperative follow-up time (interquartile range) was 33.50 (25.73–42.45) months. Kaplan–Meier curves were utilized to compare OS and RFS among different HCC subgroups as defined by the nomograms.
Phase III (Prospective Validation Phase)
Upon completing Phases I and II, nomograms based on clinical serum biomarkers were developed and validated. Subsequently, the efficacy of these nomograms was assessed in a prospective validation cohort. This cohort originated from JA, a center with which we have previously collaborated.14
This study followed specific inclusion and exclusion criteria: (1) inclusion of individuals aged 30–60 years, both men and women; (2) capacity to comprehend the study, provide informed consent, and a willingness to adhere to research requirements; (3) positivity for HBsAg for a minimum duration of 1 year; (4) at the time of enrollment, the participants could be either HBeAg positive or HBeAg negative, with HBV-DNA levels of at least ≥104 copies/mL; (5) clinical indications of cirrhosis had to be evident at the time of enrollment (detailed criteria provided), and the Child-Pugh grade had to be A. Alternatively, if cirrhosis was not apparent during enrollment, a liver biopsy conducted within the last 2 years should have revealed an Ishak fibrosis grade of at least 4 (on a scale of 0–6). Moreover, (6) exclusion criteria encompassed patients with HCC, decompensated cirrhosis, autoimmune hepatitis, severe physical and mental disorders (eg, alcoholism, uncontrolled diabetes, or tumors), and those with concurrent HCV, HDV, and HIV infections.
The study involved a structured follow-up schedule, which included the following: (1) clinical assessments every 12 weeks to monitor the patient’s condition; (2) comprehensive evaluations such as blood routine, urine routine, prothrombin time, and biochemical tests conducted every 12 weeks; (3) semi-annual assessments including serum AFP levels and B-ultrasound liver examinations; (4) monitoring of liver fibrosis indicators at 6-month intervals; (5) testing for HBsAg, HBeAg/HBeAb at baseline, 48 weeks, 96 weeks, and 144 weeks; (6) rigorous monitoring of HBV-DNA at baseline, 12 weeks, 24 weeks, 36 weeks, 48 weeks, 72 weeks, 96 weeks, 120 weeks, and 144 weeks; (7) the primary study endpoint was the occurrence of HCC and liver-related deaths during the 144-week follow-up period, with HCC diagnosis confirmed through liver biopsy.
At the conclusion of the study at week 144, a total of 12 patients had developed HCC. For research purposes, 24 patients who did not develop HCC were randomly matched as controls. These 36 patients were subsequently included in our prospective validation cohort. The AUC was used to assess the diagnostic efficacy of the nomograms at the time of HCC diagnosis, as well as at weeks −24 and −48 within the prospective validation cohort.
Statistical Analysis
The categorical variable was described as numbers and percentages of patients and compared using the χ2 test or Fisher's exact test. For the normal distribution of continuous variables, we expressed as mean ± SD and compared it using the unpaired, 2-tailed t-test. Meanwhile, for the non-normal distribution of continuous variables, we expressed as median (interquartile range) and compared using the Mann–Whitney U-test. In all analyses, P < 0.05 was considered to indicate statistical significance. All analyses were performed using SPSS 26.0 for Window software (SPSS, Chicago, IL) and R version 4.0.2 for windows.
Results
Patient Characteristics
The study flowchart was shown in Figure S1. Patients diagnosed at EHBH from January 2015 to December 2017 formed a training cohort for developing the nomogram. Those diagnosed at EHBH between January 2018 and December 2018 were designated as an internal independent validation cohort. Eligible patients from four external medical centers (CZ, KM, FJ, and YY) from January 2016 to December 2019 constituted an external multicenter validation cohort. Following the training and internal validation phase, 204 patients from EHBH were enrolled in a longitudinal follow-up validation cohort to assess the long-term prognostic prediction efficacy of the models. Furthermore, a prospective cohort from JA, comprising 12 HCC patients and 24 matched BLDs, was included for the prospective validation of the models. The clinical characteristics of the BLDs and HCC patients are summarized in Tables 1, S1 and S2.
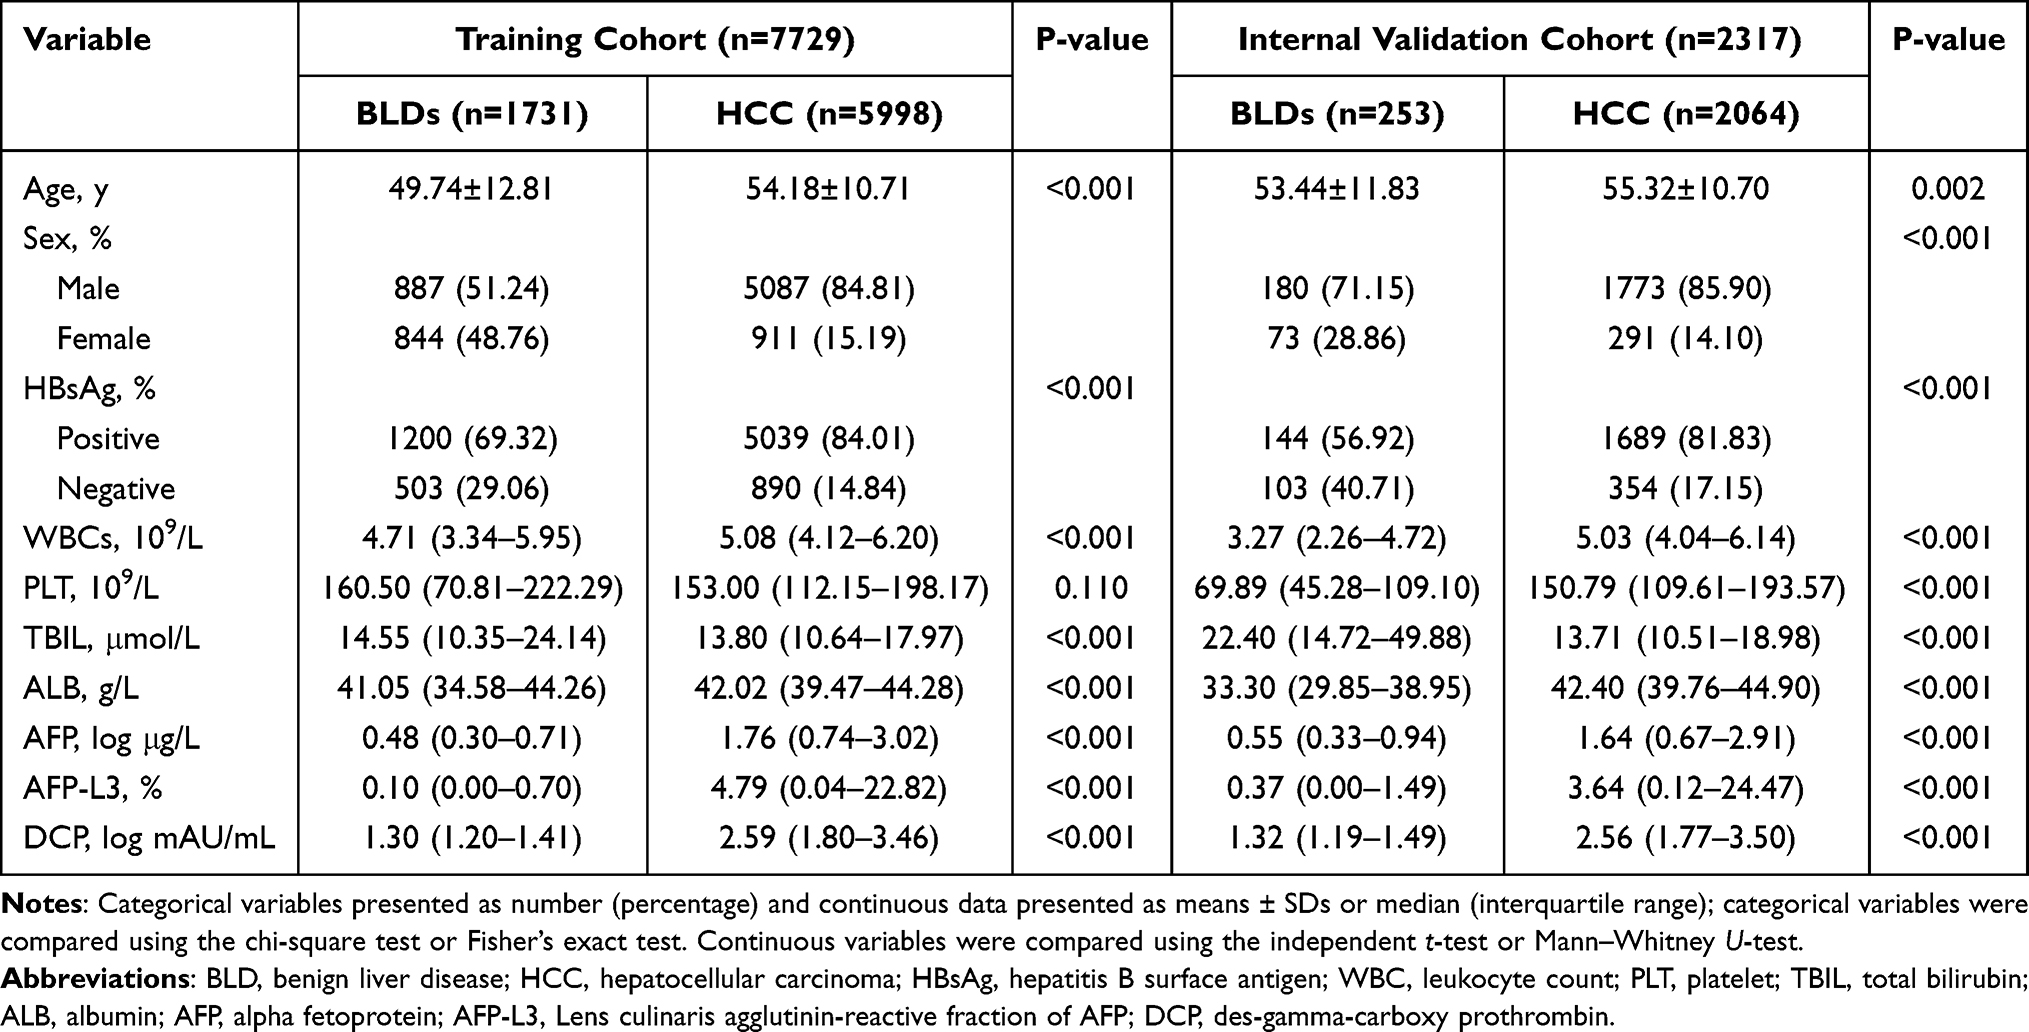 |
Table 1 Clinical Characteristics of BLDs and HCC in the Training and Independent Internal Validation Cohorts |
Development of HCC-Predicting Nomograms
In the training cohort, variables with the P values <0.05 in the univariable logistic regression analysis were entered into the multivariable logistic regression analysis. The results of univariate and multivariate logistic regression analysis are shown in Table 2. After multivariate logistic regression, seven significant associated factors were employed to build HCC diagnostic nomograms. The β coefficients and odds ratios (95% CI) for the seven variables in Table 2 including log(AFP) at 4.399 (3.658–5.290), AFP-L3 at 1.065 (1.040–1.090), log(DCP) at 30.906 (23.279–41.033), sex at 5.582 (4.515–6.901), age at 1.073 (1.063–1.082), log(TBIL) at 0.049 (0.032–0.074), and ALB at 1.168 (1.144–1.192). Subsequently, a diagnostic nomogram named LAD (Figure 1A) was created, including AFP-L3 and log-transformed AFP and DCP values. Likewise, nomograms named C-GALAD (the initial “C” indicating the Chinese population differ from published GALAD) (Figure 1B)12 and TAGALAD (the initial TA indicating TBIL and ALB, respectively) (Figure 1C) were also established. As shown in the nomogram C-GALAD (Figure 1B), log(DCP), log(AFP), and AFP-L3 still made the most considerable contribution to this nomogram, followed by sex and age at diagnosis. While in the nomogram TAGALAD (Figure 1C), TBIL and log(DCP) made the most significant contribution, followed by log(AFP), AFP-L3, age at diagnosis, sex, and ALB.
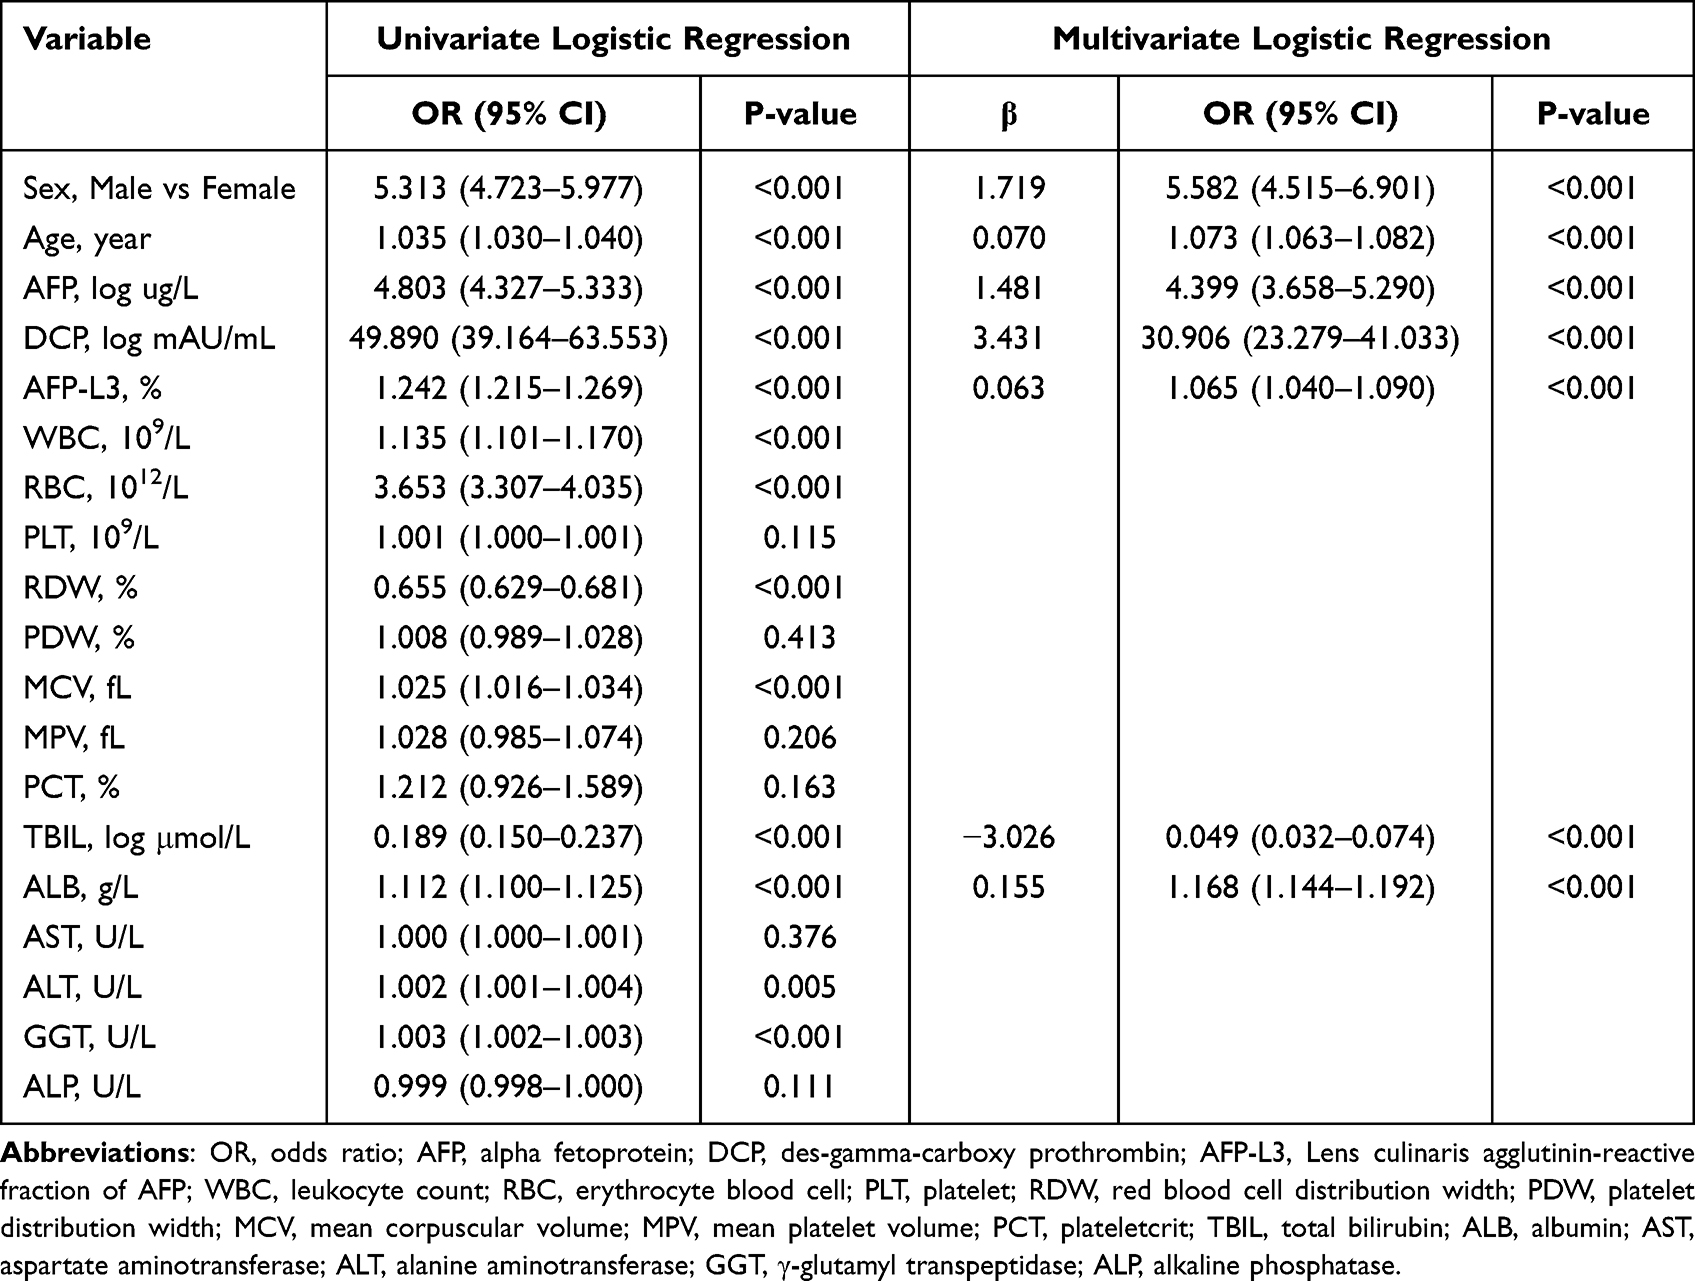 |
Table 2 The Univariate and Multivariate Logistic Regression Analysis for Distinguishing HCC from BLDs Based on Clinical Laboratory Index |
 |
Figure 1 The three nomogram algorithms (LAD, C-GALAD and TAGALAD) to estimate the risk of HCC. Univariate and multivariate analyses identified AFP, AFP-L3, DCP, TBIL, and ALB as significant risk factors independently associated with HCC. Utilizing these factors, we developed HCC risk estimation nomograms: LAD (A), C-GALAD (B), and TAGALAD (C). To apply a nomogram, locate each indicator on its axis, assign points, sum these points, and then determine the HCC probability at the bottom of the nomogram based on the total points. |
Cross-Sectional Validation of the Nomograms
The three above diagnostic nomograms all demonstrated higher accuracy in distinguishing HCC from BLDs (AUC of LAD: 0.943, 95% CI: 0.938–0.948; C-GALAD: 0.952, 95% CI: 0.947–0.956; TAGALAD: 0.969, 95% CI: 0.965–0.973) compared with AFP (AUC: 0.828, 95% CI: 0.819–0.836, P<0.001), DCP (AUC: 0.919, 95% CI: 0.913–0.925, P<0.001) and AFP-L3 (AUC: 0.764, 95% CI: 0.755–0.774, P<0.001), in the training cohort (Table 3 and Figure 2A). As the published GALAD score has been established and validated for early diagnosis of HCC, we also compared the performances of our nomograms and the formerly published GALAD score in distinguishing HCC. The results suggested that our nomograms also demonstrated better diagnostic efficacy than the GALAD score (AUC: 0.925, 95% CI: 0.919–0.931, P<0.001) (Table 3 and Figure 2A).
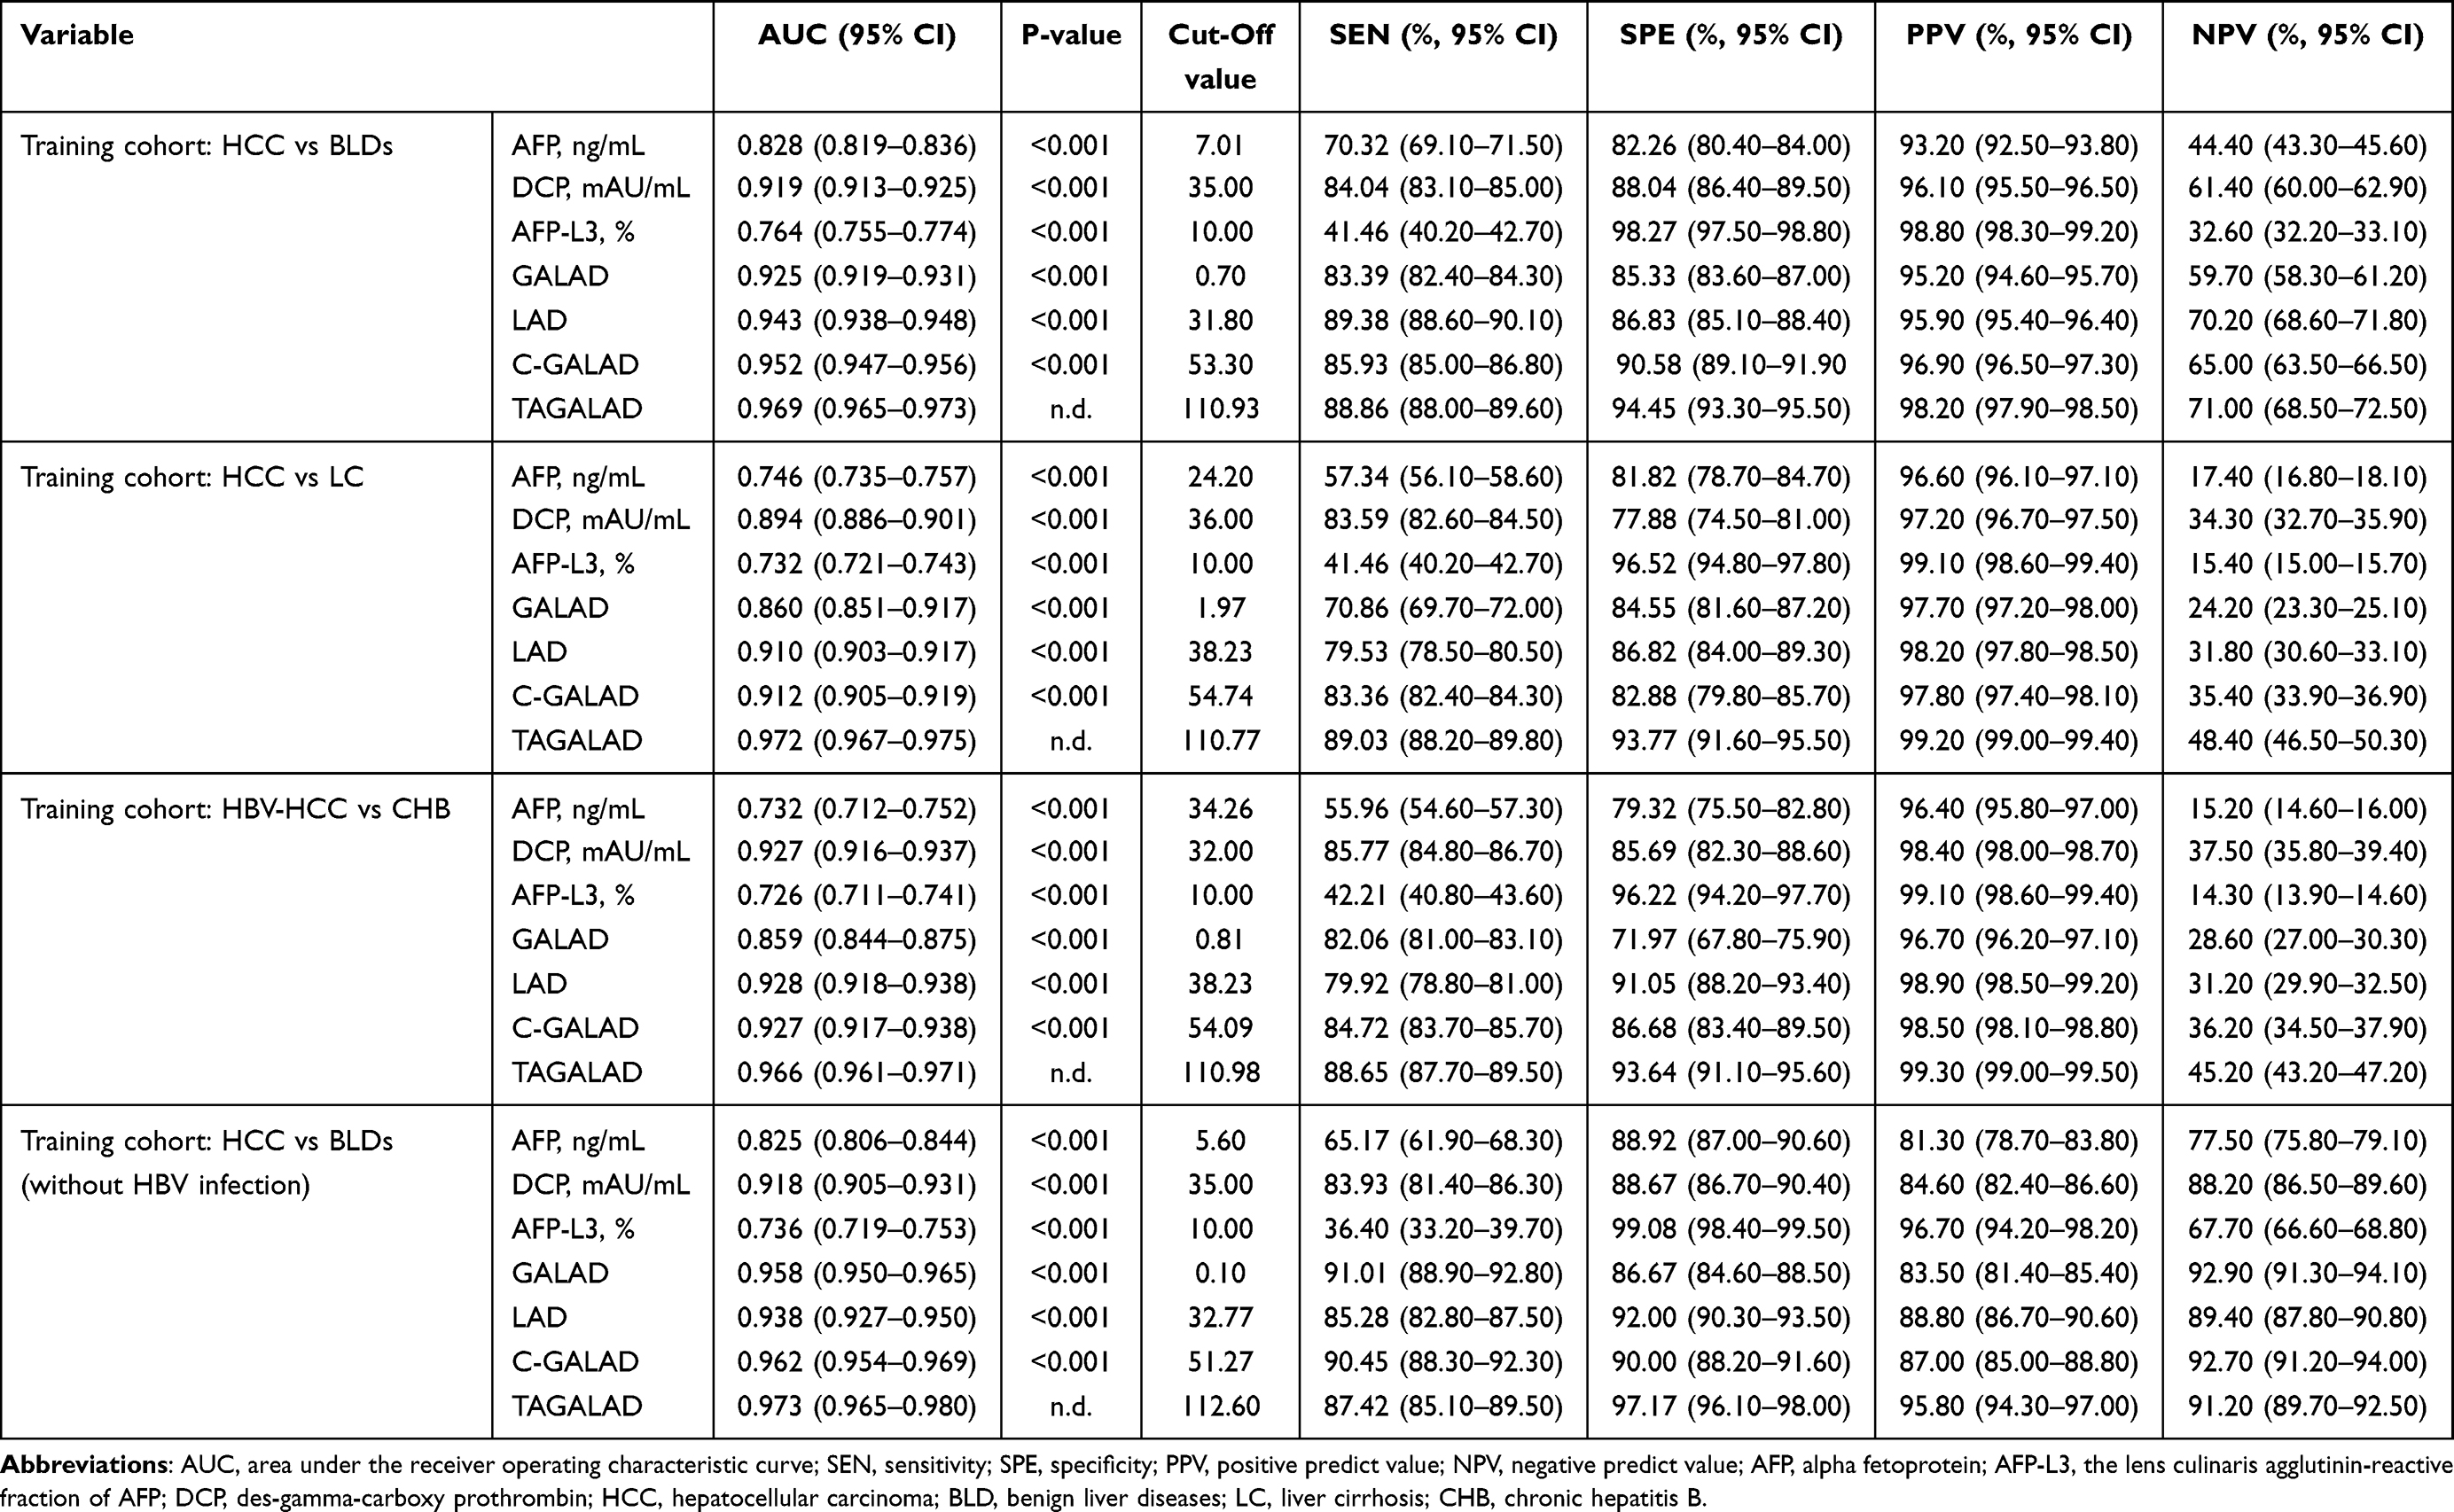 |
Table 3 Comparison Among the Four Nomograms and the Individual HCC Biomarker in the Training Cohort |
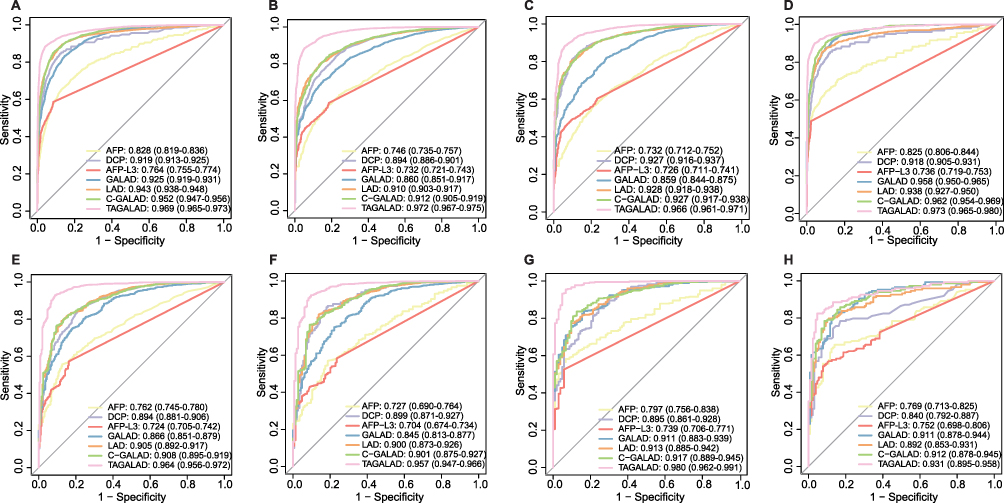 |
Figure 2 The ROC curve analyses of GALAD, LAD, C-GALAD, TAGALAD and individual tumor marker in training and validation cohorts. (A–D) Training cohort: The AUC analysis showed the diagnostic efficacy of the three nomograms for HCC and BLDs (A) (LAD: AUC: 0.943, 95% CI: 0.938–0.948; C-GALAD: AUC: 0.952, 95% CI: 0.947–0.956; TAGALAD: AUC:0.969, 95% CI: 0.965–0.973) better than GALAD (AUC: 0.925, 95% CI: 0.919–0.931) and individual tumor markers (AFP: AUC: 0.828, 95% CI: 0.819–0.836; DCP: AUC: 0.919, 95% CI: 0.913–0.925; AFP-L3: 0.764, 95% CI: 0.755–0.774). In the subgroup analysis of HCC vs LC (B), HBV-HCC vs CHB (C) and HCC vs BLDs (both without HBV infection) (D), the diagnostic algorithm still achieved excellent diagnostic performance, with AUCs exceeding 0.900. (E–G) Internal validation cohort: The AUC revealed that the nomograms (LAD: AUC: 0.905, 95% CI: 0.892–0.917; C-GALAD: AUC: 0.908, 95% CI: 0.895–0.919; TAGALAD: AUC: 0.964, 95% CI: 0.956–0.972) showed the best diagnostic power for HCC vs BLDs (E) in the internal validation cohort (AFP: AUC: 0.763, 95% CI: 0.745–0.780; DCP: 0.894, 95% CI: 0.881–0.906; AFP-L3: AUC: 0.724, 95% CI: 0.705–0.742; GALAD: AUC: 0.866, 95% CI: 0.851–0.879). Similarly, in the subgroup analyses of HBV-HCC vs CHB (F) and HCC vs BLDs (both without HBV infection) (G) in the internal validation cohort, the diagnostic algorithms continued to show excellent performance, with all AUCs exceeding 0.900. (H) External validation cohort: For the external validation cohort, the nomograms (LAD: AUC: 0.892, 95% CI: 0.853–0.931; C-GALAD: AUC: 0.912, 95% CI: 0.878–0.945; TAGALAD: AUC: 0.931, 95% CI: 0.895–0.958) again demonstrated ideal efficacy in distinguishing HCC from BLDs, and were superior to AFP (AUC: 0.769, 95% CI: 0.713–0.825, P<0.001), DCP (AUC: 0.840, 95% CI: 0.792–0.887, P<0.001) and AFP-L3 (AUC: 0.752. 95% CI: 0.698–0.806. P<0.001). |
In subgroup analysis, our three nomograms consistently achieved AUCs above 0.900 for distinguishing HCC from LC in the training cohort. Specifically, the AUCs were 0.910 for LAD (95% CI: 0.903–0.917), 0.912 for C-GALAD (95% CI: 0.905–0.919), and 0.972 for TAGALAD (95% CI: 0.967–0.975). These results significantly surpassed those of AFP (AUC: 0.746, 95% CI: 0.735–0.757, P<0.001), DCP (AUC: 0.894, 95% CI: 0.886–0.901), AFP-L3 (AUC: 0.732, 95% CI: 0.721–0.743, P<0.001), and GALAD (AUC: 0.860, 95% CI: 0.851–0.917) (Table 3 and Figure 2B).
In the HBV-related case subgroup analysis, our models (LAD, C-GALAD, and TAGALAD) also demonstrated superior diagnostic performance for HBV-HCC compared to GALAD (AUC: 0.859, 95% CI: 0.844–0.875), with all AUCs above 0.900. LAD achieved an AUC of 0.928 (95% CI: 0.918–0.938), C-GALAD reached 0.927 (95% CI: 0.917–0.938), and TAGALAD showed the best performance with an AUC of 0.966 (95% CI: 0.961–0.971) (Table 3 and Figure 2C).
In individuals without HBV infection, TAGALAD (AUC: 0.973, 95% CI: 0.965–0.980) and C-GALAD (AUC: 0.962, 95% CI: 0.954–0.969) maintained superior HCC diagnostic performance compared to GALAD (AUC: 0.958, 95% CI: 0.950–0.965), with significantly higher accuracy (Table 3 and Figure 2D). Table 3 also provides comprehensive data on sensitivity, specificity, and AUCs for all cohorts studied.
In the internal validation cohort, the nomograms from the training cohort showed consistent performance discriminating HCC from matched controls with AUCs of 0.905 (95% CI: 0.892–0.917) for LAD, 0.908 (95% CI: 0.895–0.919) for C-GALAD, and 0.964 (95% CI: 0.956–0.972) for TAGALAD (Table S3, Figure 2E). Subgroup analysis of the internal cohort as shown in Table S3 revealed that the TAGALAD model excelled in diagnosing HBV-HCC with an AUC of 0.957 (95% CI: 0.947–0.966) and HCC without HBV infection with an AUC of 0.980 (95% CI: 0.962–0.991), surpassing the diagnostic accuracy of GALAD (AUC: 0.845 for HBV cases, 95% CI: 0.813–0.877; 0.911 for non-HBV cases, 95% CI: 0.883–0.939), LAD (AUC: 0.900 for HBV cases, 95% CI: 0.873–0.926; 0.913 for non-HBV cases, 95% CI: 0.885–0.942), and C-GALAD (AUC: 0.901 for HBV cases, 95% CI: 0.875–0.927; 0.917 for non-HBV cases, 95% CI: 0.889–0.945) (Figure 2F and G).
In external validation cohort, TAGALAD again showed superior performance in differentiating HCC from BLDs with an AUC of 0.931 (95% CI: 0.895–0.958), exceeding AFP (AUC: 0.769, 95% CI: 0.713–0.825), DCP (AUC: 0.840, 95% CI: 0.792–0.887), AFP-L3 (AUC: 0.752, 95% CI: 0.698–0.806), and GALAD (AUC: 0.911, 95% CI: 0.878–0.944) (Table S3 and Figure 2H). AUCs, sensitivity, specificity, PPV, and NPV are summarized in Table S3.
Longitudinal Follow-Up Validation of the Nomograms
In the prognostic assessment of HCC patients using the LAD model, those with scores above the 58.17 cutoff exhibited a median OS and RFS of 27.83±14.05 and 27.25±14.02 months, respectively, which is approximately 5 months shorter than those below the cutoff, who experienced OS and RFS of 33.38±11.85 and 32.83±12.12 months, respectively (P<0.001, Figure 3A and B).
 |
Figure 3 Performances of three nomograms in predicting OS and RFS in the follow-up cohort. (A and B) LAD algorithm: In HCC prognostic evaluation using the LAD model, patients with scores over 58.17 showed median OS (A) and RFS (B) of 27.83±14.05 and 27.25±14.02 months, respectively, which were about 5 months less than those with lower scores (OS: 33.38±11.85, RFS: 32.83±12.12 months). (C and D) C-GALAD algorithm: In HCC prognosis using C-GALAD, high-risk patients (scores > 78.10) had OS (C) and RFS (D) of 27.32±14.16 and 26.74±14.11 months, respectively. The low-risk group showed longer OS (33.90±11.44 months) and RFS (33.36±11.75 months). (E and F) TAGALAD algorithm: Using 139.36 as the median cutoff in the TAGALAD model, the high-risk group’s OS (E) and RFS (F) were 28.31±14.18 and 27.73±14.17 months, respectively, about 4.58 and 4.62 months less than the low-risk group’s OS (32.89±11.91) and RFS (32.35±12.15). (G and H) Cox regression forest plot: Cox regression revealed LAD, C-GALAD, and TAGALAD were HCC independent predictors of survival (LAD HR: 1.018; C-GALAD HR: 1.016; TAGALAD HR: 1.015) (G) and recurrence (LAD HR: 1.020; C-GALAD HR: 1.017; TAGALAD HR: 1.017) (all P-values <0.05) (H). |
Using the C-GALAD model for HCC prognostic assessment, patients with a score above the median cutoff of 78.10 in the high-risk group showed OS and RFS of 27.32±14.16, 26.74±14.11 months, respectively, compared to OS 33.90±11.44 and RFS 33.36±11.75 months in the low-risk group, indicating a significant difference over 6.28 months (P<0.001, Figure 3C and D).
In the TAGALAD model, using the median value 139.36 as the cutoff, OS and RFS in the high-risk group were 28.31±14.18 and 27.73±14.17 months, respectively, approximately 4.58 and 4.62 months shorter than in the low-risk group (OS 32.89±11.91, RFS 32.35±12.15 months), respectively (P<0.001, Figure 3E and F).
Furthermore, the Cox regression analysis indicated that LAD, C-GALAD, and TAGALAD were independent risk factors for both survival (HR of LAD: 1.018, 95% CI: 1.007–1.030; C-GALAD: 1.016, 95% CI: 1.006–1.027; TAGALAD: 1.015, 95% CI: 1.005–1.025; P<0.05; Figure 3G) and recurrence (HR of LAD: 1.020, 95% CI: 1.008–1.031; C-GALAD: 1.017, 95% CI: 1.007–1.028; TAGALAD: 1.017, 95% CI: 1.009–1.026; P<0.05; Figure 3H) in HCC patients.
The results indicated that LAD, C-GALAD, and TAGALAD algorithms could stratify HCC patients into different prognostic categories (high-risk and low-risk). Kaplan–Meier survival curves confirmed that higher nomogram scores correlated statistically with poorer OS and RFS (P < 0.001, Figure 3).
Longitudinal Prospective Validation of the Nomograms
To determine the predictive time frame prior to HCC diagnosis, we evaluated the nomogram points of patients with very early-stage HCC (n=12) and matched CHB controls (n=24) in prospective validation cohort from JA. At −48, −24, and 0 weeks, TAGALAD continued to demonstrate its leading performance among the four HCC diagnostic algorithms, with AUCs of 0.984 (95% CI: 0.954–1.000), 0.900 (95% CI: 0.740–1.000), and 0.996 (95% CI: 0.900–1.000), respectively (Table 4, Figure 4).
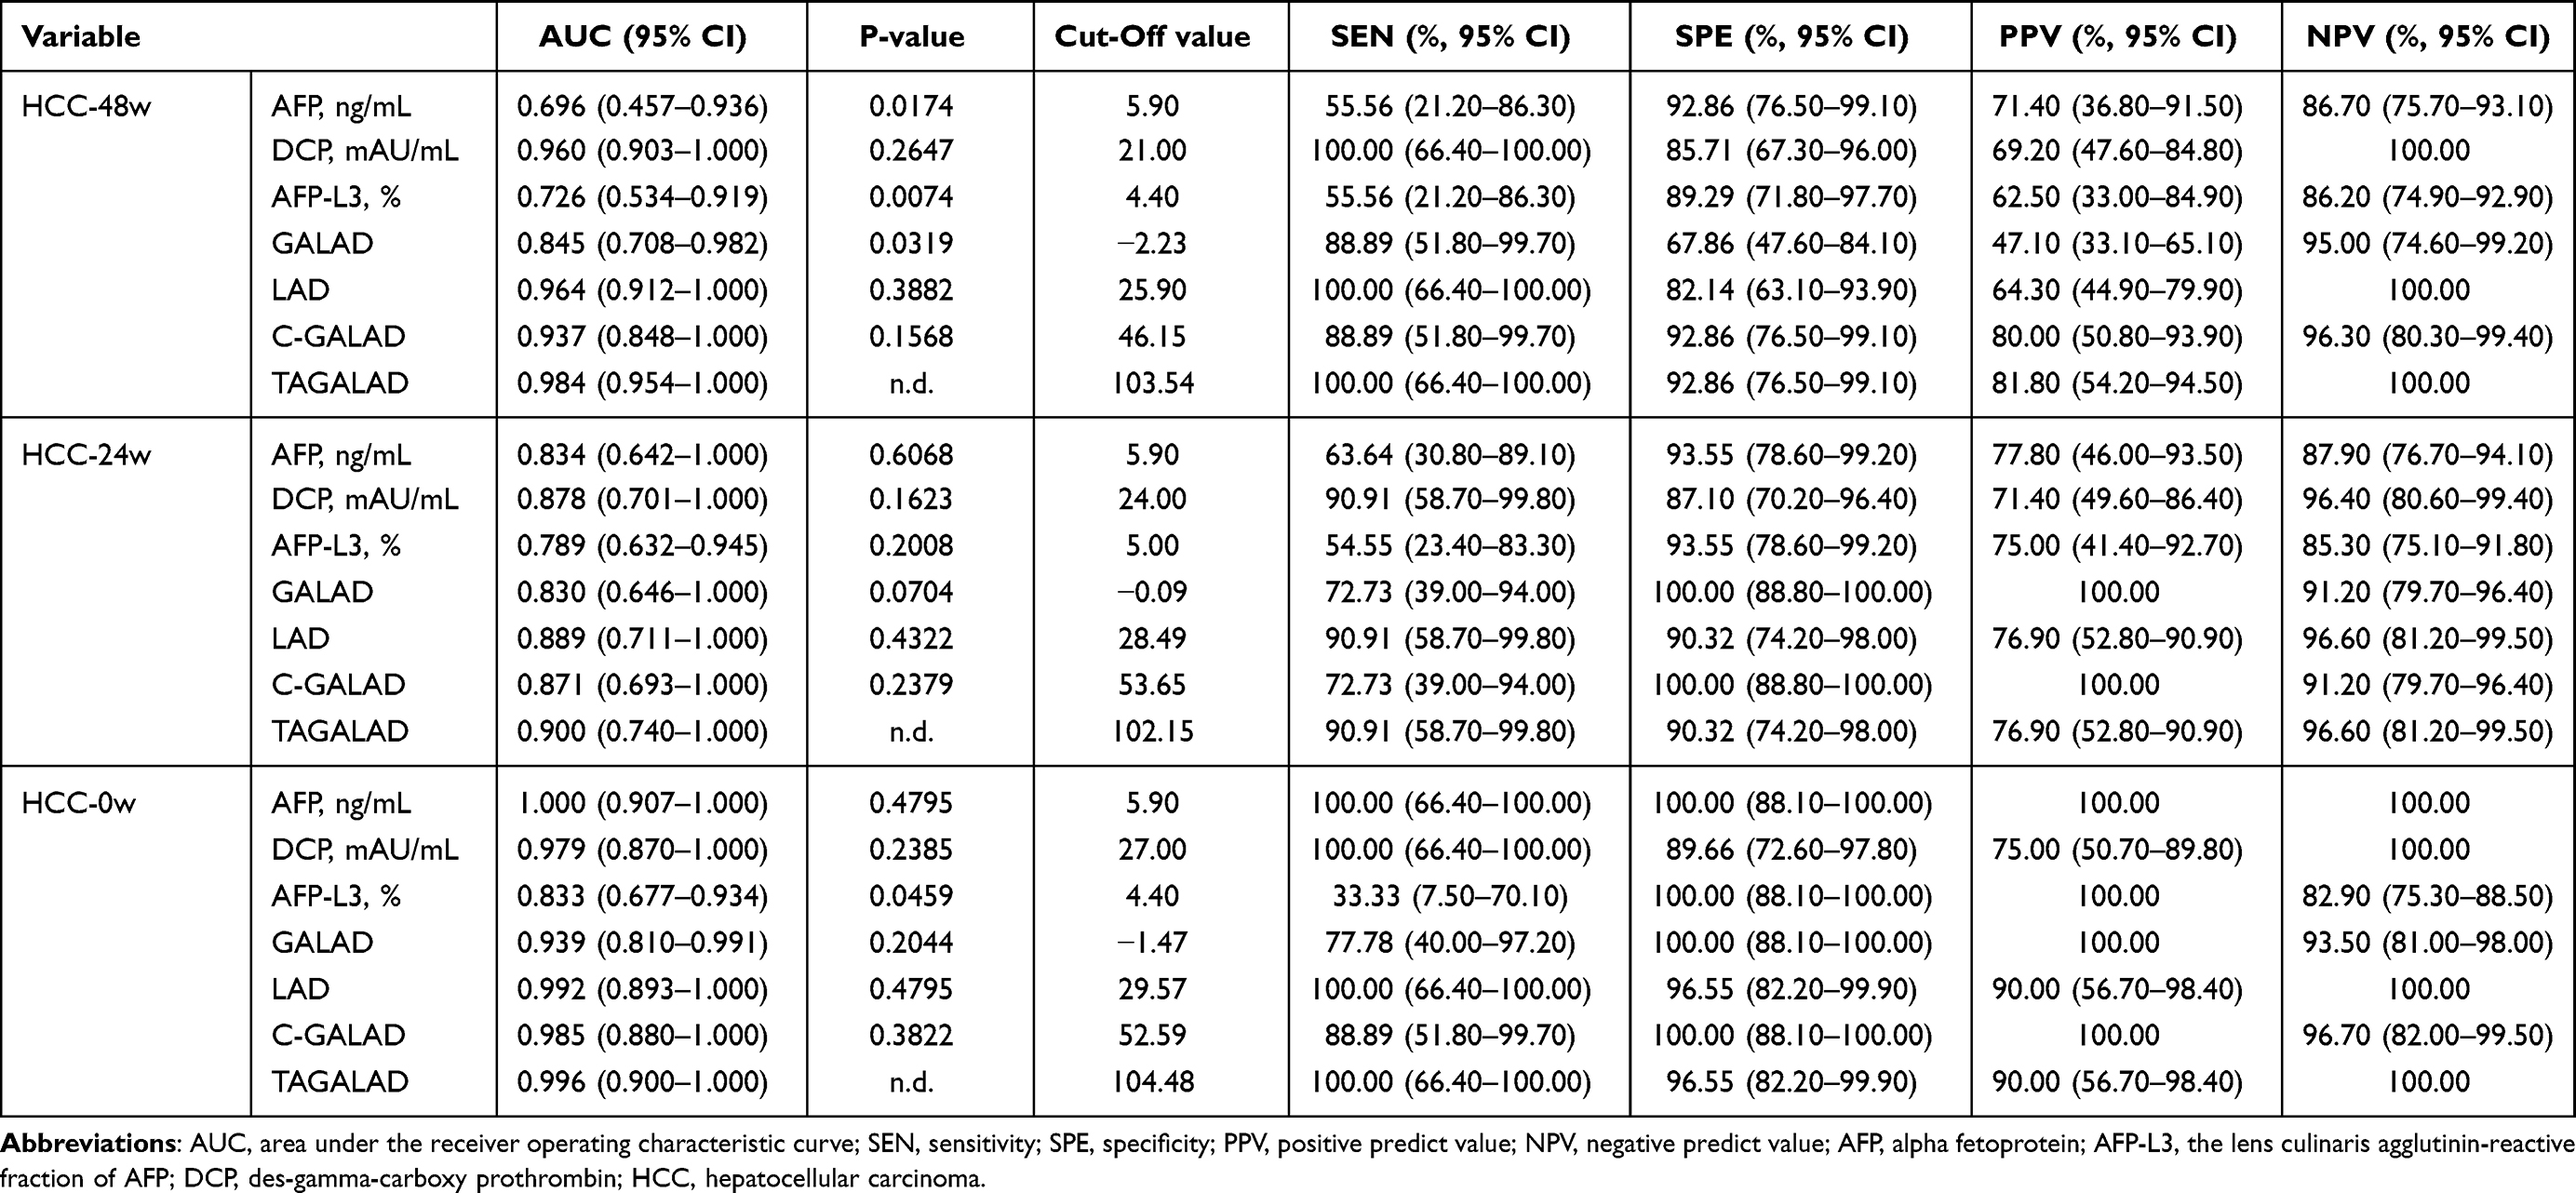 |
Table 4 Comparison Among the Four Nomograms and the Individual HCC Biomarker in the Prospective Study Cohort |
 |
Figure 4 The diagnostic efficacies of AFP, AFP-L3, DCP, GALAD, LAD, C-GALAD and TAGALAD in distinguishing the very early-stage HCC from the matched controls at corresponding time points. (A) At week −48, the AUCs of TAGALAD, LAD, C-GALAD, and GALAD were 0.984, 0.964, 0.937, and 0.845 respectively, in descending order. (B) At week −24, AUCs were 0.900 for TAGALAD, 0.889 for LAD, 0.871 for C-GALAD, and 0.830 for GALAD. TAGALAD was the most effective one among these four diagnostic models. (C) At week 0, the best AUC was shown in TAGALAD (0.996), then was the LAD (0.992), the C-GALAD (0.985) and the GALAD (0.939). |
At week −48, TAGALAD, LAD, C-GALAD, and GALAD had AUCs of 0.984 (95% CI: 0.954–1.000), 0.964 (95% CI: 0.912–1.000), 0.937 (95% CI: 0.848–1.000), and 0.845 (95% CI: 0.708–0.982), respectively, ranking in descending order (Figure 4A, Table 4). ROC curve analysis determined cutoff values for these models, with 103.54 for TAGALAD, 25.90 for LAD, 46.15 for C-GALAD, and −2.23 for GALAD based on the Youden index. TAGALAD and LAD both achieved sensitivity of 100.00% (95% CI: 66.40%–100.00%), surpassing both GALAD and C-GALAD with 88.89% sensitivity (95% CI: 51.80%–99.70%) (Figure 4A, Table 4).
At week −24, the AUC for TAGALAD was 0.900 (95% CI: 0.740–1.000) for LAD 0.889 (95% CI: 0.711–1.000), C-GALAD 0.871 (95% CI: 0.693–1.000), GALAD 0.830 (95% CI: 0.646–1.000) (Figure 4B, Table 4). These results highlighted TAGALAD as the most effective diagnostic model among the four algorithms. At an optimal cutoff value of 102.15, determined by the maximum Youden index, TAGALAD achieved sensitivity and specificity for diagnosing very early HCC at 90.91% (95% CI: 58.70–99.80%) and 90.32% (95% CI: 74.20–98.00%), respectively (Table 4).
At week 0, the AUCs of the four algorithms were all above 0.900, with TAGALAD (AUC: 0.996, 95% CI: 0.900–1.000) and LAD (AUC: 0.992, 95% CI: 0.893–1.000) leading closely, followed by C-GALAD (AUC: 0.985, 95% CI: 0.880–1.000) and GALAD (AUC: 0.939, 95% CI: 0.810–0.991) (Figure 4C, Table 4). Table 4 summarizes the sensitivity, specificity, PPV, and NPV of these models at −48W, −24w, and week 0.
Discussion
In this real-world multi-center study, three diagnostic nomogram algorithms based on AFP, AFP-L3, DCP (LAD), Age, Gender (C-GALAD), TBIL, and ALB (TAGALAD) were developed and validated to predict the risk and the prognoses of HCC in Chinese populations when different parameters were available. Especially, the TAGALAD nomogram demonstrated strong diagnostic accuracy to predict early-stage HCC and monitor the prognosis. As such, this nomogram algorithm could be used as a valuable tool to screen high-risk populations, detect HCC at the resectable stage, and monitor the prognosis of HCC after hepatectomy.
Despite the progress in the diagnosis and treatment of HCC, the morbidity and mortality rate of HCC is still rising rapidly demonstrating the urgent need to strengthen the research in developing high-sensitivity and non-invasive biomarkers for HCC early diagnosis.19 The AFP is a widely used, yet imperfect, biomarker for early HCC diagnosis.7 New strategies are therefore urgently needed.20 The AFP-L3 has been proved by the US Food and Drug Administration (FDA) to be used as a serum marker for high-risk populations screening,21–23 as a prognostic biomarker after treatment,24–26 and as a malignant biologic factor of HCC.27,28 The DCP is an abnormal protein, and several reports have indicated that DCP is more specific than AFP in the diagnosis of HCC.29,30
Due to the heterogeneity of tumors, single biomarker could not perform well in early detection.31 Recent diagnostic algorithms combining multiple biomarkers, such as GALAD and HES, are more sensitive for early diagnosis, with the sensitivity all over 70%.6,10–14 However, the previous studies were mostly limited to defined cross-sectional exploration, which may overestimate the diagnostic performance of biomarkers.32 The International Liver Cancer Association (ILCA) recently stressed the critical importance of retrospective longitudinal study to determine the performance of biomarkers in diagnosis and prognosis assessment.33
Of all the available machine learning algorithms, the nomogram is an easy-to-use visualized alternative LR scoring method and can facilitate management-related decision-making.34–36 Currently, in this study, compared with the three individual tumor biomarkers (AFP, AFP-L3, and DCP), the LAD nomogram, which digitally combined the AFP, AFP-L3, and DCP, could improve the diagnostic accuracy to detect HCC (LAD: AUC: 0.943, 95% CI: 0.938–0.948; AFP: AUC: 0.828, 95% CI: 0.819–0.836; AFP-L3: AUC: 0.764, 95% CI: 0.755–0.774; DCP: AUC: 0.919, 95% CI: 0.913–0.925) (Figures 1A, 2A and Table 3).
The GALAD algorithm incorporates the three biomarkers and has shown excellent diagnostic efficacy in several study cohorts, higher than each individual HCC biomarker.12–14 It is not surprising that the diagnostic efficacy of the panel is better than a single biomarker.12–14 For example, for the initial single-center study in the UK, the GALAD achieved a good diagnostic efficacy for detecting HCC with an AUC of 0.97.12 Similarly, the GALAD showed an encouraging diagnostic performance, with the sensitivity exceeding 80% for early HCC detection in a multi-national study that enrolled over 6,500 participants from Germany, UK, Hong Kong, and Japan.11 GALAD also achieved satisfactory diagnostic accuracy in the multi-center cohort with the nonalcoholic steatohepatitis (NASH)-related HCC patients.13 However, our previous study indicated that the diagnostic performance of DCP was higher than that of GALAD in HBV-positive patients in Chinese populations (AUC of DCP: 0.904, 95% CI: 0.865–0.934; GALAD: 0.813, 95% CI: 0.765–0.855; P<0.05).14 This finding indicated that the etiology as well as the ethnicity were among the important factors influencing the diagnostic accuracy and sensitivity.14 Therefore, the original GALAD score and cutoff value might not be perfectly suitable for Chinese HCC patients with HBV infection background.
In the present study, the β coefficients of each variable (gender, age, AFP, AFP-L3, and DCP) from the GALAD score were retrained and used to assign new nomogram points named Chinese-GALAD, C-GALAD (Figure 1B). We retrospectively compared the diagnostic performances of our C-GALAD and the GALAD score, the results demonstrated that the C-GALAD nomogram was better than the GALAD in Chinese populations (Training cohort: C-GALAD: 0.952, 95% CI: 0.947–0.956; GALAD: 0.925, 95% CI: 0.919–0.931; Internal validation cohort: C-GALAD: 0.908, 95% CI: 0.895–0.919; GALAD: 0.866, 95% CI: 0.851–0.879) (Figure 2A and E, Tables 3 and S3).
However, the most suitable combination of serum biomarkers for detecting HCC in China has not been thoroughly investigated. In our newly constructed HCC risk estimation nomogram (TAGALAD), the TBIL and ALB were found to be among risk factors for HCC in this study (Figure 1C). TBIL and ALB are important indicators for liver metabolic and synthetic functions. They are frequently used for liver function assessment and are among the important parameters in Child-Pugh grading.37 Although the variables in our TAGALAD nomograms partially overlapped with the BALAD-211 score, using the TBIL and ALB together with the five indicators of C-GALAD/GALAD, we obtained the best diagnostic efficacy among these diagnostic algorithms in both the training, internal and external validation cohort (AUCs of Training cohort: 0.969, 95% CI: 0.965–0.973; Internal validation cohort: 0.964, 95% CI: 0.956–0.972; External validation cohort: 0.931, 95% CI: 0.895–0.958) (Figure 2A, E, and H; Tables 3 and S3).
The associated risk factors of the long-term clinical outcome of HCC are scarcely understood.14 In our current study, we successfully validated the OS and RFS prediction values of our newly developed nomograms in the longitudinal follow-up validation cohort. Our three algorithm models (LAD, C-GALAD, and TAGALAD) all could stratify HCC populations into two distinct subgroups with high or low risk of OS and RFS. As shown in Figure 3, most patients in the high-risk subgroup suffered a poor prognosis after resection. Conversely, the low-risk populations have a consistently high overall survival rate and recurrence-free survival rate. Thus, if identified earlier, the high-risk subjects could receive active surveillance and intensified regimens to achieve a prolonged survival period.36
In addition to retrospective analysis, our newly developed nomogram was applied to a longitudinal (144 weeks) prospective cohort of chronic hepatitis B patients who might progress into HCC. The AUC results from TAGALAD, C-GALAD, and LAD demonstrated their capability to predict HCC up to 48 weeks prior to confirmed diagnosis. Importantly, at −48, −24, and 0 weeks, TAGALAD consistently showed the highest performance among the four HCC diagnostic algorithms, with AUCs of 0.984 (95% CI: 0.954–1.000), 0.900 (95% CI: 0.740–1.000), and 0.996 (95% CI: 0.900–1.000), respectively.
Evidences from both cross-sectional and longitudinal real-world data support the feasibility and effectiveness of our newly developed nomograms in the early detection and monitoring of HCC. However, this study has some limitations. Despite a considerable sample size, most samples came from case–control studies. Moreover, detection methods were limited to one defined system from the same manufacturer. Future validation of clinical feasibility necessitates larger cohorts in longitudinal and prospective studies using various detection systems.
Conclusion
In conclusion, the proposed nomograms generated from real-world Chinese populations are easy-to-use for risk estimation and prognostic prediction for HCC. The three nomograms (LAD, C-GALAD, and TAGALAD) not only could significantly outperform the GALAD score for the detection of HCC, but also were closely related to the HCC prognosis independently. While further validation in larger-scale longitudinal prospective cohorts assessing the benefit-to-harm ratio for blood-based surveillance is necessary, our results show the promise that blood-based tests could improve outcomes substantially for at-risk patients undergoing HCC surveillance.
Data Sharing Statement
Data sources and handling of the publicly available datasets used in this study are described in the Materials and Methods. Further details and other data that support the findings of this study are available from the corresponding authors upon request.
Statement of Ethics
The data obtained for this study complied with relevant data protection and privacy legislation. This study complied with the Declaration of Helsinki. This study has been approved by the Ethics Committee of Shanghai Oriental Hepatobiliary Surgery Hospital (EHBHKY2018-1-010). All enrolled patients have signed informed consent forms.
Acknowledgments
We extend our sincere gratitude to all the patients who participated in this research. We would also like to express our appreciation to Shanghai Jing’an District Central Hospital for providing the prospective samples for this study.
Funding
This work was supported by Innovation Group Project of Shanghai Municipal Health Commission (2019CXJQ03); National Science Foundation of China (82372321); Shanghai Shenkang Hospital Development Center Project (SHDC2023CRT015); the Clinical Research Project of Shanghai Municipal Health Commission (20224Y0057); and the Shanghai “Rising Stars of Medical Talent” Youth Development Program (2022-65 and 2021-99).
Disclosure
The authors report no conflicts of interest in this work.
References
1. Siegel RL, Miller KD, Fuchs HE, Jemal A. Cancer statistics, 2022. CA Cancer J Clin. 2022;72(1):7–33. doi:10.3322/caac.21708
2. Hayashi S, Nagaoka K, Tanaka Y. Blood-based biomarkers in hepatitis B virus-related hepatocellular carcinoma, including the viral genome and glycosylated proteins. Int J Mol Sci. 2021;22(20). doi:10.3390/ijms222011051
3. Wang Y, Tong Y, Zhang Z, et al. ViMIC: a database of human disease-related virus mutations, integration sites and cis-effects. Nucleic Acids Res. 2022;50(D1):D918–D927. doi:10.1093/nar/gkab779
4. European Association for the Study of the Liver. EASL Clinical Practice Guidelines: management of hepatocellular carcinoma. J Hepatol. 2018;69(1):182–236. doi:10.1016/j.jhep.2018.03.019
5. Marrero JA, Kulik LM, Sirlin CB, et al. Diagnosis, Staging, and management of hepatocellular carcinoma: 2018 practice guidance by the American Association for the Study of Liver Diseases. Hepatology. 2018;68(2):723–750. doi:10.1002/hep.29913
6. Yang JD, Addissie BD, Mara KC, et al. GALAD score for hepatocellular carcinoma detection in comparison with liver ultrasound and proposal of GALADUS score. Cancer Epidemiol Biomarkers Prev. 2019;28(3):531–538. doi:10.1158/1055-9965.EPI-18-0281
7. Trevisan franca de lima L, Broszczak D, Zhang X, Bridle K, Crawford D, Punyadeera C. The use of minimally invasive biomarkers for the diagnosis and prognosis of hepatocellular carcinoma. Biochim Biophys Acta Rev Cancer. 2020;1874(2):188451. doi:10.1016/j.bbcan.2020.188451
8. Wang W, Wei C. Advances in the early diagnosis of hepatocellular carcinoma. Genes Dis. 2020;7(3):308–319. doi:10.1016/j.gendis.2020.01.014
9. Liu X, Lu J, Zhang G, et al. A machine learning approach yields a multiparameter prognostic marker in liver cancer. Cancer Immunol Res. 2021;9(3):337–347. doi:10.1158/2326-6066.CIR-20-0616
10. Tayob N, Christie I, Richardson P, et al. Validation of the hepatocellular carcinoma early detection screening (hes) algorithm in a cohort of veterans with cirrhosis. Clin Gastroenterol Hepatol. 2019;17(9):1886–1893 e1885. doi:10.1016/j.cgh.2018.12.005
11. Berhane S, Toyoda H, Tada T, et al. Role of the GALAD and BALAD-2 serologic models in diagnosis of hepatocellular carcinoma and prediction of survival in patients. Clin Gastroenterol Hepatol. 2016;14(6):875–886 e876. doi:10.1016/j.cgh.2015.12.042
12. Johnson PJ, Pirrie SJ, Cox TF, et al. The detection of hepatocellular carcinoma using a prospectively developed and validated model based on serological biomarkers. Cancer Epidemiol Biomarkers Prev. 2014;23(1):144–153. doi:10.1158/1055-9965.EPI-13-0870
13. Best J, Bechmann LP, Sowa JP, et al. GALAD score detects early hepatocellular carcinoma in an international cohort of patients with nonalcoholic steatohepatitis. Clin Gastroenterol Hepatol. 2020;18(3):728–735 e724. doi:10.1016/j.cgh.2019.11.012
14. Huang C, Fang M, Xiao X, et al. Validation of the GALAD model for early diagnosis and monitoring of hepatocellular carcinoma in Chinese multicenter study. Liver Int. 2022;42(1):210–223. doi:10.1111/liv.15082
15. Wang Q, Chen Q, Zhang X, et al. Diagnostic value of gamma-glutamyltransferase/aspartate aminotransferase ratio, protein induced by vitamin K absence or antagonist II, and alpha-fetoprotein in hepatitis B virus-related hepatocellular carcinoma. World J Gastroenterol. 2019;25(36):5515–5529. doi:10.3748/wjg.v25.i36.5515
16. Alexander M, Loomis AK, van der Lei J, et al. Risks and clinical predictors of cirrhosis and hepatocellular carcinoma diagnoses in adults with diagnosed NAFLD: real-world study of 18 million patients in four European cohorts. BMC Med. 2019;17(1):95. doi:10.1186/s12916-019-1321-x
17. Chinese Society of Infectious Diseases CMA, Chinese Society of Hepatology CMA. 慢性乙型肝炎防治指南(2019版) [The guidelines of prevention and treatment for chronic hepatitis B (2019 version)]. Zhonghua Gan Zang Bing Za Zhi. 2019;27(12):938–961. Chinese. doi:10.3760/cma.j.issn.1007-3418.2019.12.007
18. Hashem S, ElHefnawi M, Habashy S, et al. Machine learning prediction models for diagnosing hepatocellular carcinoma with HCV-related chronic liver disease. Comput Methods Programs Biomed. 2020;196:105551. doi:10.1016/j.cmpb.2020.105551
19. Ghosh S, Bhowmik S, Majumdar S, et al. The exosome encapsulated microRNAs as circulating diagnostic marker for hepatocellular carcinoma with low alpha-fetoprotein. Int, J, Cancer. 2020;147(10):2934–2947. doi:10.1002/ijc.33111
20. Kokudo N, Takemura N, Hasegawa K, et al. Clinical practice guidelines for hepatocellular carcinoma: the Japan Society of Hepatology 2017 (4th JSH-HCC guidelines) 2019 update. Hepatol Res. 2019;49(10):1109–1113. doi:10.1111/hepr.13411
21. Zhao T, Jia L, Li J, et al. Heterogeneities of site-specific N-Glycosylation in HCC tumors with low and high AFP concentrations. Front Oncol. 2020;10:496. doi:10.3389/fonc.2020.00496
22. Wang X, Zhang Y, Yang N, et al. Evaluation of the combined application of AFP, AFP-L3%, and DCP for Hepatocellular Carcinoma Diagnosis: a Meta-analysis. Biomed Res Int. 2020;2020:5087643. doi:10.1155/2020/5087643
23. Chalasani NP, Ramasubramanian TS, Bhattacharya A, et al. A novel blood-based panel of methylated DNA and protein markers for detection of early-stage hepatocellular carcinoma. Clin Gastroenterol Hepatol. 2021;19(12):2597–2605 e2594. doi:10.1016/j.cgh.2020.08.065
24. Cheng J, Wang W, Zhang Y, et al. Prognostic role of pre-treatment serum AFP-L3% in hepatocellular carcinoma: systematic review and meta-analysis. PLoS One. 2014;9:1.
25. Toyoda H, Kumada T, Tada T. Highly sensitive Lens culinaris agglutinin-reactive alpha-fetoprotein: a new tool for the management of hepatocellular carcinoma. Oncology. 2011;81(Suppl 1):61–65. doi:10.1159/000333263
26. Wang NY, Wang C, Li W, et al. Prognostic value of serum AFP, AFP-L3, and GP73 in monitoring short-term treatment response and recurrence of hepatocellular carcinoma after radiofrequency ablation. Asian Pac J Cancer Prev. 2014;15(4):1539–1544. doi:10.7314/APJCP.2014.15.4.1539
27. Bertino G, Ardiri A, Malaguarnera M, Malaguarnera G, Bertino N, Calvagno GS. Hepatocellular carcinoma serum markers. Semin Oncol. 2012;39(4):410–433. doi:10.1053/j.seminoncol.2012.05.001
28. Nouso K, Kobayashi Y, Nakamura S, et al. Prognostic importance of fucosylated alpha-fetoprotein in hepatocellular carcinoma patients with low alpha-fetoprotein. J Gastroenterol Hepatol. 2011;26(7):1195–1200. doi:10.1111/j.1440-1746.2011.06720.x
29. Ji J, Liu L, Jiang F, et al. The clinical application of PIVKA-II in hepatocellular carcinoma and chronic liver diseases: a multi-center study in China. J Clin Lab Anal. 2021;35(11):e24013. doi:10.1002/jcla.24013
30. Ji J, Wang H, Li Y, et al. Diagnostic evaluation of des-gamma-carboxy prothrombin versus alpha-fetoprotein for hepatitis B virus-related hepatocellular carcinoma in china: a large-scale, multicentre study. PLoS One. 2016;11(4):e0153227. doi:10.1371/journal.pone.0153227
31. Singal AG, Tayob N, Mehta A, et al. GALAD demonstrates high sensitivity for HCC surveillance in a cohort of patients with cirrhosis. Hepatology. 2022;75(3):541–549. doi:10.1002/hep.32185
32. Tsuchiya N, Sawada Y, Endo I, Saito K, Uemura Y, Nakatsura T. Biomarkers for the early diagnosis of hepatocellular carcinoma. World J Gastroenterol. 2015;21(37):10573–10583. doi:10.3748/wjg.v21.i37.10573
33. Singal AG, Hoshida Y, Pinato DJ, et al. International Liver Cancer Association (ILCA) white paper on biomarker development for hepatocellular carcinoma. Gastroenterology. 2021;160(7):2572–2584. doi:10.1053/j.gastro.2021.01.233
34. Huang C, Fang M, Feng H, et al. N-glycan fingerprint predicts alpha-fetoprotein negative hepatocellular carcinoma: a large-scale multicenter study. Int, J, Cancer. 2021;149(3):717–727. doi:10.1002/ijc.33564
35. Huang C, Liu L, Wang H, et al. Serum N-glycan fingerprint nomogram predicts liver fibrosis: a multicenter study. Clin Chem Lab Med. 2021;59(6):1087–1097. doi:10.1515/cclm-2020-1588
36. Huang C, Xu X, Wang M, et al. Serum N-glycan fingerprint helps to discriminate intrahepatic cholangiocarcinoma from hepatocellular carcinoma. Electrophoresis. 2021;42(11):1187–1195. doi:10.1002/elps.202000392
37. Liu W, Li X, Zheng W, Yao R, Zheng J. Preoperative evaluation of the degree of liver fibrosis based on matter-element analysis using serological indicators in patients with hepatocellular carcinoma. Biosci Trends. 2019;13(1):70–76. doi:10.5582/bst.2018.01311
 © 2024 The Author(s). This work is published and licensed by Dove Medical Press Limited. The
full terms of this license are available at https://www.dovepress.com/terms.php
and incorporate the Creative Commons Attribution
- Non Commercial (unported, v3.0) License.
By accessing the work you hereby accept the Terms. Non-commercial uses of the work are permitted
without any further permission from Dove Medical Press Limited, provided the work is properly
attributed. For permission for commercial use of this work, please see paragraphs 4.2 and 5 of our Terms.
© 2024 The Author(s). This work is published and licensed by Dove Medical Press Limited. The
full terms of this license are available at https://www.dovepress.com/terms.php
and incorporate the Creative Commons Attribution
- Non Commercial (unported, v3.0) License.
By accessing the work you hereby accept the Terms. Non-commercial uses of the work are permitted
without any further permission from Dove Medical Press Limited, provided the work is properly
attributed. For permission for commercial use of this work, please see paragraphs 4.2 and 5 of our Terms.