")
Back to Journals » International Journal of General Medicine » Volume 15
Risk-Related Genes and Associated Signaling Pathways of Gastrointestinal Stromal Tumors
Authors Gao F , Wang J, Li C, Xie C, Su M, Zou C, Xie X, Zhao D
Received 28 January 2022
Accepted for publication 28 March 2022
Published 8 April 2022 Volume 2022:15 Pages 3839—3849
DOI https://doi.org/10.2147/IJGM.S357224
Checked for plagiarism Yes
Review by Single anonymous peer review
Peer reviewer comments 2
Editor who approved publication: Dr Scott Fraser
Fulai Gao,1,2 Jiaqi Wang,3 Changjuan Li,1 Changshun Xie,2 Miao Su,1 Chunyan Zou,2 Xiaoli Xie,1 Dongqiang Zhao1
1Department of Gastroenterology, The Second Hospital of Hebei Medical University, Shijiazhuang, 050000, People’s Republic of China; 2Department of Gastroenterology, The First Hospital of Qinhuangdao, Qinhuangdao, 066000, People’s Republic of China; 3Basic Medical College, Hebei Medical University, Shijiazhuang, 050000, People’s Republic of China
Correspondence: Dongqiang Zhao, Department of Gastroenterology, The Second Hospital of Hebei Medical University, No. 215, He Ping West Road, Xinhua District, Shijiazhuang, 050000, People’s Republic of China, Tel +86 0311 66636179, Email [email protected]
Purpose: Knowledge on the potential association between differential gene expression and risk of gastrointestinal stromal tumors (GISTs) is currently limited. We used bioinformatics tools to identify differentially expressed genes in GIST samples and the related signaling pathways of these genes.
Patients and Methods: The GSE136755 dataset was obtained from the GEO database and differentially expressed genes (CENPA, CDK1, TPX2, CCNB1, CCNA2, BUB1, AURKA, KIF11, NDC80) were screened using String and Cytoscape bioinformatics tools. Then, three groups of eight patients at high, intermediate and low risk of GIST were selected from patients diagnosed with GIST by immunohistochemistry in our hospital from October 2020 to March 2021. Differential expression of CDK1 and BUB1 was verified by comparing the amount of expressed p21-Activated kinase 4 (PAK4) protein in pathological sections.
Results: SPSS26.0 analysis showed that the expression level of PAK4 in GISTs was significantly higher than in normal tissues and paratumoral tissues and there was significant difference among the three groups of patients (P < 0.01). PAK4 levels in paratumoral and normal tissues were negligible with no significant difference between the tissues.
Conclusion: CENPA, CDK1, TPX2, CCNB1, CCNA2, BUB1, AURKA, KIF11 and NDC80 gene expression can be used as biomarkers to assess the risk of gastrointestinal stromal tumors whereby expression increases gradually with the increased risk of GIST formation. The genes encode proteins that regulate the division, proliferation and apoptosis of gastrointestinal stromal tumors mainly through PI3K/AKT, MARK, P53, WNT and other signaling pathways.
Keywords: PAK4, differential gene expression, signaling pathway analysis
Introduction
The term gastrointestinal stromal tumor (GIST) was first proposed by Mazur and Clark in 1983.1 It describes a mesenchymal tumor originating from Cajal cells,2,3 which are the cells coordinating the intestinal autonomic nervous system and smooth muscle cells that regulate movement and peristalsis. Most GISTs originate from the sub-mucous or lamina propria,4 and they are mainly caused by mutations in the tyrosine kinase receptor protein gene c-KIT or the platelet-derived growth factor receptor α (PDGFRA).5,6 Other wild-type GIST mutations include those identified in SDHX, BRAF, NF1, K/N-RAS, and PIK3CA genes.7–9 The annual incidence rate of GIST ranges between 10 and 20 per million with the disease usually occurring after childhood and peaking at 60 years.10,11 There are 3300–6000 newly diagnosed cases in the United States each year,12,13 with large differences across regions.14,15 Primary GISTs may occur anywhere from the esophagus to the rectum, but most occur in the stomach (60%), followed by those in the small intestine (20–30%), colo-rectum (10%), esophagus (5%), and other parts of the abdominal cavity (5%).16,17 The clinical symptoms vary according to the location of the lesions and include abdominal pain, abdominal distension, early satiety, and other abdominal discomforts (such as abdominal masses, abdominal bleeding, gastrointestinal bleeding, and anemia-related symptoms).18 Lymph node metastases are rare, but the liver and abdomen are the most frequently affected sites. Small intestine GISTs are twice as likely to present as a clinical malignant tumor than those of the stomach, and most colorectal GISTs are invasive advanced tumors with poor prognoses; however, a small number of reliable malignancy indicators are currently available.19,20
Miettinen and Lasota associated the size of the GISTs with their mitotic activity and they proposed anatomical sites to grade the risk of GIST and provide comprehensive information on their prognosis.17,21 The rapid development of gene sequencing technology has provided a basis for clinical disease diagnosis and prognosis. In this study, we used available transcriptome sequencing data to resolve a possible relationship between gene expression in tumors with different levels of risk of developing GISTs. From the analysis, we identified genes associated with the risk classification and the potential signaling pathways involved.
The P21-activated kinase 4 (PAK4) belongs to the Serine/Threonine kinase family, located at the locus 19q13.2 on human chromosome 19. The PAK4 cDNA is about 1776bp in length, which encodes a 64 kDa protein and is the downstream effector of Ras-related C3 botulinum toxin substrate 1 (Rac1) and cell division control protein 42 homologue (Cdc42).22–24 PAK4 protein is overexpressed in cancer cells, and its upregulation is related to tumorigenesis. In fact, some studies have shown that overexpression of PAK4 is involved in carcinogenesis through different mechanisms, including promoting cell proliferation, invasion and migration, protecting cells from apoptosis, stimulating tumor cell growth, and regulating cytoskeleton tissue and adhesion.25 PAK4 is significantly up-regulated in pancreatic cancer, breast cancer, prostate cancer and colon cancer, but it is not clearly reported in GIST.
Patients and Methods
Study Design and Patients
We obtained and data mined the GIST mRNA GSE136755 dataset from the Gene Expression Omnibus (GEO) (https://www.ncbi.nlm.nih.gov/gds) database available in the National Center for Biotechnology Information (NCBI) (https://www.ncbi.nlm.nih.gov/) platform.26,27 In parallel, mRNA expression profiles of 65 GIST tumors were obtained by our Japanese collaborators. Of the 65 GIST samples, 59 were primary tumors (43 stomach, 4 small intestine, 5 colon, 1 esophagus, 6 duodenum), and 6 were metastases (Supplementary Table 1).28 We transformed the probe gene names into standard gene names. We then selected the samples of 59 patients with primary tumors from the initial 65 samples in the dataset. The samples were divided into three risk groups: high-risk (n=17), intermediate-risk (n=9), and low-(and very low) risk groups (n=33).
Differential Gene Screening
We used the Limma package software of the R language to compare the gene expression profiles of selected genes within the three groups of patients. We introduced these genes into String (https://string-db.org), selected the gene products that interact with each other and extracted the associated genes. This resulted in a total of 148 differentially expressed genes (Supplementary Table 2). The Cytoscape (https://cytoscape.org) software was used to construct visual charts.
Hub Genes Screening
The genes obtained from the String analysis were introduced into Cytoscape and Hub genes were selected using the MCODE plug-in (Supplementary Table 3). A cutoff value and degree rank (degree cutoff, 2; node score cutoff, 0.05) were set to determine the top hub genes associated with GIST risk.
Study Design and Patients
We selected tissues from 24 patients with GIST who had been discharged from the Pathology Department of our hospital and confirmed the diagnosis of GIST by immunohistochemistry. The 24 samples were made up of 8 patients in the high-risk group, 8 from patients in the intermediate-risk group, 8 from patients in the low-risk group while 8 healthy controls were also selected.
PAK4 Immunohistochemistry Procedure
The pathologic tissues were fixed in 4% paraformaldehyde in Phosphate Buffered Saline (PBS) for over 24 hours and then soaked and washed overnight in PBS. The tissues were dehydrated by immersion in increasing concentrations of ethanol (60%, 70%, 80%, 90%, 95% each for 2 hours and 100% ethanol for 1.5 hours). Access ethanol was removed with xylene. Once the tissues became translucent, they were placed into a wax solution at 60°C for 6 hours to embed them into wax blocks. The blocks were then sliced into 5-μm consecutive sections. Next, the sections were rehydrated and baked at 45°C overnight. For de-waxing, the sections were treated with xylene twice followed by a gradient of alcohol (100%, 95%, 90%, 80%, 70%, 60%) before rinsing with tap water twice, and washing 3 times with PBS for 5 minutes each time. The sections were then treated with citrate buffer at 92–95°C (in a water bath) for 20 minutes for the purpose of antigen retrieval, followed by washing with PBS 3 times, each time for 5 minutes. We incubated the samples with primary antibody (Rabbit PKA4 antibody, 100 mL SAB) for 4 nights, and then washed the samples three times for 5 minutes each time. We added drops of secondary antibody (rabbit SP detection reagent) and incubated the samples for 30 minutes at room temperature, before washing them 3 times in PBS for 5 minutes. We used DAB (3,3’-diaminobenzidine) chromogen and hematoxylin re-staining of cell nuclei. Finally, the sections were sealed with gradient alcohol dehydration and neutral gum before microscopic observation.
PAK4 Observation
PAK4 positivity was assessed according to the criteria established by Callow et al29,30 which combined staining intensity and percentage of cells stained. PAK4 positivity was graded from 0 to 3: unstained cells were graded as 0, cells with weak staining as 1, cells with moderate staining as 2, and cells with strong staining as 3; stained cells accounting for less than 5% of the total cells were scored as 0, those representing 5–25% of the total as 1, those representing 26–50% of the total as 2, and those representing ≥51% of the total as 3. The sum of the scores of staining intensity and percentage of positive cells were then graded with 0 being negative (–), 1 and 2 being weakly positive (+), 3 and 4 being moderately positive (++), and 5 or more being strongly positive (+++). Three professional pathologists used the criteria above to score the slides blind. The average of the three scores was subjected to statistical analysis using SPSS 26.0.
Results
The comparative analysis between the three risk groups revealed that among the 22,124 genes involved in the comparison, 2988 differentially expressed genes were identified in the high-risk and low-risk groups and a further 682 genes in a comparison between high-risk and intermediate-risk groups. Between the two sets of differentially expressed genes, 577 of them were present in both datasets, and the comparison between high-risk and low-risk groups (P<0.05) can be visualized the colour red represents up-regulated genes while blue represents down-regulated genes (Figure 1). Subsequently, from the set of 577 common differentially expressed genes (adjusted to P<0.05), 270 genes (84 adjusted downward and 186 adjusted upward) with an absolute value of log2 (fold change [FC]) ≥1 were identified. At last, we identified nine top genes potentially associated with the GIST risk classification, these genes include CENPA, CDK1, TPX2, CCNB1, CCNA2, BUB1, AURKA, KIF11, NDC80, and marked with yellow (Figure 2).
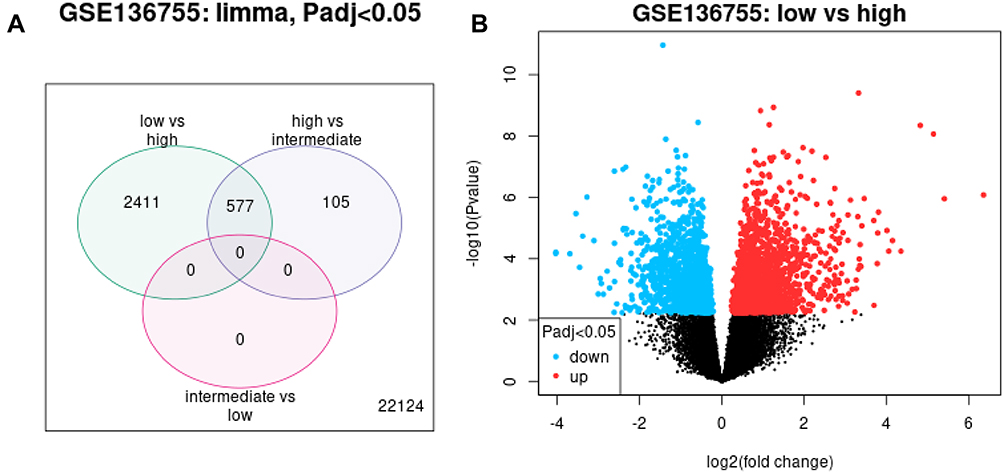 |
Figure 1 Differentially expressed genes among different risk groups. (A) Number of differentially expressed genes among high, intermediate and low risk groups. High-risk vs intermediate-risk = 682, high-risk vs low-risk = 2988 with a total of 577 overlapping genes. (B) Differentially expressed genes of the high-risk versus low-risk groups. Blue, down-regulated genes; red, up-regulated genes; black, non-differentially expressed genes. |
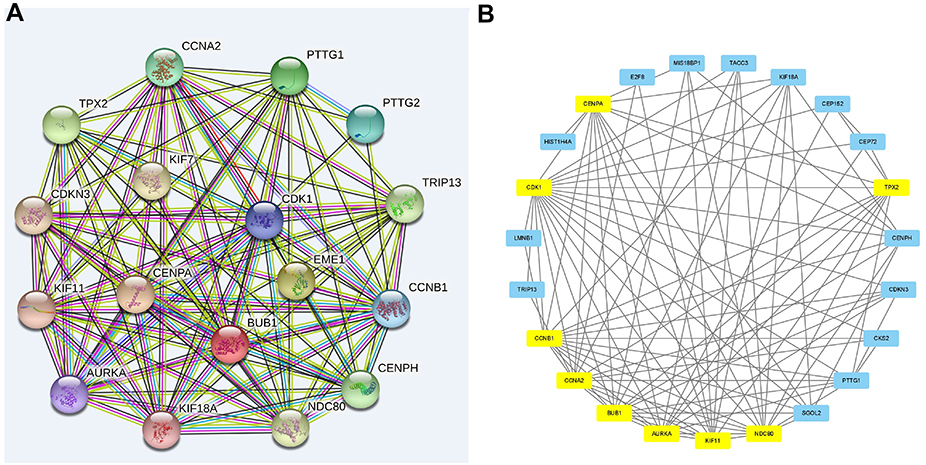 |
Figure 2 Hub genes and their relationship with each other. (A) Grid diagram and correlation display of the differentially expressed genes generated by the String software, the denser the connection, the stronger the association. (B) Key differentially expressed genes selected using the MCODE plug-in in Cytoscape, hub genes (TPX2, CENPA, CDK1, CCNB1, CCNA2, BUB1, AURKA, KIF11, and NDC80) are indicated in yellow. |
SPSS26.0 analysis showed that the expression level of PAK4 in GISTs was significantly higher than that in normal tissues and paratumoral tissues (Tables 1–4), there was significant difference among the three groups (p<0.01) and the expression of PAK4 in paratumoral tissues and normal tissues was negligible with no notable significant difference between the control samples (Figure 3).
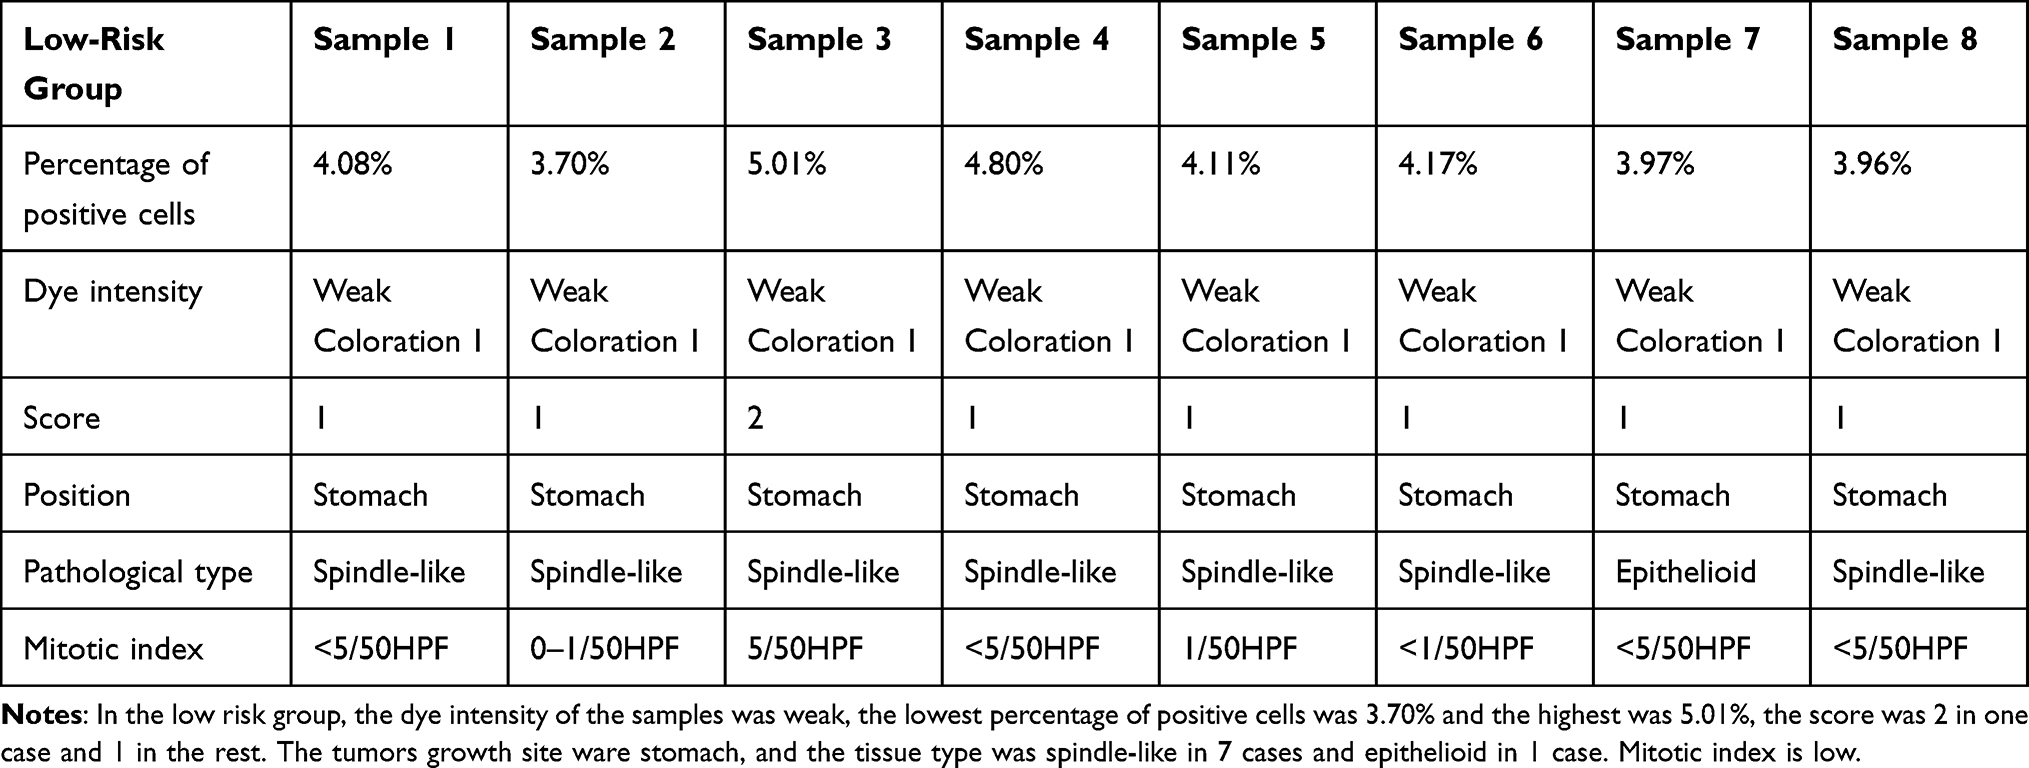 |
Table 1 Scores of Gastrointestinal Stromal Tumors in Low-Risk Group |
 |
Table 2 Scores of Gastrointestinal Stromal Tumors in Intermediate-Risk Group |
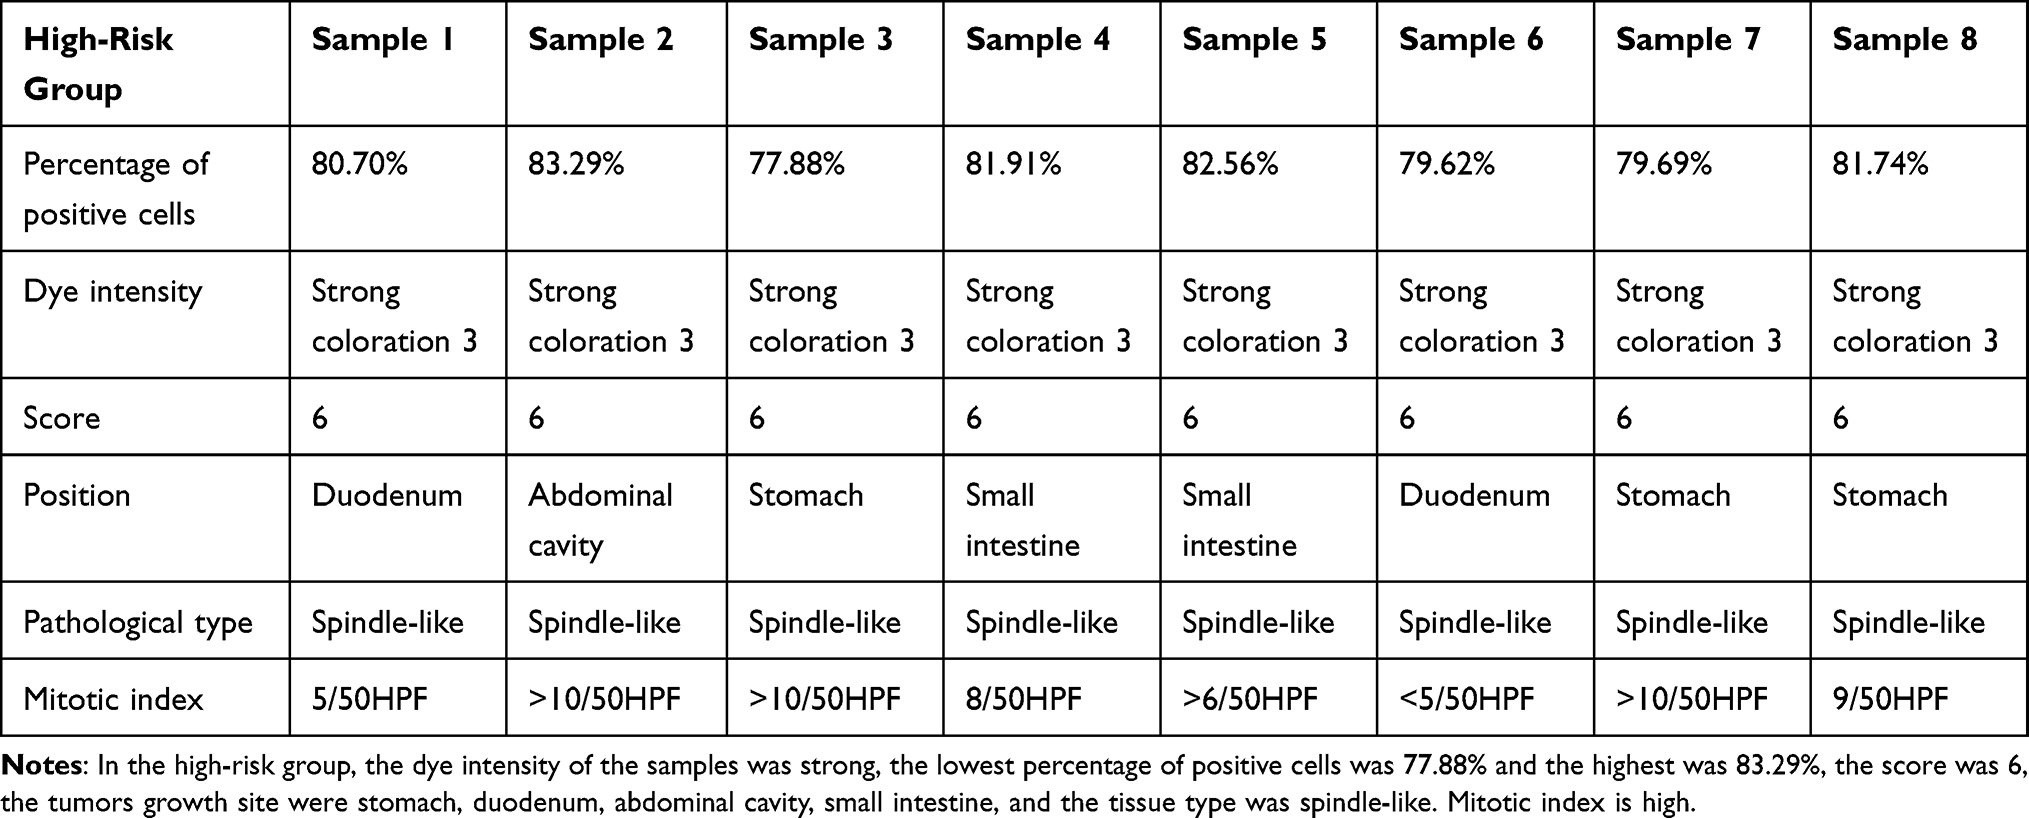 |
Table 3 Scores of Gastrointestinal Stromal Tumors in High-Risk Group |
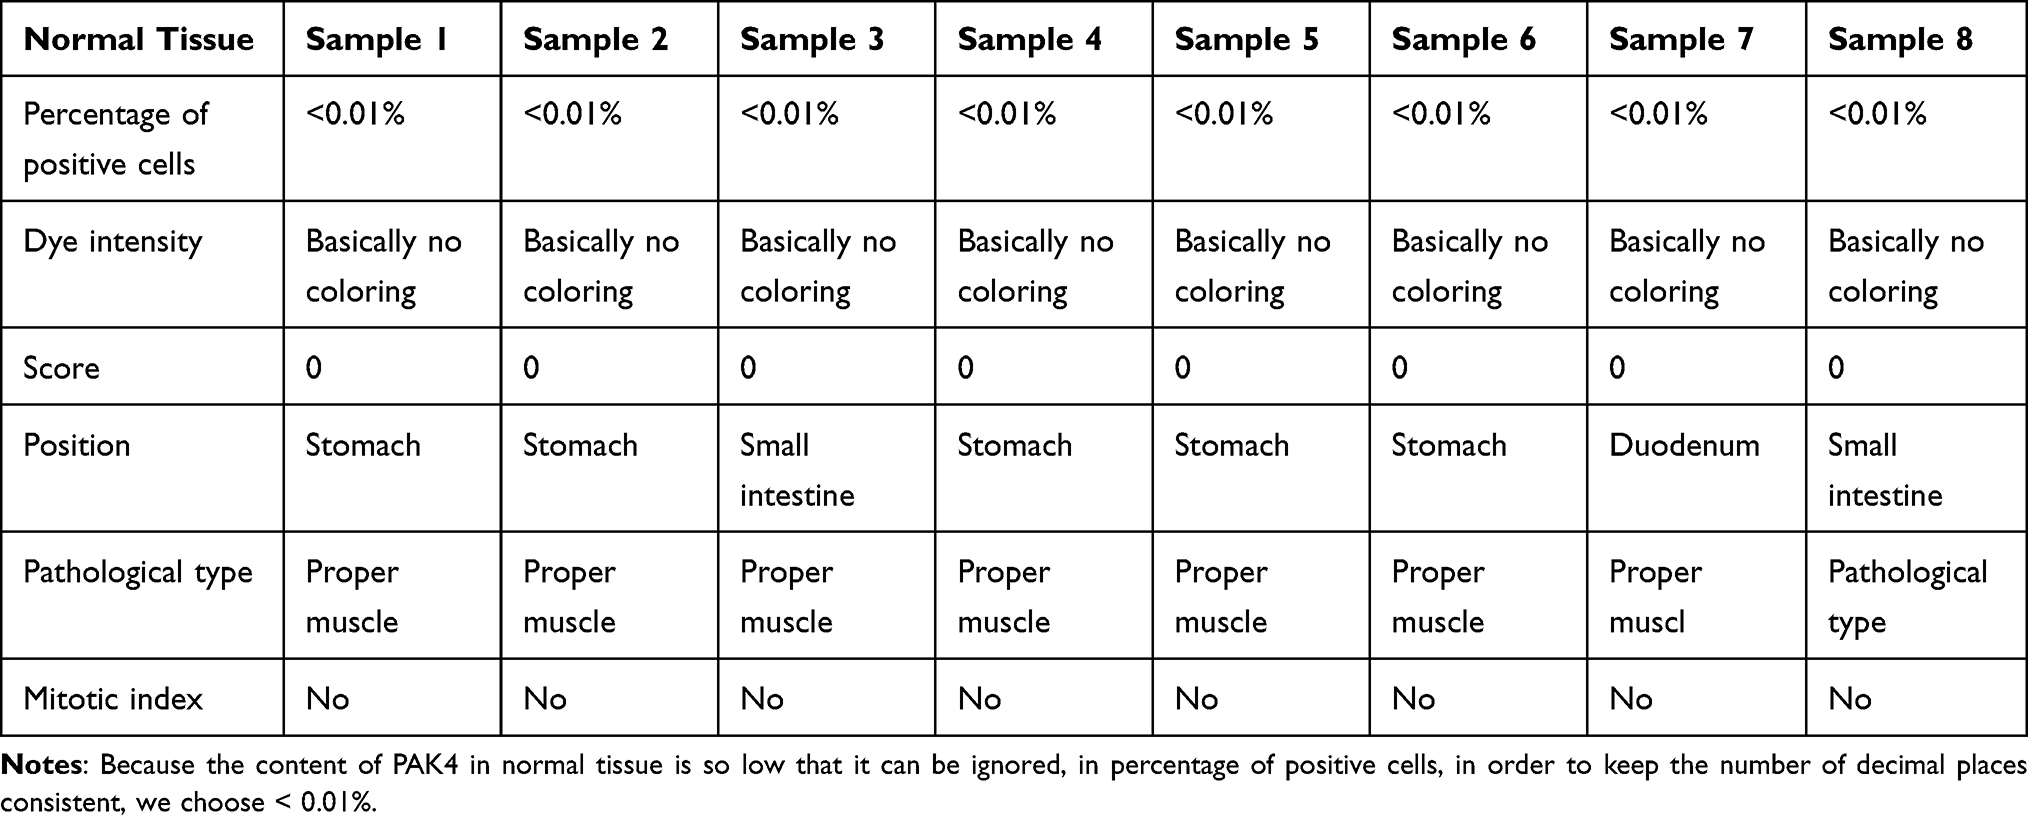 |
Table 4 Scores of Normal Tissue |
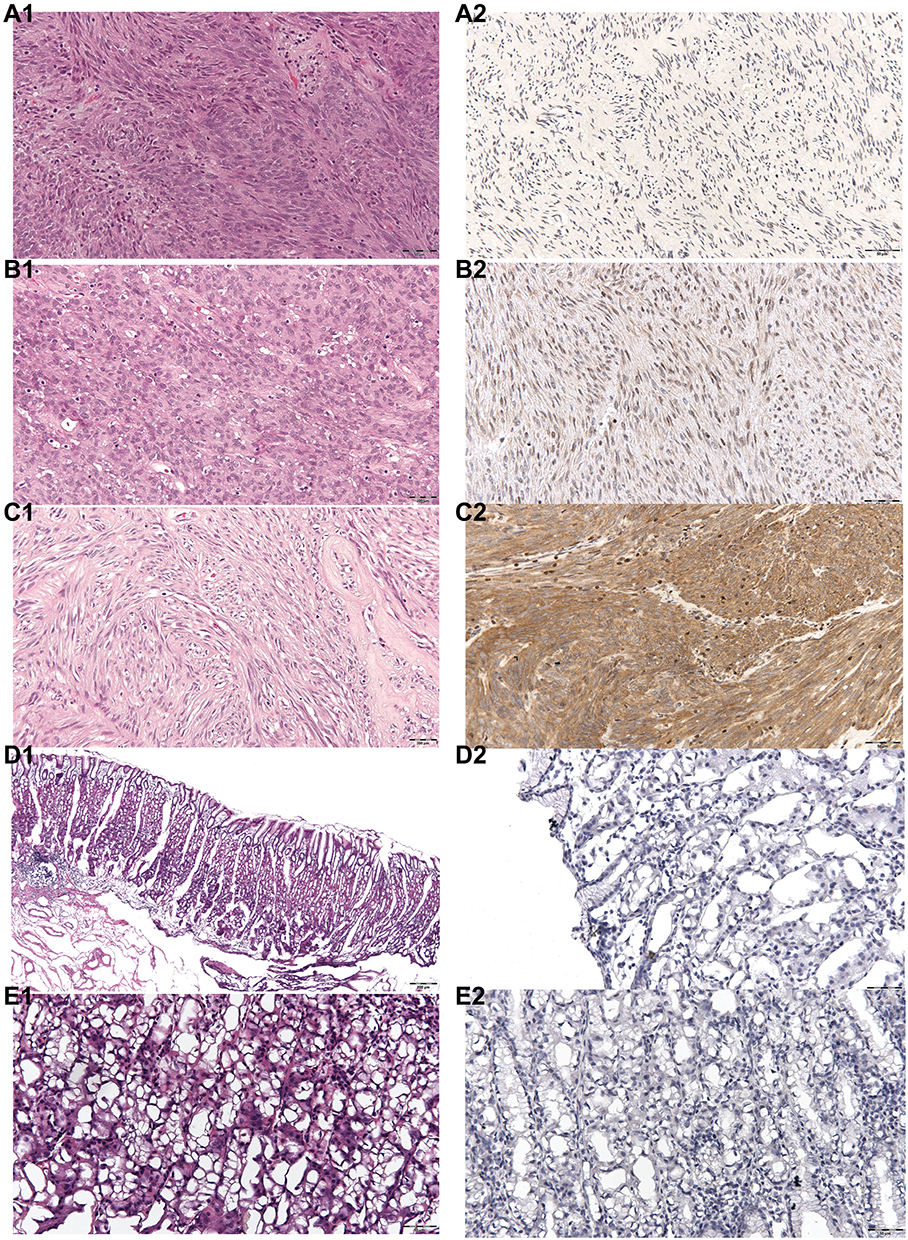 |
Figure 3 HE staining and PAK4 content in low-risk, intermediate-risk, high-risk GIST, normal tissues and paratumoral tissues. (A1) HE staining for low-risk GIST. (A2) PAK4 content of low-risk GIST, yellow cells represent PAK4 positivity. (B1) HE staining for intermediate-risk GIST. (B2) PAK4 content of intermediate-risk GIST, yellow cells represent PAK4 positivity. (C1) HE staining for high-risk GIST. (C2) PAK4 content of high-risk GIST. Yellow cells represent PAK4 positivity. (D1) HE staining of normal control tissue. (D2) PAK4 content of normal tissue. Yellow cells represent PAK4 positivity, yellow cells can hardly be seen. (E1) HE staining of paratumoral tissue. (E2) PAK4 content of paratumoral tissue. Yellow cells represent PAK4 positivity, yellow cells can hardly be seen. |
Signaling Pathway and Enrichment Analysis of Differentially Expressed Genes
We carried out KEGG and GO enrichment analyses of the differentially expressed genes and mapped the identified genes to each signaling pathway. Gene activities were illustrated as gene associations in a histogram (Figure 4). KEGG–Mapper was also used to analyze common pathways between genes (Figure 5). These differentially expressed genes share common pathways or participate in a variety of signaling pathways. The main signaling pathways identified were the PI3K-Akt, P53, cell cycle, MAPK, and WNT signaling pathways. Among the proteins encoded by the differentially expressed genes, CDK1, CCNB1 and TPX2 participate in the P53 signaling pathway; CDK1, CCNB1, CCNA2 and BUB1 are involved in the cell cycle pathway while CCNA2 participates in the MAPK signaling pathway. TPX2 participates in the PI3K signaling pathway, an important pathway for GIST malignant progression driving gene changes and activation.31,32 Phosphorylated PI3K/Akt/mTOR pathway components affect the cell cycle and regulate apoptosis by mediating important downstream signals.33 The WNT signaling pathway is well known for its contribution to tumor malignancy in many cancers and it drives tumor progression in GISTs.34–36 The most active gene, CCNA2, participates in 11 pathways including the cell cycle pathway, the MAPK pathway and the cellular senescence pathway.
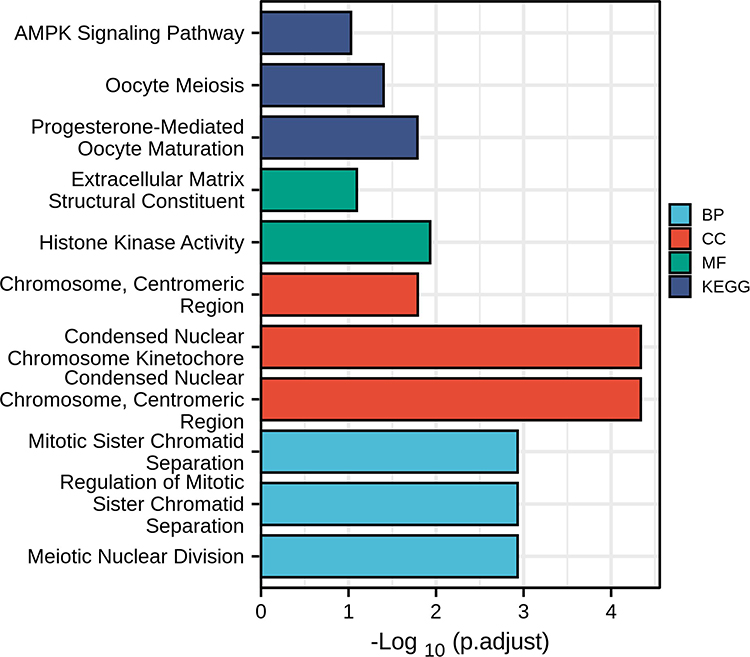 |
Figure 4 KEGG and GO differential gene enrichment analysis histogram. The ordinate axis indicates different signaling pathways, and the abscissa represents the number of genes in this pathway. The three GO features are cell component (CC), molecular function (MF), and biological process (BP). |
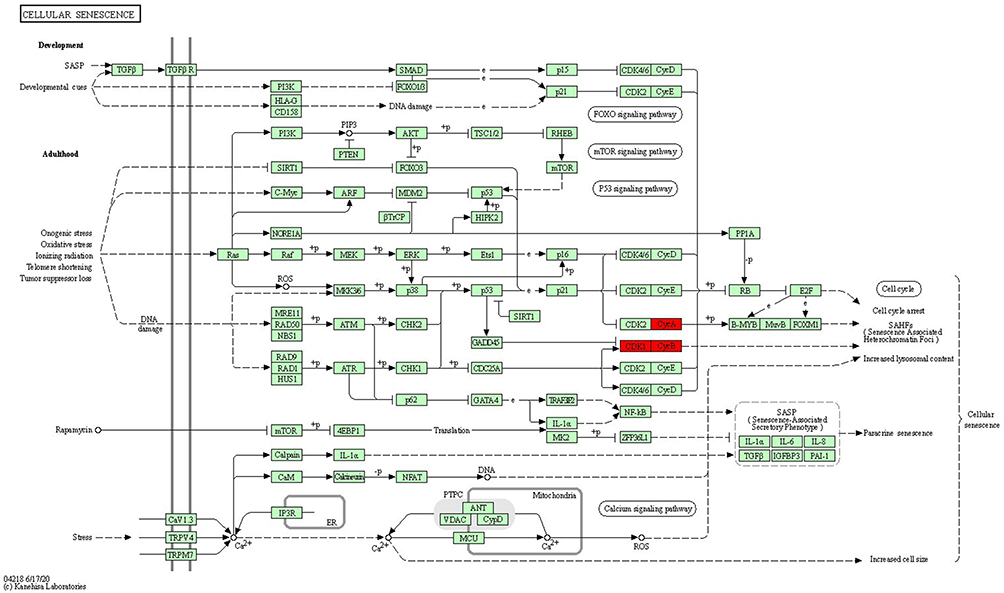 |
Figure 5 Cell senescence signaling pathway. The CDK1 gene cluster (in red) participates in the cell senescence-signaling pathway, which interacts with both the PI3K signaling pathway and the cell cycle. |
Discussion
Approximately 85% of GISTs in adults are caused by c-KIT or PDGFRA mutations. The other 15% can be traced to the respective wild type or non-mutated genes. c-KIT or PDGFRA mutations are the earliest events in GISTs, but neither of them individually can lead to malignant progression. With the technical advancements of biotechnology, high-throughput single-cell sequencing has laid the foundation for researchers to explore key genes underlying GIST risk stratification. The GSE136755 dataset has resulted from this progress; it contains the mRNA expression profiles of samples from 65 patients with GIST (39 male and 26 female patients) using the Sureprint G3Human Gene Expression 8x60K V2 microarray (Agilent Technology).37 We hypothesized that there would be an insignificant difference between samples from low- and very low-risk groups and therefore grouped cases into high-, intermediate- and low-risk groups. After our analysis, we confirmed that gene expression between the low and very low risk groups was indeed similar.
We identified common differentially expressed genes and Hub genes by comparing the profiles from different groups and visualized the networks and biological channels of their molecular interactions using the Cytoscape software. The GIST risk classification in Cytoscape differs from that established by the National Institutes of Health (NIH) where the criteria take into account tumor location, mitotic count, tumor rupture and size.38 In our study, we determined the GIST risk classification according to the identified critical genes indicating risk of disease progression. The use of these genes as biomarkers could enable prediction of clinical prognoses.
Japanese researchers experimenting with malignant GIST samples found that mutations, loss of heterozygosity (LOH) and abnormal expression occur mainly in driver genes associated with PI3K signaling pathways and the cell cycle.26 They noted that inhibiting the PI3K signaling pathways may be an effective strategy to treat GIST progression.39,40 We found that TPX2 is a key gene in the PI3K signaling pathway according to the KEGG–Mapper grid. The PI3K and cell cycle signaling pathways are downstream signals activated by mutated KIT or PDGFRA oncogenes that may also affect the MAPK signaling pathway.41–43
CDK1 and BUB1 genes encode for members of the serine/threonine protein kinase family, which play a central role in mitosis.27,44 p21-activated kinases (PAKs) are a family of serine/threonine protein kinases that function downstream of the Rho small GTPases Cdc42 and Rac. The six human PAK kinases are divided into two groups: the first group consists of PAKs 1–3 and the second group is made up of PAKs 4–6. All PAK members have a P21-binding domain (PBD) that binds to the Rho family GTPases to activate their kinase activity.45 P21-activated kinase 4 (PAK4) is the most important PAK member; it can induce tumor cell proliferation and metastasis by promoting phosphorylation of tumor signaling proteins.46 Studies have shown that PAK4 is aberrantly expressed in malignant hepatocytes and in gastric adenocarcinoma and non-small cell lung cancer cells, where it plays an important role in tumorigenesis, development and metastasis of tumors. However, its expression in malignant GISTs has not been reported.
PAK4 is the only member of the PAK family that functions to promote cancer when it is overexpressed in human cells. High levels of PAK4 are related to carcinogenesis whereby PAK4 participates in multiple signaling pathways and affects cell proliferation, cell cycle, cytoskeleton remodeling, inhibition of apoptosis and many other biological processes. Overexpressed PAK4 is actively involved in the Wnt/β-catenin signaling pathway which is also implicated in many human diseases, including cancer.47 PAK4 has been shown to stabilize and activate the transcription of β-catenin-dependent Wnt target genes such as cyclin D which regulates cell proliferation.48 It has been shown that49 PAK4 up-regulates AKT phosphorylation through direct binding to PI3K, thus activating the PI3K/AKT signaling pathway in cancer cells.50–52 The PI3K/AKT pathway is involved in many cellular processes that promote cell survival, proliferation, differentiation and angiogenesis. MAPK and PI3K pathway are two typical pathways downstream of mutant K-RAS, which is an almost common feature of pancreatic ductal adenocarcinoma. PAK4 regulates the activity of glucose-6-phosphate dehydrogenase (G6PD) through p53 degradation and participates in the development of colon cancer. Studies have confirmed that most cancer cells consume more glucose and produce metabolism critical for rapid proliferation and survival through major changes in several energy metabolic pathways, including glucose transport, glycolysis and pentose phosphate pathway.53 This is also an important factor to promote the development of tumor.
Conclusion
In summary, CENPA, CDK1, TPX2, CCNB1, CCNA2, BUB1, AURKA, KIF11, NDC80 can be used as differentially expressed genes to indicate the risk of GISTs, where expression of these genes increases gradually with the increase in risk of GISTs. These genes regulate the division, proliferation and apoptosis of GISTs mainly through PI3K/AKT, MARK, P53, WNT and other signaling pathways.
Data Sharing Statement
All the data in the present study are available in the public database (https://www.ncbi.nlm.nih.gov).
Ethics Statement
All the participants informed consent to the experiment and signed the informed consent form in accordance with the Declaration of Helsinki and approved by the Research Ethics Committee of Qinhuangdao first Hospital (serial number: 2021C014).
Acknowledgments
We thank all participants enrolled in the GEO cohort and all our colleagues for constructive discussions and technical assistance.
Author Contributions
All authors made a significant contribution to the work reported, whether that is in the conception, study design, execution, acquisition of data, analysis and interpretation, or in all these areas; took part in drafting, revising or critically reviewing the article; gave final approval of the version to be published; have agreed on the journal to which the article has been submitted; and agree to be accountable for all aspects of the work.
Disclosure
The authors declare no conflicts of interest in this work.
References
1. Sureka B, Mittal MK, Mittal A, et al. Imaging spectrum of gastrointestinal stromal tumor. Indian J Med Paediatr Oncol. 2014;35(02):143–148. doi:10.4103/0971-5851.138964
2. Boikos SA, Stratakis CA. The genetic landscape of gastrointestinal stromal tumor lacking KIT and PDGFRA mutations. Endocrine. 2014;47(2):401–408. doi:10.1007/s12020-014-0346-3
3. Iruzubieta P, Monzon M, Castiella T, et al. Hedgehog signalling pathway activation in gastrointestinal stromal tumours is mediated by primary cilia. Gastric Cancer. 2020;23(1):64–72. doi:10.1007/s10120-019-00984-2
4. Din NU, Ahmad Z, Arshad H, et al. Gastrointestinal stromal tumors: a clinicopathologic and risk stratification study of 255 cases from Pakistan and review of literature. Asian Pac J Cancer Prev. 2015;16(12):4873–4880. doi:10.7314/APJCP.2015.16.12.4873
5. Huang MY, Yang WY, Zhu JQ, et al. Coordinated targeting of CK2 and KIT in gastrointestinal stromal tumours. Br J Cancer. 2020;122(3):372–381. doi:10.1038/s41416-019-0657-5
6. Saito Y, Takahashi T, Obata Y, et al. TAS-116 inhibits oncogenic KIT signalling on the Golgi in both imatinib-naïve and imatinib-resistant gastrointestinal stromal tumours. Br J Cancer. 2020;122(5):658–667. doi:10.1038/s41416-019-0688-y
7. Li J, Ye YJ, Wang J, et al. Chinese consensus guidelines for diagnosis and management of gastrointestinal stromal tumor. Chin J Cancer Res. 2017;29(4):281–293. doi:10.21147/j.issn.1000-9604.2017.04.01
8. Jo VY, Fletcher CDM. WHO classification of soft tissue tumours: an update based on the 2013 (4th) edition. Pathology. 2014;46(2):95–104. doi:10.1097/PAT.0000000000000050
9. Wada R, Arai H, Kure S, et al. Wild type GIST: clincopathological features and clinical practice. Pathol Int. 2016;66(8):431–437. doi:10.1111/pin.12431
10. Soreide K, Sandvik OM, Soreide JA, et al. Global epidemiology of gastrointestinal stromal tumors (GIST): a systematic review of population-based cohort studies. Cancer Epidemiol. 2016;40:39–46. doi:10.1016/j.canep.2015.10.031
11. Joensuu H, Hohenberger P, Corless CL. Gastrointestinal stromal tumor. Lancet. 2013;382(9896):973–983. doi:10.1016/S0140-6736(13)60106-3
12. Rink L, Skorobogatko Y, Kossenkov AV, et al. Gene expression signatures and response to imatinib mesylate in gastrointestinal stromal tumor. Mol Cancer Ther. 2009;8(8):2172–2182. doi:10.1158/1535-7163.MCT-09-0193
13. Corless CL, Heinrich MC. Molecular pathobiology of gastrointestinal stromal sarcoma. Annu Rev Pathol. 2008;3(1):557–586. doi:10.1146/annurev.pathmechdis.3.121806.151538
14. Gopie P, Mei L, Faber AC, et al. Classification of gastrointestinal stromal tumor syndromes. Endocr Relat Cancer. 2018;25(2):49–58. doi:10.1530/ERC-17-0329
15. Bauer S, Duensing A, Demetri DG, et al. KIT oncogenic signaling mechanisms in imatinib resistant gastrointestinal stromal tumor: PI3-kinase/AKT is a crucial survival pathway. Oncogene. 2007;26(54):7560–7568. doi:10.1038/sj.onc.1210558
16. Kara T, Serinsoz E, Arpaci RB, et al. Contribution of DOG1 expression to the diagnosis of gastrointestinal stromal tumors. Pathol Res Pract. 2013;209(7):413–417. doi:10.1016/j.prp.2013.04.005
17. Fletcher CDM, Berman JJ, Corless C, et al. Diagnosis of gastrointestinal stromal tumors: a consensus approach. Hum Pathol. 2002;33(5):459–465. doi:10.1053/hupa.2002.123545
18. Yu L, Liang XB. Interpretation of guideline for management of gastrointestinal stromal tumor. Chin J Colorec Dis. 2015;4:8–14.
19. Wang M, Ni B, Zhuang C, et al. Aberrant accumulation of Dickkopf 4 promotes tumor progression via forming the immune suppressive microenvironment in gastrointestinal stromal tumor. Cancer Med. 2019;8(11):5352–5366. doi:10.1002/cam4.2437
20. Wang YX, Enriquez AM, Bennett RR, et al. Dystrophin is a tumor suppressor in human cancers with myogenic programs. Nat Genet. 2014;46(6):601–606. doi:10.1038/ng.2974
21. Miettinen M, Lasota J. Gastrointestinal stromal tumors: pathology and prognosis at different sites. Semin Diagn Pathol. 2006;23(2):70–83. doi:10.1053/j.semdp.2006.09.001
22. Costa TDF, Zhuang T, Lorent J, et al. PAK4 suppresses RELB to prevent senescence-like growth arrest in breast cancer. Nat Commun. 2019;10(1):3589. doi:10.1038/s41467-019-11510-4
23. Vaughan S, Jat PS. Deciphering the role of nuclear factor-κB in cellular senescence. Aging. 2011;3(10):913–919. doi:10.18632/aging.100390
24. Bokoch GM. Biology of the p21-activated kinases. Annu Rev Biochem. 2003;72(1):743–781. doi:10.1146/annurev.biochem.72.121801.161742
25. Naїja A, Merhi M, Inchakalody V, et al. The role of PAK4 in the immune system and its potential implication in cancer immunotherapy. Cell Immunol. 2021;367:104408. doi:10.1016/j.cellimm.2021.104408
26. Ohshima K, Fujiya K, Nagashima T, et al. Driver gene alterations and activated signaling pathways toward malignant progression of gastrointestinal stromal tumors. Cancer Sci. 2019;110(12):3821–3833. doi:10.1111/cas.14202
27. Wu JS, Huang XW, Zeng YF, et al. Bioinformatics-based study of potential key genes and signaling pathways for gastrointestinal stromal tumors from low to advanced level. Smart Healthc. 2020;6:22–26.
28. Brazma A, Hingamp P, Quackenbush J, et al. Minimum information about a microarray experiment (MIAME)-toward standards for microarray data. Nat Genet. 2001;29(4):365–371. doi:10.1038/ng1201-365
29. Callow MG, Clairvoyant F, Zhu S, et al. Requirement for PAK4 in the Anchorage-independent growth of human cancer cell lines. J Biol Chem. 2002;277(1):550–558. doi:10.1074/jbc.M105732200
30. Paliouras GN, Naujokas MA, Park M. Pak4, a novel Gab1 binding partner, modulates cell migration and invasion by the Met receptor. Mol Cell Biol. 2009;29(11):3018–3032. doi:10.1128/MCB.01286-08
31. Henderson V, Smith B, Burton LJ, et al. Snail promotes cell migration through PI3K/AKT-dependent Rac1 activation as well as PI3K/AKT-independent pathways during prostate cancer progression. Cell Adh Migr. 2015;9(4):255–264. doi:10.1080/19336918.2015.1013383
32. Chen MM, Zhang HQ, Zhang GH, et al. Targeting TPX2 suppresses proliferation and promotes apoptosis via repression of the PI3K/AKT/P21 signaling pathway and activation of P53 pathway in breast cancer. Biochem Biophys Res Commun. 2018;507(1–4):74–82. doi:10.1016/j.bbrc.2018.10.164
33. Zhao R, Song YH, Wang Y, et al. PD-1/PD-L1 blockade rescue exhausted CD8+ T cells in gastrointestinal stromal tumours via the PI3K/Akt/mTOR signalling pathway. Cell Prolif. 2019;52:e12571.
34. Seo WL, Park S, Gwak J, et al. Wnt signaling promotes androgen independent prostate cancer cell proliferation through upregulation of the hippo pathway effector YAP. Biochem Biophys Res Commun. 2017;486(4):1034–1039. doi:10.1016/j.bbrc.2017.03.158
35. Zeng S, Seifert AM, Zhang JQ, et al. Wnt/β-catenin signaling contributes to tumor malignancy and is targetable in gastrointestinal stromal tumor. Mol Cancer Ther. 2017;16(9):1954–1966. doi:10.1158/1535-7163.MCT-17-0139
36. Zeng S, Seifert AM, Zhang JQ, et al. ETV4 collaborates with Wnt/β-catenin signaling to alter cell cycle activity and promote tumor aggressiveness in gastrointestinal stromal tumor. Oncotarget. 2017;8(69):114195–114209. doi:10.18632/oncotarget.23173
37. Fujiya K, Ohshima K, Kitagawa Y, et al. Aberrant expression of Wnt/β-catenin signaling pathway genes in aggressive malignant gastric gastrointestinal stromal tumors. Eur J Surg Oncol. 2020;46(6):1080–1087. doi:10.1016/j.ejso.2020.02.036
38. Rutkowski P, Bylina E, Wozniak A, et al. Validation of the Joensuu risk criteria for primary resectable gastrointestinal stromal tumor-The impact of tumour rupture on patient outcomes. Eur J Surg Oncol. 2011;37(10):890–896. doi:10.1016/j.ejso.2011.06.005
39. Guo QJ, Lu TZ, Chen Y, et al. Genetic variations in the PI3K–PTEN–AKT–mTOR pathway are associated with distant metastasis in nasopharyngeal carcinoma patients treated with intensity–modulated radiation therapy. Sci Rep. 2016;23(1):37576. doi:10.1038/srep37576
40. Janku F, Yap TA, Meric–Bernstam F. Targeting the PI3K pathway in cancer: are we making headway. Nat Rev Clin Oncol. 2018;15(5):273–291. doi:10.1038/nrclinonc.2018.28
41. Anderson W, Sullivan B, Hughes F, et al. Microscopic gastrointestinal stromal tumors: a clinical and molecular study of 13 cases. Histopathology. 2017;70(2):211–216. doi:10.1111/his.13049
42. Saponara M, Urbini M, Astolfi A, et al. Molecular characterization of metastatic exon 11 mutant gastrointestinal stromal tumors (GIST) beyond KIT/PDGFRα genotype evaluated by next generation sequencing (NGS). Oncotarget. 2015;6(39):42243–42257. doi:10.18632/oncotarget.6278
43. Schaefer I, Wang YX, Liang CW, et al. MAX inactivation is an early event in GIST development that regulates p16 and cell proliferation. Nat Commun. 2017;8:14674.
44. Zhang Q, Sivakumar S, Chen YJ, et al. Ska3 phosphorylated by Cdk1 binds Ndc80 and recruits Ska to kinetochores to promote mitotic progression. Curr Biol. 2017;27(10):1477–1484. doi:10.1016/j.cub.2017.03.060
45. Hu YQ, Zhang HQ. Advances in the biological properties of PAK4. Teratog carcinog mutagen. 2010;22:0075–0077.
46. Zhang P, Zhu J, Lv XL, et al. Expression and clinical significance of PAK4 and P54 proteins in breast cancer. Shaanxi Med J. 2017;46:1604–1606.
47. Clevers H. Wnt/beta-catenin signaling in development and disease. Cell. 2006;127(3):469–480. doi:10.1016/j.cell.2006.10.018
48. Li Y, Shao YG, Tong YX, et al. Nucleo-cytoplasmic shuttling of PAK4 modulates β-catenin intracellular translocation and signaling. Biochim Biophys Acta. 2012;1823(2):465–475. doi:10.1016/j.bbamcr.2011.11.013
49. Naija A, Merhi M, Inchakalody V, et al. The role of PAK4 in the immune system and its potential implication in cancer immunotherapy. Cell Immunol. 2021;367:104408.
50. Kim D, Pertea G, Trapnell C, et al. TopHat2: accurate alignment of transcriptomes in the presence of insertions, deletions and gene fusions. Genome Biol. 2013;14(4):R36. doi:10.1186/gb-2013-14-4-r36
51. Fu XQ, Feng JR, Zeng D, et al. PAK4 confers cisplatin resistance in gastric cancer cells via PI3K/Akt-and MEK/ERK-dependent pathways. Biosci Rep. 2014;34(2):e00094. doi:10.1042/BSR20130102
52. He LF, Xu HW, Chen M, et al. Activated-PAK4 predicts worse prognosis in breast cancer and promotes tumorigenesis through activation of PI3K/AKT signaling. Oncotarget. 2017;8(11):17573–17585. doi:10.18632/oncotarget.7466
53. Zhang XM, Zhang X, Li Y, et al. PAK4 regulates G6PD activity by p53 degradation involving colon cancer cell growth. Cell Death Dis. 2017;8(5):e2820. doi:10.1038/cddis.2017.85
 © 2022 The Author(s). This work is published and licensed by Dove Medical Press Limited. The full terms of this license are available at https://www.dovepress.com/terms.php and incorporate the Creative Commons Attribution - Non Commercial (unported, v3.0) License.
By accessing the work you hereby accept the Terms. Non-commercial uses of the work are permitted without any further permission from Dove Medical Press Limited, provided the work is properly attributed. For permission for commercial use of this work, please see paragraphs 4.2 and 5 of our Terms.
© 2022 The Author(s). This work is published and licensed by Dove Medical Press Limited. The full terms of this license are available at https://www.dovepress.com/terms.php and incorporate the Creative Commons Attribution - Non Commercial (unported, v3.0) License.
By accessing the work you hereby accept the Terms. Non-commercial uses of the work are permitted without any further permission from Dove Medical Press Limited, provided the work is properly attributed. For permission for commercial use of this work, please see paragraphs 4.2 and 5 of our Terms.