Back to Journals » Diabetes, Metabolic Syndrome and Obesity » Volume 17
Risk Prediction of Diabetes Progression Using Big Data Mining with Multifarious Physical Examination Indicators
Authors Chen X, Zhou S, Yang L, Zhong Q, Liu H, Zhang Y, Yu H ![]() , Cai Y
, Cai Y
Received 6 December 2023
Accepted for publication 25 February 2024
Published 11 March 2024 Volume 2024:17 Pages 1249—1265
DOI https://doi.org/10.2147/DMSO.S449955
Checked for plagiarism Yes
Review by Single anonymous peer review
Peer reviewer comments 2
Editor who approved publication: Prof. Dr. Juei-Tang Cheng
Xiaohong Chen,1,* Shiqi Zhou,2,* Lin Yang,1 Qianqian Zhong,1 Hongguang Liu,3 Yongjian Zhang,1 Hanyi Yu,2 Yongjiang Cai1
1Center of Health Management, Peking University Shenzhen Hospital, Shenzhen, People’s Republic of China; 2School of Future Technology, South China University of Technology, Guangzhou, People’s Republic of China; 3Center of Health Management, Huazhong University of Science and Technology Union Hospital (Nanshan Hospital), Shenzhen, People’s Republic of China
*These authors contributed equally to this work
Correspondence: Yongjiang Cai, Center of Health Management, Peking University Shenzhen Hospital, Shenzhen, 518036, People’s Republic of China, Email [email protected] Hanyi Yu, School of Future Technology, South China University of Technology, Guangzhou, People’s Republic of China, Email [email protected]
Purpose: The purpose of this study is to explore the independent-influencing factors from normal people to prediabetes and from prediabetes to diabetes and use different prediction models to build diabetes prediction models.
Methods: The original data in this retrospective study are collected from the participants who took physical examinations in the Health Management Center of Peking University Shenzhen Hospital. Regression analysis is individually applied between the populations of normal and prediabetes, as well as the populations of prediabetes and diabetes, for feature selection. Afterward,the independent influencing factors mentioned above are used as predictive factors to construct a prediction model.
Results: Selecting physical examination indicators for training different ML models through univariate and multivariate logistic regression, the study finds Age, PRO, TP, and ALT are four independent risk factors for normal people to develop prediabetes, and GLB and HDL.C are two independent protective factors, while logistic regression performs best on the testing set (Acc: 0.76, F-measure: 0.74, AUC: 0.78). We also find Age, Gender, BMI, SBP, U.GLU, PRO, ALT, and TG are independent risk factors for prediabetes people to diabetes, and AST is an independent protective factor, while logistic regression performs best on the testing set (Acc: 0.86, F-measure: 0.84, AUC: 0.74).
Conclusion: The discussion of the clinical relationships between these indicators and diabetes supports the interpretability of our feature selection. Among four prediction models, the logistic regression model achieved the best performance on the testing set.
Keywords: prediabetes, prediction model, physical examination, machine learning, regression analysis
Introduction
Diabetes is a metabolic disease characterized by hyperglycemia, which is caused by insufficient insulin secretion or reduced insulin sensitivity. Its main characteristics are that the blood sugar level is higher than the normal range for a long time. Long-term abnormal blood sugar level increases the risk of microvascular and macrovascular complications, thus damaging multiple organs and tissues, even leading to death. Since there is no effective cure for diabetes at present, patients need lifelong treatment, which brings a heavy economic burden to patients and their families.1
Prediabetes, also known as impaired glucose regulation (IGR), is a pathological state in which the level of human blood sugar is higher than normal but has not yet reached the diagnostic criteria for diabetes.2 According to the definition of the World Health Organization (WTO), prediabetes can be divided into two types: impaired fasting glucose (IFG) and impaired glucose tolerance (IGT). Research shows that prediabetes have a significant positive correlation between the risk and mortality of obstructive sleep apnea, coronary heart disease, stroke, and complex cardiovascular disease.3,4 Besides, prediabetes is a high-risk state of diabetes. About 5%−10% of prediabetes patients develop into diabetes patients every year. At the same time, some studies have shown that after certain medical intervention treatments for prediabetes patients, a certain percentage of patients can recover their blood sugar level to normal level under medical intervention.5 This finding is of great significance in reducing the incidence rate of diabetes, improving the national health level, and reducing the burden on the medical and health system. However, the clinical symptoms of prediabetes are not obvious, and patients often miss the best opportunity for intervention.
According to the WHO 1999 standard,1 the gold standard for diabetes is a fasting blood sugar level of ≥7.0 mmol/L or a blood sugar level two hours after oral glucose tolerance test (2hOGTT) of ≥11.1 mmol/L. As for two different metabolic states of prediabetes, IFG is defined as a fasting blood sugar level between 6.1 mmol/L and 7.0 mmol/L and 2hOGTT blood sugar level of <7.8 mmol/L, while IGT is defined as a fasting blood sugar level of <7.0 mmol/L and 2hOGTT blood sugar level between 7.8 mmol/L and 11.1 mmol/L. The American Diabetes Association applies the same threshold for IGT, but decreases the lower bound of fasting blood sugar level to 5.6 mmol/L for IFG. Besides, glycated hemoglobin A1c (HbA1c) between 5.6% and 6.5% is introduced as a new indicator of prediabetes.6
In addition to blood sugar level and HbA1c, studies have shown that some other physiological indicators can also be used as a basis for judging diabetes. Serum Ferritin is an acute-phase reactant and a marker of iron reserve in the body. Through research, it was found that Serum Ferritin was positively correlated with HbA1c,7 and Serum Ferritin of diabetes patients was significantly higher than that of normal people, so Serum Ferritin can serve as a physiological indicator for detecting diabetes. It was found that systemic inflammatory indicators in type 2 diabetes patients were closely related to blood glucose control through research.8 Compared with the normal population, the systemic inflammatory indicators of type 2 diabetes patients include high-sensitivity C-reactive protein, complete blood count, and erythrocyte sedimentation rate. The average values of all parameters except ESR increased significantly. By detecting and analyzing the telomere length of islet β cells in patients with type 2 diabetes and normal people, it was concluded that HbA1c was negatively correlated with the telomere length of β cells.9 On the other word, the telomere length of islet β cells in people with type 2 diabetes was shortened. It was found that platelet volume indexes such as average platelet volume and platelet distribution width could be used as biomarkers to predict vascular complications of diabetes. Their significance for diabetic foot, diabetes neuropathy, and other complications of diabetes was higher than that of fasting blood sugar and HbA1c.10
Recently, the enormous success of machine learning algorithms has inspired plenty of relevant research in diabetes prediction. Yang et al developed an XGBoost-based model with an AUC of 0.8768 by collecting physical examination data from the normal population and diabetes population.11 A comparative study of Naive Bayes, ID3, random forest, and AdaBoost reported that random forest outperformed the other algorithms at classifying diabetic patients, with 85% accuracy.12 Aishwarya et al13 presented a work to predict Diabetes Mellitus by making use of various ML algorithms. Among various classification algorithms, LR presented the highest accuracy, 96%. The best model as per this work was based on the AdaBoost classifier which predicted diabetes with the highest accuracy of 98.8%. Mingqi Li et al14 proposed an improved XGBoost algorithm to predict diabetics by generating new variables by cross combining different features of the data set. The new features were derived to simulate a clinical practitioners’ inquisitiveness in analyzing diabetes data. The proposed data feature stitching with XGBoost achieved an accuracy of 80.2%. There are also some studies focusing on people who have developed from normal people to prediabetes. The performance of an artificial neural network (ANN) and support vector machine (SVM) in the prediction of prediabetes was compared by Choi et al15 Kopitar et al collected 4685 valid data samples, providing nine indicators such as age, gender, BMI index, hypertension, smoking history, diabetes family history, exercise, waist circumference and alcohol intake for model training. The research results indicated that SVM achieved better performance on this dataset (AUC=0.731), but there was no significant difference compared to ANN (AUC=0.729). The performance of the following five prediction models in IFG diagnosis, namely linear regression, LASSO regression, random forest, XGBoost, and LightGBM, was compared.16 Wang et al collected a dataset containing 3723 valid data and 58 independent variables over a period of 30 months. The research results indicated that LightGBM achieved the best performance on this dataset. In addition, researchers also found that as the number of training samples increased, the accuracy of the model was significantly improved. A deep learning model was developed to diagnose prediabetes in a non-invasive, real-time manner using a 12-lead electrocardiogram.17 The above examples show that the four basic ML methods, LR, SVM, RF, and XGBoost, can achieve good performance in the downstream task of diabetes classification.
However, all the above studies were only focused on the transitions either from normal population to diabetes or from normal population to prediabetes. Few studies on machine-learning-based disease prediction investigated the transition among the three stages. In this work, we conduct a cross-sectional study to identify independent influencing factors of the transition from normal population to prediabetes and the transition from prediabetes to diabetes, respectively. Then, machine learning models are trained correspondingly for disease risk prediction. The flowchart of the whole process for diabetes analysis is presented in Figure 1. We first collect a large amount of physical examination data and generate a diabetes dataset after a series of preprocessing manners. Then we adopt regression analysis to select independent influencing factors and utilize four machine learning approaches to build the risk prediction models.
 |
Figure 1 Flowchart of diabetes analysis process. Collected raw data is preprocessed to build a dataset. Then feature selection, model training, and model evaluation are successively applied to select the best machine learning model. |
The purpose of this study is to deepen the understanding of diabetes progress and enhance the diagnosis with prediction models. With early warning of individuals at risk of prediabetes and diabetes among the populations participating in physical examinations, timely interventions may improve their quality of life. Furthermore, this study can serve as a valuable reference for public research works in early screening for other chronic non-communicable diseases.
Materials and Methods
Dataset and Preprocessing
The studies involving humans were approved by the Ethics Committee of Peking University Shenzhen Hospital. The original data in this retrospective study were collected from the participants who took physical examinations in the Health Management Center of Peking University Shenzhen Hospital from January 2020 to March 2023. There are a total of 7811 individuals participating in the physical examination, and the original dataset contains 41 physical examination indicators. The subjects were divided into three groups according to their blood sugar and HbA1c level following the WHO 1999 standard. The normal population had a fasting blood sugar level of <5.6 mmol/L and a HbA1c level of <5.7%, the diabetes population had a fasting blood sugar level of ≥7.0 mmol/L or a HbA1c level of ≥6.5%, and the remaining subjects were prediabetes population. After preprocessing, the data from the original dataset, there are still 5127 medical examination data remaining, each of which includes 25 medical examinations.
The original data collected from the electronic healthcare record (EHR) system was desensitized by removing patient privacy, such as name, address, and telephone number. The desensitized data contained 41 physical examination indicators and 7811 records. To ensure the data quality and maintain the data quantity, we first deleted 16 physical examination indicators where the proportion of missing values was higher than 50%, and then deleted the records that still contained missing values. Table 1 describes the remaining physical examination indicators with their meanings. In addition, due to the inconvenience in processing text information during logistic regression prediction, we converted categorical variables into numerical variables in advance for our subsequent analysis and prediction. Specifically, we considered “female” as “0” and “male” as “1” for gender, and considered “-”, “+-” as “0” and “1+”, “2+”, “3+”, “4+” as “1” for U.GLU and PRO. Finally, in order to eliminate the bias caused by the scale differences of different features, we normalized all features by subtracting their mean values from each variable and dividing them by their standard deviation, ensuring that the numerical range of each feature variable is between (−1, 1). The record numbers of normal, prediabetes, and diabetes populations after preprocessing are 1582, 2929, and 616, respectively.
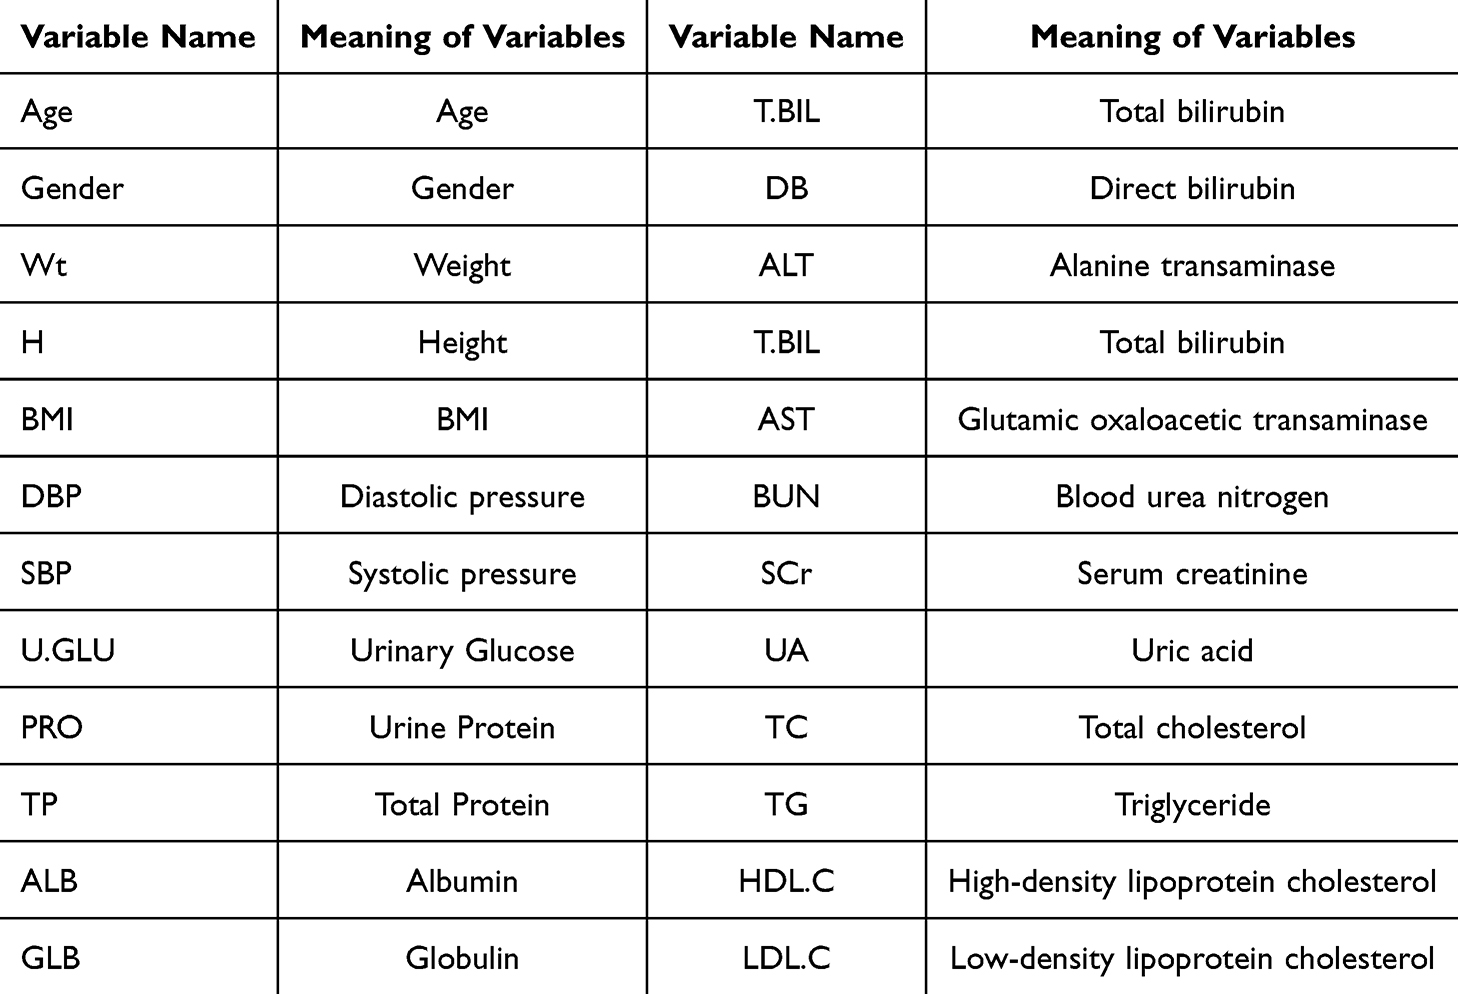 |
Table 1 Descriptions of Physical Examination Indicators in This Study |
Feature Selection
In machine-learning-based models, a large number of variables are typically gathered as they can provide the model with enough knowledge to produce good discriminatory outcomes. However, in clinical applications, irrelevant features can also induce noise or redundancy, which may lead to poor prediction accuracy. Therefore, it is necessary to select the most suitable variables for the best prediction performance before model training.
In statistical modeling, regression analysis is a set of statistical processes for estimating the relationships between a dependent variable and independent variables. The difference between univariate and multivariate analysis is that the former has only one physical examination indicator in its independent variable, and the latter has multiple physical examination indicators in its independent variable. As the dependent variable in this study is the diabetes stage, a categorical variable, we chose the logistic regression model for the regression analysis. Firstly, univariate logistic regression analysis was used to analyze the classification results and physical examination indicators. Each pre-processed physical examination indicator will be used as the independent variable of univariate logistic regression, and the classification result will be used as the dependent variable. Then, it will be fitted into a logistic regression model, and the relationship between the dependent variable and the independent variable will be analyzed and predicted. The physical examination indicators with p-value <0.05 in the results of univariate logistic regression analysis were selected. We believe that these indicators are the influencing factors related to the development of diabetes. In order to further increase persuasiveness, we will also use the indicators selected from univariate regression analysis as independent variables for multivariate logistic regression analysis, with the dependent variable still being the classification result. Then, the independent variable and dependent variable are fitted into a logistic regression model, and the relationship between the dependent variable and the independent variable is analyzed and predicted. Finally, the variables with p-value <0.05 are retained for machine learning model training.
Model Training
The dataset is split into training and testing sets with a proportion of 7:3. And the hyperparameter selection of the model is the same on both the training and testing sets. Then the training set is utilized to train four machine learning models: logistic regression,18 random forest,19 SVM,20 and XGBoost.21 The best parameters for the models are decided by 5-fold cross validation. The four models are briefly introduced below.
- Logistic Regression. A logistic regression model is often used to predict the probability of an event as a function of a predictor variable. Given a set of variables x, the probability is calculated by a sigmoid function p(x) = 1/(1 + ex·β). First, we use the function “LogisticRegression” in the scikit-learn library for the model training, then we set the solver to “lbfgs” respectively to optimize the multi classification problem. Finally, we use the 5-fold cross-validation method to select the best parameters on “C”, and “max_iter”.
- SVM. SVM is a method for solving classification and regression issues. The model determines the hyperplane that optimizes the distance between the two nearest classes as well as the distance between samples. First, we use the function “SVR” in the scikit-learn library for the model training. Then, we use the 5-fold cross-validation method to select the best parameters on “kernel”, “C”, “degree”, and “coef0”.
- Random Forest. Random forest is an ensemble method based on the bagging technique, where decision trees are constructed independently. The final result is then derived from the majority voting results of all trees. First, we use the function “RandomForestClassifier” in the scikit-learn library for the model training, then we use the 5-fold cross-validation method to select the best parameters on “n_estimators”, “max_depth”, “min_samples_split”, and “min_samples_leaf”.
- XGBoost. In contrast, XGBoost is an ensemble method based on gradient boosting machine. Gradient boosting is a technique where new models are added to correct the error of existing models. First, we use the function “XGBClassifier” in the xgboost library for the model training, then we select the classification task in “objective=binary:logistic”, and use the 5-fold cross-validation method to select the best parameters on “max_depth”, “learning_rate”, “n_estimators”, and “min_child_weight”.
Model Evaluation
We evaluate the model performance by metrics derived from the confusion matrix, which is a special visual matrix with two dimensions and can be used to compare prediction results and actual values. The confusion matrix contains four values: true positive (TP), false positive (FP), false negative (FN), and true negative (TN). TP is the number of samples that are actually positive and correctly predicted to be positive. FP is the number of samples that are actually negative and incorrectly predicted as positive. FN is the number of samples that are actually positive but are incorrectly predicted to be negative. TN is the number of samples that are actually negative and correctly predicted to be negative. Then, accuracy, precision, recall, F-measure and specificity can be defined as (TP + TN)/(TP + FP + FN + TN), TP/(TP + FP), TP/(TP + FN), 2*(precision * recall)/(precision + recall), and TN/(TN + FP), respectively.
Besides, we also the use area under curve (AUC) of receiver operating characteristic (ROC) to evaluate model performance. The ROC curve is the plot of the true positive rate against the false-positive rate at various threshold settings. AUC is the area enclosed by the curve and the x-axis. A larger AUC value suggests a better classification performance.
Results
In this study, all data processing steps, including preprocessing statistical analysis, model training, and model evaluation, are performed with Python 3.8 and machine learning libraries such as statmodels, scikit-learn, and xgboost.
Regression Analysis
We separately analyze the transition from normal to prediabetes and the transition from prediabetes to diabetes. For the transition from normal to prediabetes, the variables are first individually selected by univariate logistic regression analysis. Age, Gender, Wt, H, BMI, DBP, SBP, PRO, TP, GLB, T.BIL, DB, IB, ALT, AST, BUN, UA, TC, TG, HDL.C, and LDL.C present significant correlations with p-value <0.05. Then, these variables are further included in multivariate logistic regression analysis. The result suggests that Age, PRO, TP and ALT are independent risk factors with OR > 1, and GLB and HDL.C are independent protective factors with OR < 1. More details are presented in Table 2.
 |
Table 2 Univariate Regression Analysis and Multivariate Regression Analysis Between Normal and Prediabetes Populations |
Similarly, the variables are first individually selected by univariate logistic regression analysis for the transition from prediabetes to diabetes. Age, Gender, Wt, BMI, DBP, SBP, U.GLU, PRO, T.BIL, DB, IB, ALT, AST, BUN, TC, TG, HDL.C, and LDL.C present significant correlations with p-value <0.05. Then, these variables are further included in multivariate logistic regression analysis. The result suggests that Age, Gender, BMI, SBP, U.GLU, PRO, ALT, and TG are independent risk factors with OR > 1, and AST are independent protective factors with OR < 1. More details are presented in Table 3.
 |
Table 3 Univariate Regression Analysis and Multivariate Regression Analysis Between Prediabetes and Diabetes Populations |
Prediction Model
First, we present the model comparison to classify normal and prediabetes populations. According to the regression analysis results in Table 2, the independent influencing factors for the normal to prediabetes include Age, PRO, TP, GLB, ALT, and HDL.C, a total of six physical examination indicators, and logistic regression, random forest, support vector machine, XGBoost are used to build prediction models. We plotted the confusion matrix for each model in Figure 2. The results of the model on the training and testing sets are shown in Table 4, which includes the accuracy, precision, recall, F-measure, and specificity of the model, with the best performing results represented in bold. Besides, we provide the ROC curves of four prediction models in Figure 3. Specifically, Figure 3A and B represent the ROC curve of the logistic regression model on the training and testing set. Similarly, we have Figure 3C and D for the random forest model, Figure 3E and F for the SVM model, and Figure 3G and H for the XGBoost model, respectively. XGBoost performed the best among all models on the training set, while the best performing model on the testing set was the logistic regression.
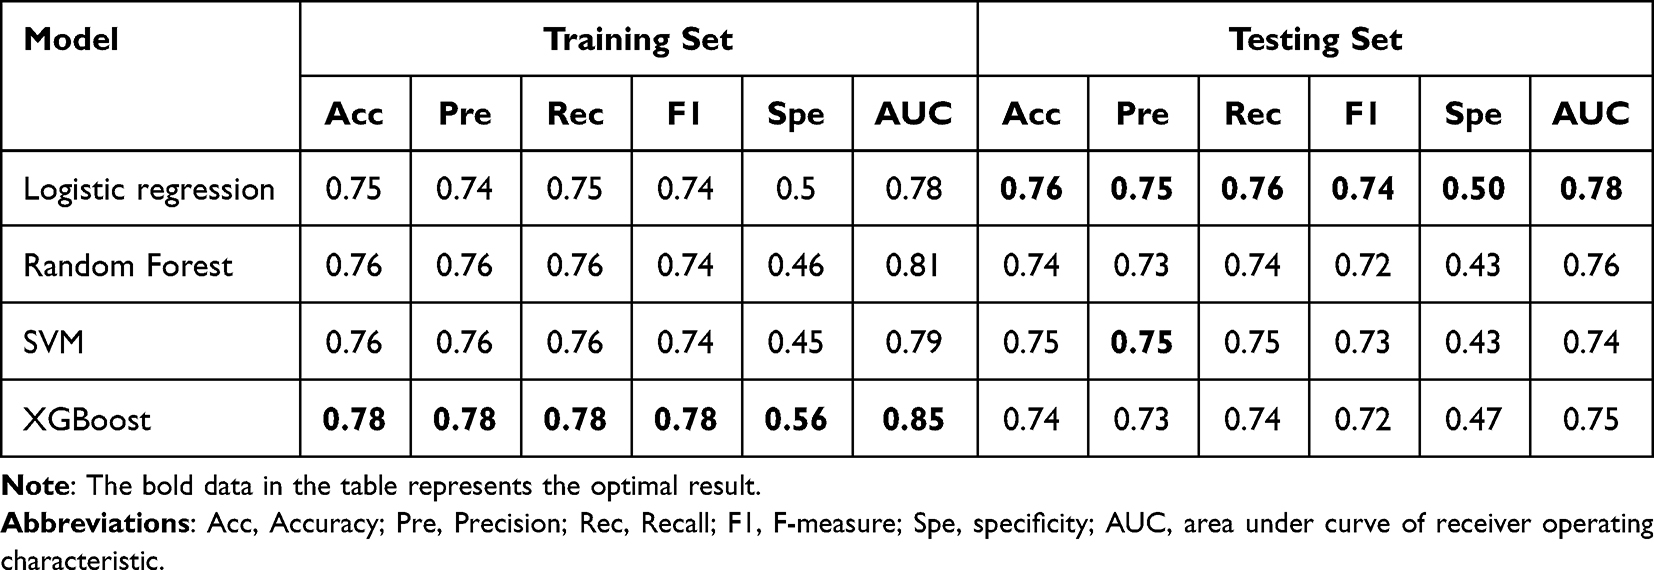 |
Table 4 The Results of the Model on the Training and Testing Sets Between Normal and Prediabetes Populations |
 |
Figure 2 Confusion matrix of results for each model between normal and prediabetes populations. (A and B) represent the results of Confusion matrix for the logistic regression model on the training and testing set. Similarly, we have (C and D) for the random forest model, (E and F) for the SVM model, and (G and H) for the XGBoost model, respectively. |
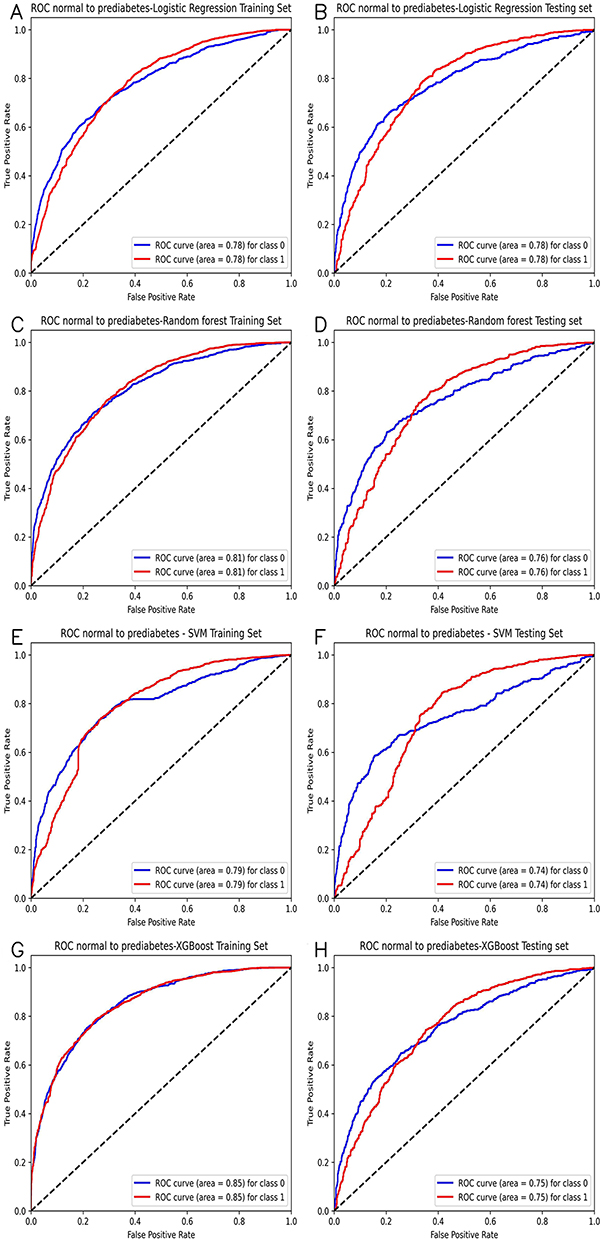 |
Figure 3 Receiver operating characteristic (ROC) curves of classification models between normal and prediabetes population. (A and B) represent the ROC curve of the logistic regression model on the training and testing set. Similarly, we have (C and D) for the random forest model, (E and F) for the SVM model, and (G and H) for the XGBoost model, respectively. |
Then we present the model comparison to classify prediabetes and diabetes populations. According to the regression analysis results in Table 3, the independent influencing factors for the normal to prediabetes include Age, Gender, BMI, SBP, U.GLU, PRO, ALT, AST, and TG, a total of nine physical examination indicators, and logistic regression, random forest, support vector machine, XGBoost are used to build prediction models. We plotted the confusion matrix for each model in Figure 4. The results of the model on the training and testing sets are shown in Table 5, which includes the accuracy, precision, recall, F-measure, and specificity of the model, with the best performing results represented in bold. Besides, we provide the ROC curves of four prediction models in Figure 5. Specifically, Figure 5A and B represent the ROC curve of the logistic regression model on the training and testing set. Similarly, we have Figure 5C and D for the random forest model, Figure 5E and F for the SVM model, and Figure 5G and H for the XGBoost model, respectively. In a comprehensive evaluation, although XGBoost performed best on the training set, logistic regression performed best on the testing set.
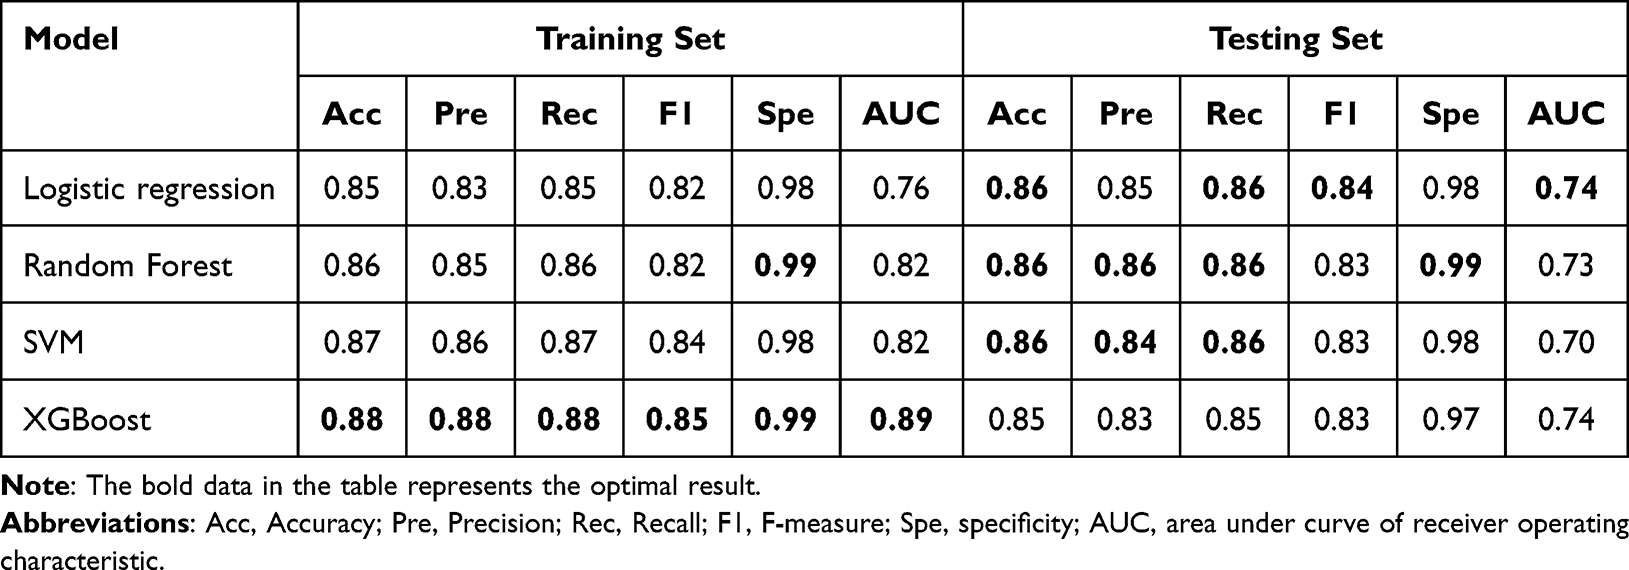 |
Table 5 The Results of the Model on the Training and Testing Sets Between Prediabetes and Diabetes Populations |
 |
Figure 4 Confusion matrix of results for each model between prediabetes and diabetes populations. (A and B) represent the results of Confusion matrix for the logistic regression model on the training and testing set. Similarly, we have (C and D) for the random forest model, (E and F) for the SVM model, and (G and H) for the XGBoost model, respectively. |
 |
Figure 5 Receiver operating characteristic (ROC) curves of classification models between prediabetes and diabetes population. (A and B) represent the ROC curve of the logistic regression model on the training and testing set. Similarly, we have (C and D) for the random forest model, (E and F) for the SVM model, and (G and H) for the XGBoost model, respectively. |
Overall, all the models in this study were built with commonly used indicators in physical examination and achieved AUC values higher than 0.7, indicating that the results of this experiment are convincing.
Discussion
This work investigated the physical examination data of normal people, prediabetes people, and diabetes people, aiming to analyze the independent influencing factors from normal to prediabetes and from prediabetes to diabetes. We found that Age, PRO, TP, GLB, ALT, and HDL.C are the independent influencing factors for the normal population to the prediabetes stage through multivariate regression analysis. Among them, Age, PRO, TP, and ALT were independent risk factors, and GLB and HDL.C were independent protective factors. Meanwhile, there were nine independent physical examination indicators from prediabetes to diabetes, including Age, Gender, BMI, SBP, U.GLU, PRO, ALT, AST, and TG. Among them, Gender, BMI, SBP, U.GLU, PRO, ALT, and TG were independent risk factors, and AST is an independent protective factor.
In many studies, it had been found that Age, BMI, SBP, U.GLU, PRO, and other factors were independent influencing factors for normal people to develop prediabetes or even diabetes. According to the National Health and Nutrition Examination Survey (NHANES) of the United States, the prevalence of diabetes was proportional to the growth of age. The number of people with diabetes under the age of 45 accounted for 5% of the total, but the proportion of people over the age of 65 was as high as 33%.22 At the same time, NHANES research also showed that more than 75% of diabetes patients have a BMI ≥ 25.0 kg/m2, which indicated that obese people had a greater probability of suffering from diabetes.23 A study on the hypertension population without diabetes in China found that the risk of diabetes in people with SBP in the range of 130–140 mmHg was 24% higher than that in the population with SBP in the range of 120–130 mmHg. The incidence rate of diabetes in the former group increased by 24%, and the incidence of Fasting blood sugar returned to normal decreased by 29%.24 In addition, relevant research showed that every 10 mmHg reduction in average systolic blood pressure would reduce the risk of diabetic complications by 12% and the risk of related deaths by 15%.25
This study found that the positive U.GLU in urine examination was an independent risk factor for the development of diabetes from prediabetes to diabetes, while the positive PRO was not only an independent risk factor for the development of normal people to prediabetes but also an independent risk factor for the development of diabetes from prediabetes to diabetes. It was found through research that the sensitivity of using U.GLU to detect prediabetes and diabetes could reach 83.5%. At the same time, it showed that the combination of U.GLU and FPG to detect diabetes could greatly improve the effectiveness of screening. All of the above could indicate the high correlation between the positive U.GLU and the occurrence of diabetes.26 It had also been pointed out that in any category of glomerular filtration rate (eGFR) in the general population, PRO positive in urine test results was directly proportional to the prevalence of hypertension, diabetes, and metabolic syndrome.27 Therefore, the urine test results can not only be used as an important indicator to reflect the level of renal function damage in patients but also as one of the indicators for screening prediabetes and diabetes.
This study also found that TP was an independent risk factor for normal people to develop prediabetes, and GLB and HDL.C were independent protective factors for normal people to develop prediabetes. Protein is the main carrier of life activities. Many previous studies had shown that C-reactive protein, lipopolysaccharide binding protein, vitamin D binding protein, and other proteins in serum were related to the occurrence of diabetes.28–30 These results can provide some evidence for TP to be an independent risk factor for the development of diabetes to diabetes. After reviewing relevant papers, no evidence was found to indicate the correlation between GLB level and prediabetes. However, studies had found that the level of fetuin-A in diabetes patients during pregnancy was significantly higher than that in normal pregnant women, which indicated that diabetes during pregnancy played a role in the occurrence of insulin resistance and metabolic changes.31 Therefore, the specific relationship between GLB and the occurrence of prediabetes needs further study. In a large cross-sectional study based on the population in Jiangsu Province, non-HDL.C could be used as a biomarker for screening undiagnosed diabetes patients.32 In addition, HDL.C could regulate the endocrine function of the β cells in pancreas. It played an anti-diabetes role in cells, and keeping proper HDL.C level in human body can reduce the risk of diabetes.33 All the above results indicated that HDL.C is an independent protective factor for normal people to develop prediabetes.
In addition, among the independent influencing factors for the development of the prediabetes population to diabetes, this study found that gender and TG were independent risk factors. A study showed that women are more likely to suffer from diabetes than men.34 Through consulting relevant data,35 TG was an important risk factor for diabetes, which was consistent with the results of this study. Research showed that the ratio of TG/HDL was positively related to the development of diabetes and diabetes, and this indicator was also an important risk assessment factor for some complications of diabetes patients, such as cardiovascular disease.
Furthermore, this study also found that ALT was not only an independent risk factor for normal people to develop prediabetes but also an independent risk factor for prediabetes people to develop diabetes. Meanwhile, AST is an independent protective factor for prediabetes people to develop into diabetes. Previous studies had found that the elevation of ALT level was related to type 2 diabetes, suggesting that it may be involved in the development of diabetes and insulin resistance.36 Other studies had found that AST/ALT levels were negatively correlated with the occurrence of type 2 diabetes.37 In the univariate regression analysis of AST, the results showed that AST was an independent risk factor for the development of prediabetes to diabetes. However, after the multivariate regression analysis of AST, the results showed that AST was an independent protective factor for the development of prediabetes to diabetes, which was contrary to the medical logic. After analysis, it was possible that there was a mutual correlation or collinearity between the two variables AST and ALT in multivariate regression analysis, and collinearity can change the direction of the variable relationship in the multivariate model. By calculating the Spearman correlation coefficient between ALT and AST, it was found that the absolute value of the coefficient was 0.78, indicating a strong correlation between these two variables. However, further research is needed to prove this conclusion. The results of this study not only provided a new perspective for understanding the occurrence and development of prediabetes but also contributed to a more comprehensive and in-depth understanding of the pathogenesis of prediabetes to diabetes and also had a certain guiding role in the diagnosis and treatment of diabetes.
The above examples show that the four basic ML methods, LR,13 SVM,15 RF,12 and XGBoost14 can achieve good performance in the downstream task of diabetes classification. This study further utilized logistic regression, random forest, support vector machine, and XGBoost to build prediction models for the independent influencing factors found above and calculates the accuracy (Acc), precision (Pre), recall (Rec), F-measure, specificity and AUC of each model. Specifically, among all models to classify between the population of normal and prediabetes, XGBoost performed the best among all models on the training set with 0.78 (Acc), 0.78 (Pre), 0.78 (Rec), 0.78(F-measure), 0.56(specificity) and 0.85 (AUC). However, the best performing model on the testing set was the logistic regression with 0.76 (Acc), 0.75 (Pre), 0.76 (Rec), 0.74 (F-measure), 0.5 (specificity) and 0.78 (AUC). Meanwhile, for the classification between the population of prediabetes and diabetes, XGBoost still performed best among all models on the training set with 0.88 (Acc), 0.88 (Pre), 0.88 (Rec), 0.85 (F-measure), 0.99 (specificity) and 0.89 (AUC). On the testing set, the logistic regression outperformed other models by AUC, while random forest and SVM achieved the highest score by Pre. As for Acc and Pre, all models presented the same performance with a value of 0.86. In a comprehensive evaluation, although XGBoost performed best on the training set, logistic regression performed best on the testing set. Such an observation implied that the simpler model might have the best resistance to overfitting for diabetes prediction tasks with physical examination indicators. Overall, all the models in this study were built with commonly used indicators in physical examination and achieved AUC values higher than 0.7, suggesting a moderate ability for the diagnosis of prediabetes and diabetes in clinical practice. After investigation, we found that Gong et al used the same original dataset as our experiment.38 In their study, a total of 5310 subjects and 22 variables were included after preprocessing. After conducting logistic regression analysis on the variables, a “Full”. model and a “Simplified”. model were established. But in our experiment, 24 physical examination indicators were selected by a series of data preprocessing operations such as feature normalization, and 5127 subjects were included, including 1582 normal people, 2929 prediabetes people and 616 diabetes people after pretreatment. In addition, except for the logistic regression model, we also trained and predicted using three other models: random forest, SVM, and XGBoost. In the prediction model from prediabetes population to diabetes population, the AUC value of logical regression in our test set also has 0.74, and the accuracy, precision, recall, and F-measure are 0.86, 0.85, 0.86, and 0.84, respectively. Our results are compared with those in Gong’s article, except for 0.86 (Acc) which is the same, all other results are our better with 0.59 (Pre), 0.20 (Rec), and 0.73 (AUC) in Gong’s article.
There were also some limitations in this study. The data used in this study were all from the examinees who had undergone physical examinations in the Health Management Center of Peking University Shenzhen Hospital. The sample size might not be sufficient, and whether the examinees themselves had some metabolic disorder, such as kidney function damage and liver function damage, was not considered. Therefore, there might be some deviation in the results. To overcome these limitations, we will consider expanding the sample size in future research, adding other physical examination indicators of the subjects, such as vascular indicators and fundus color photography, and adopting a multicenter study design to enhance the reliability of the research conclusions. With these improvements, we will build a model with better discrimination and performance for prediction and apply it to the clinical diagnosis of prediabetes and diabetes.
Conclusion
Through univariate and multivariate logistic regression, this study analyzed the independent influencing factors from normal to prediabetes and from prediabetes to diabetes, most of which were independent risk factors. The study found six independent influencing factors for normal people to develop prediabetes, of which Age, PRO, TP, and ALT were four independent risk factors, and GLB and HDL.C were two independent protective factors. We also found nine independent influencing factors for prediabetes people to diabetes, of which Age, Gender, BMI, SBP, U.GLU, PRO, ALT, and TG were independent risk factors, and AST was an independent protective factor. The discussion of the clinical relationships between these indicators and diabetes supported the interpretability of our feature selection. The above independent influencing factors were used as predictors to build prediction models. The trained models all had AUC scores higher than 0.7, while the XGBoost model achieved the best on the training set and logistic regression performed the best on the testing set. Our analyzing results and predicted models can be used to promote personal health management. Moreover, we plan to expand the sample modality and quantity in future work, adding other physical examination indicators for subjects, such as vascular indicators and fundus color imaging, using a multicenter study design, and using a deep learning framework to concatenate the above data. Our work on disease factor analysis and prediction models would deepen understanding of diabetes progression, contributing to the development of personal health management.
Data Sharing Statement
The data presented in this study are available on request from the corresponding author. The data are not publicly available due to ethical restrictions.
Ethics Approval
The research involving human participants was ethically reviewed and approved by the Ethics Committee of Peking University Shenzhen Hospital (approval number 2023-079). The study adheres to the principles outlined in the Declaration of Helsinki. In accordance with article 32 of the “Measures for Ethical Review of Life Science and Medical Research Involving Human Beings” published by the Chinese government, the Ethics Committee of Peking University Shenzhen Hospital granted an exemption from informed consent for this retrospective study.
Acknowledgments
We thank all participants in this study.
Author Contributions
All authors made a significant contribution to the work reported, whether that is in the conception, study design, execution, acquisition of data, analysis and interpretation, or in all these areas; took part in drafting, revising or critically reviewing the article; gave final approval of the version to be published; have agreed on the journal to which the article has been submitted; and agree to be accountable for all aspects of the work.
Funding
This research received no external funding.
Disclosure
The authors report no conflicts of interest in this work.
References
1. World Health Organization. Definition and diagnosis of diabetes mellitus and intermediate hyperglycaemia: report of a WHO/IDF consultation; 2006.
2. Rao SS, Disraeli P, McGregor T. Impaired glucose tolerance and impaired fasting glucose. Am Family Phys. 2004;69(8):1961–1968.
3. Huang Y, Cai X, Mai W, Li M, Hu Y. Association between prediabetes and risk of cardiovascular disease and all cause mortality: systematic review and meta-analysis. BMJ. 2016;355. doi:10.1136/bmj.i5953
4. Paschou SA, Bletsa E, Saltiki K, et al. Sleep apnea and cardiovascular risk in patients with prediabetes and type 2 diabetes. Nutrients. 2022;14(23):4989. doi:10.3390/nu14234989
5. Tab ́ak AG, Herder C, Rathmann W, Brunner EJ, Kivim ̈aki M. Prediabetes: a high-risk state for diabetes development. Lancet. 2012;379(9833):2279–2290. doi:10.1016/S0140-6736(12)60283-9
6. American Diabetes Association. Diagnosis and classification of diabetes mellitus. Diabetes Care. 2010;33(Supplement_1):S62–S69. doi:10.2337/dc10-S062
7. Raj S, Rajan G. Correlation between elevated serum ferritin and hba1c in type 2 diabetes mellitus. Int J Res Med Sci. 2013;1(1):12–15. doi:10.5455/2320-6012.ijrms20130203
8. Elimam H, Abdulla AM, Taha IM. Inflammatory markers and control of type 2 diabetes mellitus. Diabetes Metabol Synd. 2019;13(1):800–804. doi:10.1016/j.dsx.2018.11.061
9. Tamura Y, Izumiyama-Shimomura N, Kimbara Y, et al. β-cell telomere attrition in diabetes: inverse correlation between hba1c and telomere length. J Clin Endocrinol Metab. 2014;99(8):2771–2777. doi:10.1210/jc.2014-1222
10. Buch A, Kaur S, Nair R, Jain A. Platelet volume indices as predictive biomarkers for diabetic complications in type 2 diabetic patients. J Lab Phys. 2017;9(02):084–088. doi:10.4103/0974-2727.199625
11. Yang H, Luo Y, Ren X, et al. Risk prediction of diabetes: big data mining with fusion of multifarious physical examination indicators. Information Fusion. 2021;75:140–149. doi:10.1016/j.inffus.2021.02.015
12. Xu W, Zhang J, Zhang Q, Wei X. Risk prediction of type II diabetes based on random forest model.
13. Mujumdar A, Vaidehi V. Diabetes prediction using ML algorithms. Procedia Comput Sci. 2019;165:292–299. doi:10.1016/j.procs.2020.01.047
14. Li M, Fu X, Li D. Diabetes prediction based on XGBoost algorithm. IOP Conf Ser Mater Sci Eng. 2020;768(7):072093. doi:10.1088/1757-899X/768/7/072093
15. Choi SB, Kim WJ, Yoo TK, et al. Screening for prediabetes using machine learning models. Computational and mathematical methods in medicine 2014; 2014.
16. Kopitar L, Kocbek P, Cilar L, Sheikh A, Stiglic G. Early detection of type 2 diabetes mellitus using machine learning-based prediction models. Sci Rep. 2020;10(1):11981. doi:10.1038/s41598-020-68771-z
17. Wang L, Mu Y, Zhao J, Wang X, Che H. Igrnet: a deep learning model for non-invasive, real-time diagnosis of prediabetes through electrocardiograms. Sensors. 2020;20(9):2556. doi:10.3390/s20092556
18. B ̈uhlmann P, Van De Geer S. Statistics for High-Dimensional Data: Methods, Theory and Applications. Springer Science & Business Media; 2011.
19. Svetnik V, Liaw A, Tong C, Culberson JC, Sheridan RP, Feuston BP. Random forest: a classification and regression tool for compound classification and qsar modeling. J Chem Inf Comput Sci. 2003;43(6):1947–1958. doi:10.1021/ci034160g
20. Cortes C, Vapnik V. Support-vector networks. Machine Learning. 1995;20(3):273–297. doi:10.1007/BF00994018
21. Chen T, Guestrin C. Xgboost: a scalable tree boosting system. In
22. Menke A, Casagrande S, Geiss L, Cowie CC. Prevalence of and trends in diabetes among adults in the United States, 1988–2012. JAMA. 2015;314(10):1021–1029. doi:10.1001/jama.2015.10029
23. Bays HE, Chapman R, Grandy S; the SHIELD Investigators’ Group. The relationship of body mass index to diabetes mellitus, hypertension and dyslipidaemia: comparison of data from two national surveys. Int J Clin Pract. 2007;61(5):737–747. doi:10.1111/j.1742-1241.2007.01336.x
24. Zhang Y, Nie J, Zhang Y, et al. Degree of blood pressure control and incident diabetes mellitus in Chinese adults with hypertension. J Am Heart Assoc. 2020;9(16):e017015. doi:10.1161/JAHA.120.017015
25. Adler AI, Stratton IM, Neil HAW, et al. Association of systolic blood pressure with macrovascular and microvascular complications of type 2 diabetes (ukpds 36): prospective observational study. BMJ. 2000;321(7258):412–419. doi:10.1136/bmj.321.7258.412
26. Chen J, Guo HJ, Qiu S-H, et al. Identification of newly diagnosed diabetes and prediabetes using fasting plasma glucose and urinary glucose in a Chinese population: a multicenter cross-sectional study. Chinese Med J. 2018;131(14):1652–1657. doi:10.4103/0366-6999.235884
27. Okada R, Yasuda Y, Tsushita K, Wakai K, Hamajima N, Matsuo S. Trace proteinuria by dipstick screening is associated with metabolic syndrome, hypertension, and diabetes. Clin Experiment Nephrol. 2018;22(6):1387–1394. doi:10.1007/s10157-018-1601-3
28. Sabanayagam C, Shankar A, Lim S, Lee J, Tai E, Wong T. Serum c-reactive protein level and prediabetes in two asian populations. Diabetologia. 2011;54(4):767–775. doi:10.1007/s00125-011-2052-5
29. Tilves CM, Zmuda JM, Kuipers AL, et al. Association of lipopolysaccharide-binding protein with aging-related adiposity change and prediabetes among African ancestry men. Diabetes Care. 2016;39(3):385–391. doi:10.2337/dc15-1777
30. Dimova R, Chakarova N, Kirilov G, Grozeva G, Shinkov A, Tankova T. Vitamin d binding protein is related to cardiac autonomic function and metabolic status in prediabetes. Nutr Res. 2020;75:56–66. doi:10.1016/j.nutres.2019.12.008
31. Iyidir OT, Degertekin CK, Yilmaz BA, et al. Serum levels of fetuin a are increased in women with gestational diabetes mellitus. Arch Gynecol Obstetrics. 2015;291(4):933–937. doi:10.1007/s00404-014-3490-3
32. Zhou Y, Yang G, Qu C, et al. Predictive performance of lipid parameters in identifying undiagnosed diabetes and prediabetes: a cross-sectional study in eastern China. BMC Endocr Disord. 2022;22:1–9. doi:10.1186/s12902-022-00984-x
33. von Eckardstein A, Widmann C. High-density lipoprotein, beta cells, and diabetes. Cardiovascul Res. 2014;103(3):384–394. doi:10.1093/cvr/cvu143
34. Sobers-Grannum N, Murphy MM, Nielsen A, et al. Female gender is a social determinant of diabetes in the Caribbean: a systematic review and meta-analysis. PLoS One. 2015;10(5):e0126799. doi:10.1371/journal.pone.0126799
35. Hermans MP, Ahn SA, Rousseau MF. log(TG)/HDL-C is related to both residual cardiometabolic risk and β-cell function loss in type 2 diabetes males. Cardiovascul Diabetol. 2010;9(1):1–10. doi:10.1186/1475-2840-9-88
36. Qian K, Zhong S, Xie K, Yu D, Yang R, Gong D-W. Hepatic alt isoenzymes are elevated in gluconeogenic conditions including diabetes and suppressed by insulin at the protein level. Diabetes Metab Res Rev. 2015;31(6):562–571. doi:10.1002/dmrr.2655
37. Niu H, Zhou Y. Nonlinear relationship between ast-to-alt ratio and the incidence of type 2 diabetes mellitus: a follow-up study. Int J Gene Med. 2021;Volume 14:8373–8382. doi:10.2147/IJGM.S341790
38. Gong D, Chen X, Yang L, et al. From normal population to prediabetes and diabetes: study of influencing factors and prediction models. Front Endocrinol. 2023;14:1225696. PMID: 37964953; PMCID: PMC10640999. doi:10.3389/fendo.2023.1225696
 © 2024 The Author(s). This work is published and licensed by Dove Medical Press Limited. The
full terms of this license are available at https://www.dovepress.com/terms
and incorporate the Creative Commons Attribution
- Non Commercial (unported, 3.0) License.
By accessing the work you hereby accept the Terms. Non-commercial uses of the work are permitted
without any further permission from Dove Medical Press Limited, provided the work is properly
attributed. For permission for commercial use of this work, please see paragraphs 4.2 and 5 of our Terms.
© 2024 The Author(s). This work is published and licensed by Dove Medical Press Limited. The
full terms of this license are available at https://www.dovepress.com/terms
and incorporate the Creative Commons Attribution
- Non Commercial (unported, 3.0) License.
By accessing the work you hereby accept the Terms. Non-commercial uses of the work are permitted
without any further permission from Dove Medical Press Limited, provided the work is properly
attributed. For permission for commercial use of this work, please see paragraphs 4.2 and 5 of our Terms.
Recommended articles
Using Machine Learning Algorithms to Predict High-Risk Factors for Postoperative Delirium in Elderly Patients
Liu Y, Shen W, Tian Z
Clinical Interventions in Aging 2023, 18:157-168
Published Date: 8 February 2023
Ten-Year Multicenter Retrospective Study Utilizing Machine Learning Algorithms to Identify Patients at High Risk of Venous Thromboembolism After Radical Gastrectomy
Liu Y, Song C, Tian Z, Shen W
International Journal of General Medicine 2023, 16:1909-1925
Published Date: 18 May 2023
Development of Machine Learning Models for Predicting Osteoporosis in Patients with Type 2 Diabetes Mellitus—A Preliminary Study
Wu X, Zhai F, Chang A, Wei J, Guo Y, Zhang J
Diabetes, Metabolic Syndrome and Obesity 2023, 16:1987-2003
Published Date: 30 June 2023
Prediction of the Risk of Bone Mineral Density Decrease in Type 2 Diabetes Mellitus Patients Based on Traditional Multivariate Logistic Regression and Machine Learning: A Preliminary Study
Zhang J, Xu Z, Fu Y, Chen L
Diabetes, Metabolic Syndrome and Obesity 2023, 16:2885-2898
Published Date: 19 September 2023
An Explainable Machine Learning Model to Predict Acute Kidney Injury After Cardiac Surgery: A Retrospective Cohort Study
Gao Y, Wang C, Dong W, Li B, Wang J, Li J, Tian Y, Liu J, Wang Y
Clinical Epidemiology 2023, 15:1145-1157
Published Date: 4 December 2023