")
Back to Journals » Journal of Pain Research » Volume 12
Risk factors associated with pain among community adults in Northwest China
Authors Guo J, Fu M , Qu Z, Wang X, Zhang X
Received 7 November 2018
Accepted for publication 2 May 2019
Published 2 July 2019 Volume 2019:12 Pages 1957—1969
DOI https://doi.org/10.2147/JPR.S193773
Checked for plagiarism Yes
Review by Single anonymous peer review
Peer reviewer comments 2
Editor who approved publication: Dr Erica Wegrzyn
Jing Guo,1 Mingqi Fu,1 Zhiyong Qu,2 Xiaohua Wang,2 Xiulan Zhang2
1School of Sociology, Huazhong University of Science and Technology, Wuhan 430074, People’s Republic of China; 2School of Social Development and Public Policy, China Institute of Health, Beijing Normal University, Beijing 100875, People’s Republic of China
Objectives: We aimed to investigate the prevalence of and risk factors associated with pain and to compare the correlation between depression and sleep quality and pain among adults in Northwest China, where health care resources are limited.
Methods: In total, 7,602 subjects (age ≥40 years) participated in this survey. Using the Brief Pain Inventory-Chinese version, we evaluated the overall pain among respondents, including pain sites, pain intensity, and its interference in daily life. In addition, depression symptoms were measured using the Center for Epidemiologic Studies Depression Scale Chinese edition. Furthermore, the subjective sleep quality among participants was assessed using the Pittsburgh Sleep Quality Index.
Results: Approximately 25.2% of the participants experienced pain, and 41.7% of those perceived the worst pain they had experienced as severe pain. Chronic disease exhibited the most robust correlation with severe pain, followed by poor sleep quality. Furthermore, the correlation between depression and pain was found only in the population with severe pain.
Conclusion: The study reveals that pain affects a large proportion of Chinese adults, especially females, living in rural areas, having lower incomes, unemployed, and suffering from poor health status or mental illness. Furthermore, this study suggests we should have a screen and intervention for depression and poor sleep quality among pain suffers, which will be helpful for pain management in Northwest China.
Keywords: pain, depression, sleep quality
Introduction
Pain is common but influential, increases with age, and varies extensively from 25% to 80% in prevalence.1 The symptoms of pain hasten the utilization of health care services, accounting for substantial health care costs, loss of productivity, and diminished quality of life.2 Given pain’s imponderable effects, determining the risk factors associated with pain has become critical to help manage the pain more effectively. A comprehensive analysis of the existing evidence within this field revealed that to date, most studies were conducted in Western Europe and North America, often in specialized pain clinics.3 Most related findings reported from China were based on individuals with specific pain symptoms;4–6 those afflicted by particular diseases, such as cancer;7 or those suffering from specific trauma, such as traffic accidents.8 However, information on pain among the general population in the community context is limited. Thus, given the utmost significance of pain in China, along with limited domestic studies, further studies are warranted to elucidate the reality concerning pain in China.
Regarding risk factors associated with pain, a nationally representative, cross-sectional study reported that people having low socioeconomic status and chronic diseases were more likely to report pain;6 nevertheless, the study lacked information on psychological distress, which, perhaps, works through a complex set of interaction with pain. Another comprehensive study conducted among Australian adults reported that old age, lesser education, poor self-rated health, and being unemployed for health reasons were risk factors significantly associated with chronic pain.9 Given the high prevalence of pain and the complex set of risk factors, which could account for adverse outcomes, it is imperative to focus on pain and explore the potential risk factors associated with pain in the Chinese social context.
To date, several studies have established a correlation among pain, depression, and sleep quality.10 Overall, complaints of pain are more commonly reported by those experiencing depression symptoms.11 Of note, people with depression always present with emotional and physical pain, which cannot be measured and assessed by medical techniques easily.12 Particularly, in the Chinese society, people tend to deny depression and express it with somatic symptoms.13 In addition, poor sleep quality has a high prevalence among people with depression and is often reported in populations with chronic diseases.14 Some clinical studies have suggested the correlation between pain and sleep disturbances to be bidirectional, ie, pain-disturbed sleep continuity and lowered sleep quality, whereas poor sleep further exacerbated pain.15 Two recent prospective studies have reported that poor sleep quality in patients closely correlated with the increased pain severity measured after 6 months,16 and perceived sleep problems increased risks for developing widespread pain within 15 months.17 Although these studies suggested the pairwise correlations of pain, depressive symptoms, and sleep quality, they did not compare the correlations between depression and sleep quality and pain on the same plane. More important, in the context of Chinese social settings, correlations mentioned above are potential to varied between regions, as residents in northwest areas are likely to face higher pain risk because of heavier physical labor but receive lower level of health care, especially of psychological services.18 Thus, to facilitate nurses and clinicians in northwest China to manage and intervene in pain, more studies are warranted to consider the overall correlation among pain, depression, and sleep quality.
In this study, we aimed to investigate the prevalence of and risk factors associated with pain and compare the correlations between depression and sleep quality and pain among adults in Northwest China.
Methods
Study design
This study was conducted among community adults in three cities and one rural town in Northwestern China (Xining city in Qinghai Province, Lanzhou city, Baiyin city, and Pingliang town in Gansu Province) in July 2011, using a three-stage cluster sampling. In the first two stages, we used the combination of “systematic sampling with probability proportional” (PPS) and the population size to select districts and communities. Because 100–300 households were randomly selected from each designated community, “100 households” was set as a sampling unit, and the number of households finally selected for the survey was determined as per the number of sampling units in each community. In the final stage, participants aged ≥40 years from each household were selected for this study. Overall, 6,622 households and 7,602 individuals from 38 selected communities were involved in the survey, with a response rate of approximately 89%. Of 6,622 households selected, 2,104 had more than one adult member participating in this survey. Of 7,602 surveyed individuals, 1,918 reported experiencing pain within 24 hrs before the interview. Further details are provided elsewhere.19
Each participant was interviewed face to face by a trained local college student from the Northwest Normal University (Lanzhou city, China). Of note, 40 students majoring in related subjects, such as sociology and psychology, participated in the survey voluntarily to collect data and received a 7-day systematic training. During the survey, all 40 interviewers were familiar with the explanations of the items in the questionnaires, as well as the standard interviewing protocol and techniques of the study. This study was conducted in accordance with the tenets of the Declaration of Helsinki. We obtained written informed consent from all participants after informing them regarding the aim of the study and the right of refusal.
Measures
Pain experiences
The threshold question, “Have you been experiencing any pain lately?” was asked to assess pain experienced by individuals. Participants who replied affirmatively were guided to answer the Brief Pain Inventory-Chinese version (BPI-C) further. The BPI-C is a 3-part scale used to thoroughly observe pain, including pain sites, pain intensity, and its interference with daily activities, during the past 3 months.20 In the first part, printed figures representing the front and back of the body were shown to individuals. All respondents were asked to mark the locations in which they experienced pain, numbering the specified pain sites sequentially.21 In the second part, participants were asked to identify four specific pain sites, including those which are most painful, least painful, moderately painful, and currently painful. By rating the pain severity of the four mentioned sites from 0 (“no pain”) to 10 (“the worst pain”), respondents reported their overall pain intensity by averaging them. Further, participants were also asked whether they were on any drugs or received any physiotherapeutic intervention to treat the pain. In this survey, the Cronbach α reliability for the pain intensity score was 0.83. In the third part, BPI-C included seven items to ascertain to what extent did the pain interfere with daily life, including general activities, walking, working, sleeping, mood, relations with others, and enjoyment of life. Each item was ranked on a 0–10 scale, and the overall pain interference score was evaluated as the average of the seven items. In this survey, the Cronbach α reliability of the interference score was 0.90. Based on prior evidence, pain severity and pain interference were ranked as “mild” if the score was <4 (inclusive), as “moderate” if the score was between 4 and 6, and as “severe” if the score was >6 (inclusive).3
We used the result of the whole inventory of reporting pain, but only asked one question inquiring “the most severe pain” to make further regression analyses. Based on the standard procedure mentioned previously, the worst pain intensity was used in the multinominal logistic regression model22 to elucidate pain; this item has been validated to exhibit good concurrent validity (r =0.77–0.86), good criterion-related validity, and high test–rest reliability (r =0.93).23,24
Depressive symptoms
We assessed depressive symptoms using the Center for Epidemiologic Studies Depression Scale (CES-D) Chinese edition;25 this is the most widely used depression screening scale in China and is often adopted in community-based studies. In this study, we testified the validity and reliability of the CES-D scale and validated its good performance over all age groups.26 The internal consistency coefficient (Cronbach α) of the CES-D Chinese edition was 0.90.
Based on Radloff’s study, the cutoff point on the CES-D should be 16; individuals who attain a score >16 should be considered depressed.27 Nevertheless, some studies have reported the score of 21 or 22 as the cutoff point.28 Studies in China have indicated that Chinese people often overestimate their depression symptoms, and the original cutoff proposed by Radloff yielded a low value for positive prediction.26,29 Conversely, other studies have indicated that a cutoff of 21 adequately evaluates depression among the Chinese population.30 In addition, studies conducted among patients with higher levels of comorbid medical diseases in primary care units reported that a cutoff point at 21 displays the best positive predictive value for major depression.31 Hence, in this study, we applied the cutoff point of 21 to indicate depression.
Sleep quality
We used the Pittsburgh Sleep Quality Index (PSQI) to assess the subjective sleep quality and continuity in the past months. The total score was evaluated as the sum of that of the seven components, including subjective sleep quality, sleep duration, sleep efficiency, sleep disturbance, sleep latency, the level of daytime dysfunction, and the usage of sleep medicine. All seven components were equally weighted on a 0-3-point scale and summed to provide a total score (range: 0–21). In addition, we used a cutoff point of 7 to distinguish the sleep quality; a higher score depicted a poorer sleep quality.32 Furthermore, PSQI has been extensively used to assess the quality of sleeping; this measure has been validated by several studies conducted in China.33 In this study, the Cronbach α was 0.70.
Potential confounders
Demographic characteristics
All respondents reported their gender (male, female), age (40–60, >60), education level (primary school and below, middle school, high school, college and above), ethnicity (Han, minority), marital status (unmarried, married, divorced, widowed), employment status (employed, unemployed, retired), and Dibao status (families in receipt of the minimum living standard subsidy; Yes, No).
Health behaviors
In this study, all participants reported their current smoking and drinking status; these two variables have been established to be sufficient measures in assessing health behaviors.34,35 We defined cigarette smoking as having smoked, at least, one cigarette per day for, at least, a year. Drinking was defined as having consumed alcohol more than once per week during the past 6 months. We controlled both variables because previous studies have demonstrated that more alcohol addiction behaviors and higher smoking rates existed among people with pain.36,37
Health status
The participants’ chronic and acute diseases were included as confounding variables. Participants were asked about having any chronic diseases diagnosed by physicians in the past 6 months. Chronic diseases included cardiovascular disease, diabetes, obstructive pulmonary disease, cancer, and hypertension. Respondents could answer these questions with 1 for “No,” and 2 for “Yes.” In addition, participants also answered questions about acute diseases: “Were you diagnosed with an illness by a physician in the past 4 weeks, such as cold, influenza, and strep throat?”; the answer could be selected between 1 for “No” and 2 for “Yes.”
Statistical analysis
In this study, data analyses were conducted using SPSS 22.0 (SPSS Inc., Chicago, IL, USA), and the α level was set at a two-tailed 5%. We used the bivariate analysis to assess the correlations between concerned variables, such as depression, health status, health behaviors, sleep quality, and pain. In addition, ANOVA and post-hoc analysis were conducted to compare the overall interference score for each severity category based on the cutoff points for the worst and average pain severity. Using the binary logistic regression, we explored risk factors associated with pain, during which suffering from pain or not was assessed as a dependent variable, whereas depression, sleep quality, health behaviors and health status, and demographic characteristics were included as independent variables. Next, we implemented multinomial logistic regression to assess the risk factors associated with mild, moderate, and severe pain, considering the same confounders as mentioned above and using those with no pain as a reference. Notably, in this study, depression and sleep quality were considered as categorical variables rather than continuous variables; thus, the former type was better associated with clinical diagnosis and easier applied for self-report measurement.
Results
Descriptive analysis
As shown in Table 1, of 7,602 participants, most were females (52.6%), elderly [mean, 57.6; SD, 11.99], and lived in urban areas (69.2%). In addition, majority of surveyed participants belonged to the Han ethnic group (93.6%), which is a national majority. In this study, 25.2% of participants reported experiencing pain; the prevalence of pain in urban areas was 23.5%, whereas that in rural areas was 29.2%. Furthermore, compared with the reference groups, those who were older, living in rural China, female, belonging to the minority ethnic group, widowed, having lower education level, unemployed, and having a positive Dibao status were more likely to report pain.
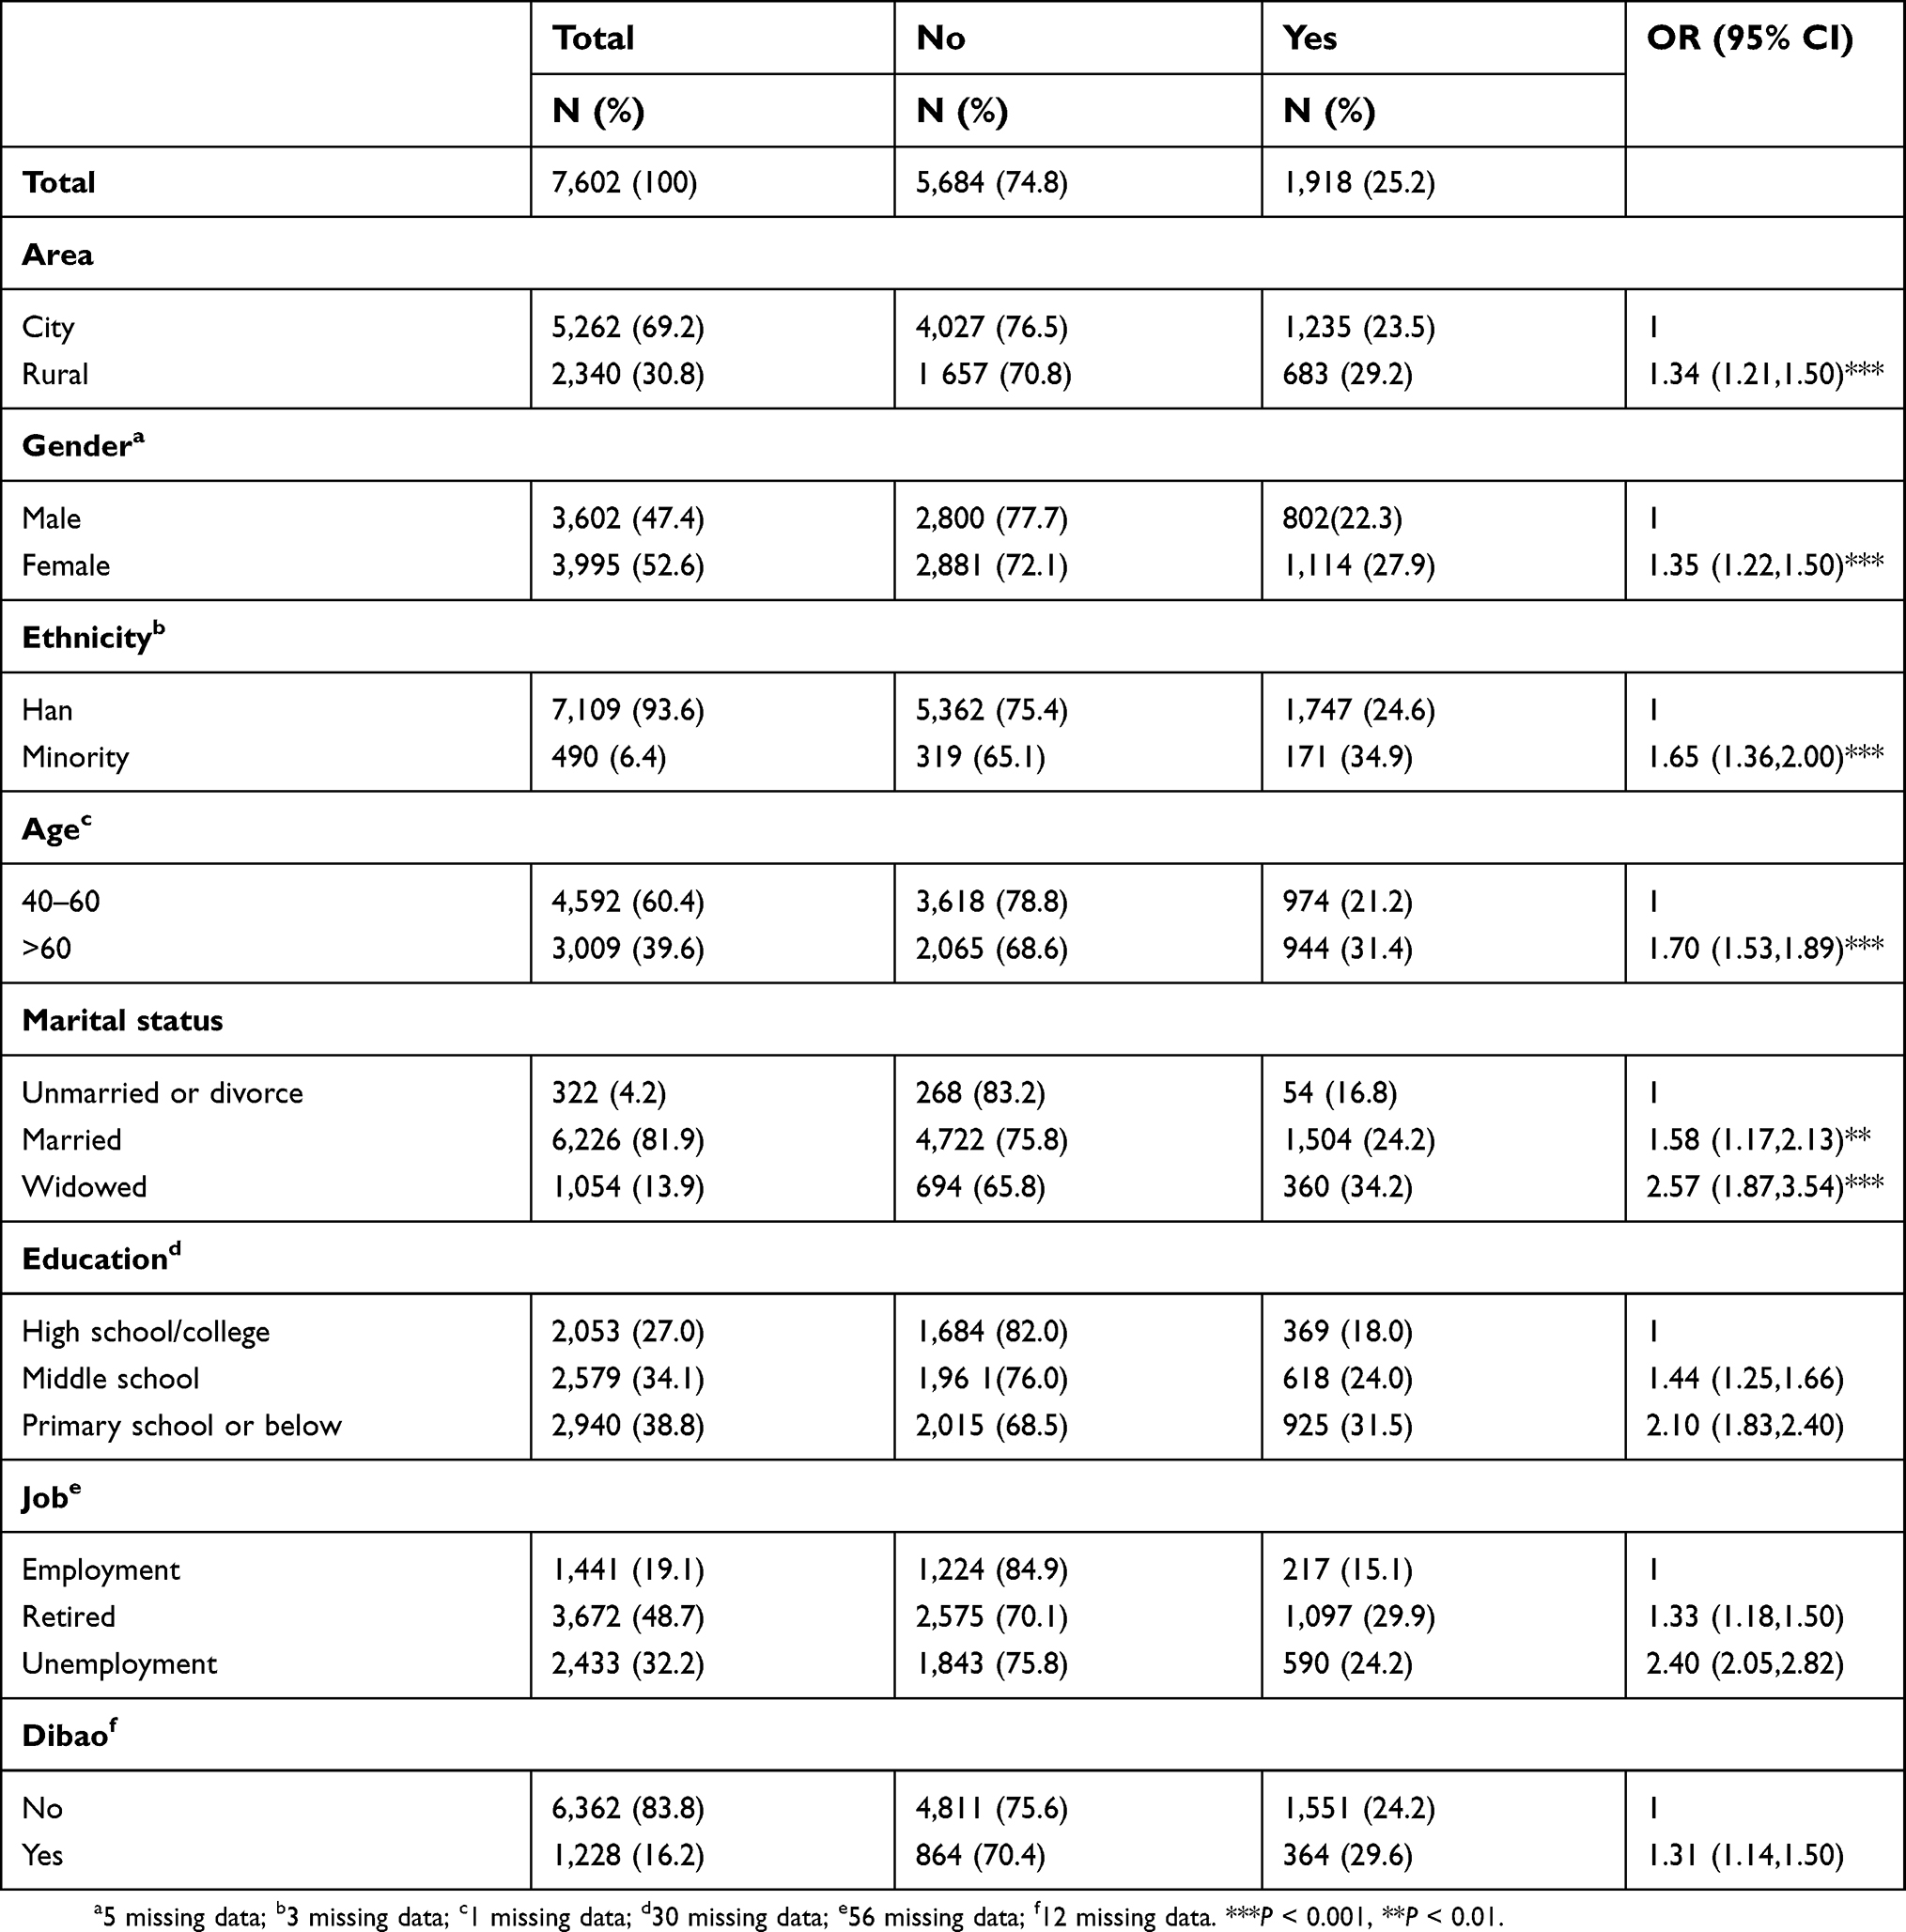 |
Table 1 Descriptive characteristics of study population by pain (n=7,602) |
In addition, among 1,235 and 683 pain reporters in urban and rural areas, 58.79% and 43.78% of urban pain sufferers reported using, at least, one drug or receiving physiotherapeutic intervention, compared with 26.96% and 13.47% in rural areas, respectively. Most drugs or other curative interventions aimed to cure or alleviate chronic pain. Of note, the subscale for the type of drugs and physiotherapy data were omitted owing to the enormous variance. However, we found that both traditional Chinese medicine and western medicine were adopted by pain sufferers, and home-based massage, acupuncture, and moxibustion were the leading physiotherapeutic approaches.
Figure 1 presents the location of pain. Overall, 1,892 participants responded to the locations of pain. The leading locations of pain were the knees, followed by the back and the right abdomen; further, 32.3% of respondents reported only one location, and the pain was mostly located in the knees (23.2%). Conversely, the majority of respondents reported two (29.9%) or three (9.8%) pain locations.
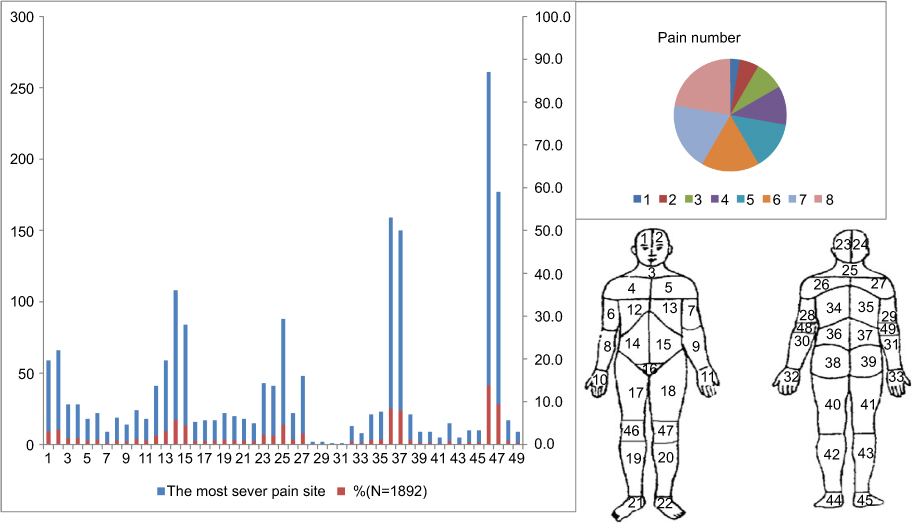 |
Figure 1 Pain number and the site of pain among 1892 participants in Northwest China. |
Table 2 presents the severity of each pain item and its interference with people’s daily life. Regarding the average pain intensity, most participants ranged from having mild (47.5%) to moderate (49.8%) pain, with only 2.7% of participants reporting severe pain. However, regarding the intensity of worst pain experienced, nearly half (41.7%) of the participants described it as severe pain. The intensity of pain they experienced during interview varied from mild (65.1%) to moderate (30.9%), whereas only 4.0% of participants rated it as severe. In addition, pain affected participants’ daily activity mostly (mean, 3.92; SD, 2.32) and then sleeping (mean, 3.45; SD, 2.49), with recreation and interpersonal relationships suffering the least. Table 2 provides detailed information about the BPI scores.
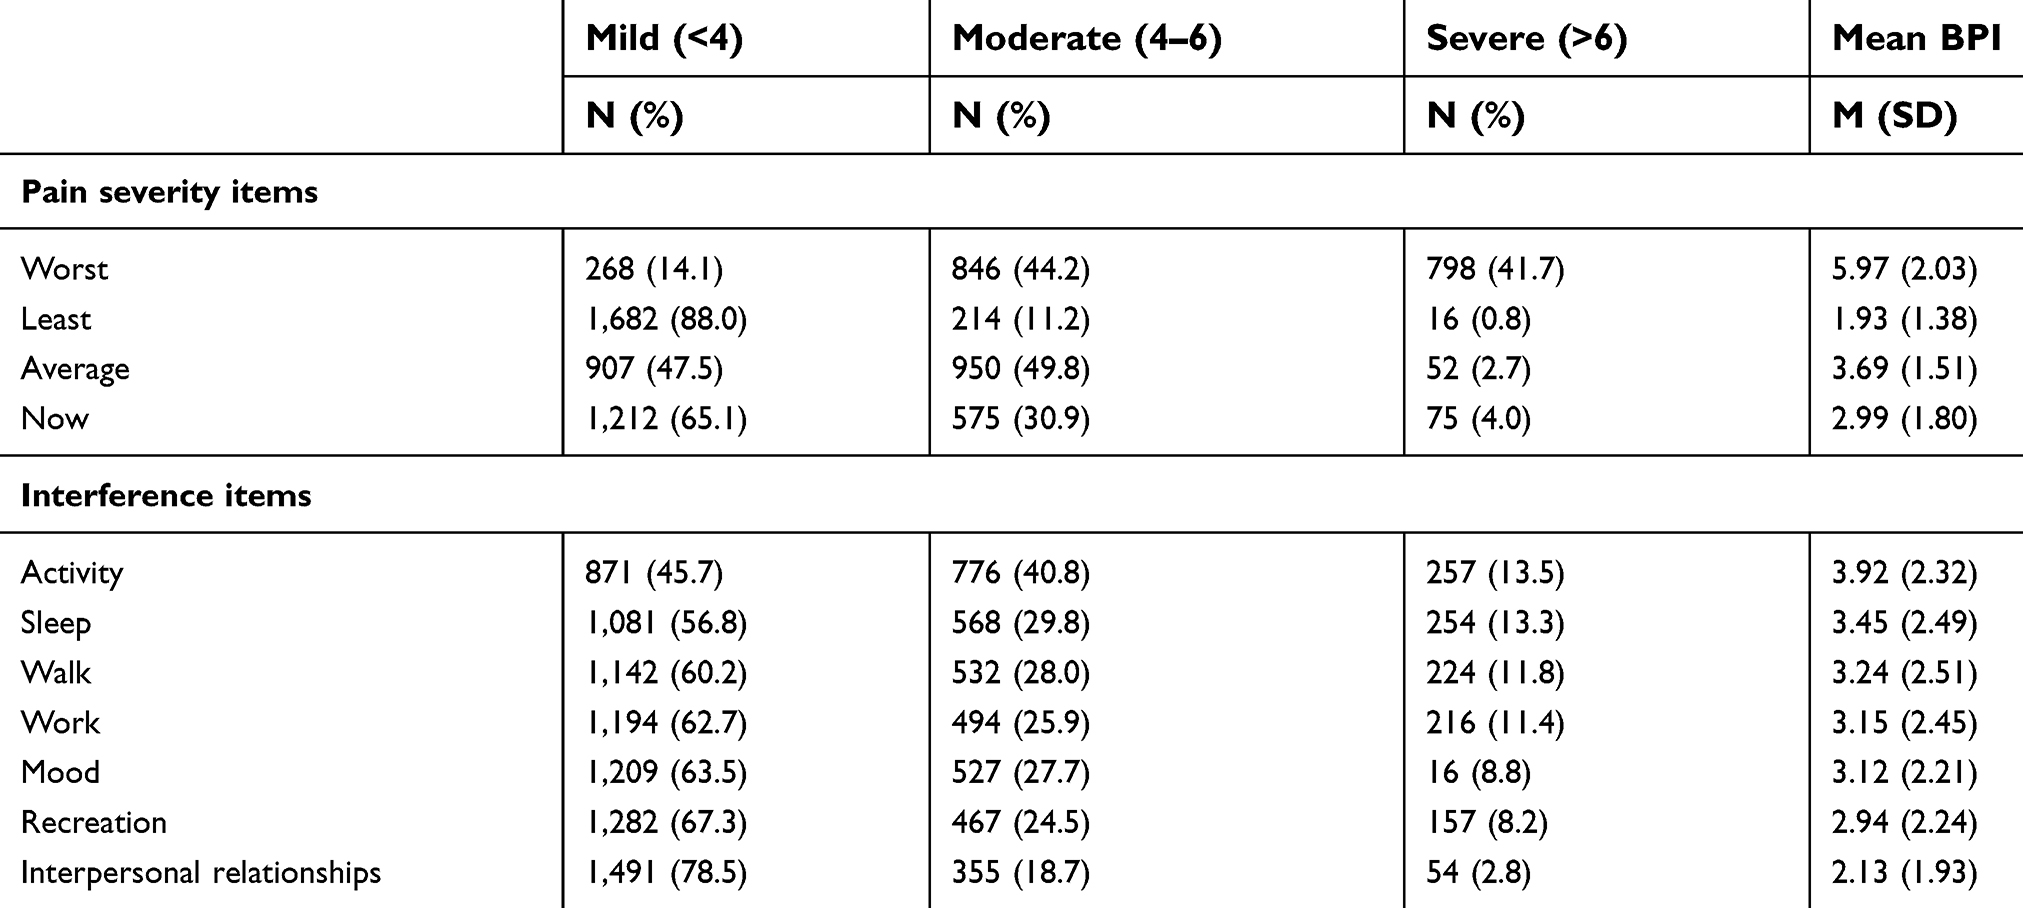 |
Table 2 Brief Pain Inventory scores |
Table 3 summarizes the overall interference score for each severity category based on the cutoff points for the worst and average pain severity. Cutoff points of 4 and 7 classify the sample in the categories of mild, moderate, and severe pain as the worst and average items (F =1201.18 and 1810.40 for worst and average pain, respectively; P<0.0001) accurately. The mean interference in this study was 1.82 (SD, 0.79), 3.22 (SD, 0.88), and 4.73 (SD, 0.98) for mild, moderate, and severe pain categories, respectively, among the worst pain (Table 3). Regarding the average pain, the mean interference was 2.54 (SD, 0.82) for mild, 4.54 (SD, 0.78) for moderate, and 6.67 (SD, 0.97) for severe pain.
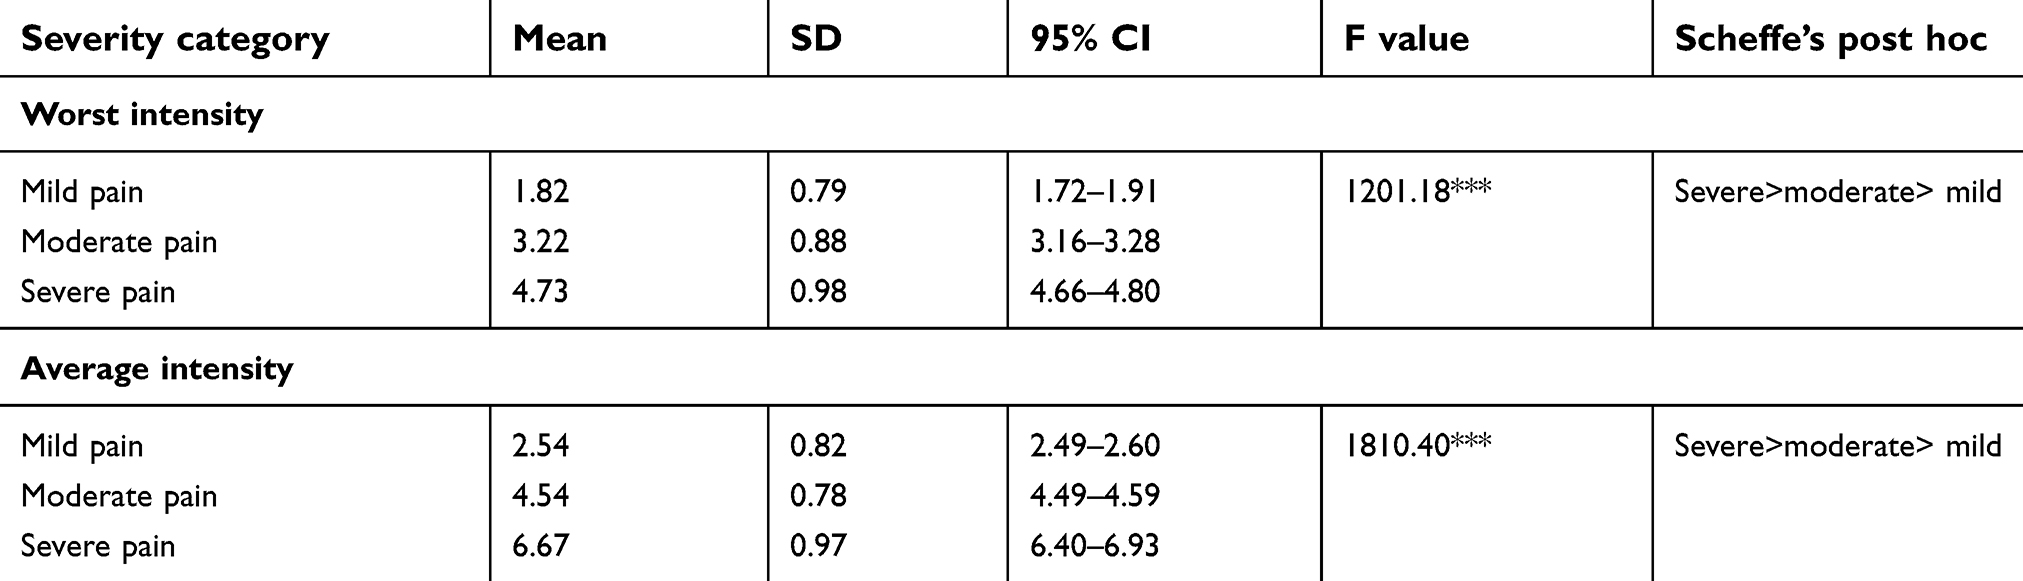 |
Table 3 Mean,SD, and 95% CIs for the overall interference score for each severity category based on the optimal cut points for worst and average pain severity |
Of the risk factors screened, location, gender, age, marital status, drinking and smoking behaviors, and illnesses exhibited marked bivariate correlations with pain intensity. Furthermore, we observed a markedly high prevalence of severe pain among people with chronic diseases, depression, and poor sleep quality (Table 4).
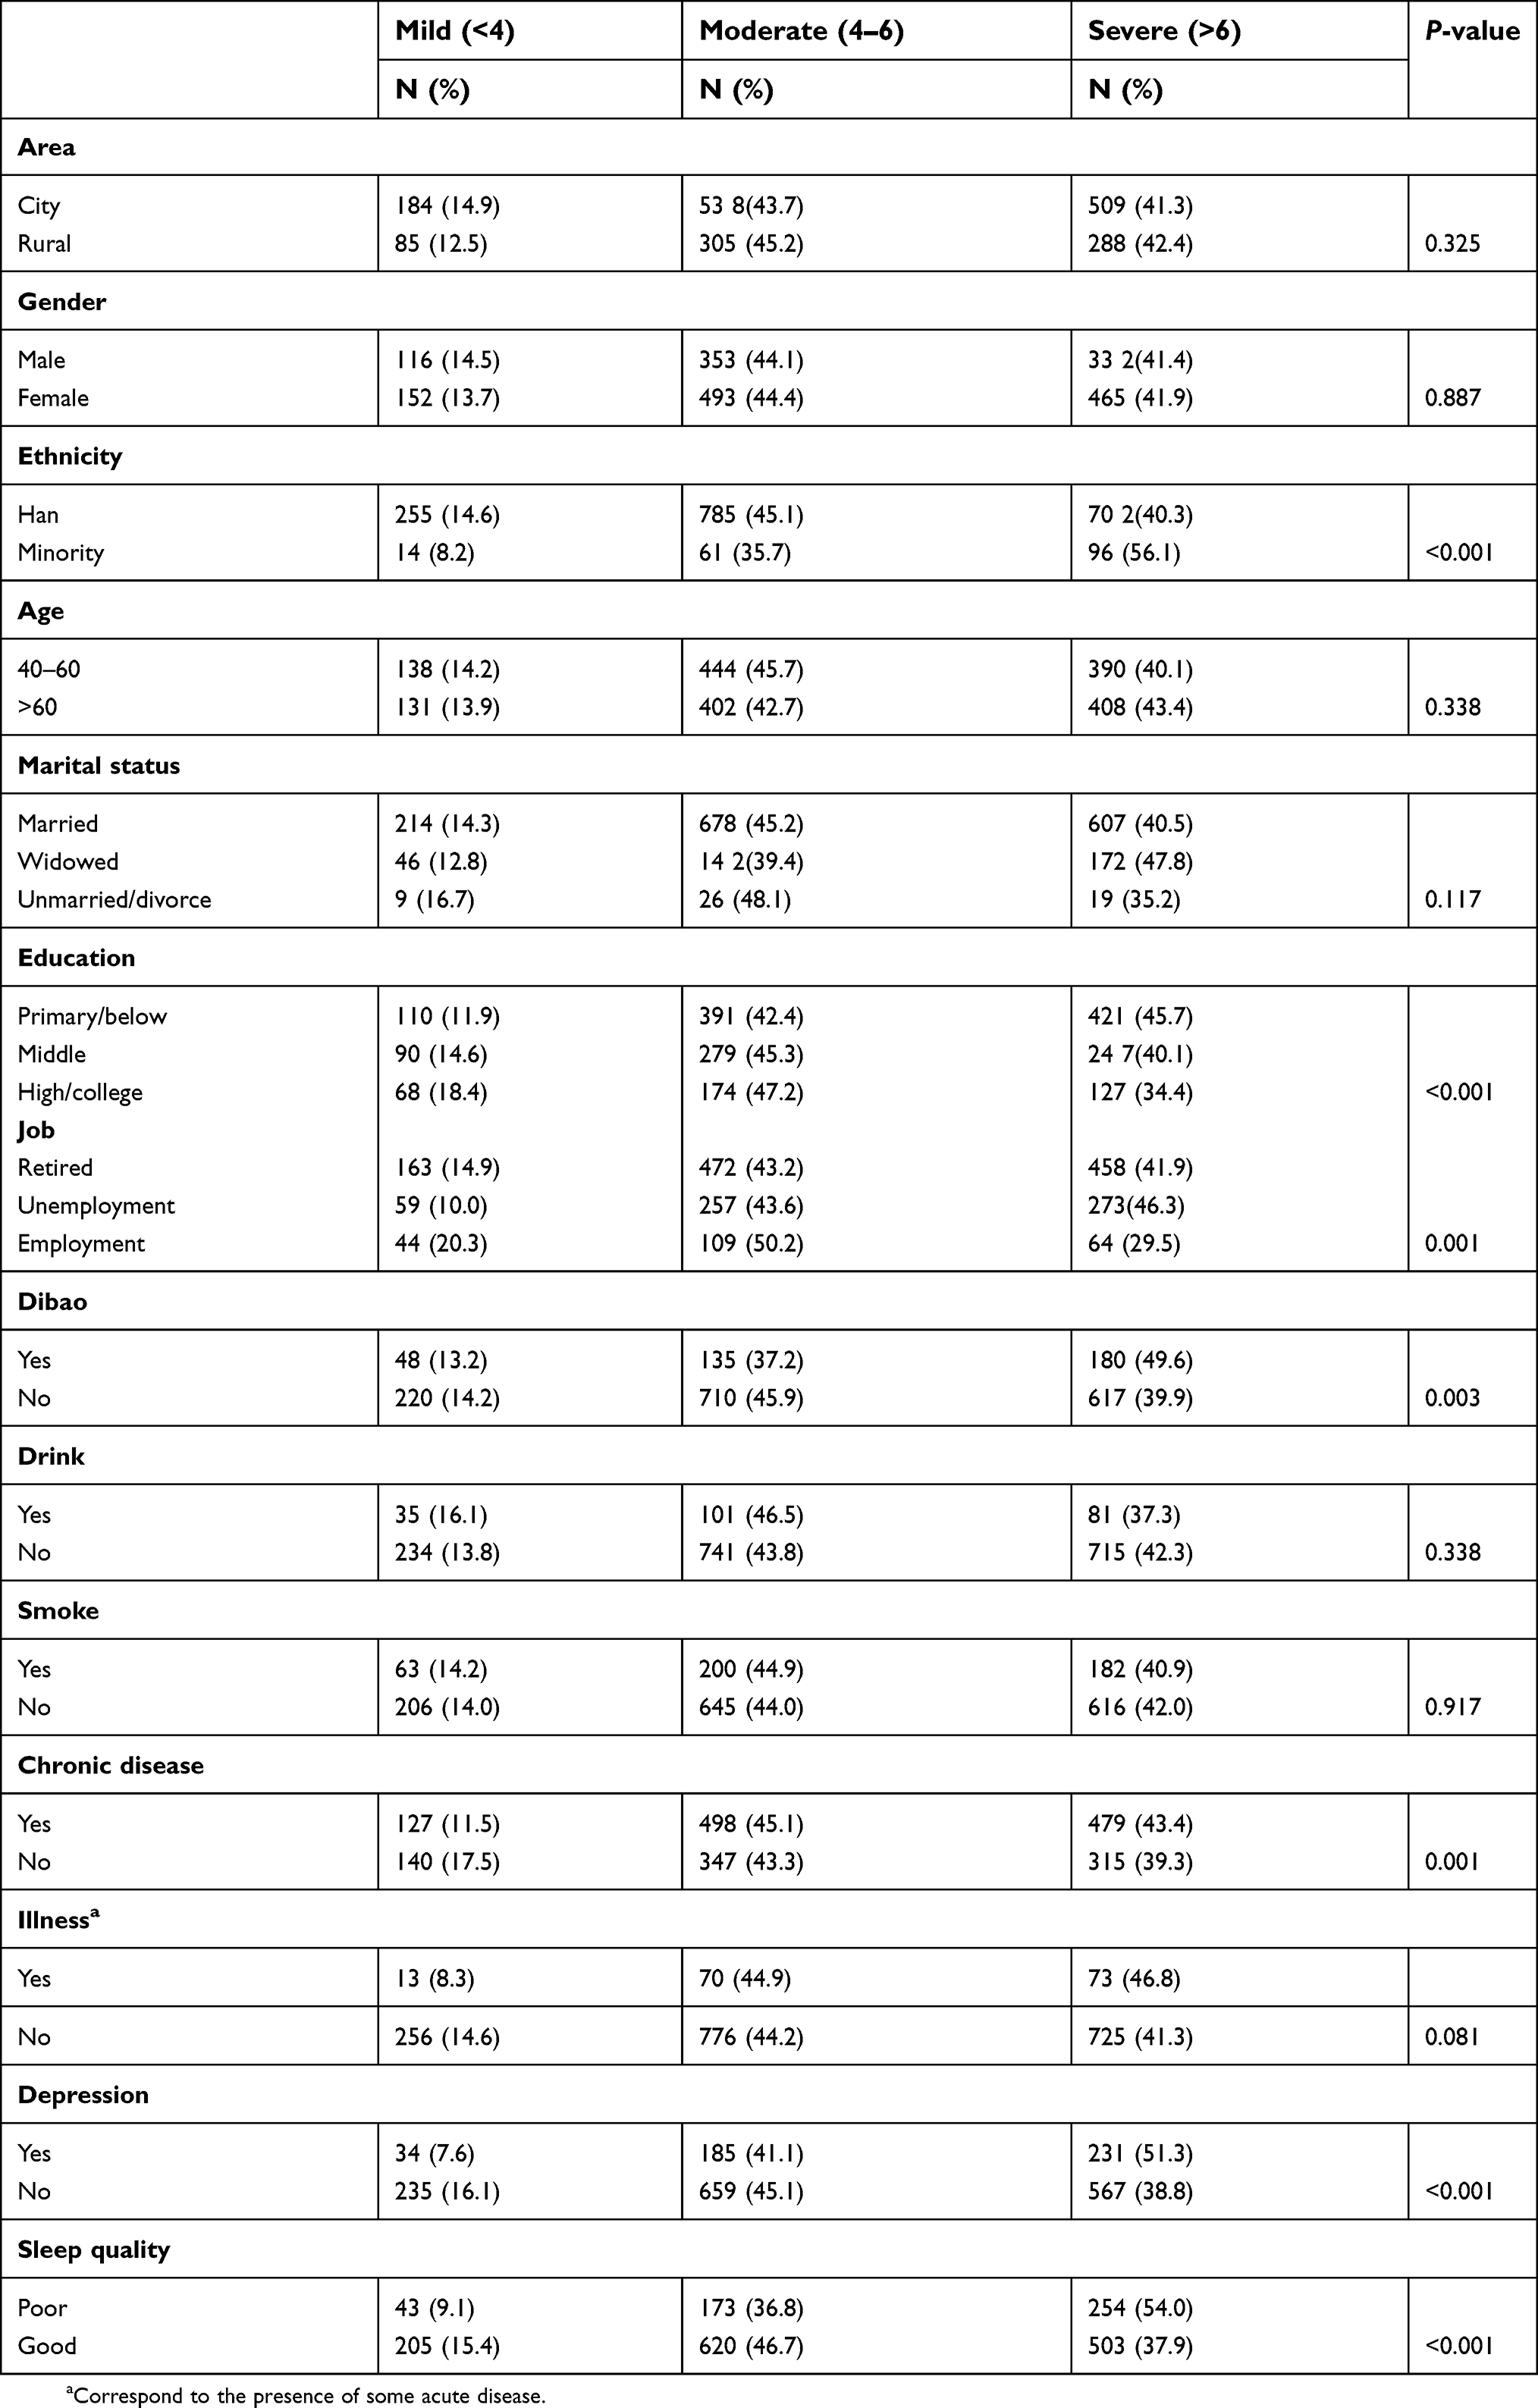 |
Table 4 Compared potential confounding, depression and sleep quality by worst pain intensity with the Chi-square test |
Regression analysis
Table 5 presents the results of the binary logistic regression analysis. After adjusting sociodemographic variables and other potential confounding variables, chronic disease, illness, depression, and poor sleep quality were markedly associated with pain. Chronic disease exhibited the most robust correlation with pain (OR, 2.78; 95% CI, 2.46–3.14). Illness significantly correlated with the risk of pain (OR, 1.47; 95% CI, 1.18–1.84). Compared to those without depression, depression was significantly associated with pain (OR, 2.27; 95% CI, 1.36–3.79). Furthermore, the risk of chronic pain was 1.93 times higher for individuals with poor sleep quality than for those with high sleep quality (95% CI, 1.65–2.25).
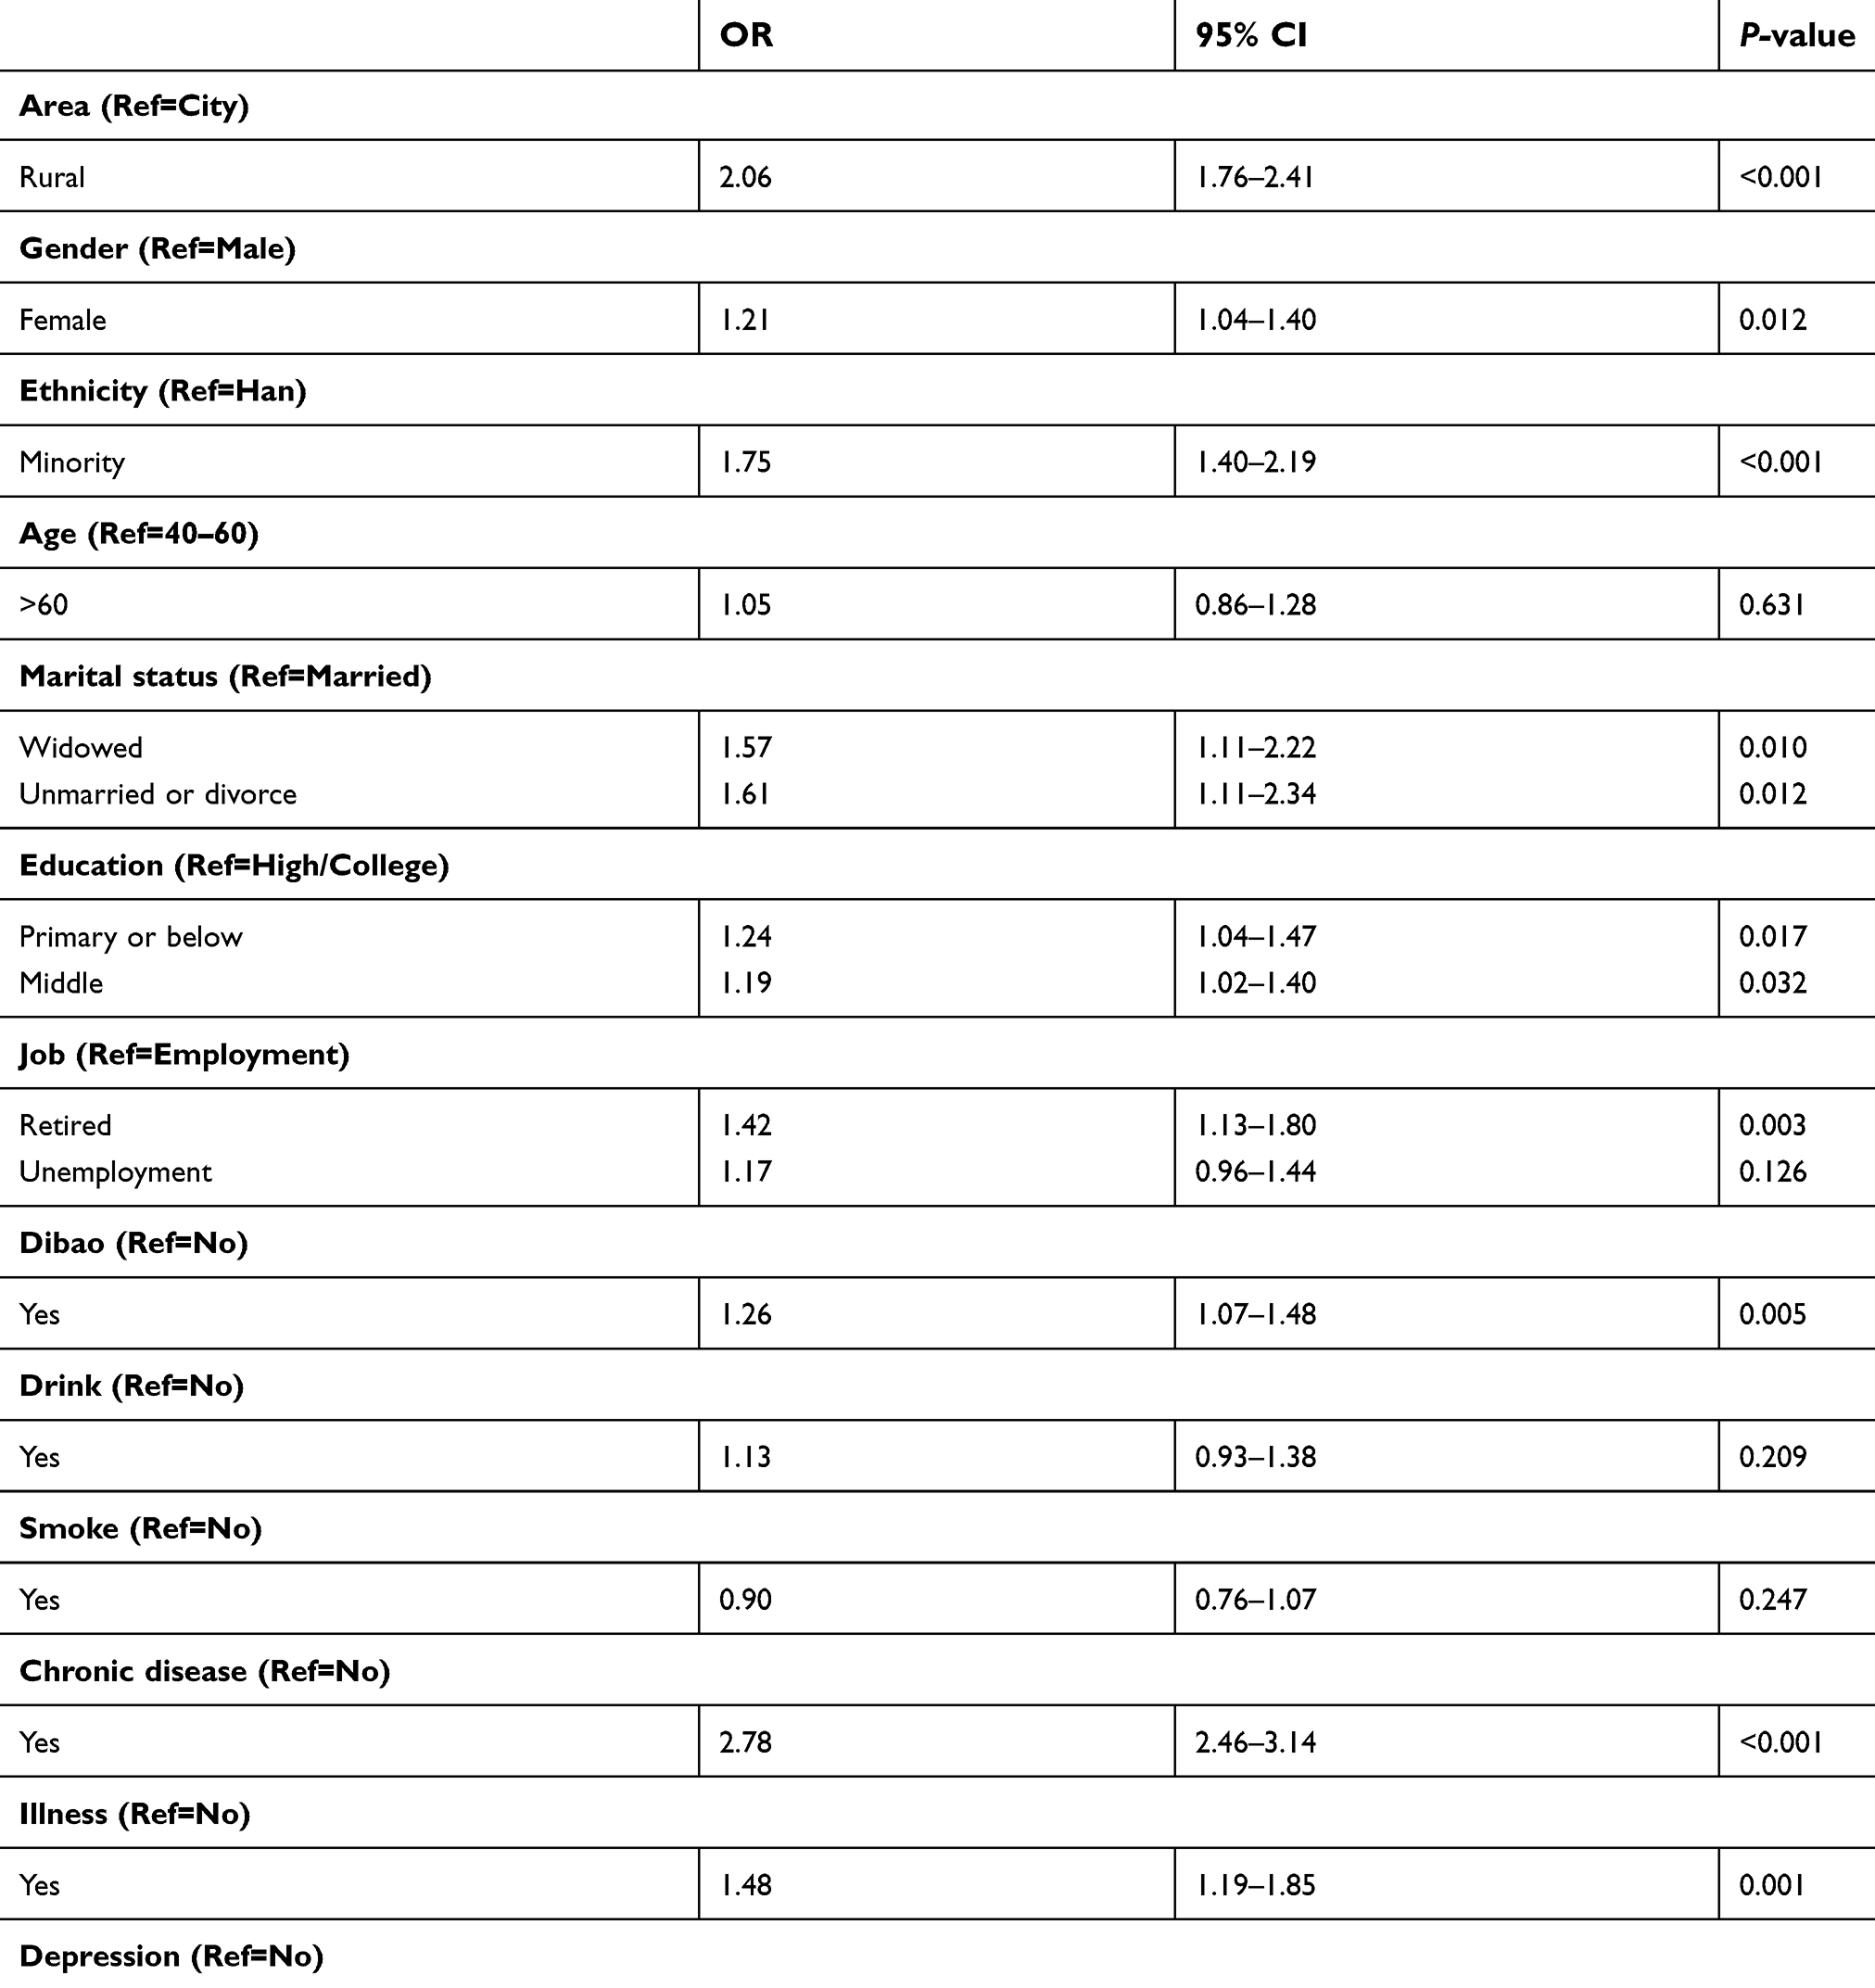 |
Table 5 Binary logistic regression results for pain among community adults in Northwest China (N=7,017) |
Table 6 presents the results of the multinomial logistic regression analysis for pain intensity. Living in rural areas; ethnicity; unemployment status or retirement; positive Dibao status; having a chronic disease, illness, depression and sleep quality markedly correlated with the pain intensity. Adjusting the sociodemographic variables and other potential confounding variables, chronic disease significantly correlated with mild pain (OR, 1.78; 95% CI, 1.34–2.35). In addition, chronic disease, illness, and sleep quality markedly correlated with moderate pain. Chronic disease exhibited the most robust correlation with moderate pain (OR, 3.08; 95% CI, 2.60–3.64), followed by poor sleep quality (OR, 1.60; 95% CI, 1.30–1.98). Illness exhibited the weakest correlation with moderate pain (OR, 1.54; 95% CI, 1.15–2.06). Besides, chronic disease, illness, sleep quality, and depression markedly correlated with severe pain. Of note, chronic disease exhibited the most robust correlation with severe pain (OR, 2.92; 95% CI, 2.45–3.48), followed by poor sleep quality (OR, 2.51; 95% CI, 2.05–3.06). Furthermore, illness significantly correlated with severe pain (OR, 1.63; 95% CI, 1.21–2.18). Compared with those without depression, those with depression were at 1.63 times higher risk of developing severe pain.
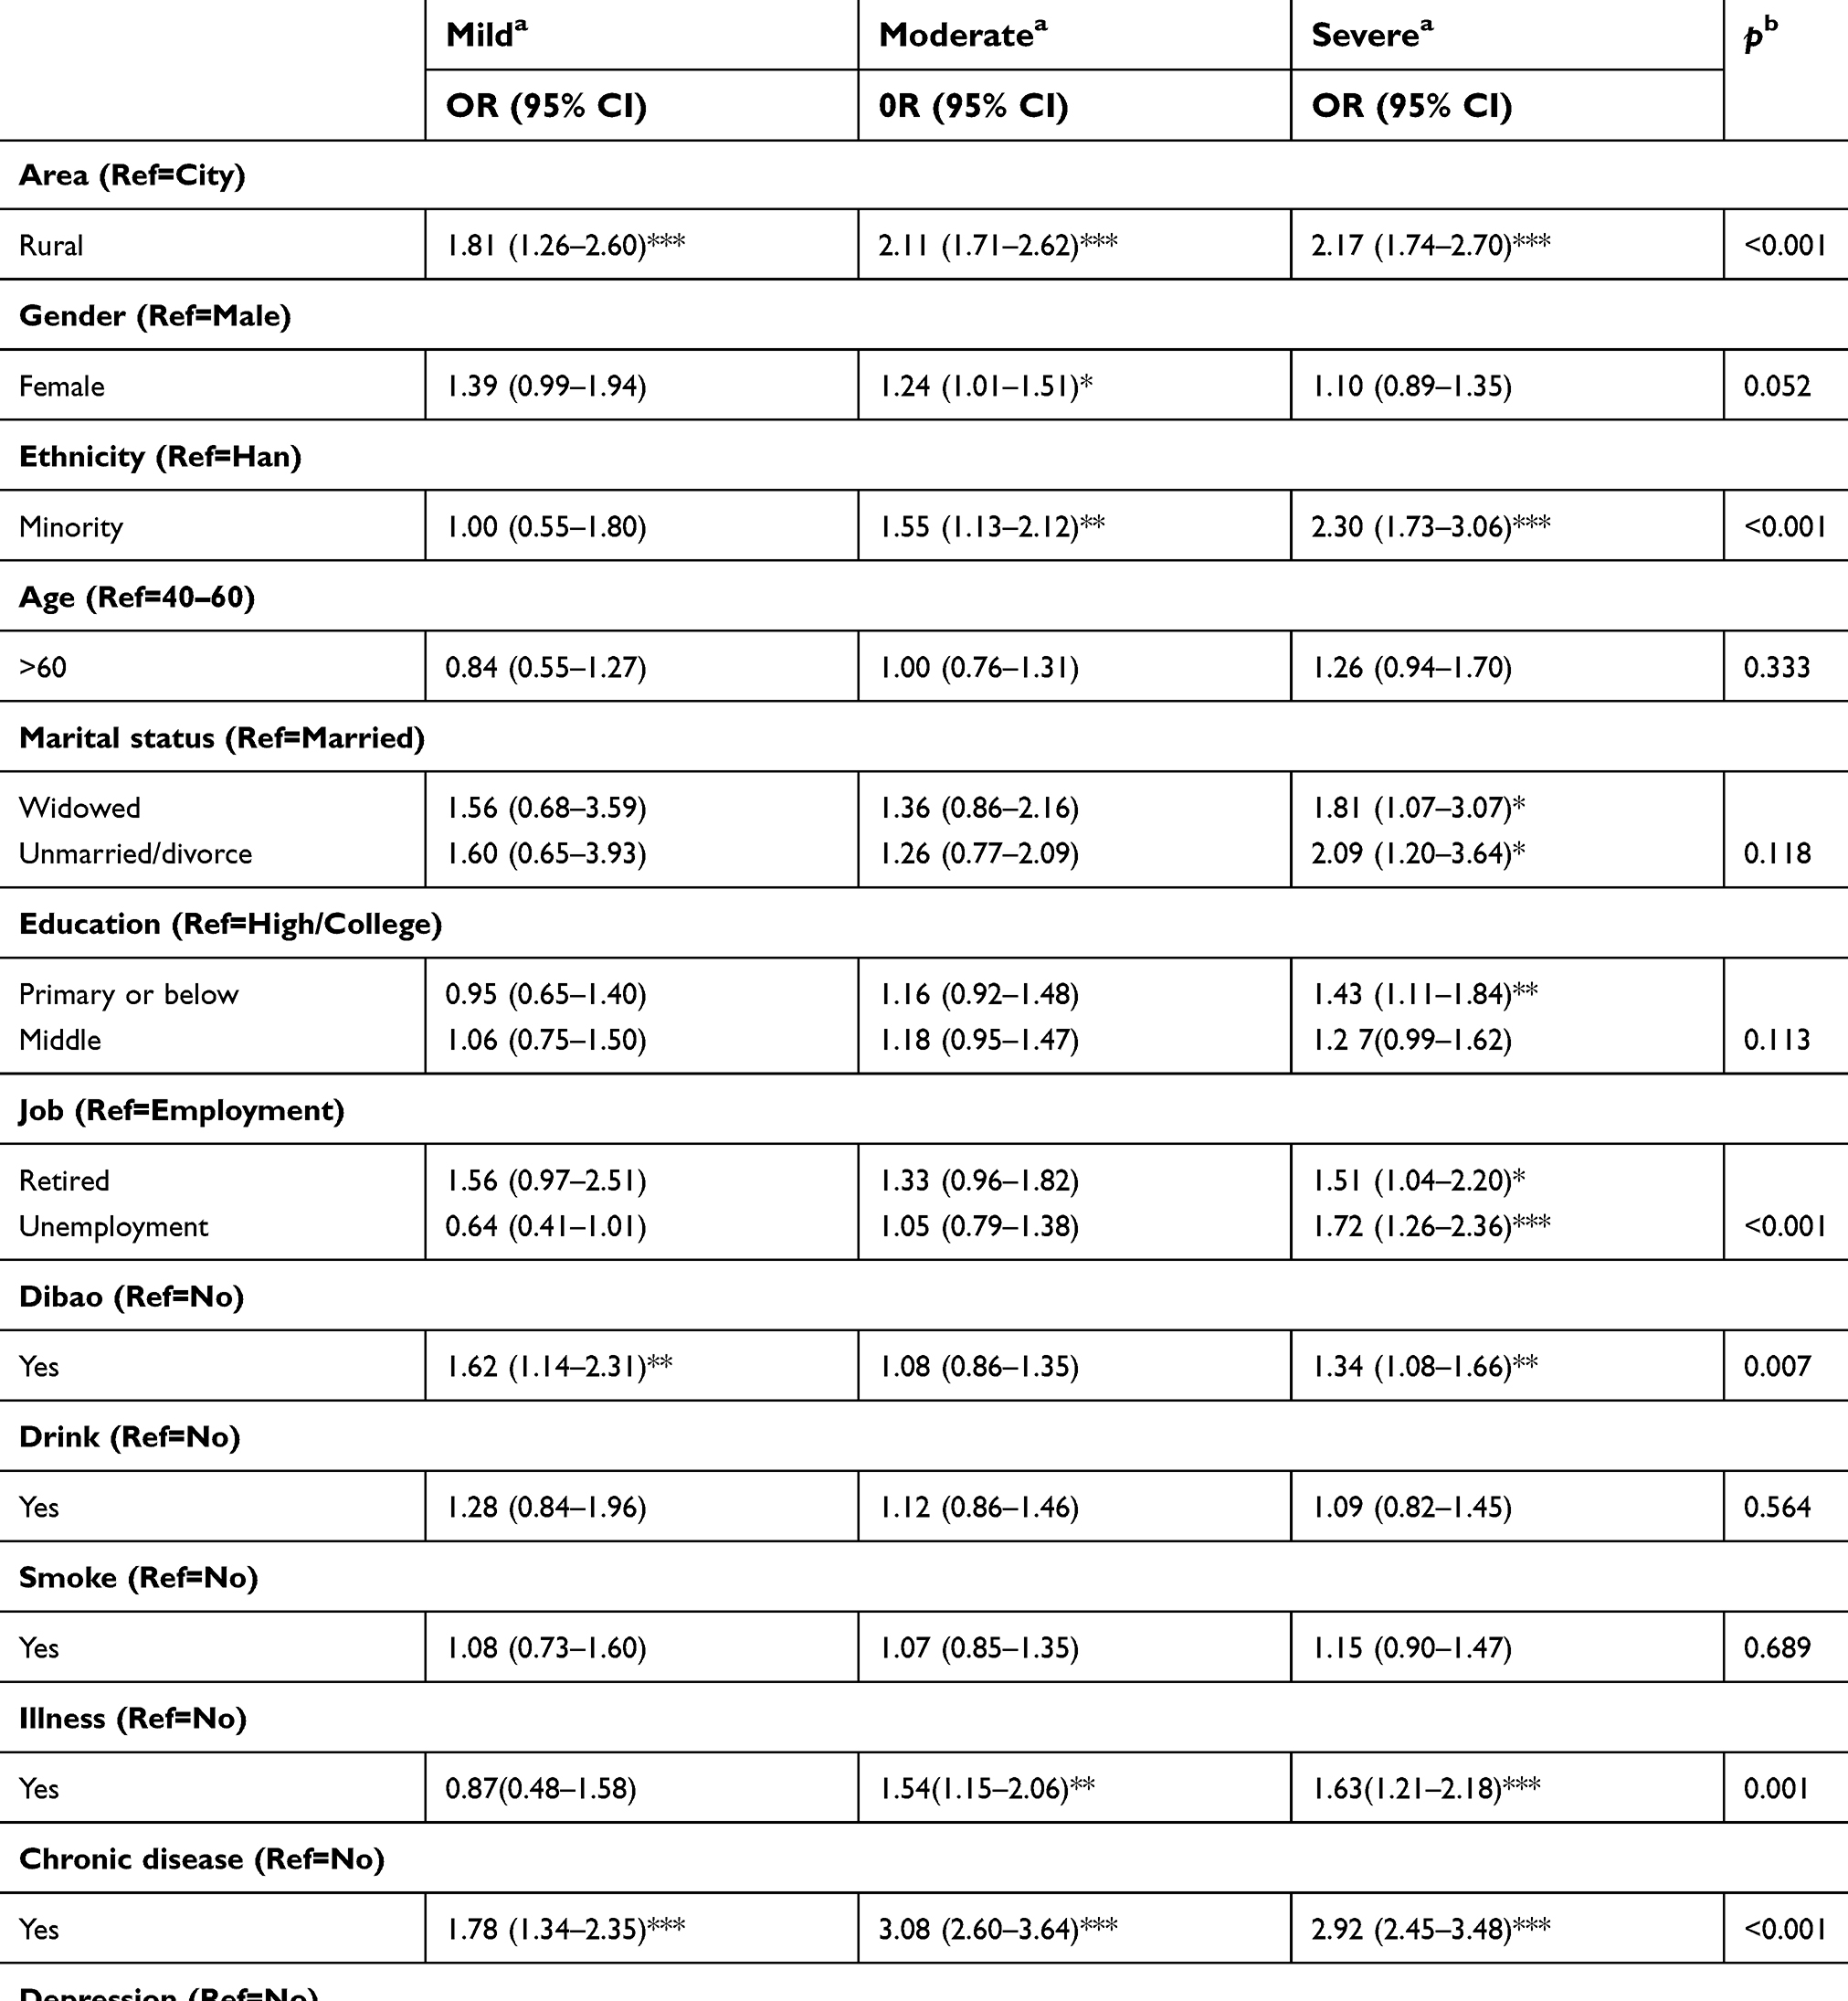 |
Table 6 Multinominal logistic regression predicting pain intensity among community adults in Northwest China (N=7,017) |
Discussion
This study investigated the prevalence and risk factors associated with pain in the general population in northwest China. Our community-based survey revealed that approximately 25.2% of community residents experienced pain. Meanwhile, associations were found between pain and depression, poor sleep quality, chronic disease, and some sociodemographic characteristics.
This study revealed a normal level of pain in northwest China and proposed the existence of health disparities in this process. In this study, approximately 25.2% of participants reported experiencing pain, whereas 41.7% of them rated their worst pain as severe. Because most of our participants were senior residents, who are at a higher risk of developing pain, it could be asserted that pain management in China could be important in the coming aging society. However, this expectation warrants further validation with comparisons. A Taiwanese study reported that the prevalence of chronic pain among the elderly was 42%,38 whereas only 31.4% of participants aged >60 years in this study experienced pain. Meanwhile, a survey conducted in Australia suggested that the prevalence of chronic pain among those aged 65–69 years was 27% for males and 29% for females.9 However, deficiency in health service utilization upon pain disrupted the positive expectation to some extent. In our study, only half of the pain sufferers (approximately 54.4%) received treatment, resulting in the progressive loss of independence and the need for long-term care. Of note, health disparities exist between rural and urban areas. Our study found that 58.79% and 43.78% of urban pain sufferers reported receiving, at least, one drug or physiotherapeutic intervention, compared with 26.96% and 13.47% in rural areas, respectively. Despite a higher risk for pain reported in rural areas, fewer medical services were delivered there. Without more attention to pain in rural areas, the gap between health outcomes and life quality between rural and urban residents is anticipated to widen further. Hence, more efforts are needed to address pain, especially in rural areas.
The risk factors analyses performed in this study found that depression and poor sleep quality were associated with pain, which calls for more attention upon comorbid depression and poor sleep among patients presenting with pain. This finding was consistent with previous studies.38,39 A study reported that pain was more severe in those who faced psychological problems, such as stress or anxiety,39 whereas another study proposed that poor sleep quality correlated with severe pain symptoms.14 Consequently, it is imperative to screen depressive symptoms and poor sleep quality in patients reporting pain, as suggested previously.40 Furthermore, the relationship between depression, sleep quality, and pain is intricate. Depressed individuals and those with poor sleep quality are more likely to develop multiple somatic symptoms and thus pain. Conversely, the presence of pain is predictive of the new onset of depression and insomnia.40,41 Although our cross-sectional data offer limited information about the mechanism of insomnia, depression, and pain, we could assert that health issues such ascomorbid depression and poor sleep quality should be prioritized for pain management. Alternatively, analyses of the influence of pain on daily life aid in providing health care services more effectively. Because pain primarily affects individuals’ daily activities and sleeping, more efforts and service are required to decrease the negative impact of pain on these two items and thus enhance the well-being of individuals effectively.
In this study, the subscale of severe pain revealed that chronic diseases exhibited the most robust correlation, followed by poor sleep quality. Comprehending the correlation between chronic diseases and pain was easy because chronic pain could be a characteristic of some chronic diseases, such as osteoporosis.42 In the clinical setting, pain is related to bodily changes in patients with chronic diseases, which could include sensory, affective, and cognitive changes. Typically, most clinicians operating in pain clinics have noted the necessity of good sleep quality for patients with pain and mental disorders. Previous studies have suggested that sleep medication does not correlate with better sleep or improvement in pain measures as hypothesized.43 This study establishes that sleep quality is highly associated with severe pain but exhibits no effect on mild pain, suggesting that clinicians should assess the grades of pain and treat it appropriately. Comprehensively, when the pain is mild, clinicians should focus on their patients’ illness; when the pain is severe, the treatment for sleep disruption is helpful in pain management. In addition, the correlation between depression and pain is only found in severe pain, indicating that people experiencing severe pain may have more psychological distress.
Finally, this study examined the sociodemographic characteristics of high-risk populations. We found that pain was more prevalent among females and among those who had lower incomes, lower education, poor health status, high level of psychological distress, and were unemployed. In contrast, we observed no marked correlation between age and chronic pain, which corroborates the findings of the study of Hsing’s;38 the reason could be similar effects of pain on different age groups. Consistent with a prior study, unemployed people in this study exhibited a higher prevalence of pain than employed people.9 The correlation between pain and employment could be complicated. For example, unemployed people often experience higher levels of distress, which could lead to unexplained pain. In addition, unemployment could be the outcomes of pain, such as absence due to pain or illness or job change due to pain.9 Hence, people living with the characteristics mentioned above are vulnerable to pain risks and should be prioritized for pain management.
Limitations
This study has several limitations that should be acknowledged. First, based on a cross-sectional survey, we only observed correlated factors with pain; determining the established causal relationship was challenging. In future, the correlation between depression, sleep quality, and pain should be explored using longitudinal studies. Second, more confounding factors, such as medical records and occupation type, should be measured and adjusted in the study. Besides, we did not discuss specific pain situations in this study. Thus, whether risk factors present different correlations with pain at different sites remains unclear, necessitating further investigation to address this uncertainty. Third, the BPI-C, PSQI, and CES-D scales are self-reported screening tools, and not clinical diagnostic methods. Because variance existed in people’s ability to perceive pain, standardized measurements are warranted to manage the pain on a large scale. If possible, the clinical diagnostic pain measurement should be adapted into further studies to validate the existing results and benefit the clinical practice further. Despite these limitations, the findings of this study could benefit the management and intervention service for pain, especially for adults in Northwest China, where health care is underserved.
Conclusion
This study suggests that pain affects a large proportion of Chinese adults, especially those living in rural areas, females, having lower income, with poor physical and mental health, and the unemployed. Furthermore, this study suggests that a high degree of depression and poor sleep quality correlated with pain in this population. Nevertheless, further longitudinal studies are warranted to validate or contrast these findings and to determine the causal relationship.
Ethical approval
This study was approved by the Ethics Committee of the School of Social Development and Public Policy at Beijing Normal University. All participants gave informed consent.
Acknowledgments
The study was supported by The Fundamental Research Funds for the Central Universities, HUST: 2018WKZDJC010. The funders had no role in study design, data collection and analysis, decision to publish, or preparation of the manuscript.
Disclosure
The authors report no conflicts of interest in this work.
References
1. Brown ST, Kirkpatrick MK, Swanson MS, Mckenzie IL. Pain experience of the elderly. Pain Manag Nurs. 2011;12(4):190–196. doi:10.1016/j.pmn.2010.05.004
2. Gureje O, Simon GE, Von Korff M. A cross-national study of the course of persistent pain in primary care. Pain. 2001;92(1–2):195–200. doi:10.1016/S0304-3959(00)00483-8
3. Davison SN, Jhangri GS. The impact of chronic pain on depression, sleep, and the desire to withdraw from dialysis in hemodialysis patients. J Pain Symptom Manage. 2005;30(5):465–473. doi:10.1016/j.jpainsymman.2005.05.013
4. Liu X, Wang L, Stallones L, et al. Back pain among farmers in a northern area of China. Spine. 2012;37:508–514. doi:10.1097/BRS.0b013e318221e83f
5. Huang Y. Current status of pain management in China: an overview. Eur J Pain. 2001;5:67. doi:10.1053/eujp.2001.0283
6. Chen B, Li L, Connor D, et al. Prevalence and characteristics of chronic body pain in China: a national study. Springerplus. 2016;5(1):1–6.
7. Yu S, Yan S, Zhang H, et al. Transdermal fentanyl for management of cancer pain in elderly patients in China. Chin Ger J Clin Oncol. 2004;3(2):85–89. doi:10.1007/s10330-004-0235-y
8. Fang CH, Xue-Qin LI, Shao-Nan YE, Emergency DO. Impact of high quality nursing on negative emotion and pain in patients suffered from emergency traffic accident injury. China Mod Med. 2015;22(33):172–174.
9. Blyth FM, March LM, Brnabic AJM, Jorm LR, Williamson M, Cousins MJ. Chronic pain in Australia: a prevalence study. Pain. 2001;89(2):127–134. doi:10.1016/S0304-3959(00)00355-9
10. Chiu YH, Silman AJ, Macfarlane GJ, et al. Poor sleep and depression are independently associated with a reduced pain threshold. Results of a population based study. Pain. 2005;115(3):316–321. doi:10.1016/j.pain.2005.03.009
11. Von Korff M, Dworkin SF, Le Resche L, Kruger A. An epidemiologic comparison of pain complaints. Pain. 1988;32(2):173–183. doi:10.1016/0304-3959(88)90066-8
12. Bair MJ, Robinson RL, Katon W, Kroenke K. Depression and pain comorbidity: a literature review. Arch Intern Med. 2003;163(20):2433–2445. doi:10.1001/archinte.163.20.2433
13. Parker G, Gladstone G, Chee KT. Depression in the planet’s largest ethnic group: the Chinese. Am J Psychiatry. 2001;158(6):857–864. doi:10.1176/appi.ajp.158.6.857
14. Chung K-F, Tso K-C. Relationship between insomnia and pain in major depressive disorder: a sleep diary and actigraphy study. Sleep Med. 2010;11(8):752–758. doi:10.1016/j.sleep.2009.09.005
15. Smith MT, Haythornthwaite JA. How do sleep disturbance and chronic pain inter-relate? Insights from the longitudinal and cognitive-behavioral clinical trials literature. Sleep Med Rev. 2004;8(2):119–132. doi:10.1016/S1087-0792(03)00044-3
16. Drewes AM, Nielsen KD, Hansen B, Taagholt SJ, Bjerregard K, Svendsen L. A longitudinal study of clinical symptoms and sleep parameters in rheumatoid arthritis. Rheumatology (Oxford). 2000;39(11):1287–1289. doi:10.1093/rheumatology/39.11.1287
17. Gupta A, Silman AJ, Ray D, et al. The role of psychosocial factors in predicting the onset of chronic widespread pain: results from a prospective population-based study. Rheumatology (Oxford). 2007;46(4):666–671. doi:10.1093/rheumatology/kem045
18. Liu W, Liu Y, Twum P, Li S. National equity of health resource allocation in China: data from 2009 to 2013. Int J Equity Health. 2016;15:68–75. doi:10.1186/s12939-016-0357-1
19. Guo J, Liu C, Wang X, Qu Z, Zhang W, Zhang X. Relationships between depression, pain and sleep quality with doctor visits among community-based adults in north-west China. Public Health. 2017;147(6):30–38. doi:10.1016/j.puhe.2017.01.031
20. Wang XS, Mendoza TR, Gao SZ, Cleeland CS. The Chinese version of the Brief Pain Inventory (BPI-C): its development and use in a study of cancer pain. Pain. 1996;67(2):407–416. doi:10.1016/0304-3959(96)03147-8
21. Wang S-J, Rushiti F, Sejdiu X, et al. Survivors of war in northern Kosovo (III): the role of anger and hatred in pain and PTSD and their interactive effects on career outcome, quality of sleep and suicide ideation. Confl Health. 2012;6:1–16. doi:10.1186/1752-1505-6-4
22. Ger LP, Ho ST, Wang JJ, Cherng CH. The prevalence and severity of cancer pain: a study of newly-diagnosed cancer patients in Taiwan. J Pain Symptom Manage. 1998;15(5):285–293. doi:10.1016/S0885-3924(98)00017-7
23. Jensen MP. The validity and reliability of pain measures in adults with cancer. J Pain. 2003;4(1):2–21.
24. Daut RL, Cleeland CS, Flanery RC. Development of the Wisconsin Brief Pain Questionnaire to assess pain in cancer and other diseases. Pain. 1983;17(2):197–210. doi:10.1016/0304-3959(83)90143-4
25. Wang XD. Psychological assessment scale manual. Chin Mental Health J Press. 1999;28:200–202.
26. Zhang J, Wu Z, Fang G, Li J, Han B, Chen Z. Development of the Chinese age norms of CES-D in an urban area. Chin Mental Health J. 2010;24:139–143.
27. Radloff LS. The CES-D scale: a self-report depression scale for research in the general population. Appl Psychol Meas. 1977;1(3):385–401. doi:10.1177/014662167700100306
28. Chiu S, Webber MP, Zeig-Owens R, et al. Validation of the center for epidemiologic studies depression scale in screening for major depressive disorder among retired firefighters exposed to the world trade center disaster. J Affect Disord. 2010;121(3):212–219. doi:10.1016/j.jad.2009.05.028
29. Li Z, Hicks MHR. The CES-D in Chinese American women: construct validity, diagnostic validity for major depression, and cultural response bias. Psychiatry Res. 2010;175(3):227–232. doi:10.1016/j.psychres.2009.03.007
30. Cheng ST, Chan A. The center for epidemiologic studies depression scale in older Chinese: thresholds for long and short forms. Int J Geriatr Psychiatry. 2005;20(5):465–470. doi:10.1002/gps.1314
31. Schulberg HC, Saul M, McClelland M, Ganguli M, Christy W, Frank R. Assessing depression in primary medical and psychiatric practices. Arch Gen Psychiatry. 1985;42(12):1164–1170. doi:10.1001/archpsyc.1985.01790350038008
32. Liu XC. Reliability and validity of Pittsburgh sleep quality index. Chin J Psychiatry. 1996;5:103–107.
33. Tsai PS, Wang SY, Wang MY, et al. Psychometric evaluation of the Chinese version of the Pittsburgh Sleep Quality Index (CPSQI) in primary insomnia and control subjects. Qual Life Res. 2005;14(8):1943–1952. doi:10.1007/s11136-005-4346-x
34. Mahapatra P, George CK, Reddy PS, et al., eds. Costs of poor health habits. Sedentary life style, heavy drinking, and smoking.
35. Ozasa K, Higashi A, Watanabe Y, et al. Characteristics of smoking, drinking, dietary habits, and physical exercise in health behavioral models. Jpn J Public Health. 1995;42:1029–1041.
36. Patterson AL, Gritzner S, Resnick MP, Dobscha SK, Turk DC, Morasco BJ. Smoking cigarettes as a coping strategy for chronic pain is associated with greater pain intensity and poorer pain-related function. J Pain. 2012;13(3):285–292. doi:10.1016/j.jpain.2011.12.010
37. Brennan PL, Schutte KK, Moos RH. Pain and use of alcohol to manage pain: prevalence and 3-year outcomes among older problem and non-problem drinkers. Addiction. 2005;100(6):777–786. doi:10.1111/add.2005.100.issue-6
38. Yu HY, Tang FI, Kuo BI, Yu S. Prevalence, interference, and risk factors for chronic pain among Taiwanese community older people. Pain Manag Nurs. 2006;7(1):2–11. doi:10.1016/j.pmn.2005.12.002
39. Wilson KG, Eriksson MY, D’Eon JL, Mikail SF, Emery PC. Major depression and insomnia in chronic pain. Clin J Pain. 2002;18(2):77–83. doi:10.1097/00002508-200203000-00002
40. Larson SL, Clark MR, Eaton WW. Depressive disorder as a long-term antecedent risk factor for incident back pain: a 13-year follow-up study from the baltimore epidemiological catchment area sample. Psychol Med. 2004;34(2):211–219. doi:10.1017/S0033291703001041
41. McCurry SM, Von Korff M, Vitiello MV, et al. Frequency of comorbid insomnia, pain, and depression in older adults with osteoarthritis: predictors of enrollment in a randomized treatment trial. J Psychosom Res. 2011;71(5):296–299. doi:10.1016/j.jpsychores.2011.05.012
42. Catalano A, Martino G, Morabito N, et al. Pain in osteoporosis: from pathophysiology to therapeutic approach. Drugs Aging. 2017;34(10):1–11. doi:10.1007/s40266-017-0492-4
43. Chapman JB, Lehman CL, Elliott J, Clark JD. Sleep quality and the role of sleep medications for veterans with chronic pain. Pain Med. 2006;7(2):105–114. doi:10.1111/j.1526-4637.2006.00110.x
 © 2019 The Author(s). This work is published and licensed by Dove Medical Press Limited. The full terms of this license are available at https://www.dovepress.com/terms.php and incorporate the Creative Commons Attribution - Non Commercial (unported, v3.0) License.
By accessing the work you hereby accept the Terms. Non-commercial uses of the work are permitted without any further permission from Dove Medical Press Limited, provided the work is properly attributed. For permission for commercial use of this work, please see paragraphs 4.2 and 5 of our Terms.
© 2019 The Author(s). This work is published and licensed by Dove Medical Press Limited. The full terms of this license are available at https://www.dovepress.com/terms.php and incorporate the Creative Commons Attribution - Non Commercial (unported, v3.0) License.
By accessing the work you hereby accept the Terms. Non-commercial uses of the work are permitted without any further permission from Dove Medical Press Limited, provided the work is properly attributed. For permission for commercial use of this work, please see paragraphs 4.2 and 5 of our Terms.