Back to Journals » Advances in Medical Education and Practice » Volume 7
Risk assessment of student performance in the International Foundations of Medicine Clinical Science Examination by the use of statistical modeling
Authors David MC, Eley DS, Schafer J, Davies L
Received 20 September 2016
Accepted for publication 9 October 2016
Published 2 December 2016 Volume 2016:7 Pages 653—660
DOI https://doi.org/10.2147/AMEP.S122841
Checked for plagiarism Yes
Review by Single anonymous peer review
Peer reviewer comments 2
Editor who approved publication: Dr Md Anwarul Azim Majumder
Michael C David,1 Diann S Eley,2 Jennifer Schafer,2 Leo Davies,3
1School of Public Health, 2School of Medicine, The University of Queensland, Herston, QLD, 3Sydney Medical School, The University of Sydney, NSW, Australia
Purpose: The primary aim of this study was to assess the predictive validity of cumulative grade point average (GPA) for performance in the International Foundations of Medicine (IFOM) Clinical Science Examination (CSE). A secondary aim was to develop a strategy for identifying students at risk of performing poorly in the IFOM CSE as determined by the National Board of Medical Examiners’ International Standard of Competence.
Methods: Final year medical students from an Australian university medical school took the IFOM CSE as a formative assessment. Measures included overall IFOM CSE score as the dependent variable, cumulative GPA as the predictor, and the factors age, gender, year of enrollment, international or domestic status of student, and language spoken at home as covariates. Multivariable linear regression was used to measure predictor and covariate effects. Optimal thresholds of risk assessment were based on receiver-operating characteristic (ROC) curves.
Results: Cumulative GPA (nonstandardized regression coefficient [B]: 81.83; 95% confidence interval [CI]: 68.13 to 95.53) and international status (B: –37.40; 95% CI: –57.85 to –16.96) from 427 students were found to be statistically associated with increased IFOM CSE performance. Cumulative GPAs of 5.30 (area under ROC [AROC]: 0.77; 95% CI: 0.72 to 0.82) and 4.90 (AROC: 0.72; 95% CI: 0.66 to 0.78) were identified as being thresholds of significant risk for domestic and international students, respectively.
Conclusion: Using cumulative GPA as a predictor of IFOM CSE performance and accommodating for differences in international status, it is possible to identify students who are at risk of failing to satisfy the National Board of Medical Examiners’ International Standard of Competence.
Keywords: academic performance, benchmarking, medical education, predictive validity, risk assessment, students at risk
Introduction
The term “global village” implies commonalities of human behavior across geographic barriers.1 This phenomenon is manifested in medical education in multiple initiatives,2 including telemedicine,3,4 distance learning technologies,5 and the establishment of satellite campuses.6 There is increasing mobility in the medical workforce, with movement of practitioners and students from one country to another, in addition to the emergence of the “global professional” for reasons related to training opportunities,7 labor demands, and initiatives.8,9
Increasing professional mobility has highlighted the need to develop common educational standards to guide quality improvement efforts and to serve as the components of an accreditation framework for practitioners and medical schools globally, and this is reflected in a number of government-sponsored schemes such as the European Union’s Lifelong Learning Program: 2007–2013 and the Bologna Process.10,11 Pivotal to the success of these schemes is the need to benchmark core medical knowledge. A number of groups have developed measures to test whether standards are being met, as well as to facilitate collaboration in the development of standards.12,13
One such measure developed by the National Board of Medical Examiners (NBME) is the International Foundations of Medicine (IFOM) Clinical Science Examination (CSE). This was first used in 2007 by a consortium of medical schools in Portugal and Italy. It is now used in more than 10 countries and is administered by more than 60 universities.14 In 2015, it was administered to more than 4,400 examinees, a 6-fold increase since its inception.15 Its aims include provision of summative and formative evaluations of students, assisting residency selection, curriculum evaluation, and local or regional certification. Students use the examination to gain familiarity with the United States Medical Licensing Examination (USMLE) process and for access to international residency programs. For medical schools, its usefulness is primarily in terms of curriculum evaluation against an international benchmark and, in some instances, as a barrier examination.16,17
Because of the significant investment by both students and medical schools in the study of medicine,18,19 it is important to identify students at risk of performing poorly. The IFOM CSE offers the chance to compare students with an international benchmark. Early identification of students at risk permits better use of resources aimed at improving their chances of success.
Variables showing a positive association with academic performance on medical assessments such as the IFOM CSE have been identified, with admission tests such as the Medical College Admission Test (MCAT), as well as the undergraduate and postgraduate grade point averages (GPAs), being reported regularly.20–24 Demographic variables including age, gender, and language spoken at home have also been reported as being highly predictive.25,26 However, for age and gender, there is lack of consensus in the literature on the directional effect of these variables; a number of studies have reported that older or female students are more likely to underperform, while others have found the converse.27 Medical students who are native speakers of the language in which they are assessed have consistently been seen to achieve higher assessment scores.28
While many studies in the literature have focused on students at risk identified by the performance in the USMLE Step 2-Clinical Knowledge test, the same is not true for the IFOM CSE. The purpose of this study is to address this issue in 2 connected areas. The first is to determine the cognitive and noncognitive variables that best predict IFOM CSE performance, and the second is to use this result to develop a risk assessment tool to identify students who will perform poorly relative to the NBME’s International Standard of Competence (ISC).29,30
Methods
Subjects and setting
The study design has been described previously.30 Data were collected in November 2012 from a graduating MBBS class at the medical school of The University of Queensland.30 The 4-year MBBS program has 2 phases, each of 2 years, with the latter phase including disciplines of child health, general practice, gynecology, internal medicine, mental health, pediatrics, obstetrics, rural medicine, surgery, as well as the subspecialties in medicine and surgery by means of community placements and hospital-based clinical schools. Ethical approval for the study was obtained from The University of Queensland’s Behavioural and Social Sciences Ethical Review Committee and all of the students provided written consent.
Study variables
In this study, the dependent variable was student performance on the IFOM CSE. Developed by the NBME, the purpose of this examination is to assist medical schools in benchmarking their own students against a global standard, in this case, the minimum passing score for Step 2 of the USMLE (ISC). Specific details of this test have been described elsewhere,15 but briefly, the IFOM CSE consists of 160 multiple-choice questions across 18 domains. Taken in a 4.5 hour testing day, it can be administered electronically or in hard copy. The scores are standardized to a mean of 500, a standard deviation (SD) of 100, and a range from 200 to 800. Unlike the overall IFOM CSE score, domain scores are not standardized to this interval. For these taking the 2012 iteration, the ISC was set at a score of 557.
The independent variable of primary interest in this study was the cumulative grade point average (cGPA), which was obtained by measuring students’ academic performance throughout their MBBS program. For most students, this was a 4-year period, but for some, it was longer due to periods of leave. For each semester course, written and clinical examinations were used to generate a grade on a discrete scale of 1–7, which in turn was averaged to provide a semester GPA on a continuous scale of 1–7. A secondary averaging process was then implemented to produce a cGPA on the same scale as semester GPAs.
Remaining demographic and educational variables that might be potential confounders of the cGPA and IFOM CSE relationship were extracted from admission records. Demographical data included the following: age (<25 years, 25–29 years, and 30+ years); gender; and language spoken at home (English, not English). Educational data included the following: international status (yes, no); MBBS enrollment (pre-2009, 2009, and post-2009); and MBBS entry pathway (graduate, nongraduate). The entry variable refers to the 2 pathways leading to MBBS enrollment at the study university. The second category denotes MBBS students who are provisionally accepted into the program on the proviso that 2 years of an undergraduate degree be completed successfully before entry to medical school. Variation from an MBBS enrollment of 2009 (typical of most students) was due to either failure with a repeat year or transfer from another medical school.
Data analysis
Categorical covariates are presented as counts and proportions, with accompanying summary statistics for IFOM across domain strata. The IFOM CSE scores are reported in the form of median (interquartile range [IQR]) and mean (SD), as are the cGPA scores. These continuous variables are also summarized graphically using box plots. Linearity between cGPA and IFOM CSE was assessed by a lowess (robust locally weighted linear regression) curve.31 To assess the independent effect of each variable on IFOM CSE, backward elimination linear regression was performed. All variables found to be significantly associated (P<0.10) with IFOM CSE by preliminary univariable analyses were used in this iterative procedure. Variables were eliminated in a stepwise fashion based on an exit probability of 0.20. Due to potential confounding, age and gender were forced into the final model, irrespective of statistical significance. Interactions between retained variables were assessed by likelihood ratio tests (P<0.10), and multicollinearity was investigated by the calculation of variance inflation factors (VIFs). The predictive ability of the final multivariable model and the explanatory value of the cGPA were assessed using adjusted R-squared statistics. All observations were assessed for excessive influence by the calculation of DFBETA statistics.32 Modeling results are reported as unstandardized and standardized regression coefficients, with accompanying 95% confidence intervals (CIs). Receiver-operating characteristic (ROC) analysis was then used to measure the discriminative utility of cGPA to identify students at risk of underachieving on the IFOM CSE, as specified by the ISC. These analyses were facilitated by first performing logistic regression modeling. All statistical analyses were conducted using Stata, version 12.0 (StataCorp LP, College Station, TX, USA).
Results
In total, 428 students were involved in the study. Students were more likely to be aged between 25 and 29 years (49.41%), to be male (57.71%), and to have achieved a GPA of 5.00–5.99 (on a 7-point scale) in their final MBBS semester (46.60%) (Table 1). Students were predominately domestic (70.96%), spoke English at home (85.28%), and had enrolled in 2009 (85.95%). Mean IFOM CSE scores ranged from a high of 569 (SD: 104) for students with a final semester GPA of at least 6.00 to a low of 460 (SD: 86) for students who had enrolled post-2009. Missing data were negligible, with covariate data (ie, age) collected on all but one student.
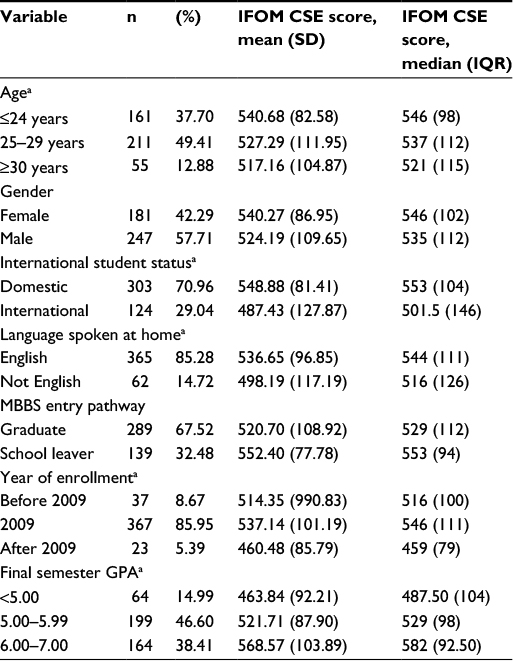 | Table 1 Characteristics of study subjects (n=428) Note: aData missing for 1 student. Abbreviations: CSE, Clinical Science Examination; GPA, grade point average; IFOM, International Foundations of Medicine; IQR, interquartile range; SD, standard deviation. |
The distributions of the dependent variable, namely, IFOM CSE performance, and the primary independent variable of interest, namely, cGPA, are presented by box plots in Figures 1 and 2, respectively. IFOM CSE score varied from 208 to 779 (median: 541; IQR: 110), while the cGPA varied from 3.0 to 6.82 (median: 5.21; IQR: 0.79). The data were screened for outliers. Using box plot analyses, 3 cGPA and 21 IFOM CSE outliers were detected (defined as data points that are more than 1.5 IQRs from the rest of the sample). Of the latter, most outliers were low scores, with 19 students having an IFOM CSE score of less than 300 and 2 having an IFOM CSE score of 760. Removing these participants, however, did not alter any of the findings. Consequently, all reported results are based on the complete data set.
 | Figure 1 Box plot of IFOM CSE scores of students (n=428). Abbreviations: CSE, Clinical Science Examination; IFOM, International Foundations of Medicine. |
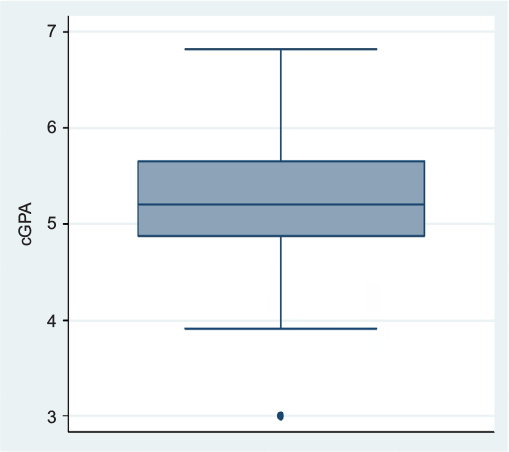 | Figure 2 Box plot of cGPA scores of students (n=428). Abbreviation: cGPA, cumulative grade point average. |
Due to sample size, as well as the similarity between IFOM CSE mean and median (ie, less than 2% difference), regression estimates are not unduly biased, even though the normality assumption was not strictly satisfied as tested by the Shapiro–Francia W statistic (W=0.94; P<0.01).33,34
As unscaled median scores across the 18 domains varied from a low of 487 (IQR: 114) for Immunologic and Blood Disorders to a high of 563 (IQR: 130) for Pediatrics (Figure 3). Scores for Diseases of the Nervous System and Special Senses (median: 536; IQR: 98) showed the least variation, and scores on Gynecologic and Obstetric Disorders (median: 544; IQR: 202) showed the most variation.
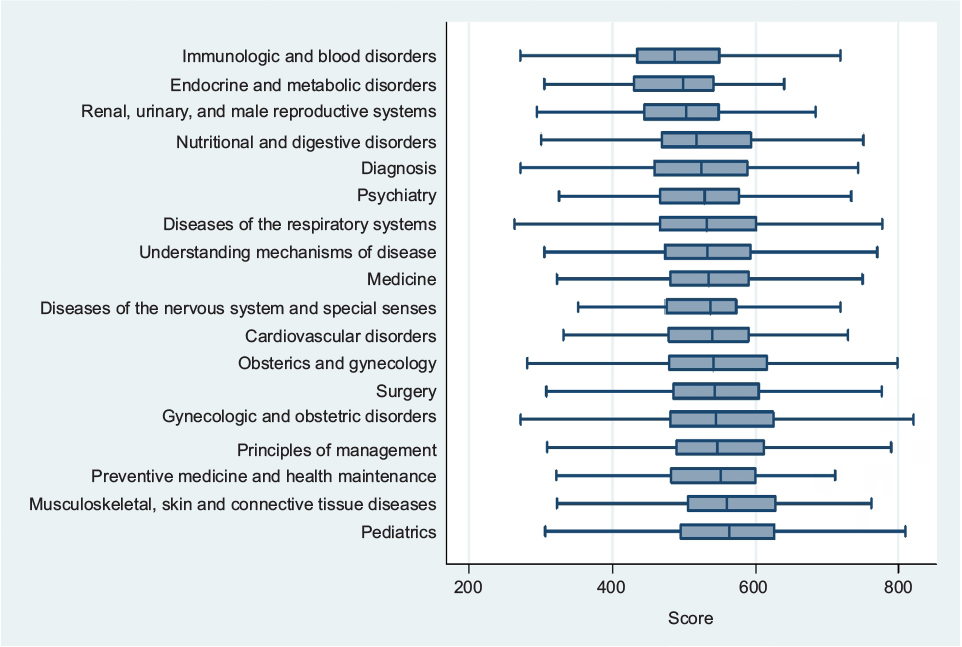 | Figure 3 Box plots for IFOM CSE domain scores of students (n=428). Abbreviations: CSE, Clinical Science Examination; IFOM, International Foundations of Medicine. |
Justification for modeling the IFOM data by linear regression is seen in Figure 4, wherein the lowess curve for the cGPA–IFOM relationship only deviates from the line of best fit for cGPA scores less than 4, providing evidence that the assumption of linearity has not been substantially violated.35
 | Figure 4 IFOM CSE scores plotted against cGPA scores with line of best fit (red curve) and lowess fit (green curve) for students (n=428). Abbreviations: cGPA, cumulative grade point average; CSE, Clinical Science Examination; IFOM, International Foundations of Medicine; lowess, robust locally weighted linear regression. |
The results of the linear regression analyses are presented in Table 2. In addition to cGPA being strongly predictive of IFOM (nonstandardized regression coefficient [B]: 89.16; 95% CI: 75.85 to 102.47; P<0.01; adjusted R2: 29.30%), univariable analyses also identified year of MBBS enrollment, international student status, and language spoken at home as being significantly associated with IFOM CSE. Subsequently, a stepwise backward elimination procedure resulted in cGPA, year of MBBS enrollment, international status, language, age, and gender being incorporated into the multivariable linear regression model; the latter 2 being forced. All 2-way interactions were nonsignificant, and all VIFs were lower than 2, suggesting that multicollinearity was not a concern in interpreting the results.36 After adjustment for model covariates, cGPA continued to be highly predictive of IFOM (B: 81.83; 95% CI: 68.13 to 95.53), as was International student status (B: –37.40; 95% CI: –57.85 to –16.96). Neither language, nor year of enrollment remained significant in the multivariable model. Comparison of the beta-coefficient of 0.50 for cGPA with the beta-coefficient of –0.17 for International student status indicated that the unique contribution of cGPA as a predictor of IFOM CSE was more than twice that of International student status. No DFBETA exceeded 1,37 which suggests that no regression coefficient estimate was excessively influenced by any individual observation. Further evidence of the predictive strength of cCPA can be seen in comparing adjusted-R2 values. While 29.30% of the variation in IFOM CSE was attributable to cGPA, only 2.88% was due to the remaining covariates.
 | Table 2 Univariable and multivariable linear regression analyses for variables associated with IFOM CSE scores from 428 students at the University of Queensland in 2012 Notes: Adjusted R2=29.30% (for univariable model with cGPA); adjusted R2=32.18 (for multivariable model). Abbreviations: β, standardized regression (beta) coefficient; B, nonstandardized regression coefficient; cGPA, cumulative grade point average; CI, confidence interval; CSE, Clinical Science Examination; IFOM, International Foundations of Medicine; R2, coefficient of determination; Ref, reference value. |
Logistic model building aims to include important variables and, at the same time, create a parsimonious and valid model. In our model, we used cGPA, the strongest predictor of IFOM CSE, to calculate area under receiver-operating characteristic curves (AROCs), as reported in Table 3. We present AROCs separately for domestic and international students, as International status was the second variable that reached statistical significance in our multivariable analysis (Table 2). Because of the large number of potential thresholds associated with cGPA, a cross sample of values that can be used in establishing a single threshold is shown in Table 3. cGPA thresholds that produced maximal discrimination between students likely to achieve ICS and those not were found to be 5.30 for domestic students (AROC: 0.77; 95% CI: 0.72 to 0.82) and 4.90 for international students (AROC: 0.72; 95% CI: 0.66 to 0.78).
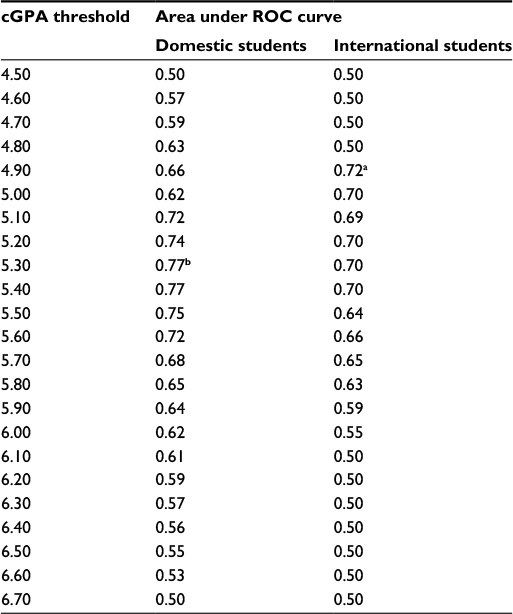 | Table 3 Area under ROC curves for varying cGPA thresholds for domestic and international students Notes: a95% CI: 0.66–0.78; b95% CI: 0.72–0.82. Abbreviations: CI, confidence interval; cGPA, cumulative grade point average; ROC, receiver-operating characteristic. |
Discussion
Principal findings
We examined the absolute and relative contributions of cGPA, final semester GPA, age, gender, year of MBBS enrollment, MBBS entry pathway, international student status, and language spoken at home in predicting students’ performance on the IFOM CSE. Based on the outcomes from the multivariable linear regression, we identified 2 variables, cGPA and international status, as being significantly associated with IFOM performance. Of the 2, the former was dominant, accounting for nearly one-third of the variance in IFOM CSE. A third variable (language spoken at home) had a near-significant association. With significant predictor variables identified, an ROC analysis found that international students had a lower threshold of risk than domestic students.
Comparison with previous literature
There is a large literature examining the prediction of academic performance of medical students on the USMLE Step 2 through the use of multivariable regression modeling.21,23,26,27,38–45 In comparison, only Wilkinson et al30 have reported on the IFOM CSE. Our study used a multivariable regression approach to calculate independent effects, while Wilkinson et al30 used a correlational analysis approach and thus did not adjust for possible confounding by model covariates.30 Our results are consistent with the USMLE-related studies in that cGPA and international student status were found to be strongly predictive of IFOM CSE.21,23,26,30,39–41 Though not reaching statistical significance, we also found, similar to De Champlain et al39 and Glaser et al,40 that students who spoke English at home performed better. Unlike a number of earlier studies, we did not detect significant effects by age,23,42 gender,26,27,38,44,45 or year of admission.23
Limitations and strengths
Our study has strengths, which include its originality. To our knowledge, no prior study has developed a multivariable predictive model for IFOM performance or analyzed a subsequent risk assessment tool to identify students expected to not meet the IFOM ISC. A further strength of this study was its relatively large size. A sample size of more than 400 facilitated the examination of a variety of potential variables related to IFOM CSE. This was substantiated by a post hoc power analysis,46 which indicated that the study was sufficiently powered to detect a significant association between cGPA and IFOM CSE, when adjusted for model covariates.
Some caveats need to be taken into account when interpreting our results. First, it was conducted at a single medical school, and the results may not be generalizable to other institutions. The strongest predictor of IFOM CSE performance was cGPA, but this measure is based on the MBBS course performance and examination scores at our medical school, and other schools may award grades and test scores differently. Second, we used our original sample to test the accuracy of the model, so it is possible our study overestimates the ability of the model to correctly classify a new observation. Third, as with all low-stake examinations, our estimates are subject to biases generated by lack of examinee motivation and low effort, rather than the hurrying-to-finish strategy used by examinees in a high-stakes context, such as the USMLE.47 In defence of this, removal of low-scoring outliers did not change the association. Fourth, by using only IFOM CSE total scores, this study provides no information on the predictive accuracy of IFOM CSE domain scores. Lastly, there is potential for residual confounding,48 due to unmeasured variables such as the scores on the Undergraduate Medical and Health Professions Admission Test (UMAT) and the Graduate Australian Medical School Admissions Test (GAMSAT). These were not available and were not included in the modeling.
Conclusion and recommendations
We conclude that cGPA is strongly correlated with scores on the IFOM CSE. This strong correlation suggests that the cGPA will have a high predictive value in identifying students at risk of poor IFOM CSE performance. Future research should determine the degree to which cGPA scores early in a student’s medical course predict subsequent outcomes, such as total IFOM CSE scores, specifically IFOM CSE domains. This study was necessarily limited to certain variables that were mostly sociodemographic, and other measures might have improved its predictive value. Future research should incorporate other measures and should broaden the focus from a single institution to include many institutions. Further study is needed to determine whether educational interventions to improve IFOM CSE scores can lead to improvements in subsequent test performance and other outcomes.
Disclosure
The authors report no conflicts of interest in this work.
References
Green DG, editor. Of Ants and Men. The Unexpected Side Effects of Complexity in Society. Berlin: Springer-Verlag; 2014:195–209. | ||
De Champlain AF, Grabovsky I, Scoles PV, et al. Collecting evidence of content validity for the International Foundations of Medicine Examination: an expert-based judgmental approach. Teach Learn Med. 2011;23(2):144–147. | ||
Malasanos TH, Burlingame JA, Muir A. Advances in telemedicine in the 21st century. Adv Pediatr. 2004;51:131–169. | ||
Ruiz JG, Mintzer MJ, Leipzig RM. The impact of e-learning in medical education. Acad Med. 2006;81(3):207–212. | ||
O’Riordan M, Riain AN. Distance learning: linking CME and quality improvement. Med Teach. 2004;26:559–564. | ||
Kondro W. Eleven satellite campuses enter orbit of Canadian medical education. CMAJ. 2006;175:461–462. | ||
Schwartz HM. States Versus Markets: The Emergence of a Global Economy. Basingstoke: Macmillan; 2000. | ||
Iredale R. The migration of professionals: theories and typologies. Int Migr. 2001;39(5):7–26. | ||
Leinster S. Assessment in medical training. Lancet. 2003;362(9397):1770. | ||
Dehmel A. Making a European area of lifelong learning a reality? Some critical reflections on the European Union’s lifelong learning policies. Comp Educ. 2006;42(1):49–62. | ||
Keeling R. The Bologna Process and the Lisbon Research Agenda: the European Commission’s expanding role in higher education discourse. Eur J Educ. 2006;41(2):203–223. | ||
Dauphinee WD, Wood-Dauphinee S. The need for evidence in medical education: the development of best evidence medical education as an opportunity to inform, guide, and sustain medical education research. Acad Med. 2004;79(10):925–930. | ||
Wilkinson TJ, Hudson JN, Mccoll GJ, Hu WC, Jolly BC, Schuwirth LW. Medical school bench-marking – from tools to programmes. Med Teach. 2015;37(2):146–152. | ||
NBME [webpage on the Internet]. International Foundations of Medicine. 2014. Available from: http://www.nbme.org/Schools/iFoM/index.html. Accessed July 12, 2014. | ||
NBME. 2015 NBME Annual Report; 2015. Available from: http://www.nbme. org/PDF/Publications/2015Annual-Report.pdf. Accessed December 8, 2015. | ||
Holtzman KZ, Swanson DB, Ouyang W, Dillon GF, Boulet JR. International variation in performance by clinical discipline and task on the United States Medical Licensing Examination Step 2 Clinical Knowledge component. Acad Med. 2014;89(11):1558–1562. | ||
Wilkinson D. A new paradigm for assessment of learning outcomes among Australian medical students: in the best interest of all medical students. Aust Med Stud J. 2014;4(2):45–47. | ||
Phillips JP. We must make the cost of medical education reasonable for everyone. Acad Med. 2013;88(10):1404. | ||
Varkey P, Murad MH, Braun C, Grall KJ, Saoji V. A review of cost-effectiveness, cost-containment and economics curricula in graduate medical education. J Eval Clin Pract. 2010;16(6):1055–1062. | ||
Basco WT, Way DP, Gilbert GE, Hudson A. Undergraduate institutional MCAT scores as predictors of USMLE step 1 performance. Acad Med. 2002;77(10):S13–S16. | ||
Donnon T, Paolucci EO, Violato C. The predictive validity of the MCAT for medical school performance and medical board licensing examinations: a meta-analysis of the published research. Acad Med. 2007;82:100–106. | ||
Jones RF, Thomae-Forgues M. Validity of the MCAT in predicting performance in the first two years of medical school. J Med Educ. 1984;59:455–464. | ||
Kleshenki J, Sadik AK, Shapiro JI, Gold JP. Impact of preadmission variables on USMLE Step 1 and Step 2 performance. Adv Health Sci Educ. 2009;14:69–78. | ||
Mitchell K, Haynes R, Koenig JA. Assessing the validity of the updated Medical College Admission Test. Acad Med. 1994;69:394–401. | ||
Haist SA, Wilson JF, Elam CL, Blue AV, Fosson SE. The effect of gender and age on medical school performance: an important interaction. Adv Health Sci Educ. 2000;5(3):197–205. | ||
Veloski JJ, Callahan CA, Xu G, Hojat M, Nash DB. Prediction of students’ performance on licensing examinations using age, race, sex, undergraduate GPAs, and MCAT scores. Acad Med. 2000;75(10):S28–S30. | ||
Swygert KA, Cuddy MM, van Zanten M, Haist SA, Jobe AC. Gender differences in examinee performance on the Step 2 Clinical Skills® data gathering (DG) and patient note (PN) components. Adv Health Sci Educ. 2012;17(4):557–571. | ||
Van Zanten M, Boulet JR, McKinley DW. Correlates of performance of the ECFMG Clinical Skills Assessment: influences of candidate characteristics on performance. Acad Med. 2003;78(10):S72–S74. | ||
Edwards D, Wilkinson D, Canny BJ, Pearce J, Coates H. Developing outcomes assessments for collaborative, cross-institutional benchmarking: progress of the Australian Medical Assessment Collaboration. Med Teach. 2014;36(2):139–147. | ||
Wilkinson D, Schafer J, Hewett D, Eley D, Swanson D. Global benchmarking of medical student learning outcomes? Implementation and pilot results of the International Foundations of Medicine Clinical Sciences Exam at The University of Queensland, Australia. Med Teach. 2013;36(1):62–67. | ||
Cleveland WS. Robust locally weighted fitting and smoothing scatterplots. J Am Stat Assoc. 1979;74:829–836. | ||
Belsley DA, Kuh E, Welsh RE. Regression Diagnostics: Identifying Influential Data and Sources of Collinearity. New York: John Wiley & Sons; 1980. | ||
Lumley T, Diehr P, Emerson S, Chen L. The importance of the normality assumption in large public health data sets. Annu Rev Public Health. 2002;23:151–169. | ||
Royston P. A single method for evaluating the Shapiro-Francia W test for non-normality. Statistician. 1983;32:297–300. | ||
Vittinghoff E, Glidden DV, Shiboski SC, McCulloch CE. Regression Methods in Biostatistics: Linear, Logistic, Survival, and Repeated Measures Models. Berlin: Springer Science & Business Media; 2011. | ||
Mansfield ER, Helms BP. Detecting multicollinearity. Am Stat. 1982;36(3a):158–160. | ||
Bollen KA, Jackman R. Regression diagnostics: an expository treatment of outliers and influential cases. In: Fox J, Long JS, editors. Modern Methods of Data Analysis. Newbury Park, CA: Sage Publications; 1990:257–291. | ||
Case SM, Becker DF, Swanson DB. Performances of men and women on NBME Part I and Part II: the more things change. Acad Med. 1993;68(10):S25–S27. | ||
De Champlain AF, Swygert K, Swanson DB, Boulet JR. Assessing the underlying structure of the United States Medical Licensing Examination Step 2 Test of Clinical Skills using confirmatory factor analysis. Acad Med. 2006;81(10):S17–S20. | ||
Glaser K, Hojat M, Veloski JJ, Blacklow RS, Goepp CE. Science, verbal, or quantitative skills: which is the most important predictor of physician competence? Educ Psychol Meas. 1992;52:395–406. | ||
Kasuya RT, Naguwa GS, Guerrero AP, et al. USMLE performances in a predominantly Asian and Pacific Islander population of medical students in a problem-based learning curriculum. Acad Med. 2003;78(5):483–490. | ||
Ogunyemi D, Taylor-Harris DS. Factors that correlate with the US Medical Licensure Examination Step-2 scores in a diverse medical student population. J Natl Med Assoc. 2005;97(9):1258–1262. | ||
Ripkey DR, Case SM, Swanson DB, Melnick LT, Bowles N, Gary E. Performance of examinees from foreign schools on the clinical science component of the United States Medical Licensing Examination. In: Scherpbier A, van der Vleuten C, Rethans J, van der Steeg A, editors. Advances in Medical Education. Dordrecht: Kluwer Academic Publishers; 1997:175–178. | ||
Simon SR, Bui A, Day S, Berti D. The relationship between second-year medical students’ OSCE scores and USMLE Step 2 scores. J Eval Clin Pract. 2007;13(6):901–905. | ||
Swanson DB, Case SM, Ripkey DR, Melnick DE, Bowles LT, Gary NE. Performance of examinees from foreign schools on the basic science component of the United States Medical Licensing Examination. In: Scherpbier A, van der Vleuten C, Rethans J, van der Steeg A, editors. Advances in Medical Education. Dordrecht: Kluwer Academic Publishers; 1997:187–190. | ||
Faul F, Erdfelder E, Lang AG, Buchner A. G* Power 3: a flexible statistical power analysis program for the social, behavioral, and biomedical sciences. Behav Res Methods. 2007;39(2):175–191. | ||
Boulet JR, Smee SM, Dillon GF, Gimpel JR. The use of standardized patient assessments for certification and licensure decisions. Simul Healthc. 2009;4(1):35–42. | ||
Becher H. The concept of residual confounding in regression models and some applications. Stat Med. 1992;11(13):1747–1758. |
 © 2016 The Author(s). This work is published and licensed by Dove Medical Press Limited. The
full terms of this license are available at https://www.dovepress.com/terms
and incorporate the Creative Commons Attribution
- Non Commercial (unported, 3.0) License.
By accessing the work you hereby accept the Terms. Non-commercial uses of the work are permitted
without any further permission from Dove Medical Press Limited, provided the work is properly
attributed. For permission for commercial use of this work, please see paragraphs 4.2 and 5 of our Terms.
© 2016 The Author(s). This work is published and licensed by Dove Medical Press Limited. The
full terms of this license are available at https://www.dovepress.com/terms
and incorporate the Creative Commons Attribution
- Non Commercial (unported, 3.0) License.
By accessing the work you hereby accept the Terms. Non-commercial uses of the work are permitted
without any further permission from Dove Medical Press Limited, provided the work is properly
attributed. For permission for commercial use of this work, please see paragraphs 4.2 and 5 of our Terms.