Back to Journals » Risk Management and Healthcare Policy » Volume 14
Risk Analysis in Healthcare Organizations: Methodological Framework and Critical Variables
Authors Pascarella G ![]() , Rossi M, Montella E, Capasso A, De Feo G, Botti Snr G
, Rossi M, Montella E, Capasso A, De Feo G, Botti Snr G ![]() , Nardone A, Montuori P, Triassi M, D'Auria S, Morabito A
, Nardone A, Montuori P, Triassi M, D'Auria S, Morabito A ![]()
Received 1 March 2021
Accepted for publication 10 May 2021
Published 8 July 2021 Volume 2021:14 Pages 2897—2911
DOI https://doi.org/10.2147/RMHP.S309098
Checked for plagiarism Yes
Review by Single anonymous peer review
Peer reviewer comments 2
Editor who approved publication: Professor Marco Carotenuto
Giacomo Pascarella,1 Matteo Rossi,2 Emma Montella,3 Arturo Capasso,2 Gianfranco De Feo,1 Gerardo Botti Snr,1 Antonio Nardone,3 Paolo Montuori,3 Maria Triassi,3 Stefania D’Auria,4 Alessandro Morabito5
1Scientific Directorate, Istituto Nazionale Tumori “Fondazione G. Pascale”, IRCCS, Napoli, Italy; 2Wroclaw School of Banking Wyższa Szkoła Bankowa, Wrocalw, Poland; 3Department of Public Health, Università Federico II, Napoli, Italy; 4Department of Health Management, Istituto Nazionale Tumori, “Fondazione G. Pascale”, IRCCS, Napoli, Italy; 5Thoracic Department, Istituto Nazionale Tumori “Fondazione G. Pascale” IRCCS, Napoli, Italy
Correspondence: Giacomo Pascarella
Scientific Directorate, Istituto Nazionale Tumori “Fondazione G. Pascale”, IRCCS, Via Mariano Semmola, 52, Napoli, 80131, Italy
Email [email protected]
Purpose: A risk assessment matrix is a widely used tool for analyzing, assessing and setting priorities in risk management in many fields. This paper overviews critical variables, advantages, disadvantages, strengths and weaknesses of this tool, according to the ISO 31000 risk management framework.
Results: Risk assessment is one of the key stages in the Risk Management Process and involves specific steps: identifying hazards, analyzing and evaluating all possible risks. Several methods are developed to assess risks in the literature. A risk matrix method, also called “decision matrix risk assessment (DMRA) technique”, is a systematic approach used to determine the risk level and to compare different risks and define which threats need to be controlled first. The actors involved in risk assessment are called on to manage different issues related to the choice of the most appropriate methodological approach, the assessment of the adequacy of the existing control measures, the articulation of risk consequence domains, the definition of the impact-consequences, the explanation of risk likelihood scales and the development of a risk matrix.
Conclusion: We highlighted a number of recommendations in order to address these issues, especially useful when healthcare organizations provide insufficient guidance on how to use risk matrices as well as what to do in response to the existing criticisms on their use.
Keywords: healthcare risk analysis, risk matrix, consequences-likelihood analysis
Introduction
Risk is an essential part of everyday life and risks are unavoidable in any complex program.1 A common definition of risk is “the chance of something happening that will have an impact on the achievement of the stated organizational objectives”.2 Risk management is defined in the literature as “all the activities connected with hazard identification, assessment, selection of appropriate responses and risk monitoring”.3 A general risk management scheme, within the international risk management standards ISO 31000, consist of a few key stages, namely: (i) organizational context definition (ii) risk identification, (iii) risk analysis, (iv) risk evaluation, (v) risk treatment, (vi) monitoring and review, and (vii) communication and consultation, that covers the whole process (Figure 1).4 In this scheme risk assessment is the term that covers three successive stages: risk identification, risk analysis and risk evaluation.5–8 Risk identification is used to find, recognize and describe the hazard that could affect the achievement of objectives.2 Risk analysis is finalized to understand the nature, sources and causes of the risks identified and to estimate the level of risk; and risk evaluation is used to compare risk analysis results with risk criteria in order to determine whether or not a specified level of risk is acceptable or tolerable and identifying where additional action is required.7 Thus, risk assessment allows decision-makers to determine, based on the identified and analyzed risks, which risks will be treated and with what priority, becoming a key part of the decision-making process because it can help to identify possible options for risk management, according to the level of risk identified.9,10 Risk management has become one of the main objectives of individuals, organizations, and governments in pursuing their goals since there is the possibility that things do not go as planned. Healthcare organizations are high-risk and highly complex with multiple dimensions of mutual interdependence (professional, technological, organizational/managerial) and risk management is very important, because even a low-risk event could have serious consequences affecting patients, personnel, costs and the hospital’s reputation. Risk assessment and risk ranking tools have been developed in complex and high-reliability and highly-resilient industries, such as nuclear power generation, manufacturing and aviation have recently been adopted in the healthcare sector, to specifically address patient safety. There are different methods of analysis that take into account two common parameters, presence of the hazard and its severity, and they differ in how these two factors are evaluated and combined to estimate the risk.11 One of these methodologies use a qualitative or semi-quantitative risk assessment matrix to identify, assess and rank the risks associated with threats and to determine which threats need to be controlled first. The comparative simplicity and apparent ease of use in this approach likely contributed to widespread adoption, including a generic international standard for risk assessment techniques in support of risk management.12–14 In this context, hospital staff are often called upon to decide whether given risks are high or low, nevertheless participants need clear definitions of what is considered “high” versus “low”.15 This critical literature review highlights the key variables, advantages, disadvantages, strengths and weaknesses of the whole risk analysis phase for the healthcare organizations, engendering a number of recommendations when risk analysis is conducted using a risk matrix.
 |
Figure 1 Risk management process |
Risk Analysis in Healthcare Organization
In the broad based risk assessment process, the goal of risk analysis is to realize and develop a better understanding of the risk.6 Risk analysis in healthcare involves consideration of the sources of risk, their consequences and the likelihood that those consequences may occur with patient safety, persons involved in providing healthcare, the organization itself, in an effort to distinguish minor acceptable clinical risks from the unacceptable major risks and to provide data to assist the subsequent evaluation and treatment of risks.9,16
Risk Matrix Method
A risk matrix method, also called “decision matrix risk assessment (DMRA) technique”, is a systematic approach used in risk assessment process to determine and to rank the risk level, to compare different risks and to define which threats need to be controlled first and to help minimize the probability of potential risks. It responds to the general principle that the risk level depends mainly on two variables: severity of harm and occurrence probability of this harm or likelihood.12 Easy to implement and graphically appealing, it can be applied even where data are limited and does not require specialized expertise, representing a quick way to graphically recognize the issues of the risk, the severity of the hazard and the frequency/probability.13,17,18
Consequently, risk matrix has become a popular decision-support tool in both the public and private sectors, frequently used also in healthcare organizations, because it standardizes the process of grading the risk. It provides a visualization for both presence of the likelihood of an event occurring and its effects if the event occurs, giving direct insight into the way these two elements contribute to the overall risk, and this facilitates discussions amongst stakeholders regarding the identified risks.11,19 A risk matrix also assists the risk manager, the board and all risk-owners to decide the priority level for corrective actions/controls, necessary within the department/unit/facility, depending on the score. Finally, a risk matrix also helps to assess and document changes in risk before and after control measures are implemented.20
Risk Rating Estimation
The choice of the most appropriate methodological approach to risk rating estimation is the first organizational decision in risk analysis. Organizations can choose among quantitative, qualitative and semi-quantitative methods. The quantitative approach (Table 1) calculates numeric values associated to each component that results after risk evaluation.21 Therefore risk impact, risk probability and risk level are determined in terms of numeric values.22 For example, risk levels for patient injury from a particular medical procedure could be defined through the assessment of the probability based on the historical frequency or available statistical data and numerical values expressive of the potential impact ranging from minor injuries to severe trauma leading to the death.23
 |
Table 1 Quantitative Analysis |
Unlike the quantitative ones, the qualitative methods do not express the size of likelihood or the consequences by means of figures (Table 2). The value of likelihood and impact/consequence levels of a specific event are given by description using a pre-defined rating scale.23 This generally implies an inaccurate determination of risk and it is used in all those cases in which calculating the numerical value of risks is impossible or difficult.22 For example, when numerical data are inadequate or unavailable, resources are limited (in terms of budget or expertise) and time allowed is scarce, a single person or team, in these cases, can collect information using structured interviews/questionnaires (also with experts in the area of interest), specialist and expert judgments, evaluations using multi-disciplinary groups, and benchmarking methods.16,24
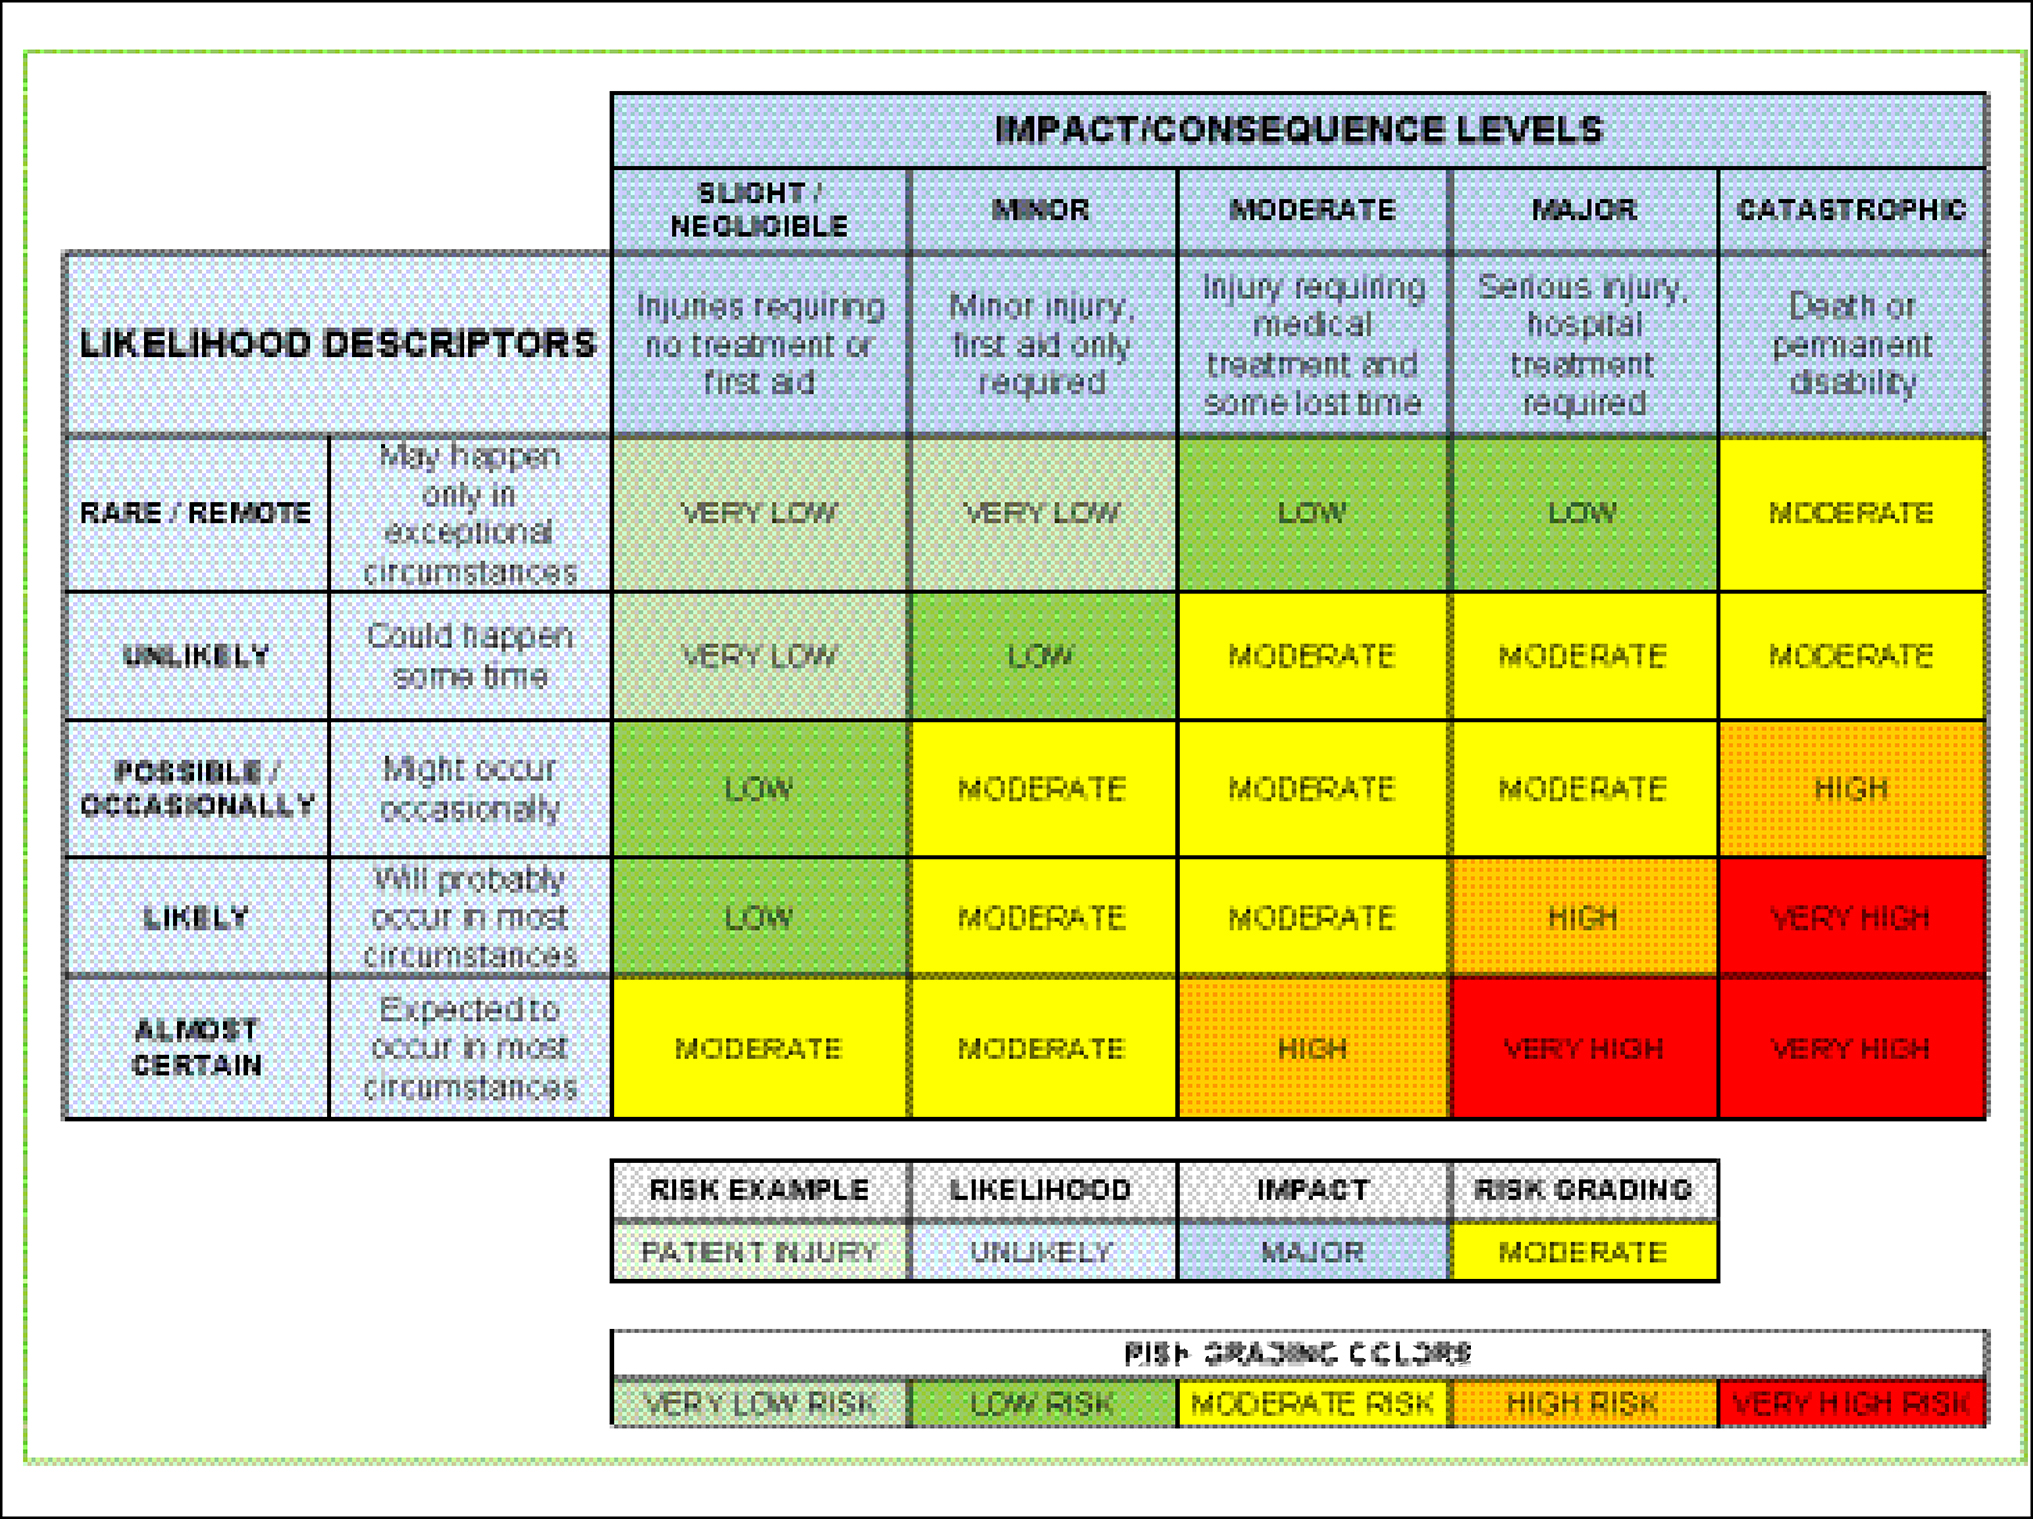 |
Table 2 Qualitative Analysis |
Semi-quantitative risk assessment represents an intermediary level between the textual evaluation of qualitative and the numerical evaluation of quantitative risk assessment, by ranking risks according to a predefined scoring system (Table 3), allowing the information to be processed quantitatively. This approach consents mapping the perceived risks into categories, establishing a logical and explicit hierarchy between categories, and reflecting the order that should be followed in reviewing them.24,25 Comparing advantages and disadvantages (Table 4) of the quantitative vs qualitative methods, the combination of these two models can be a solution in healthcare. The semi-quantitative method combines specific advantages of each by decreasing their disadvantages, explaining their diffusion in the healthcare organization, as suggested by government guidelines and best non-governmental practices, although they have a limited ability to correctly reproduce the risk assessments implied by quantitative models.24,26
 |
Table 3 Semi-Quantitative Analysis |
 |
Table 4 Quantitative Vs Qualitative Analysis |
The Categorization of the Matrix Inputs (Impact/Consequences and Likelihood)
Impact/Consequences Analysis
Use of correct terminology is very important in risk management: terms such as threat, risk, impact and consequence are used, and often get confused. Threat is the potential for harm (natural, accidental or intentional), risk is the vulnerability to a threat, impact or severity is a forceful or dramatic effect (refers to the anticipated outcome of the risk if it occurs), and consequence is the result of an effect.27,28 Therefore, for instance, non-adherence to medical guidelines by the staff (threat) could lead to physical harm to patients (risk), patient death (impact) and, if frequent, could lead to loss of hospital confidence in the local community (consequence). In reality, the difference is not always properly understood and impact and consequence are used as synonyms. Some risks impact in a specific area, while other risks have the potential to affect the entire organization or even the system as a whole. However, there may be multiple consequence categories applicable to this risk.16
To help users in estimating the severity of harm that could result from each hazard, the Code of Practice developed by Safe Work Australia recommends using a consequence assessment questionnaire to assess how severe the harm could be.29 Risk management guidelines suggest to estimate the severity of harm that could result from each hazard considering: (i) what type of harm could occur (psychological, physical, legal, financial, safety, etc.); (ii) how severe is the harm (death, serious injuries, illness, extra observation or minor treatment, small loss of budget, anxious, afraid, corruption, etc.); (iii) what factors could influence the severity of harm (for example, the height in case of fall, the concentration of a particular substance, the age of the patient, the social culture for the level of corruption, etc.); (iv) the number of people exposed to the threat and how many could be harmed in and outside the workplace; (v) the need to use specific tools or processes to assess how severe the harm could be (samples for testing or arranging noise exposure level testing); and (vi) the multiple failure scenarios (for example, poor quality health services provided can lead to bad reputation).
In Additional File 1, consequences have been categorized with a five-point scale: (i) insignificant/negligible, (ii) minor, (iii) moderate, (iv) major, and (v) catastrophic. In scoring impact, the anticipated outcome of the risk is from grade 1–5, with 5 indicating the most serious impact.2 If this standardization is not established risks cannot be compared against each other and appropriately prioritized.15 Each severity category has been an associated to a meaning and to an example. Therefore, risk is catastrophic if it causes death (impact of harm), while it will be major if it causes major injury/long-term incapacity/disability, moderate if it causes moderate injury or illness requiring professional intervention, etc. These categories can assist users in risk identification by providing some examples of level of risk and they can be very useful when different risks need to be communicated within the organization. Assessors often understand that consequence tables will never be perfect, or agreed on by everyone, but acknowledging that if well constructed they allow useful comparisons between diverse types of events.30 The list of a source of potential harm or damages (as the related risk domains) in the assessment table is not exhaustive, and the evaluators should be made aware of this. Furthermore, in healthcare all risks cannot be foreseen and events that have never happened before happen all the time.15 In this case, it may not be possible to accurately predict the consequence (but, also likelihood) of a risk. It is not necessary to address each consequence category within the table, nevertheless only the most important ones.16 Some risks may result in more than one consequence, which also affects different domains, such as the death of a patient from an adverse event that results in sustained negative publicity and local authority involvement.15 In these cases, a multi-risk analysis is required in order to determine the total risk from several hazards, considering the possible hazards and vulnerability interactions (i) could occur at the same time or shortly after each other or (ii) without chronological coincidence. The lack of available data, the fact that single risks may refer to different time windows or the necessity to consider different typologies of impacts make rankings difficult if not impossible, often requiring software tools such as decision support system for mapping multiple risk scenarios.23 If a risk affects more than one area or domain, in the risk register it will be recorded in the predominant category.16
Likelihood/Probability Analysis
In risk assessment analysis, likelihood is an estimate of the chance of an event or an incident happening, whether defined, measured or determined objectively or subjectively, therefore is typically referred to as probability. Although these terms are often used interchangeably, there are distinctions to take into consideration. Likelihood is the chance of an event or something happening, generally expressed qualitatively. Probability is a quantitative or numerical measure of the chance of something happening expressed as a percentage. Both can be used successfully, but the distinction between probability and likelihood is fundamentally important in risk analysis.31 Probability attaches to possible results (that are mutually exclusive and exhaustive), while likelihood attaches to hypotheses, that unlike results, are neither mutually exclusive nor exhaustive.32 In addition to being described using the term probability, likelihood can be described also in terms of frequency over a time period. In this way, frequency is a measure of likelihood expressed by the number of occurrences (eg, once a month or once a year) of an event in a given time, or a given number of observations. Like with consequences, a likelihood scale is used in theory and practice to assess the probability of the risk occurrence, providing analysts with clearer descriptions of how often adverse consequences will occur. In the semi-quantitative model, likelihood is usually measured on a five-point scale from 1 to 5, with 1 being the lowest possible rank and 5 being the highest. In Table 5 numerical category is from 1 to 5 and they have been assigned to textual descriptions of likelihood categories, where category 5 is the most severe or the most probable or frequent.
 |
Table 5 Likelihood Scoring Table |
Main Limits
One of the most important issues is the difficulty to define input scale unambiguously, even when scales have been developed using the best available information, because the scales of consequence or likelihood are equivalent. For example, in a case where “unlikely” corresponds to a score of “2” and “possible” corresponds to a score of “3,” the distance between “unlikely” and “possible” is 1, but the users may believe “unlikely” corresponds to the interval of (10–20%) and “possible” to the interval of (21–50%). Obviously, the lengths of the two intervals are not proportionate with the scores “2” and “3.” As a result, ranking of risks according to the products will be inaccurate.13 Furthermore, the scale is very subjective and there tends to be a significant variation between users, due to the intrinsic qualitative nature of the matrix and different background of knowledge or experience of the users.33
Consequences and probability can still be difficult to quantify because events may never have occurred before or because, by their nature, they are extremely rare. Consequently, a risk assessment not based on a purely statistical basis and mathematical consequence assessment necessarily requires subjective assessments to be made.26 Indeed, in these cases, it is important to consider that assessments of the likelihood of occurrence and their impacts are subject to cognitive limitations that affect human ability to interpret and evaluate information (subjective assessment). Wall argues that subjective assessment is subject to cognitive limitations which produces errors and bias in the qualitative inputs of the risk matrices.18 Different types of subjective evaluation errors are identified:
- “Representativeness Heuristic”, when individuals are more apt to classify an object based on how representative the object is of a certain class or group of objects, with serious implications for probability assessment;
- “Availability Heuristic”, when individuals assess the likelihood of an event by the ease with which instances or occurrences come to mind, but three factors produce serious prejudices: (i) Retrievability = an event whose instances are easily retrieved from memory (ie, witnessing an event first hand) might appear more recurrent than an event of equal frequency (for example, reading about it in the newspaper); (ii) “Imaginability” = occurs when an event in not stored in memory; (an assessor, in such situations, evaluates the likelihood of the event on the basis of the ease with which the event can be constructed in its mind, does not reflect its actual frequency); and (iii) “Illusory Correlation”, when a belief held that two events are related when they are not. When two separate variables are paired together leads to an overestimation of how often they co-occur in the future;
- “Anchoring and adjustment heuristic”, when an individual does not know something or does not have a correct answer, many times he starts with information that he knows (an anchor) and then adjusts it until an acceptable value is reached. The adjustment may be insufficient and result bias.18
Assessing the Value of Existing Measures
In analyzing risk, it is essential to consider the existing control measures, because a failure of controls could lead to an event. Knowing what controls are already in place, and whether they are effective, could help identify what – if any – further action is needed.2,34
Each healthcare organization should have its own control effectiveness rating approach to guide the process and how controls should be rated. Thus, the fundamental questions to consider are (i) what are the current control(s) in place that would modify this risk? (ii) why is this control important in modifying this risk? (iii) how effective is the control at modifying this risk? and (iv) who is going to assess whether the control is effective? This will allow the organization to define its own control effectiveness, ratings approach and assess whether the control is (i) effective (ii) partially effective (iii) ineffective, and help make a decision about what action is required or about additional investments.35 Healthcare organizations could use the control assessment questions suggested by “The WA Health Clinical Risk Management Guidelines” to assess each control in place (related to the different degrees of documentation, awareness, compliance and effectiveness of each control in place) and the corresponding answers to draw some assumptions on their level of adequacy (Table 6).16
 |
Table 6 Control Assessment Questions and Adequacy |
Given that management’s assumptions about the strength of internal control can influence the risk profile, it needs to consider that (i) controls that cannot be rated and are important should be assessed by a subject-matter expert, (ii) controls rated as effective do not guarantee the risk will not occur, and (iii) design of controls varies and they can be preventative, detective and/or monitoring.35 Controls may include legislation, policies, procedures and guidance material, staff training and required learning, segregation of duties, audit, reviews, investigations, personal protective measures and equipment, devices and structural or physical barriers, checklists, templates, etc.34,35 Additional file 2 provides an example of how to consider the control measures in place in risk management by setting up an accurate risk register.
The Number of Cells in a Matrix and Classification of Risk Levels
Identified the adequacy and effectiveness of the controls, defined the likelihood of the risk occurring and its consequence when occur, an assessment of the level of risk is made by using risk matrix. A risk matrix is a two-dimensional grid with the horizontal cells, representing the likelihood that the potential consequences will occur, while the vertical cells represent categories of severity of those events.36 The intersecting cells allows for a relative ranking of different kinds of risks, and establishes a baseline from which to measure progress and trends over time.15
Risk scores are not intended to be precise mathematical risk measurements. Rather, the same values are traced to defined risk scales to generate the resulting risk ratings or level. Matrices may have a different design depending on the organization’s risk profile and the desired number of cells depends on the consequence and probability scales used. They most often use five-point consequence and likelihood scales, giving 25 cells, although other combinations (eg, 3×3, 6×6, 7×10) are encountered and given that matrices with 3×3 scales may not provide enough granularity to give useful results, while 10×10 might deceive users into thinking they give greater accuracy. It has been argued that a 5×10 matrix could be used to analyze both negative and positive consequences and their effects on objectives.26
The use of colors allows a faster assessment of the levels of risk involved. Risk levels and related color codes are classified based on their score or calculation, as shown below the extent of damages can be formulated in five levels: (1) Very high-risk level – red, (2) High-risk level – orange, (3) Medium or moderate risk level – yellow, (4) Low-risk level – green, (5) Very low level – light blue/green. The levels of description of likelihood of occurrence can be expressed in percentages (Table 1) or in semantic concepts (Tables 2 and 3). Risks that have the same quantitative values should have the same qualitative ratings and the same color. Cox states that a well-defined risk matrix (including its coloring) shall fulfill three axioms: (i) the weak consistency, (ii) the between-ness, and (iii) the consistent coloring axiom.37 The weak consistency axiom requires that all risk points in the higher rated cell should be quantitatively larger than any risk point in a lower rated cell. In other words, the smallest risk point in a higher rated cell should be quantitatively larger than the largest risk point in a lower rated cell.33 An implication of this axiom is that any risk matrix that satisfies weak consistency must have at least three colors (green, yellow and red). Between-ness means that a small change in the probability or impact that starts in the green category and ends in a red category must pass through a yellow risk category. Consistent coloring means that risks that have the identical quantitative values should have the same qualitative ratings and the same color.
Hazards Recognizing
Hazard is a source of potential harm or a situation with potential to cause loss. It involves finding things and situations that could potentially cause harm to people. In this way, hazard identification is part of the process used to assess whether a particular situation may have the potential to cause damage. Walking around regularly in the workplace and observing how staff work or asking the question “What if?” in brainstorming sessions are good ways to predict what might go wrong.29,36 Organization’s needs to be clear in understanding what they trying to achieve, in order to prevent risks within the organization.15 In risk management, some companies define consequence categories related to exposure to a hazard for the fields of human health, environmental damage, financial loss and publicity.38 While government guidelines and best non-governmental practices for healthcare organization focus on patient safety, staff or public (physical/psychological harm), business continuity, adverse publicity/reputation, finance and asset, etc. Additional File 1 shows some of the main sources of potential harm or harm (grouped in risk domains) that a healthcare organization could recognize in the previous risk identification phase, related to internal (eg, patient experience) and external (for instance, adverse publicity/reputation) risk factors suggested by cited government guidelines.
Reliability of the Matrix for Decision Making
To understand the nature, estimate the level of each risk and provide the basis for risk assessment and correct decisions, it is important to know all limits of the risk matrix because they affect the reliability of the information provided. Pitfalls exist for unwary users of risk matrices.17 If the risk matrices are not designed in a scientific way, the assessment of the evaluated risk is not credible.33 Notwithstanding with its wide application, an increasing number of authors have highlighted, analyzed, and discussed the limitations and inconsistencies of the risk matrix approach, related differently to the design, the use and the impact on risk management decisions.
Wall argues that cognitive limitations that affect human ability to interpret and evaluate information, could produce errors and bias correlated to assessment of the risk matrix input: the impact-severity-consequence and the likelihood-probability-frequency.18 Duijm considers the number of discrete categories of consequence and likelihood used in risk matrices and “the use of universal or corporate standard risk matrix in a different context”, as an intrinsic disadvantages of risk matrices in the absence of adequate user education or training.39 Peace argues that biases and competence of decision makers, are related to the same uncertainties applying to matrix designers as well as users and identifies limits in two sources of uncertainty link to (i) design of the risk matrix and (ii) in the use of the risk matrix.26 The information adequacy and reliability are mainly related to the descriptions of the consequences and likelihood used by the designer of the matrix. Peace also suggests that risk matrix is only a part of a wider process.26 Decisions based totally on the matrix can induce risk assessors to make subjective and arbitrary judgments, making any risk assessments of questionable value. Therefore, combining the information derived from mapping with that concerning the control measures judged critical could make the risks control activity in place more adequate and reliable. Cox argues that effective risk-reducing countermeasures cannot be based on the categories provided by risk matrices but require further quantitative information, about budget constraints and about interactions among countermeasures.37
Other biases involve risk score calculation.40 Since the matrix is symmetric, there will be identical risk severity values for different probabilities and consequences combinations (P = 1, C = 5, R = 5, we will have the same result by inverting the factors P = 5, C = 1, R = 5). Cox defines this as a ranking error.37 It means that risk matrices can mistakenly assign higher qualitative ratings to quantitatively smaller risks, leading to worse-than-random decisions. Furthermore, Chunbing argues that risk aversion attitudes in people may confuse results in risk matrices.33 Risk aversion in risk matrices is explained by the concept that in the risk score, the consequence has greater weight with respect to likelihood. Consequently, an event with low probability but high impact will have an assigned higher risk value than a high probability-low consequence event, even when the expected loss for both events is the same, despite the matrix being symmetrical (P × C = C × P).39 Cox stated that a reliable matrix should not use too many colors, which must be at least three (for the Between-ness axiom) and not more than five, according to Peace.26,37 While Duijm believes that when numerical risk scores and colors are used in a matrix to define the level of risk, this may be problematic if there is inconsistency between coloring and the numerical risk scores.39 Therefore, he recommends applying the axioms of consistency as formulated by Cox.37 This issue concerning risk categorization is also described by Li et al13. Users also need to know that risk matrices make it difficult to combine or compare the impact of a single event on different risk areas (ie, patient injury and reputation), just as it is difficult to combine the risk of more hazards arising from a single activity.39 Peace argues that further sources of uncertainty come from interpretation of words used in the descriptions of consequences and their likelihood by users, potentially quite different from those intended by the author of a risk matrix.26 Moreover, he claims that “many uncertainties applying to matrix designers and users will also apply to decision makers using matrix-based results alone to aid their decisions”. In an attempt to overcome biases and competence of decision makers in evaluating the results of a matrix-based risk analysis, Peace recommends to compare the level of risk set by risk matrix with the risk criteria previously set by the organization. In absence of these risk criteria, the information provided by the matrix results may be misapplied.26
Considering the limits that can significantly affect the judgments in decision and risk analysis from experts, the hazard is that hospitals may use the matrix as measurement and the evaluation tool rather than as a simple visualization tool, unwittingly ignoring all its limitations. Probably, the greatest risk for healthcare organizations is the “biases and competence of a risk matrix designer”. When the designer lacks knowledge of matrix design principles and pitfalls and is unfamiliar with relevant events in the sector, organization or elsewhere, the most common mistake is to take a matrix from another organization without trying to adapt or tailor it to an organizational characteristic.26 Moreover, the use of a single corporate matrix should be avoided since it is difficult to find a common matrix that universally applies to a multiplicity of events relevant to an organization. An effective risk matrix for decision-making should be designed to be appropriate for specific circumstances. Tolerable risk at company level could be unacceptable at departmental level and, judged even more catastrophic at the organizational level.39
Response to the Identified Problems
Many authors have proposed different solutions to overcome the risk matrix limitations. Markowski and Mannan describe a procedure for developing a fuzzy risk matrix that may be used for emerging fuzzy logic applications in different safety analyses in order to model the uncertainties associated with severity and probability of harm concepts.41 Similarly, Gul and Guneri proposed a fuzzy approach enabling experts to use linguistic variables to deal with shortcomings of a crisp risk score calculation and to decrease the inconsistency in decision risk making, weighted the likelihood and severity parameters by using Fuzzy Analytic Hierarchy Process (FAHP).40 They, also, use the same approach (FAHP) in weighing five risk parameters: severity, occurrence, undetectability, sensitivity to maintenance non-execution, and sensitivity to personal protective equipment non-utilization in a case study carried out in a leading hospital in Turkey-42 Ni et al propose some arithmetic extensions on risk matrix approach, establish a risk-matrix-style assessment framework capable to overcome its inherent limitations.43 Ruan et al suggest a risk matrix establishment approach that integrates risk attitudes based on utility theory, introducing utility functions to describe risk attitudes of project decision makers.44 Duijm provides a number of recommendations related to: (i) coloring, whereby the requirement of between-ness, defined by Cox, needs to be fulfilled by coloring the matrix, if the purpose of the risk matrix is to address risk acceptance, and numerical (ordinal) scores shall not be in conflict with the colors applied in the risk matrix; (ii) the choice of (basically) logarithmic scales for both consequence and likelihood, which enables the covering of several orders of magnitude of likelihood and consequence (in this case risk scores are appropriately defined by adding the ordinal numbers of the consequence and likelihood category); (iii) to define, in risk aggregation, rules for moving the aggregated likelihood of several single events with similar outcomes (consequences) to the next likelihood category; (iv) avoid using standardized corporate risk matrices; and (v) the use of the continuous probability consequence diagram, that use continuous scales instead of discrete categories, as an alternative to the risk matrix.37,39 Goerlandt made some new proposals on how to represent uncertainty in risk diagrams in practical applications, after reviewing the strengths and weaknesses of the existing proposals representing uncertainty in probability-consequence diagrams.45 He suggests some modifications to the probability-consequence diagrams with prediction intervals and strength-of-evidence assessments proposed by Aven, Reniers and Abrahamsen et al46,47. Aven suggests to improve risk characterization by introducing knowledge dimension of risk in the related formula.48 In brief, a risk is characterized by some specified consequences and an uncertainty measure (interpreted in a wide sense), in addition to the knowledge that supports both input (consequences and uncertainty). Therefore, he proposes an extended risk matrix approach that include a third strength of knowledge dimension and some assumptions which support the analysis, aimed to guide risk analysts and practitioners in managing risk.
The American Society for Healthcare Risk Management (ASHRM) considers the possibility of added “velocity” (time to impact) to likelihood and impact.27 Li et al propose the “Sequential Updating Approach” (SUA) to overcome the limits of traditional risk matrix, based on “Adjusted Weak Consistency”, “Consistent Internality” and “Continuous Screening”.13 The latter three constitute the principles that characterize a good rating scheme of a risk matrix in a reliable way. He suggests a global rating algorithm to create the design that satisfies the three principles and explains with a hypothetical case the feasibility of the approach, where the decision makers must assess some project risks with the same type of consequence, but they do not have sufficient data on the risks to decide how prioritize these risks. Specifically for health care organizations, Card et al, in a study concerning a content analysis of risk management strategies, policies, and procedures at all acute, mental health, and ambulance trust (in the East of England area of the National Health Service) found (a) an almost complete lack of useful guidance to promote good practice in risk control at the organizational-level and (b) a number of weaknesses in the use of risk matrix, especially related to the guidance for scoring an event’s likelihood.49 Consequently, they provided a number of recommendations to address these issues, mainly related to the methodological approach (every healthcare organization is required to develop a comprehensive framework for the risk control process, providing tools and techniques to operationalize such a framework) and on how to manage risk that originates several consequences in multiple domains. Relating to the general practice of a single likelihood-consequence pairing, thirdly, they suggest: (i) moving away from the use of timeframe-based likelihood guidance, (ii) explicitly defining reference groups for probability-based likelihood guidance, (iii) evaluating two reference groups to achieve a more complete understanding of the likelihood for the population at risk and the total patient population and (iv) to develop within NHS a process finalized to define standards minimum of likelihood scores to be assigned for a given probability, in order to reduce the very large variation there was in the scores assigned to a given probability by health organization. Kaya et al, and likewise Card et al, examine risk matrices used in acute hospitals in England and the guidance provided by organizations for their use.19,49 The findings revealed a large variety of risk matrices used, mainly, related to the (i) risk matrix size (eg, a 3×3 or 5×5 matrix), (ii) matrix type (as being symmetrical or asymmetrical), and (iii) number of color bands and the risk ratings for each band, that might increase the chance of risk misprioritization. Additionally, findings show that hospitals may provide insufficient guidance on likelihood and consequence ratings as well as what to do in response to the existing criticisms of risk matrices. Thus, they provide some suggestions for English acute hospitals as following. In estimating the risk score, they recommend: a) to also consider the strength of knowledge of the assessors supporting the likelihood and judgement consequence (by using three dimensional risk matrices), in addition to the two classic inputs (likelihood and consequence); b) to introduce guidance on what to do when a risk has several consequences in multiple domains and to clarify how risk should be scored where a range of consequences could occur with different likelihoods; c) to explain which likelihood scoring scheme (ie, nominal, time-framed, and probability) should be used and in which circumstances and how to prioritize risks that have achieved the same score; and d) to remind to risk assessors that risk matrix is just one of several methods designed to support their decisions and not to make decisions directly and that in risk prioritization additional factors, as organizational objectives, detectability legislation, and the resources needed to implement any risk controls, must be taken into consideration. Finally, consider that risk scores might not reflect the real risk rating and, therefore, a balanced and unbiased professional and subjective judgment is recommended in risk decision making.
Discussion and Conclusions
Identifying the magnitude of a risk means understanding the consequences that could result if that threat occurs, in order to separate the acceptable minor clinical risks from those judged unacceptable Ranking a risk by multiplying consequences for likelihood is a simple way to assign a numerical value to each risk. Risk matrix becomes a useful tool to assess the likelihood, the consequence levels and determine whether the risk rating is very low or extreme. It also assists the team to prioritize which risk needs to be addressed first. However, performing a risk analysis needs to consider the biases that characterize the whole phase and, in particular, those that affect the design and use of risk matrices. When designing matrices one needs to consider that designers could lacks knowledge of matrix design principles and pitfalls, because different choices can lead to rather different risk matrix representations and, consequently, to diverse risk acceptance decisions. Existing controls also need to be considered because they influence the likelihood estimation and how risk is rated. Many authors describe problems in using risk matrix that can mislead risk evaluators, misinform decision risk makers or result in wrong analyses, while some authors suggest a matrix adds little value to risk management. In effect, while the matrix describes the consequences and probabilities of a risk, its spaces are linked to the judgment of the designer and user. Peace claims that few matrix designers or users have been trained or supervised in the design or use of a risk matrix and may not understand those uncertainties.26 Duijm asserts that risk matrices generate uncertainty and ambiguity in the results, but they are so widespread that it becomes difficult to curtail their use.39 For these reasons, we also think that it is more productive to highlight its limits and to make designers, risk assessors and decision makers aware of these difficulties rather than discouraging their use. According to the Food and Agriculture Organization, the choice of the style of the matrix depends on the team’s preference.25 Colors serve as a visual tool to stimulate discussion and help team members agree on a level of risk. So, for some events, where information is limited and the overall level of risk is obvious, the matrix may not be needed. Healthcare organizations do not shirk this logic and as shown by Card et al, none of them support their working groups through suitable organizational-level guidance to support risk control practice. In our opinion, the critical issues related to the use of risk matrices could be unknown not only to designers and users, as well as healthcare organizations, in order to manage and govern risk.49 However, we do not have data to support this conclusion, although Card’s et al and Kaya’s et al work seem to provide some clues.19,49 Limiting the analysis to Italy, it would be interesting to know if and how much this framework has spread among the Italian healthcare organizations and if the actors are aware about intrinsic limits in the risk matrix use. It seems useful to recall that the Italian National Anticorruption Authority (ANAC) guidelines, which suggested this framework for the corruption risk management in the public administration, including healthcare organizations. In particular, ANAC proposed an initial semi-quantitative approach (between 2014 and 2020) and then a more recent qualitative approach (starting in 2021). Without evidence supporting the effectiveness, or not, of the risk matrix in the anti-corruption framework, our experience in the hospital suggests certain caution. Furthermore, given that healthcare organizations have become familiar with this framework, one can imagine its extension to other domains, if not already done. Another limitation of our paper is that we reviewed only secondary literature related to risk analysis according to ISO 31000 risk management framework.
Risk matrices are extensively applied and suggest risk management guidance for healthcare organizations, perhaps because not all evaluators have the necessary skills and knowledge to propose risks analysis through more sophisticated techniques. Consequently, they represent a widely accepted solution to ensure rapid responses and some quick results in risk management by health organization. Each organization is called to develop (or help to develop) one or more questionnaires in order to ensure more accurate risk level calculation by considering the category of likelihood against the category of consequence severity. The overall level of risk assigned to an event helps identify the urgency and extent of the control measures needed. Consequently, different control measures will be put in place to counter it, with a different urgency level. In conclusion, developing and maintaining an effective risk culture requires knowledge, understanding and skills. All staff undertaking risk assessment must be provided with risk assessment training in line with the standards and organizational challenge, to increase basic awareness and allows you to identify and manage risks in your units, encouraging adequate advance planning of potential risks.
Data Sharing Statement
Data and materials analyzed are available from the corresponding author on reasonable request.
Acknowledgments
The Authors are grateful to Maura Tracey, Research Nurse at IRCCS “G. Pascale” of Naples, for her English revision.
Author Contributions
All authors made a significant contribution to the work reported, whether that is in the conception, study design, execution, acquisition of data, analysis and interpretation, or in all these areas; took part in drafting, revising or critically reviewing the article; gave final approval of the version to be published; have agreed on the journal to which the article has been submitted; and agree to be accountable for all aspects of the work.
Funding
There is no funding to report.
Disclosure
The authors report no conflicts of interest in this work.
References
1. Arimbi H, Puspasari M, Syaifullah D. Hazard identification, risk assessment and risk control in a woodworking company. IOP Conf Ser: Mater Sci Eng. 2019;505:012038. doi:10.1088/1757-899X/505/1/012038
2. Health Service Executive. Risk assessment tool and guidance; 2008. Available from: https://www.hse.ie/eng/about/who/oqr012-20081210-v4-risk-assessment-tool-and-guidance-incl-guidance-on.pdf.
3. Korombel A, Tworek P. Qualitative risk analysis as a stage of risk management in investment projects: advantages and disadvantages of selected methods-theoretical approach. AD ALTA J Interdisciplinary Res. 2011;1(2):51–54.
4. Spross J, Olsson L, Stille H. The Swedish Geotechnical Society’s methodology for risk management: a tool for engineers in their everyday work. Georisk Assess Manage Risk Engineered Systems Geohazards. 2017;12(3):183–189. doi:10.1080/17499518.2017.1416643
5. Australian/New Zealand Standard. AS/NZS ISO 31000:2009, Risk management-Principles and guidelines; 2009. Available from: https://policy.deakin.edu.au/.
6. Australian/New Zealand Standard. AS/NZS 4360:2004, Risk Management; 2004. Available from: https://policy.deakin.edu.au/.
7. International Organization for Standardization, ISO 31000:2018. Risk management-guidelines; 2018. Available from: https://www.iso.org.
8. NSW Government. WHS Risk Management; 2018. https://www.rms.nsw.gov.au.
9. Strametz R. Requirements on clinical risk management systems in hospitals; 2017. Available from https://www.aps-ev.de/wp-content/uploads/2017/03/Clinical-Risk-Management-Systems-1.pdf. Accessed January 10, 2020. doi:10.21960/201707/E
10. Health Canada. Health Canada decision-making framework for identifying, assessing, and managing health risks; 2000. Available from: https://www.canada.ca/content/dam/hc-sc/migration/hc-sc/ahc-asc/alt_formats/hpfb-dgpsa/pdf/pubs/risk-risques-eng.pdf.
11. Van der Fels-klerx HJ, Asselt ED, Raley Poulsen M, et al. Critical review of methods for risk ranking of food-related hazards, based on risks for human health. Crit Rev Food Sci Nutr. 2018;58(2):178–193. doi:10.1080/10408398.2016.1141165
12. Gul M, Ak FM. A comparative outline for quantifying risk ratings in occupational health and safety risk assessment. J Clean Prod. 2018;196:653–664. doi:10.1016/j.jclepro.2018.06.106
13. Li J, Bao C, Wu D. How to design rating schemes of risk matrices: a sequential updating approach. Risk Analysis. 2018;38:99–117. doi:10.1111/risa.12810
14. Vatanpour S, Hrudey ES, Dinu I. Can public health risk assessment using risk matrices be misleading? Int J Environ Res Public Health. 2015;2:9575–9588. doi:10.3390/ijerph120809575
15. Healthcare Insurance Reciprocal of Canada. Integrated risk management for healthcare organizations. risk resource guide; 2014. Available from: https://www.hiroc.com/resources/risk-resource-guides/integrated-risk-management-healthcare-organizations.
16. Department of Health, Government of Western Australia. Health clinical risk management guidelines; 2016. Available from: https://ww2.health.wa.gov.au/~/media/Files/Corporate/general%20documents/Quality/PDF/WA%20Health%20Clinical%20Risk%20Management%20Guidelines.pdf.
17. Baybutt P. Calibration of risk matrices for process safety. J Loss Prevent Process Industries. 2015;38:163–168. doi:10.1016/j.jlp.2015.09.010
18. Wall KD The trouble with risk matrice. DRMI Working Papers Ongoing Research; 2011. Available from: http://hdl.handle.net/10945/32570.
19. Kaya GK, Ward J, Clarkson JA. Review of risk matrices used in acute hospitals in England. Risk Analysis. 2019;39:1060–1070. doi:10.1111/risa.13221
20. World Health Organization. Rapid risk assessment of acute public health events; 2012. Available from: https://apps.who.int/iris/bitstream/handle/10665/70810/WHO_HSE_GAR_ARO_2012.1_eng.pdf;jsessionid=37D8DEF12782C7CA56E18191E3068D58?sequence=1.
21. Ramona SE. Advantages and disadvantages of quantitative and qualitative information risk approaches. Chin Bus Rev. 2011;10:1106–1110. doi:10.17265/1537-1506/2011.12.002
22. Ayatollahi H, Shagerdi G. Information security risk assessment in hospitals. Open Med Inform J. 2017;11:37–43. doi:10.2174/1874431101711010037
23. EU Commission Staff Working Paper. Risk assessment and mapping guidelines for disaster management; 2010. Available from: https://ec.europa.eu/echo/files/about/COMM_PDF_SEC_2010_1626_F_staff_working_document_en.pdf.
24. Radu LD. Qualitative, semi-quantitative and, quantitative methods for risk assessment: case of the financial audit. Analele Stiintifice ale Universitatii “Alexandru Ioan Cuza” din Iasi - Stiinte Economice. 2009;56:643–657
25. Food and Agriculture Organization, United Nations and World Health Organization. Risk characterization of microbiological hazards in food-guidelines. Microbiol Risk Assessment Series. 2009;17.
26. Peace C. The risk matrix: uncertain results? Policy Practice Health Safety. 2017;15:1–14. doi:10.1080/14773996.2017.1348571
27. American Society For Healthcare Risk Management. Enterprise risk management: a framework for success; 2014. Available from: https://www.ashrm.org/sites/default/files/ashrm/ERM-White-Paper-8-29-14-FINAL.pdf.
28. Scherling M. Practical risk management for the CIO. Whittles Publishing. Google Scholar; 2011.
29. Safe Work Australia, NSW Government. How to manage work health and safety risks, Code of practice; 2019. Available from: https://www.safework.nsw.gov.au/__data/assets/pdf_file/0012/50070/How-to-manage-work-health-and-safety-risks-COP.pdf.
30. Department of Industry, Innovation and Science. Risk management. leading practice sustainable development program for the mining industry; 2016. Available from: https://www.industry.gov.au/sites/default/files/2019-04/lpsdp-risk-management-handbook-english.pdf.
31. Popov G, Lyon BK, Hollcroft B. Risk assessment: a practical guide to assessing operational risks. John Wiley & Sons. Google Scholar; 2016.
32. Gallistel R. Bayes for beginners: probability and likelihood. Observer Magazine. 2015;28:7.
33. Chunbing B, Dengshen W, Wan J, Li J, Chen J. Comparison of different methods to design risk matrices from the perspective of applicability. Procedia Comput Sci. 2017;122:455–462. doi:10.1016/j.procs.2017.11.393
34. University of Adelaide. Risk management - legal and risk handbook; 2019. Available from: https://www.adelaide.edu.au/legalandrisk/system/files/media/documents/2019-04/Risk%20Management%20Handbook%20-%20April%202019.pdf.
35. Victorian Managed Insurance Authority. Practice Guide; 2016. Available from: https://www.vmia.vic.gov.au/-/media/Internet/Content-Documents/Risk/Risk-tools/Risk-management-guide/VMIA-Practice-Guide.ashx.
36. U.S. Department Of Agriculture Forest Service. Operational risk management guide; 2020. Available from: https://www.fs.usda.gov/sites/default/files/202004/master_revised_orm_guide_02262020.pdf.
37. Cox LA. What’s wrong with risk matrices? Risk Analysis. 2008;28(2):497–512. doi:10.1111/j.1539-6924.2008.01030.x
38. Schwarz H, Koerts T, Hoercher U. Semiquantitative Risk Analysis. An EPSC Working Group. Chem Eng Transac. 2019;77:37–42. doi:10.3303/CET1977007
39. Duijm NJ. Recommendations on the use and design of risk matrices. Saf Sci. 2015;76:21–31. doi:10.1016/j.ssci.2015.02.014
40. Gul M, Guneri AF. A fuzzy multi criteria risk assessment based on decision matrix technique: a case study for aluminum industry. J Loss Prevent Process Industries. 2016;40:89–100. doi:10.1016/j.jlp.2015.11.023
41. Markowski AS, Mannan MS. Fuzzy risk matrix. J Hazard Mater. 2008;159:152–157. doi:10.1016/j.jhazmat.2008.03.055
42. Gul M, Ak MF, Guneri AF. Occupational health and safety risk assessment in hospitals: a case study using two-stage fuzzy multi-criteria approach. Human Ecological Risk Assess. 2017;23(2):187–202. doi:10.1080/10807039.2016.1234363
43. Ni H, Chen A, Chen N. Some extensions on risk matrix approach. Saf Sci. 2010;48:1269–1278. doi:10.1016/j.ssci.2010.04.005
44. Ruan X, Yin Z, Frangopol DM. Risk matrix integrating risk attitudes based on utility theory. Risk Analysis Official Publ Society Risk Analysis. 2015;35(8):1437–1447. doi:10.1111/risa.12400
45. Goerlandt F, Reniers G. On the assessment of uncertainty in risk diagrams. Saf Sci. 2016;84:67–77. doi:10.1016/j.ssci.2015.12.001
46. Aven T, Reniers G. How to define and interpret a probability in a risk and safety setting. Saf Sci. 2013;51(1):223–231. doi:10.1016/j.ssci.2012.06.005
47. Abrahamsen EB, Amundrud Ø, Aven T, Gelyani AM. Safety oriented bubble diagrams vs: risk plots based on prediction intervals and strength-of-knowledge assessments. Which one to use as an alternative to risk matrices? Int J Business Continuity Risk Manage. 2014;5(3):197–209. doi:10.1504/IJBCRM.2014.066159
48. Aven T. Improving risk characterisations in practical situations by highlighting knowledge aspects, with applications to risk matrices. Reliabil Eng System Safety. 2017;167:42–48. doi:10.1016/j.ress.2017.05.006
49. Card AJ, Ward JR, Clarkson PI. Trust‐level risk evaluation and risk control guidance in the NHS East of England. Risk Analysis. 2014;34:1469–1481. doi:10.1111/risa.12159
 © 2021 The Author(s). This work is published and licensed by Dove Medical Press Limited. The
full terms of this license are available at https://www.dovepress.com/terms
and incorporate the Creative Commons Attribution
- Non Commercial (unported, 3.0) License.
By accessing the work you hereby accept the Terms. Non-commercial uses of the work are permitted
without any further permission from Dove Medical Press Limited, provided the work is properly
attributed. For permission for commercial use of this work, please see paragraphs 4.2 and 5 of our Terms.
© 2021 The Author(s). This work is published and licensed by Dove Medical Press Limited. The
full terms of this license are available at https://www.dovepress.com/terms
and incorporate the Creative Commons Attribution
- Non Commercial (unported, 3.0) License.
By accessing the work you hereby accept the Terms. Non-commercial uses of the work are permitted
without any further permission from Dove Medical Press Limited, provided the work is properly
attributed. For permission for commercial use of this work, please see paragraphs 4.2 and 5 of our Terms.