")
Back to Archived Journals » International Journal of Wine Research » Volume 10
Resveratrol, phenolic antioxidants, and saccharides in South American red wines
Authors Osorio-Macías DE , Vásquez P, Carrasco C , Bergenstahl B, Peñarrieta JM
Received 19 September 2017
Accepted for publication 10 November 2017
Published 30 January 2018 Volume 2018:10 Pages 1—11
DOI https://doi.org/10.2147/IJWR.S152026
Checked for plagiarism Yes
Review by Single anonymous peer review
Peer reviewer comments 3
Editor who approved publication: Dr Roger Pinder
Daniel E Osorio-Macías,1,2 Pamela Vásquez,3 Cristhian Carrasco,3 Bjorn Bergenstahl,1 J Mauricio Peñarrieta2
1Department of Food Technology, Faculty of Engineering LTH, Lund University, Lund, Sweden; 2School of Chemistry, Faculty of Pure and Natural Sciences, 3Institute of Research and Development of Chemical Processes, Department of Chemical Engineering, Faculty of Engineering, Universidad Mayor de San Andrés (UMSA), La Paz, Bolivia
Abstract: Wine is an important beverage with a long tradition, and its moderate consumption may be considered beneficial for human health. Although there are many studies regarding phenolic compounds in wines, there is a lack of information about antioxidants and phenolic content in South American wines. In this study, 35 South American red wines from four different countries, vintages 2004–2013, purchased at retail stores in La Paz, Bolivia, were studied. Resveratrol content, total antioxidant capacity (TAC) by the 2,2′-azino-bis(3-ethylbenzotiazoline-6-sulfonic acid) (ABTS) and ferric-reducing antioxidant power (FRAP) methods, total phenolic content (TPH), total flavonoids (TF), and main saccharides were assessed using the well-established spectrophotometric and high-performance liquid chromatography methods. The results ranged from 4 to 24 mmol/L for TAC determined by ABTS method and 14 to 43 mmol/L for TAC determined by FRAP method, 1600 to 3500 mg gallic acid equivalents/L for TPH, and 2 to 6 mmol catechin equivalents /L for TF. The resveratrol content ranged from 0.1 to 8 mg/L. Saccharides, glucose, and fructose content ranged from 0.4 to 10 g/L, 1.4 to 8.6 g/L, and 0.2 to 12 g/L, respectively. There was a high correlation among the different methods. The results showed that some wines growing at high altitude (>1500 meters above the sea level) have higher amounts of TAC and phenolic content, including resveratrol, while non-varietal wines showed the lowest values. It was also observed that the saccharose content in some wines was surprisingly high, suggesting saccharose dosing after fermentation.
Keywords: ABTS, FRAP, high altitude, HPLC, PCA, Bolivia
Introduction
Wine is a culinary and economically important beverage with a long tradition. Although there are health concerns related to wine, today it is commonly recognized that a moderate consumption may be beneficial for human health as wine is a rich source of polyphenols.1
In the last few decades, wine has been a part of the “French Paradox”, a diet rich in fat but still with moderate effects observed on public health.2 A possible explanation could be wine being a significant source of phenolic compounds, with antioxidant properties.3 Phenolic compounds in wines have been widely studied, and epidemiological studies show that its long-term moderate consumption is associated with a prolonged life span in humans.4,5
Polyphenols (phenolic acids and derivatives, such as gallic acid, caffeic acid, p-coumaric acid, and so on), flavonoids (catechin, epicatechin, quercetin, rutin, myricetin, etc.), and stilbenes, especially trans-resveratrol, have received much attention for their positive effects associated with preventing cardiovascular illnesses, as well as ischemic injures such as Alzheimer’s disease.5 In particular, trans-resveratrol is associated with cardiovascular benefits by relaxing arteries in different vascular bends, and also for its capacity to reduce oxidative stress.6
The chemical composition of wine includes water (74–87%, v/v), ethanol (10–14%, v/v), saccharides (0.05–10%), organic acids (0.05–0.7%), phenols (0.01–0.2%), and glycerol.7 Nowadays, more than 200 phenolic compounds have been identified in red wines, and over 500 different compounds have been recognized in red wines.7
In fact, phenolic compounds in wine are responsible for some of wine’s major organoleptic characteristics, such as color, astringency, and bitterness,8 as well as for its antioxidant properties.
Resveratrol is produced in plants, particularly in grapes, as a defense response to external stress, such as fungal infection, and ultraviolet (UV) solar radiation.9,10 Some South American wines are produced with grapes grown at between 1750 and 2000 meters above the sea level (m.a.s.l.), and hence denoted as high-altitude wines.
In addition, in the last few decades, South American wines became popular all over the world due to their organoleptic qualities and good flavor, despite the scarce literature concerning their chemical composition, such as resveratrol, total antioxidant capacity (TAC), the phenolic content, and saccharides. Therefore, it is important to contribute to the knowledge of the chemical composition of these wines, particularly by studying their antioxidant capacity and resveratrol content for their importance and impact on human health.
Furthermore, in winemaking production, it is essential to control the levels of glucose which determine the ethanol content, while residual, non-fermented glucose affects the sweetness and the perceived acidity, bitterness, and dryness of the wine;11,12 the glucose levels in wine depend on the grape variety as well as other factors.
Our research group has been studying antioxidants in Bolivian foods growing at high altitude above the sea level. The methodology for the determination of TAC and the total phenolic content (TPH) has been established by Peñarrieta et al,13 for the resveratrol content in grapes by Taquichiri et al,14 and the saccharide content in different raw materials using high-performance liquid chromatography (HPLC) by Carrasco et al.15
The aim of this work was to determine and compare the TAC, the phenolic content, main saccharides, and resveratrol in 35 South American wines present on the market. In addition, this study intended to evaluate to what extent differences occur in the chemical composition of wines produced at different altitudes and to what extent the wine makers act compensatory by choosing varieties with naturally less polyphenols or a winemaking procedure reducing differences.
Materials and methods
Wine samples
For this study, 35 random, different, and commercially available red wines from Argentina, Bolivia, Chile, and Uruguay were purchased at different local supermarkets in La Paz, Bolivia, in June 2014. Table 1 shows the wines selected for this study with their principal characteristics, including variety, origin, vintage, and altitude. Samples were analyzed in triplicate once opened.
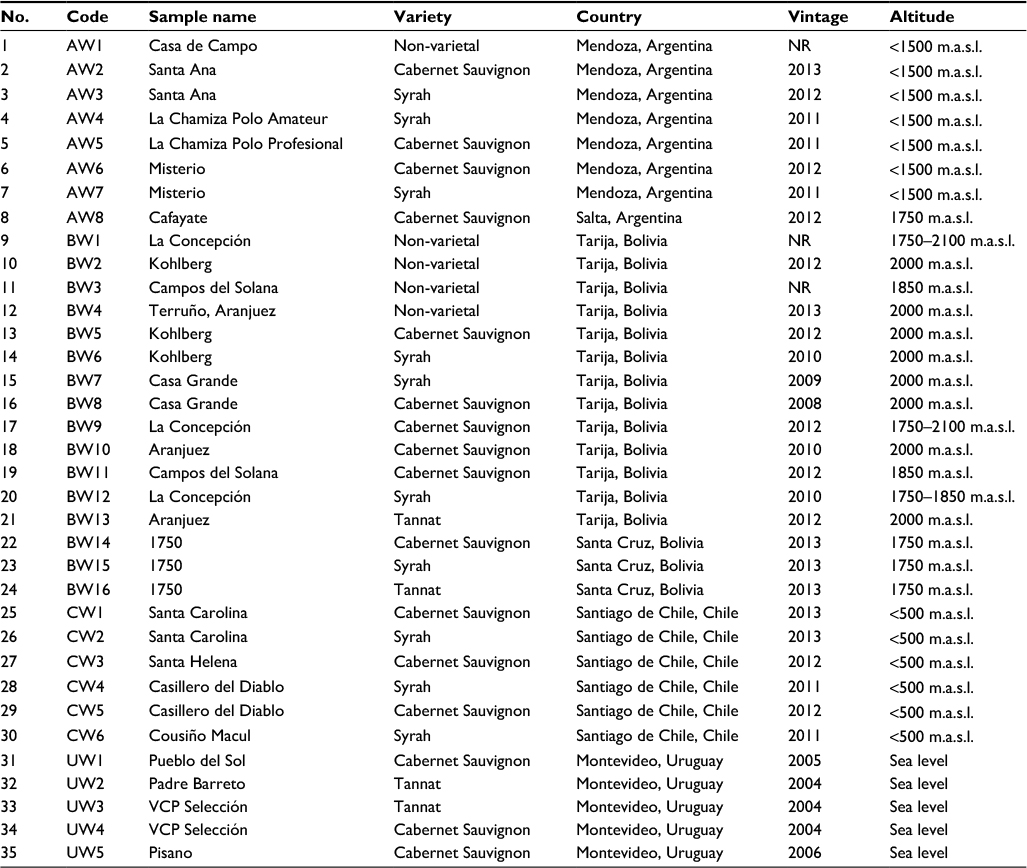 | Table 1 List of South American wines according to their variety, origin, vintage, and altitude Abbreviations: NR, not reported; m.a.s.l., meters above the sea level. |
Chemicals
Folin–Ciocalteu reagent, gallic acid, sodium carbonate, sodium nitrite (99%), aluminum chloride hexahydrate (97%), and ethanol (98%) were purchased from Merck (Darmstadt, Germany). 2,2′-Azino-bis(3-ethylbenzotiazoline-6-sulfonic acid) (ABTS), potassium persulfate, catechin (99%), 6-hydroxy-2,5,7,8-tetramethylchroman-2-carboxylic acid (Trolox, 97%), 2,4,6-tripyridyl-s-triazine (TPTZ), saccharose (99.5%), glucose (99.5%), fructose (99%), methanol (HPLC grade), sulfuric acid p.a., and hydrochloric acid (37%) were obtained from Sigma-Aldrich (St. Louis, MO, USA). Ferric chloride was purchased from ICN Biomedicals Inc. (Costa Mesa, CA, USA), and acetic acid (glacial p.a.) and sodium acetate from BDH Chemicals Ltd. (Poole, UK). Trans-resveratrol was purchased from ChromaDex (Irvine, CA, USA).
Spectrophotometric determinations
Determination of TAC, TPH, and TF
The TAC was measured using the ABTS and ferric-reducing antioxidant power (FRAP) methods, as previously described by Peñarrieta et al.13 The results are expressed in mmol Trolox equivalents per liter of wine (mmol/L).
Folin–Ciocalteu reagent was used for the determination of TPH, as well as the total flavonoids (TF) content as described by Peñarrieta et al.16 The results are expressed in mmol or mg gallic acid equivalents per liter of wine (mmol or mg GAE/L), and in mmol catechin equivalents per liter of wine, respectively.
All the measurements were recorded on a Biotek Multi-Mode reader Cytation™ 3 Cell Imaging system (Winooski, VT, USA). Wine samples were analyzed in triplicate in a Nunclon 96-well plate at room temperature.
Determination of resveratrol by reverse-phase HPLC
Trans-resveratrol was identified and quantified using a liquid chromatographic system, Agilent (Palo Alto, CA, USA) series 1100, equipped with a quaternary pump with degasser (G1354A), an autoinjector, a column oven, and a diode array detector. The column was a 3.5 × 150 mm Kromasil C18 reversed-phase column. The flow rate was 0.8 mL/min, and the injection volume was 20 µL. The gradient consisted of two eluents, 1% acetic acid/water (A) and methanol (B), and the separation components, achieved by modification of the procedure described by Taquichiri et al,14 were as follows: 40% B at 0 min, 50% B after 5 min, 80% B after 20 min, 90% B after 25 min, and 40% B after 28 min until 30 min.
Saccharides determination in wine by HPLC
In the tested South American red wines, saccharides were measured using HPLC. Samples taken from each wine were centrifuged at 16000× g for 5 min, filtered using 0.20 μm sterile filters, and acidified (5 mM H2SO4) for the analysis of dissolved compounds. Saccharose, glucose, and fructose were separated using an Aminex HPX-87H column (Bio-Rad laboratories, Hercules, CA, USA) with an eluent of 5 mM H2SO4 at 0.6 mL/min at 65°C using HPLC. The HPLC system used was a Shimadzu Corp. Prominence (Kyoto, Japan) equipped with a system controller CBM-20A, a solvent delivery unit LC-30AD, a refractive index detector RID-20A, a column oven CTO-10 ASVP, an online degassing unit DGU-20A, and an autosampler SIL-30AC. Twenty microliters of each standard solution was injected in duplicate for the construction of calibration curves which were obtained by plotting the peak area versus the concentration of each saccharide. The linearity was evaluated by a linear regression analysis using the least-squares regression method. The limits of detection and limits of quantification were calculated as described previously.15
Statistical analysis
The results were expressed as mean values (SD) of six replicates measured over 3 weeks for TAC, FRAP, TPH, and TF. Linear correlation coefficients were calculated according to the Pearson method. All calculations were done using Excel software.
The principal component analysis (PCA) was performed using MATLAB Release 2012a (MathWorks, Natick, MA, USA). The PCA was performed on centered and normalized data.
Results
In Table 2, the results of the measurements of TAC, TPH, TF, and trans-resveratrol from South American wines are shown.
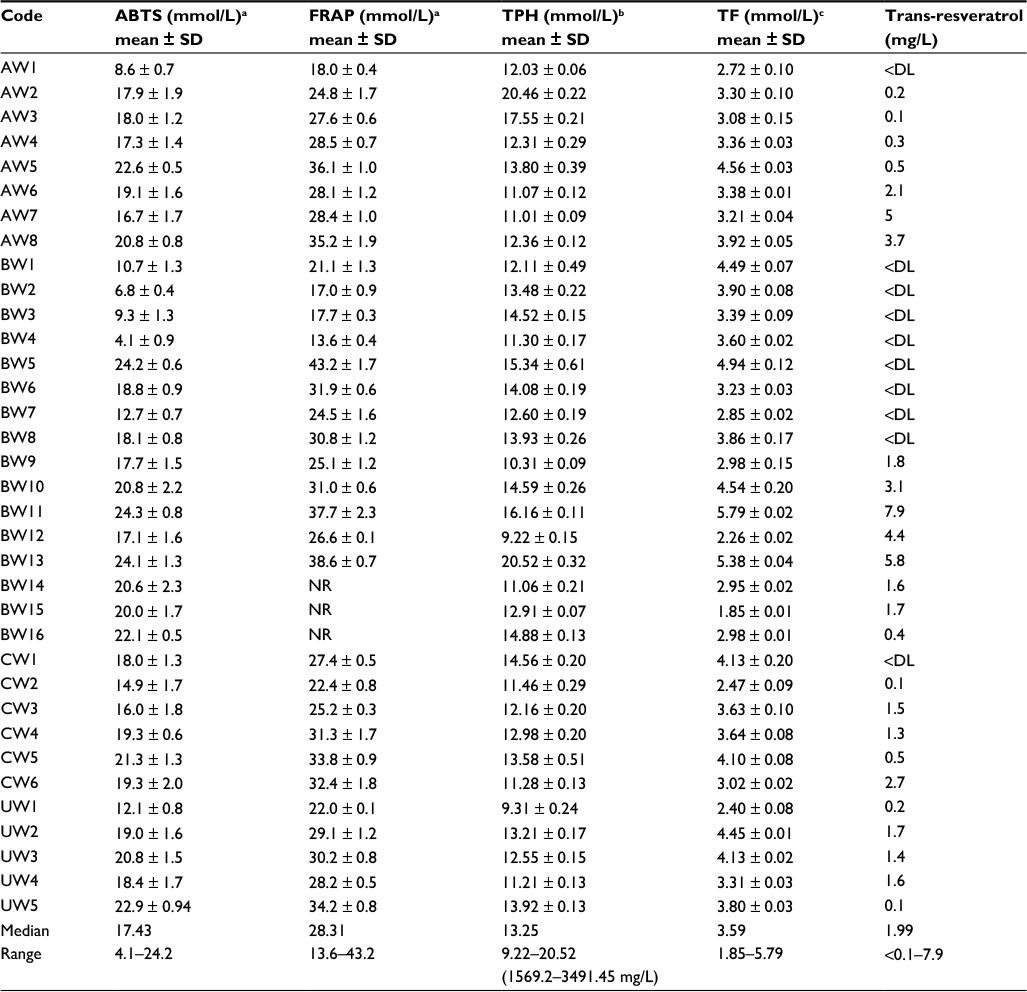 | Table 2 Antioxidant capacity determined by ABTS and FRAP methods, TPH, TF, and trans-resveratrol in South American red wines Notes: Data are expressed as mean ± SD of nine measurements. aResults are expressed in mmol/L of Trolox equivalents. bResults are expressed in mmol/L of gallic acid equivalents. cResults are expressed in mmol/L of catechin equivalents. Abbreviations: ABTS, 2,2′-azino-bis(3-ethylbenzotiazoline-6-sulfonic acid); FRAP, ferric-reducing antioxidant power; TPH, total phenolic content; TF, total flavonoids; DL, detection limit; NR, not reported. |
Total antioxidant capacity
The TAC results determined by the ABTS method showed the following ranges: 8.6–23 mmol/L for Argentinian red wines, 4.1–24 mmol/L for Bolivian red wines, 14.9–21.3 mmol/L for Chilean red wines, and 12–23 mmol/L for Uruguayan red wines. The overall average value found was 17.4 mmol/L, while the lowest and highest values were found in Bolivian red wines with 4.1 mmol/L for Terruño by Aranjuez and 24 mmol/L for Cabernet Sauvignon by Campos del Solana, respectively.
FRAP levels were in the range of 18–36 mmol/L for Argentinian red wines, 14–43 mmol/L for Bolivian red wines, 22–34 mmol/L for Chilean red wines, and 22–34 mmol/L for Uruguayan red wines. Similar to the ABTS method, the lowest and the highest values were found in Bolivian red wines Terruño by Aranjuez with 13.6 mmol/L and Cabernet Sauvignon by Kohlberg with 43.2 mmol/L, respectively.
Total phenolic content
Results for TPH showed variations among the different samples such as Argentinian samples which varied from 11 to 20 mmol/L, Bolivian samples that ranged from 9.2 to 20 mmol/L, Chilean red wines that ranged from 11 to 14 mmol/L, and Uruguayan red wines that ranged from 9.3 to 14 mmol/L. The overall average value among the samples found was 13.2 mmol/L.
The total range found was 9.20–20.50 mmol/L, which was equal to 1600–3500 mg GAEL/L of wine.
Total flavonoids
TF showed the following ranges: 2.7–4.6 mmol/L for Argentinian red wines, 1.8–5.8 mmol/L for Bolivian red wines, 2.5–4.1 mmol/L for Chilean red wines, and 2.4–4.4 mmol/L for Uruguayan red wines. Lowest and highest values corresponded to Bolivian red wines with 1.8 mmol/L for Syrah by 1750 brand and 5.8 mmol/L for Cabernet Sauvignon by Campos del Solana, respectively. The overall average value found was 3.6 mmol/L.
Resveratrol
Trans-resveratrol identification using HPLC with the proposed method showed a similar retention time, 11.5 minutes with the standard comparisons (20 ppm) (Figure 1), as well as the UV spectra showed one absorption band between 210 and 250 nm and the second one between 250 and 360 nm for the standards and samples (Figure 2). As displayed in Table 2, the trans-resveratrol content ranged from 0.1 to 5.0 mg/L in Argentinian red wines, 0.4 to 7.9 mg/L in Bolivian red wines, 0.1 to 2.7 mg/L in Chilean red wines, and 0.1 to 1.7 mg/L in Uruguayan red wines. The average mean concentration was 2.0 mg/L. The highest value for trans-resveratrol content was found in the Bolivian wines Cabernet Sauvignon by Campos del Solana with 7.9 mg/L. In contrast, the three lowest values of 0.1 mg/L were found in the Syrah by Santa Ana (Argentina), Syrah by Santa Carolina (Chile), and Cabernet Sauvignon by Pisano (Uruguay).
 | Figure 1 HPLC chromatogram for the trans-resveratrol identification comparing Campos del Solana and Cabenet Sauvignon 2012 (BW11) red (red line) wine sample and the trans-resveratrol standard 20 ppm (blue line). Abbreviation: HPLC, high-performance liquid chromatography. |
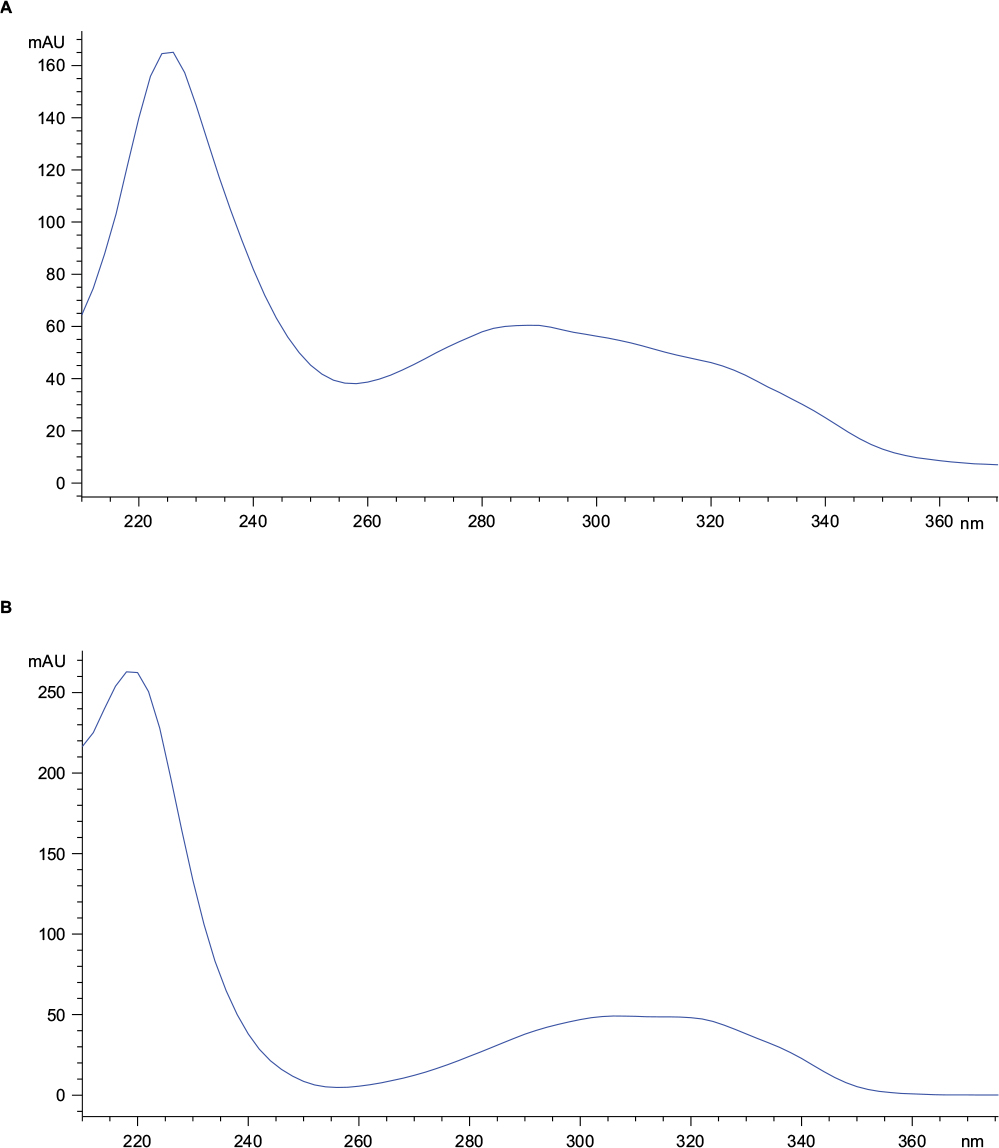 | Figure 2 HPLC UV spectra for the (A) trans-resveratrol standard of 20 ppm and (B) red wine sample (BW11) identification. Abbreviations: HPLC, high-performance liquid chromatography; UV, ultraviolet. |
Correlation analysis
The Pearson method was applied to examine correlation coefficients among the 35 different red wines. Highest correlations were found in TAC assays: ABTS versus FRAP, with r = 0.95 (P < 0.01) as shown in Figure 3, followed by TF versus FRAP result with r = 0.60 (P < 0.01), TPH versus TF with r = 0.51 (P < 0.01), and TF versus ABTS with r = 0.48 (P < 0.01). Other correlations were found for TPH versus FRAP with r = 0.36 (P < 0.05) and TPH versus ABTS with r = 0.35 (P < 0.05).
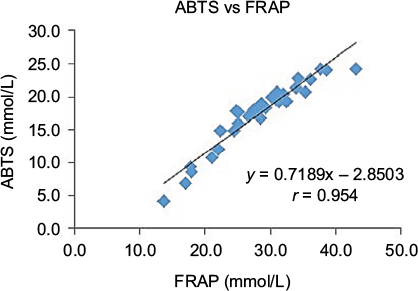 | Figure 3 Pearson correlation coefficients between ABTS and FRAP. Abbreviations: ABTS, 2,2′-azino-bis(3-ethylbenzotiazoline-6-sulfonic acid); FRAP, ferric-reducing antioxidant power. |
Determination of saccharides, saccharose, fructose, and glucose
According to our study (Table 3), highest values for fructose and glucose were found in Argentinian red wines, Casa de Campo (non-varietal wine) with 12 g/L and 8.6 g/L, respectively, as shown graphically in Figure 4. With regard to the saccharose content, the highest value was found in the Argentinian red wine, Cabernet Sauvignon (Santa Ana) with 10 g/L. In contrast, the lowest value for saccharose was found in the Bolivian red wines Tannat by 1750 brand with 0.38 g/L, while for glucose, the lowest value was found in the Chilean red wines Cabernet Sauvignon by Santa Carolina with 1.4 g/L. With respect to fructose, the lowest value corresponds to Argentinian red wines Cabernet Sauvignon by Misterio with 0.24 g/L.
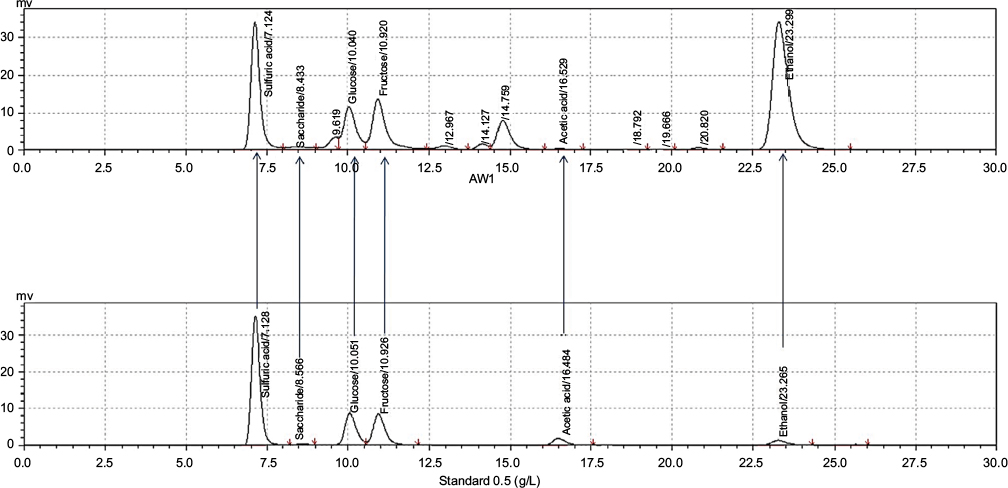 | Figure 4 HPLC chromatogram for the sample (AW1) showing the comparison among the peaks with saccharose, glucose, and fructose standard (0.5 g/L). Abbreviation: HPLC, high-performance liquid chromatography. |
 | Table 3 Saccharides concentrations in the different wines studied Abbreviation: DL, detection limit. |
Discussion
The TAC results are in accordance with previous data reported for red wines from different regions around the world. For instance, the range of 4.1–24 mmol/L determined by ABTS method was comparable with those previously found in Australian and Spanish red wines.17,18 Additionally, the range of 13.6–43.2 mmol/L determined by the FRAP methodology was analogous to the data reported in Italian red wines.19,20
The TPH levels of the South American red wines ranged from 1600 to 3500 mg GAE/L, which are in accordance with previous reports in the following: French;21 Brazilian, Chilean, and Portuguese;22 Italian;19 Australian;17 and Spanish23 red wines. For the TF, the mean average value found was 3.6 mmol/L in accordance with those previously reported in different South American red wines.24
The results for resveratrol were well within the range observed in previous studies in Hungarian,25 New Zealand,26 Greek,27 Italian,22 and Spanish28 red wines. They also agreed with previous observations in South American red wines.24
There are scarce data about the saccharides’ content in wines. However, the data obtained in the present study for glucose (3.4 g/L) and fructose (3.1 g/L) are in accordance with previous studies reported in French wines.12,29 General sources, such as the USDA, point to low levels of total saccharides in red wine, typically around 6 g/L (USDA food databases). However, in our material, we may note that the saccharose content is comparably high for some wines, up to about 10 g/L, possibly indicating a late dosage of saccharose to the wine. High values of fructose, as observed in some wines, possibly indicate an early halting of the fermentation, or possibly, a late dosage of grape juice or pure saccharose. We noticed that an increasing trend in remaining saccharides in red wines has been observed in Australian wines,30 from an average of 0.5 g/L in 1984 to about 2 g/L in 2014 (counted as glucose plus fructose). However, individual wines scatter up to about 35 g/L.
A PCA was used to reveal potential patterns within samples of South American varietal red wines present on the market. The results (Figure 5) showed some chemical correlations among the different countries. For instance, Bolivian wines represent one extreme, close to the first principal component characterized by high altitude, high resveratrol content, high TF content, high TAC by ABTS and FRAP methods, and high glucose. Opposite to that of Bolivia, Chilean wines represent low altitude, low resveratrol content, low TF content, low TAC by ABTS and FRAP methods, and low glucose. Uruguay’s vintage wines in this collection of samples represent low values for TPH, saccharose, and fructose, whereas Argentinian red wines appear close to the middle, showing an intermediate level of chemical analysis.
 | Figure 5 PCA plot representing all the parameters in the study, including countries, vintage, TAC, trans-resveratrol, TPH, TF, main saccharides, grape varieties, and altitude. Abbreviations: ABTS, 2,2′-azino-bis(3-ethylbenzotiazoline-6-sulfonic acid); FRAP, ferric-reducing antioxidant power; PCA, principal component analysis; TAC, total antioxidant capacity; TPH, total phenolic content; TF, total flavonoids. |
A PCA was also performed excluding the grape varieties and excluding the political boundaries as parameters, and the result is shown in Figure 6. The result suggests a positive correlation between high altitude and high resveratrol, TF, ABTS, FRAP, and glucose in the present samples, while on the contrary, there is an orthogonal correlation between low TPH, saccharose, and fructose with high vintage of the wines. It is interesting to note that this correlation comes through despite several actions by the wine makers to moderate the character of the wine, for instance, using the polyphenol-rich Tannat variety in the warm climate and low-land production of Uruguay and less astringent varieties such as Syrah and Cabernet in the high-altitude production. It is possible that the TPH content mainly originates from the oak and that it is precipitating during the aging and, thereby, is related to the wine vintage, whereas TF comes from the grape seed and tissues,31 affecting the TAC and flavonoid content, and also from being more dependent on the growing conditions of the grapes. In our material, this is reflected in the obtained correlation between altitude and the different antioxidant parameters.
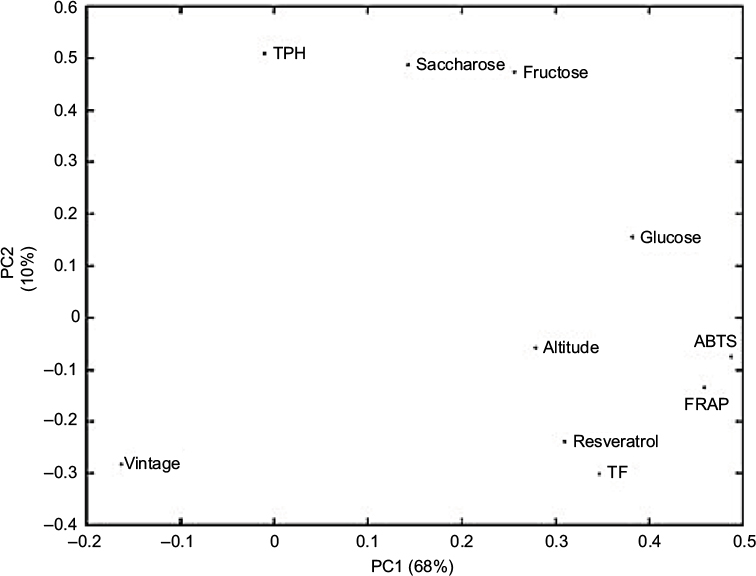 | Figure 6 PCA plot representing the following parameters in the study: vintage, TAC, trans-resveratrol, TPH, TF, main saccharides, and altitude. Abbreviations: ABTS, 2,2′-azino-bis(3-ethylbenzotiazoline-6-sulfonic acid); FRAP, ferric-reducing antioxidant power; PCA, principal component analysis; TAC, total antioxidant capacity; TPH, total phenolic content; TF, total flavonoids. |
The results acquired for TAC, TF, and resveratrol content from wines growing at high altitude (>1500 m.a.s.l.) above the sea level are in accordance with other studies obtained from grapes growing at high altitude above the sea level, where higher values for TAC and resveratrol content were found.14
In addition, it is important to note that non-varietal red wines showed the lowest values of TAC and had high saccharides content; furthermore, aging was found to be a noncontributor to the antioxidant values, since the oldest wines collected in this study were Uruguayan bottled in 2004 showing lower values for antioxidants.
Conclusion
As part of a larger research program in antioxidants in Bolivian foods,32 35 South American wines were analyzed with different methods to evaluate their antioxidant capacity, phenolic content, resveratrol, and main saccharides. As Bolivian wineries are mainly situated at 2000 m.a.s.l., the high altitude has an impact on the wine’s chemical properties, as shown in Figures 5 and 6. Consequently, according to the PCA, Bolivian red wines showed positive correlations among high resveratrol, TAC, TF, and high-altitude grape growth.
High levels of resveratrol and antioxidants found in Bolivian wines can be mainly attributed to the grapes grown at high altitude despite the aging process of other wines such as Uruguayan red wines from 2004 which can also increase the phenolic content.33 Additionally, other studies have found associations between the UV radiation and the increment of the phenolic content and thereby the antioxidant activity.9,14
However, the phenolic content comparison among the red wine samples can be difficult to interpret since the polyphenol content is affected by several factors, such as grape varieties, vinification techniques, aging, weather conditions, soil characteristics, and solar UV radiation, thereby affecting their analytical determinability and, thus, their general profile.34,35
This study provides new data about the chemical composition of wines from South America. It gives way to future research on the importance of the phenolic content in red wines from grapes growing at high altitude above the sea level, and the relationship it may have with the aggregation of polyphenols due to its influence on the organoleptic attributes.
Acknowledgment
This study was supported by the Swedish International Development Agency (SIDA) through a collaborative project between Universidad Mayor de San Andrés (UMSA, Bolivia) and Lund University (Sweden).
Disclosure
The authors report no conflicts of interest in this work.
References
Norrie P. Wine and Health Through the Ages with Special Reference to Australia [PhD thesis]. Sydney: School of Social Ecology and Lifelong Learning, University of Western Sydney; 2005. | ||
Biagi M, Bertelli AAE. Wine, alcohol and pills: what future for the French paradox? Life Sci. 2015;131:19–22. | ||
Yoo YJ, Saliba AJ, Prenzler PD. Should red wine be considered a functional food? Compr Rev Food Sci Food Saf. 2010;9(5):530–551. | ||
4. Halliwell B. Antioxidants in human health and disease. Annu Rev Nutr. 1996;16:33–50. | ||
Xiang L, Xiao L, Wang Y, Li H, Huang Z, He X. Health benefits of wine: don’t expect resveratrol too much. Food Chem. 2014;156:258–263. | ||
Boydens C, Pauwels B, Decaluwé K, Brouckaert P, Van De Voorde J. Relaxant and antioxidant capacity of the red wine polyphenols, resveratrol and quercetin, on isolated mice Corpora Cavernosa. J Sex Med. 2015;12(2):303–312. | ||
Stratil P, Kubán V, Fojtová J. Comparison of total phenolic content and total antioxidant activity in local red wines determined by spectrophotometric methods. Food Nutr Sci. 2014;5(5):1660–1667. | ||
Monagas M, Begoña B, Gomez-Cordovez C. Evolution of polyphenols in red wines from Vitis vinifera L during aging in the bottle. Eur Food Res Technol. 2005;220:331–340. | ||
Resurreccion VA, Potrebko I. Effect of ultraviolet doses in combined ultraviolet–ultrasound treatments on trans-resveratrol and trans-piceid contents in sliced peanut kernels. J Agric Food Chem. 2009;57:7750–7756. | ||
Cantos E, Espı JC, Toma FA. Postharvest induction modeling method using UV irradiation pulses for obtaining resveratrol-enriched table grapes: a new “functional” fruit? J Agric Food Chem. 2001; 49:5052–5058. | ||
Koone R, Harrington RJ, Gozzi M, Mccarthy M. The role of acidity, sweetness, tannin and consumer knowledge on wine and food match perceptions. J Wine Res. 2014;25(3):158–174. | ||
Shkotova LV, Piechniakova NY, Kukla OL, Dzyadevych SV. Thin-film amperometric multibiosensor for simultaneous determination of lactate and glucose in wine. Food Chem. 2016;197:972–978. | ||
Peñarrieta JM, Alvarado JA, Åkesson B, Bergenståhl B. Total antioxidant capacity and content of flavonoids and other phenolic compounds in canihua (Chenopodium pallidicaule): an Andean pseudocereal. Mol Nutr Food Res. 2008;52(6):708–717. | ||
Taquichiri M, Ayarde R, Gutierrez P. High levels of resveratrol in grapes cultivated at high altitude valleys in Bolivia. Int J Fruit Sci. 2014;14(3):311–326. | ||
Carrasco C, Baudel H, Peñarrieta M. Steam pretreatment and fermentation of the straw material “Paja Brava” using simultaneous saccharification and co-fermentation. J Biosci Bioeng. 2011;111(2):167–174. | ||
Peñarrieta JM, Alvarado JA, Bergenståhl B, Akesson B. Total antioxidant capacity and content of phenolic compounds in wild strawberries (Fragaria vesca) collected in Bolivia. Int J Fruit Sci. 2009:9;344–359. | ||
Ginjomm IR, D’Arcy BR, Caffin NA, Gidley MJ. Phenolic contents and antioxidant activities of major Australian red wines throughout the winemaking process. J Agric Food Chem. 2010;58;10133–10142. | ||
Villaño D, Fernández-Pachón MS, Troncoso AM, García-Parrilla MC. The antioxidant activity of wines determined by the ABTS(+) method: influence of sample dilution and time. Talanta. 2004;64:501–509. | ||
Versari A, Parpinello GP, Scazzina F, Rio DD. Prediction of total antioxidant capacity of red wine by Fourier transform infrared spectroscopy. Food Control. 2010;21(5):786–789. | ||
Pellegrini N, Serafini M, Colombi B, et al. Total antioxidant capacity of plant foods, beverages and oils consumed in Italy assessed by three different in vitro assays. J Nutr. 2003;133(9):2812–2819. | ||
Landrault N, Poucheret P, Ravel P, Gasc F, Cros G, Teissedre PL. Antioxidant capacities and phenolics levels of French wines from different varieties and vintages. J Agric Food Chem. 2001;49(7):3341–3348. | ||
Minussi RC, Rossi M, Bologna L, Pastore M, Dura N, Rotilio D. Phenolic compounds and total antioxidant potential of commercial wines. Food Chem. 2003;82:409–416. | ||
Moreno-Montoro M, Olalla-Herrera M, Gimenez-Martinez R, Navarro-Alarcon M, Rufián-Henares JA. Phenolic compounds and antioxidant activity of Spanish commercial grape juices. J Food Compos Anal. 2015;38:19–26. | ||
Granato D, Katayama FCU, De Castro IA. Phenolic composition of South American red wines classified according to their antioxidant activity, retail price and sensory quality. Food Chem. 2011;129(2):366–373. | ||
Nikfardjam MSP, Márk L, Avar P, Figler M, Ohmacht R. Polyphenols, anthocyanins, and trans-resveratrol in red wines from the Hungarian Villány region. Food Chem. 2006;98(3):453–462. | ||
Olejar KJ, Fedrizzi B, Kilmartin PA, John K, Kilmartin PA. Antioxidant activity and phenolic profiles of Sauvignon Blanc wines made by various maceration techniques. Australian J Grape Wine Res. 2011;21:57–69. | ||
Gortzi O, Metaxa X, Mantanis G, Lalas S. Effect of artificial ageing using different wood chips on the antioxidant activity, resveratrol and catechin concentration, sensory properties and colour of two Greek red wines. Food Chem. 2013;141(3):2887–2895. | ||
Navarro JJF, Castro VV, Ripoll II. Tackling pollution by organic farming is capable of increasing fortified foods. Int J Phytoremed. 2015;18(6):536–546. | ||
Sirén H, Sirén K, Sirén J. Evaluation of organic and inorganic compounds levels of red wines processed from Pinot Noir grapes. Anal Chem Res. 2015;3:26–36. | ||
Godden P, Wilkes E, Johnson D. Trends in the composition of Australian wine 1984–2014. Australian J Grape Wine Res. 2015;21:741–753. | ||
Bourzeix M, Weyland D, Heredia N, Desfeux N. Etude des catéchines et des procyanidols de la grappe de raisin, du vin et d’autres dérivés de la vigne [Study of catechins and procyanidols from bunch of grapes, wine and other vine derivatives]. Bull O I V. 1986;59:1171–1254. French [with English abstract]. | ||
Tejeda L, Alvarado JA, Dębiec M, et al. Relating genes in the biosynthesis of the polyphenol composition of Andean colored potato collection. Food Sci Nutr. 2013;2(1):46–57. | ||
Andrade P, Seabra R, Ferreira M, Ferreres F, García-Viguera C. Analysis of non-coloured phenolics in port wines by capillary zone electrophoresis. Influence of grape variety and ageing. Z Lebensm Unters Forsch A. 1998;206:161–164. | ||
Pérez-Magariño S, González-San José ML. Polyphenols and colour variability of red wines made from grapes harvested at different ripeness grade. Food Chem. 2006;96(2):197–208. | ||
Song J, Smart R, Wang H, Dambergs B, Sparrow A, Qian MC. Effect of grape bunch sunlight exposure and UV radiation on phenolics and volatile composition of Vitis vinifera L. cv. Pinot noir wine. Food Chem. 2015;173:424–431. |
 © 2018 The Author(s). This work is published and licensed by Dove Medical Press Limited. The full terms of this license are available at https://www.dovepress.com/terms.php and incorporate the Creative Commons Attribution - Non Commercial (unported, v3.0) License.
By accessing the work you hereby accept the Terms. Non-commercial uses of the work are permitted without any further permission from Dove Medical Press Limited, provided the work is properly attributed. For permission for commercial use of this work, please see paragraphs 4.2 and 5 of our Terms.
© 2018 The Author(s). This work is published and licensed by Dove Medical Press Limited. The full terms of this license are available at https://www.dovepress.com/terms.php and incorporate the Creative Commons Attribution - Non Commercial (unported, v3.0) License.
By accessing the work you hereby accept the Terms. Non-commercial uses of the work are permitted without any further permission from Dove Medical Press Limited, provided the work is properly attributed. For permission for commercial use of this work, please see paragraphs 4.2 and 5 of our Terms.