Back to Journals » OncoTargets and Therapy » Volume 9
Restoration of miR-20a expression suppresses cell proliferation, migration, and invasion in HepG2 cells
Authors Chen GS, Zhou N, Li J, Li T, Zhang Z, Si Z
Received 22 September 2015
Accepted for publication 24 December 2015
Published 27 May 2016 Volume 2016:9 Pages 3067—3076
DOI https://doi.org/10.2147/OTT.S96861
Checked for plagiarism Yes
Review by Single anonymous peer review
Peer reviewer comments 2
Editor who approved publication: Professor Daniele Santini
Guang Shun Chen, Ning Zhou, Jie-Qun Li, Ting Li, Zhong-Qiang Zhang, Zhong-Zhou Si
Department of Organ Transplantation and General Surgery, The Second Xiangya Hospital, Central South University, Changsha, People’s Republic of China
Objective: To study microRNA (miR)-20a expression in hepatocellular carcinoma (HCC) and its effects on the proliferation, migration, and invasion of HepG2.
Methods: The real-time polymerase chain reaction was used to detect the expression of miR-20a in HCC tissue and normal tissue, as well as in HCC cell lines and normal liver cells. miR-20a mimic and miR negative control (NC) were transfected into HepG2 cells. MTT (3-(4,5-dimethyl-2-thiazolyl)-2,5-diphenyl-2-H-tetrazolium bromide) assay was used to detect cell proliferation. Annexin fluorescein isothiocyanate/propidium iodide assay was run to examine the early apoptosis of cells. Transwell chamber assay was carried out to investigate the cell invasion and migration abilities.
Results: miR-20a was lowly expressed both in HCC tissues and HCC cell lines. After transfection of exogenous miR-20 mimics, miR-20a expression in HepG2 cells was significantly increased by 61.29% compared to the blank group (P<0.01). MTT assay showed that the growth of HepG2 cells in the miR-20a mimics group was significantly inhibited, and optical density values during the 36–96 hour time period were dramatically decreased compared to the blank group (P<0.01). Apoptosis rates of the miR-20a mimics group were higher than those of the blank and NC groups (both P<0.01). The number of HCC cells after transfection by miR-20a mimics in the G1 and S phases were 15.88% and 7.89%, respectively, which were lower than in the blank and NC groups (both P<0.05). Transwell assay showed that in the miR-20a mimics group the number of cell migration and invasion were 0.459 and 0.501 times that of the blank group (both P<0.01), and the migration and inhibition rates were 54.1% and 51.4%, respectively. After closing target gene CCND1 in HepG2 cells, the number of cell migration and invasion in the small interfering (si)-CCND1 group were 0.444 and 0.435 times that of the si-NC group (P<0.05); and compared to the si-NC group, the migration and inhibition rates were 55.6% and 56.5%, respectively.
Conclusion: miR-20a can inhibit the growth, invasion, and migration of HepG2 cells, and is therefore promising as a new molecular target for diagnosis and therapy of HCC.
Keywords: miR-20a, HepG2 cells, proliferation, migration, invasion
Introduction
Hepatocellular carcinoma (HCC), one of the most common malignant diseases, remains the third leading cause of cancer-related death in the world.1 An epidemiological study shows that there are more than 500,000 new patients with liver cancer every year worldwide, leading to about 600,000 deaths each year.2 Interestingly, the mortality rates of HCC are mainly related to late diagnosis and high tumor recurrence after surgery.3 The pathogenesis of HCC is not fully understood at present. It is generally believed that HCC is a complex, polygenic, and multistage pathology process. Alteration in microRNA (miR) expression influences tumor growth and metastasis at multiple stages of tumor progression, and deregulated miR expression is also found in hepatocarcinogenesis, modulating tumor cell growth, apoptosis, metastasis and invasion, and aggravating HCC.4,5
miRs are 21–25 nucleotide long noncoding RNA molecules that regulate gene expression by binding to complementary sequences in the 3′ untranslated region (UTR) to promote translational repression or messenger RNA (mRNA) degradation, which functions in RNA silencing and posttranscriptional regulation of gene expression.6,7 miR-20a is a member of the miR-17 miR precursor family, which also includes miR-19a/b, miR-20b, miR-93, and miR-106a/b.8 The effects of miR-20a on the proliferation, migration, and invasion of tumor cells have been studied for a long time.9 Moreover, preliminary research has shown the participation of miR-20a in the pathogenesis of many diseases, such as prostate cancer, gastric cancer, anaplastic thyroid cancer, and cervical cancer.9–13 A previous study reported that miR-20a was associated with HCC, while the effects of miR-20a on the proliferation, migration, and invasion of HepG2 remain to be explored.9 In this study, we investigated miR-20a expression in HCC and its effects on the proliferation, migration, and invasion of HepG2 cells.
Materials and methods
This study was approved by the Clinical Experiment Ethical Committee of Xiangya Hospital of Central South University, and written informed consents were obtained from all study subjects. HCC tissues in this study were obtained from a total of 51 patients undergoing liver tumor resection from December 2012 to February 2014 at The Second Xiangya Hospital, Central South University. Ten normal liver tissues from the liver hemangioma resection were used as the control group. The HepG2, Huh7, SMMC-7721, QGY-7701, QGY-7703, BEL-7404 cell lines, and normal liver cell lines were purchased from the cell bank of the Chinese Academy of Sciences (Shanghai, People’s Republic of China).
Cell culture and transfection
HCC cell lines HepG2, Huh7, SMMC-7721, QGY-7701, QGY-7703, BEL-7404, and normal liver cell line HL-7702 were cultured in Revolutions-Per-Minute Indicator-1640 (Thermo Fisher Scientific, Waltham, MA, USA) supplemented with 10% fetal bovine serum (Maverick, Melbourne, QLD, Australia). All cells were incubated at 37°C in a 100% humidified chamber supplemented with 5% CO2. The well-growing HepG2 cells were seeded to a six-well plate with the adjusted density of 3.0×10⁵ cells/well 24 hours before transfection. When the cells grew to 70% confluent, they were transfected by Lipofectamine™ 2000 (Thermo Fisher Scientific) according to the manufacturer’s instruction with cationic liposome transfection. Cells were divided into three groups (transfection reagent concentration of 50 nmol/L): miR-20a mimics group, negative control (NC) group, and blank group. The sequence of the miR-20a mimics was UAAAGUGCUUAUAGUGCAGGUAG (Shanghai GeneChem Co Ltd, Shanghai, People’s Republic of China), the sequence of NC group was CAGUACUUUUGUGUAGUACAA (Shanghai GeneChem Co Ltd).
Total RNA extraction and real-time (RT) quantitative polymerase chain reaction (qPCR)
Total RNA was extracted from tissues and cells after treatment using TRIzol reagent (Qiagen NV, Venlo, the Netherlands). The concentration and mass of total RNA was determined using NanoDrop ND-1000 (Thermo Fisher Scientific). Total RNA (0.5 μg) was then reverse transcribed using miR-20-specific reverse primer to obtain cDNA (Table 1). The relative level of miR-20a was determined using Fast Synergy Brands Green Master Mix method on ABI 7500 Real-time qPCR System (Thermo Fisher Scientific), with U6 as an internal control and 2−ΔΔCt as calculation method. Reaction system: cDNA (2 μL), forward primer (1 μL), reverse primer (1 μL), 2× Synergy Brands Green RT-qPCR Mix (10 μL), and sterilized distilled water (6 μL). Reaction condition: first 95°C (30 seconds), then 40 cycles of 95°C (30 seconds), 58°C (30 seconds), and 72°C (30 seconds).
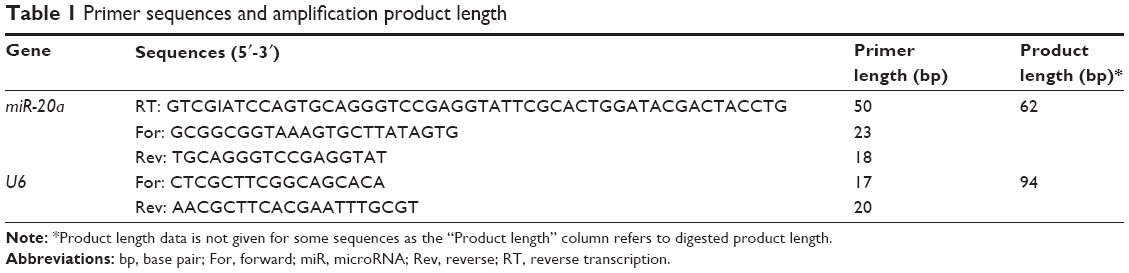 | Table 1 Primer sequences and amplification product length |
MTT assay for HepG2 cell proliferation
The well-growing HepG2 cells of miR-20 mimics group, NC group, and blank group were seeded to a 96-well plate (200 μL per well, six parallel holes in each group) with the adjusted density of 2.0×10³ cells/well. The blank control group was only treated with medium. MTT assay was conducted 12, 24, 48, 72, and 96 hours later. The optical density (OD) was measured with a spectrophotometer at 490 nm. The curve of OD value of cells was drawn with time as x-axis and absorbance as y-axis.
Cell cycle analysis by flow cytometry
The well-growing HepG2 cells of miR-20 mimics group, NC group, and blank group were fixed with 75% ethanol (precooling at 4°C) and then washed with phosphate buffer saline (PBS), centrifuged, incubated away from light with 0.1% RNAse A, and propidium iodide (PI; 500 μL, 100 g/mL ) at room temperature for 30 minutes. Finally, cell cycle was determined by flow cytometric analysis, repeated three times.
Annexin V-FITC/PI staining for early apoptosis evaluation
Cultured cells were suspended in PBS and counted. Resuspended cells (5–10×104) were centrifuged at 1,000 rpm for 5 minutes and resuspended in Annexin V-FITC binding buffer (195 μL) (BD Pharmingen, Franklin Lakes, NJ, USA). Annexin V-FITC (195 μL) was supplemented and the cells were incubated away from light at 20°C–25°C for 10 minutes. PI (10 μL) was further added, followed by incubation in the darkness. Apoptosis was quantified by using flow cytometry. CellQuestPro software (BD Biosciences, Franklin Lakes, NJ, USA) was used for analyzing apoptosis condition.
Transwell assay for cell migration and invasion measurement
After being transfected for 48 hours, HepG2 cells were cultured in a serum-free medium for 24 hours and then digested. The serum-free medium was used for adjusting the cell concentration to 2.5×10⁴/100 μL. In total, 100 μL of cell suspension was added to the upper compartment of the invasion chamber, and 500 μL of medium supplemented with 10% fetal bovine serum was added to the lower compartment. The upper compartment was then placed into a 24-well culture plate, marked, covered with a lid, and then cultured. The medium in the upper compartment was discarded by pipette. The 24-well plate then had 600 μL of methanol (4%) added to it, was put into formalin solution, and cultured with 150 μL absolute methanol for 15 minutes. The upper compartment was then placed into the 24-well plate after absolute methanol was removed from the upper compartment. The lower surface of the upper compartment was air dried naturally in a fume hood. Giemsa solution 1 was added, and after 1 minute, Giemsa solution 2 was added. The Transwell chamber was washed by 1× PBS (5 minutes ×3 times). The number of cell migration was counted under an inverted microscope at several random fields with a high-magnification visual field. The average value was calculated as the number of migrated cells. Mean ± standard deviation (SD) was calculated using the average number of cells in 6 high-power fields of view. Microscopic image acquisition system was used to observe and take pictures, using randomly selected 6 high-power fields of view (microscopic images of the number of cells to count the number of metastatic cells, and calculate the rate of invasion and migration inhibition). Invasion (migration) inhibition rate (%) = cell numbers through the membrane (mean, NC) – cell numbers through the membrane (mean, transfection group)/cell numbers through the membrane (mean, NC) × NC. For cell invasion assays, Transwell chamber was not coated by Matrigel. Other procedures were treated as migration assays.
Dual luciferase experiment
The cells were collected after 48 hours of transfection, rinsed once with PBS solution in order to absorb the PBS solution to the utmost extent. Eppendorf tube containing the cells had 1× passive lysis buffer solution (24-hole plate was 100 μL) added, and mixed in a table concentrator for 15 minutes. The 96-hole plate then had 10 μL lysate added, and appropriate amount of Stop & Glo detection liquid was inhaled to measure fluorescence value of firefly and Renilla (as reference) to calculate the ratio of firefly/Renilla.
Effect of closed target gene CCND1 on the migration and invasion of HepG2 by Transwell assay
The plasmids in small interfering (si)-CCND l group and si-NC group were synthesized by Shanghai GenePharma Co Ltd (Shanghai, People’s Republic of China), and added onto the corresponding glycerol solution. The target sequence of si-CCND l was: GGC GGA GGA GAA CAA ACA GAT, interference target sequence of si-CCND l: 3′-CGG TGT CTA CAC TTC AAG TAA AGT TCT CTT ACT TGA AGTGTA GAC ACC GAA AAAACCTAG-5′; design sequence of si-NC:GTT CTC CGA ACG TGT CAC GT; and the interference target sequence of si-NC was: 3′-CAA GAG GCT TGC ACA GTG CAG TGC TCT AAT GCA CTG TGC AAGCCT CTT AAA AAA CCT AG-5′. Two stable cell lines of stable expressed si-CCNDl (pGPU6/GFP/Neo-CCND1) transfected plasmid and si-NC (pGPU6/GFP/Neo-NC) transfected plasmid were constructed. Transwell assay was then conducted, and the specific steps were the same as in the “Transwell assay for cell migration and invasion measurement” section.
Statistical analysis
The results were presented as mean ± SD from at least three separate experiments. SPSS version 18.0 (SPSS Inc., Chicago, IL, USA) software was performed for statistical analysis. The comparison for the average values between the two groups were performed using Q-test or Dunnett’s test. The value of P<0.05 was considered as statistically significant.
Results
Comparison of miR-20a expression in HCC tissue, normal tissues, and HCC cells
The quality and integrity of RNA was determined by regular method.12 Small RNA was then reverse transcribed to obtain cDNA. The expression of miR-20a was determined using RT-qPCR system. From a fusion curve (Figure 1A), a single wave was observed, which meant that amplification products are single and there is no nonspecific amplification. An S-shaped amplification curve indicated an exponential growth of miR-20a. The plateau in the curve showed relatively higher amplification efficiency (Figure 1B). To conclude, the expression of miR-20a was shown to be lower in HCC tissues than in normal tissues (P<0.01). The expression in normal tissues was 29.86 times more than in HCC tissues (Figure 1C). Meanwhile, similar to the result in HCC tissues, miR-20a was lowly expressed in HCC cell lines (HepG2, Huh7, SMMC-7721, QGY-7701, QGY-7703, and BEL-7404) compared to normal liver cell HL-7702 (Figure 1D, all P<0.01), among which, the expression in HepG2 was the lowest.
 | Figure 1 Expression level of miR-20a in HCC versus normal tissues and cells detected by fluorescent quantitative PCR. |
miR-20a expression in HepG2 cells after transfection
Because of the significantly low expression of miR-20a in HepG2 cells, we furthered our research by upregulating the level of miR-20a expression. The expression of miR-20a was determined using RT-qPCR system 48 hours after transfection. miR-20a expression increased after transfection by miR-20a mimics, 3.42 times more than the NC group and 3.30 times more than the blank group (both P<0.01), while miR-20a expression in the NC and blank groups had no statistically significant difference (P>0.05) (Figure 2).
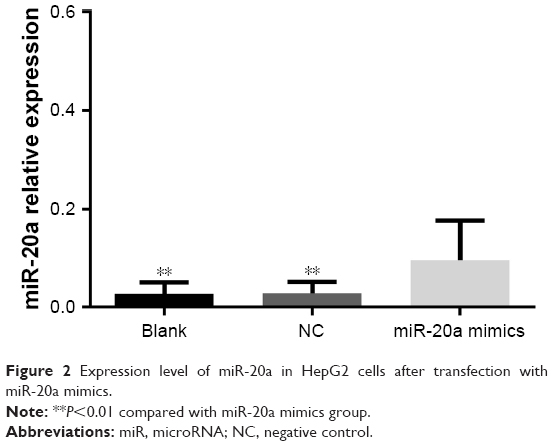 | Figure 2 Expression level of miR-20a in HepG2 cells after transfection with miR-20a mimics. |
miR-20a inhibits proliferation of HepG2 cells
According to the MTT assay, the growth rate of HepG2 cells in miR-20a mimics group was significantly suppressed after transfection with uprating miR-20a mimics. OD values during the 36–96 hour period decreased markedly compared to the blank and NC groups (P<0.01). The difference of growth ability between the NC and blank groups was not statistically significant (P>0.05) (Figure 3).
 | Figure 3 Effect of miR-20a on proliferation of HepG2 cells. |
Effects of miR-20a on the apoptosis and cell cycles of HepG2
The early apoptosis of cells in each group was detected by Annexin V-FITC Apoptosis Detection Kit (BD Pharmingen, NJ, Franklin Lakes, USA). Results showed that the proportions of apoptotic cells in each group were: blank group, 5.40%±0.64%; NC group, 5.42%±0.46%; and miR-20a mimics, 29.40%±2.05%. There was no significant difference of apoptosis rates between the blank and NC groups (P>0.05), while apoptosis rates in miR-20a mimics group was obviously higher than the blank and NC groups (P<0.01) (Figure 4A–C). As cell cycle research showed, the numbers of HCC cells after transfection by miR-20a mimics in G1 and S phase were 15.88% and 7.89%, respectively, which was significantly lower than the blank (G1=38.93%, S=26.62%) and NC groups (G1=46.23%, S=26.84%) (all P<0.05) (Figure 4D–F).
 | Figure 4 Effects of miR-20a on the apoptosis and cell cycles of HepG2 detected by flow cytometry. |
Effects of miR-20a on migration of HepG2 cells
Transwell assay showed that HepG2 cells were found moving from the top side of the membrane to the bottom side of the membrane after being incubated in the Boyden chemotaxis-chamber for 24 hours. One-way analysis of variance showed homoscedasticity, and the number of invasion cells in each group was statistically different (F=40.969, P=0.000). Dunnett’s test between groups indicated that, compared to the blank group, a less number of cells in miR-20a mimics groups passed through high-magnification migration chamber with migration inhibition rate of 54.1% (0.459 times that of the blank group), while there was no obvious difference between the NC and blank groups (P>0.05) (Figure 5).
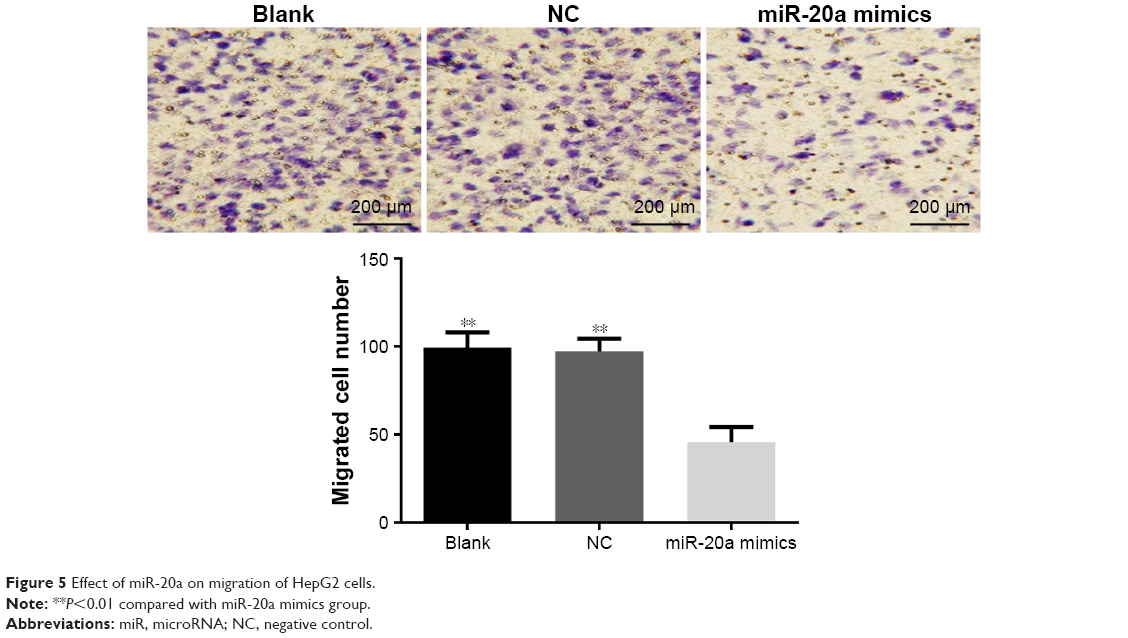 | Figure 5 Effect of miR-20a on migration of HepG2 cells. |
Effects of miR-20a on invasion of HepG2 cells
Transwell invasion assay showed that one-way analysis of variance showed homoscedasticity and the number of invasion cells in each group was statistically different (F=14.922, P=0.000). Dunnett’s test between groups indicated that, compared to the blank group, an obviously less number of cells in miR-20a mimics groups passed through the high-magnification invasion chamber, with invasion inhibition rate of 51.4% (0.501 times that of the blank group, P<0.01), while there was no obvious difference between the NC and blank groups (P>0.05) (Figure 6).
 | Figure 6 Effect of miR-20a on invasion of HepG2 cells. |
Bioinformatics prediction and verification of fluorescence report vector for target gene of miR-20a
Bioinformatics software Target Scan (http://www.targetscan.org) was used to predict and screen the target gene of miR-20a, and we found that 3′-UTR sequence of CCND1 was matched with miR-20a (Figure 7A). Compared with the control group, miR-20a could inhibit the luciferase activity of CCND1 3′-UTR reporter gene, but no significant effect on the luciferase activity of target site deleted mutant reporter gene was reported (Figure 7B). The earlier results showed that miR-20a can inhibit the activity of the reporter gene of target gene by combining with the target sequence of CCND1 3′-UTR target gene.
 | Figure 7 CCND1 was the target gene of miR-20a. |
Effect of closed target gene CCND1 on the migration ability of HepG2 cells
Transwell assay showed that after closing the target gene CCND1 in HepG2 cells, the number of cells of the average per high-power field migration chamber in si-CCND1 group was significantly decreased when compared with the si-NC group (P<0.05), and the number of cell migration was 0.444 times that of the si-NC group, with the migration rate of 55.6% (Figure 8).
 | Figure 8 Effect of closed target gene CCND1 on the migration ability of HepG2 cells. |
Effect of closed target gene CCND1 on the invasion ability of HepG2 cells
Transwell assay demonstrated that after closing target gene CCND1 in HepG2 cells, the number of cells of the average per high-power field invasion chamber in si-CCND1 group was remarkably decreased when compared with the si-NC group (P<0.05), and the number of cell invasion was 0.435 times that of the si-NC group, with the invasion rate of 56.5% (Figure 9).
 | Figure 9 Effect of closed target gene CCND1 on the invasion ability of HepG2 cells. |
Discussion
The proliferation, migration, invasion, and apoptosis of HepG2 cells have been extensively explored, and the different expressions of genes and proteins were ascertained to be associated with HepG2 cells.14,15 Especially at the genetic level, various kinds of genes plus miR are found to be closely associated with HepG2 cells. Guzmán et al16 reported that fatty acid binding protein-5 could suppress invasion ability of HepG2 cells by increasing its apoptosis. A previous study also provided the evidence that miR-34a inhibits migration and invasion by downregulation of c-Met expression in human HCC cells.17 In addition, miR-21 is indicated to regulate cell proliferation, invasion, migration, and apoptosis in HepG2 cells.18 Fan et al19 in his study found that restoration of miR-20a inhibited cell proliferation and induced cell apoptosis of HCC by directly targeting Mcl-1 3′-UTR, and miR-20a was suggested to be a significant prognostic factor for patients with HCC. However, in our study, we focused on miR-20a expression in HCC and its effects on the proliferation, migration, and invasion of HepG2 cells, and we also explored the effects of CCND1 target gene of miR-20a on the invasion and metastasis of HepG2 cells. According to our present study, we confirmed that a decreased expression level of miR-20a was found in HCC tissues and HCC cell lines.
Similar to other members of miR-17-92 miR cluster, miR-20a serves as an oncogene with high expression levels in most cancer cells, such as non-small-cell lung cancer, prostate cancer, gastric carcinoma.20–22 While in other types of cancers, such as gastrointestinal stromal tumors, pancreatic cancer, and breast cancers, miR-20a plays a tumor suppressor role.23–25 The different roles of miR-20a may result from the difference of specificity and type of various tumor tissue, experimental research methods, miR-20a target genes in HepG2 cells or regulation mechanism. In our study, MTT assay results showed that miR-20a could inhibit the proliferation of HepG2 cells after the overexpression of miR-20a in HepG2 cells. Through Annexin V-FITC apoptosis assay, we concluded that miR-20a increased the apoptosis of HepG2 cells. Transwell invasion assay showed that the invasion ability of HepG2 cells was decreased. A previous study reported that the intracellular mechanism of miR was probably blocking the mRNA from being translated, or accelerate its degradation through complete or incomplete complementary pairing in the area of 3′-UTR region of mRNA target gene.25 Sen et al proposed that high expression of miR-20a in glioma stem cells was found, which resulted from downregulating tissue inhibitor of metalloproteinase-2 expression.26 From research about prostate cancer, Qiang et al20 reported that ABL2 is one target gene of miR-20a. In the present study, we observed miR-20a had low expression in HepG2 cells and inhibited the proliferation, migration, and invasion of HepG2 cells. Therefore, we presume that miR-20a increases the expression of related suppressor genes, its target genes or kinds of oncogenes, and suppresses the apoptosis, migration, and invasion of HepG2 cells by inhibiting those oncogenes.
The results in Transwell assay demonstrated that CCND1 was the target gene of miR-20a, and CCND1 had effects on the migration and invasion ability of HepG2 cells. CCND1 is known as a cell cycle control protein, which mainly affects G1 progression and G1/S transition. It acts as a regulatory subunit of CDK6 or CDK4, whose activity is essential for cell cycle G1/S transition.27 Additionally, mechanisms of gene amplification, rearrangements, gene polymorphisms, and posttranscriptional or posttranslational modifications could contribute to abnormal protein levels as well as impaired CCND1 function, which could result in carcinogenesis.28 Similar to the results in our study, a recent study has shown that CCND1 plays a significant role in cell migration and invasion, and noncoding miRs act as important modulators of CCND1; CCND1 was found to be a target gene of miR by analyzing the complementary sequences of miRs with CCND1 mRNA.29
Conclusion
miR-20a serves as a suppressor gene. Therefore, it may provide a molecular theoretical basis for treatment of HCC in the future by upregulating miR-20a expression in HepG2 cells, and therefore, miR-20a is expected to become a new target in the diagnosis and therapy of HCC. However, further research is still needed to explore the action of miR-20a on HepG2 cells through modulation of the signaling pathway.
Disclosure
The authors report no conflicts of interest in this work.
References
Forner A, Llovet JM, Bruix J. Hepatocellular carcinoma. Lancet. 2012;379(9822):1245–1255. | ||
Tu T, Budzinska MA, Maczurek AE, et al. Novel aspects of the liver microenvironment in hepatocellular carcinoma pathogenesis and development. Int J Mol Sci. 2014;15(6):9422–9458. | ||
Maurel M, Samali A, Chevet E. Endoplasmic reticulum stress: at the crossroads of inflammation and metabolism in hepatocellular carcinoma development. Cancer Cell. 2014;26(3):301–303. | ||
Zheng F, Liao YJ, Cai MY, et al. The putative tumour suppressor microrna-124 modulates hepatocellular carcinoma cell aggressiveness by repressing rock2 and ezh2. Gut. 2012;61(2):278–289. | ||
Yu P, Wu D, You Y, et al. Mir-208-3p promotes hepatocellular carcinoma cell proliferation and invasion through regulating arid2 expression. Exp Cell Res. 2015;336(2):232–241. | ||
Ceppi P, Peter ME. MicroRNAs regulate both epithelial-to-mesenchymal transition and cancer stem cells. Oncogene. 2014;33(3):269–278. | ||
Ambros V. The functions of animal microRNAs. Nature. 2004; 431(7006):350–355. | ||
Tanzer A, Stadler PF. Molecular evolution of a microRNA cluster. J Mol Biol. 2004;339(2):327–335. | ||
Zhao S, Yao D, Chen J, Ding N, Ren F. Mir-20a promotes cervical cancer proliferation and metastasis in vitro and in vivo. PLoS One. 2015;10(3):e0120905. | ||
Shen J, Hruby GW, McKiernan JM, et al. Dysregulation of circulating microRNAs and prediction of aggressive prostate cancer. Prostate. 2012;72(13):1469–1477. | ||
Li X, Zhang Z, Yu M, et al. Involvement of mir-20a in promoting gastric cancer progression by targeting early growth response 2 (egr2). Int J Mol Sci. 2013;14(8):16226–16239. | ||
Heera R, Sivachandran P, Chinni SV, et al. Efficient extraction of small and large RNAs in bacteria for excellent total RNA sequencing and comprehensive transcriptome analysis. BMC Res Notes. 2015;8(1):754. | ||
Xiong Y, Zhang L, Kebebew E. Mir-20a is upregulated in anaplastic thyroid cancer and targets limk1. PLoS One. 2014;9(5):e96103. | ||
Kaul R, Saha P, Saradhi M, et al. Overexpression of hyaluronan-binding protein 1 (habp1/p32/gc1qr) in hepg2 cells leads to increased hyaluronan synthesis and cell proliferation by up-regulation of cyclin d1 in akt-dependent pathway. J Biol Chem. 2012;287(23):19750–19764. | ||
Liu W, Xu C, Wan H, et al. MicroRNA-206 overexpression promotes apoptosis, induces cell cycle arrest and inhibits the migration of human hepatocellular carcinoma hepg2 cells. Int J Mol Med. 2014;34(2):420–428. | ||
Guzmán C, Benet M, Pisonero-Vaquero S, et al. The human liver fatty acid binding protein (FABP1) gene is activated by FOXA1 and PPARα; and repressed by C/EBPα: Implications in FABP1 down-regulation in nonalcoholic fatty liver disease. Biochim Biophys Acta. 2013;1831(4):803–818. | ||
Li N, Fu H, Tie Y, et al. Mir-34a inhibits migration and invasion by down-regulation of c-met expression in human hepatocellular carcinoma cells. Cancer Lett. 2009;275(1):44–53. | ||
Mao B, Xiao H, Zhang Z, Wang D, Wang G. MicroRNA21 regulates the expression of btg2 in hepg2 liver cancer cells. Mol Med Rep. 2015;12(4):4917–4924. | ||
Fan MQ, Huang CB, Gu Y, Xiao Y, Sheng JX, Zhong L. Decrease expression of microRNA-20a promotes cancer cell proliferation and predicts poor survival of hepatocellular carcinoma. J Exp Clin Cancer Res. 2013;32(1):21. | ||
Geng Q, Fan T, Zhang B, Wang W, Xu Y, Hu H. Five microRNAs in plasma as novel biomarkers for screening of early-stage non-small cell lung cancer. Respir Res. 2014;15:149. | ||
Qiang XF, Zhang ZW, Liu Q, et al. Mir-20a promotes prostate cancer invasion and migration through targeting abl2. J Cell Biochem. 2014;115(7):1269–1276. | ||
Kim BH, Hong SW, Kim A, Choi SH, Yoon SO. Prognostic implications for high expression of oncogenic microRNAs in advanced gastric carcinoma. J Surg Oncol. 2013;107(5):505–510. | ||
Gits CM, van Kuijk PF, Jonkers MB, et al. Mir-17-92 and mir-221/222 cluster members target kit and etv1 in human gastrointestinal stromal tumours. Br J Cancer. 2013;109(6):1625–1635. | ||
Gayral M, Jo S, Hanoun N, et al. MicroRNAs as emerging biomarkers and therapeutic targets for pancreatic cancer. World J Gastroenterol. 2014;20(32):11199–11209. | ||
Li JY, Zhang Y, Zhang WH, Jia S, Kang Y, Zhu XY. Differential distribution of mir-20a and mir-20b may underly metastatic heterogeneity of breast cancers. Asian Pac J Cancer Prev. 2012;13(5):1901–1906. | ||
Sen CK, Roy S. MiRNA: Licensed to kill the messenger. DNA Cell Biol. 2007;26(4):193–194. | ||
Guo L, Xue TY, Xu W, Gao JZ. Matrine promotes g0/g1 arrest and down-regulates cyclin d1 expression in human rhabdomyosarcoma cells. Panminerva Med. 2013;55(3):291–296. | ||
Hsia TC, Liu CJ, Lin CH, et al. Interaction of ccnd1 genotype and smoking habit in Taiwan lung cancer patients. Anticancer Res. 2011;31(10):3601–3605. | ||
Cai CK, Zhao GY, Tian LY, et al. Mir-15a and mir-16-1 downregulate CCND1 and induce apoptosis and cell cycle arrest in osteosarcoma. Oncol Rep. 2012;28(5):1764–1770. |
 © 2016 The Author(s). This work is published and licensed by Dove Medical Press Limited. The
full terms of this license are available at https://www.dovepress.com/terms
and incorporate the Creative Commons Attribution
- Non Commercial (unported, 3.0) License.
By accessing the work you hereby accept the Terms. Non-commercial uses of the work are permitted
without any further permission from Dove Medical Press Limited, provided the work is properly
attributed. For permission for commercial use of this work, please see paragraphs 4.2 and 5 of our Terms.
© 2016 The Author(s). This work is published and licensed by Dove Medical Press Limited. The
full terms of this license are available at https://www.dovepress.com/terms
and incorporate the Creative Commons Attribution
- Non Commercial (unported, 3.0) License.
By accessing the work you hereby accept the Terms. Non-commercial uses of the work are permitted
without any further permission from Dove Medical Press Limited, provided the work is properly
attributed. For permission for commercial use of this work, please see paragraphs 4.2 and 5 of our Terms.