Back to Journals » Clinical Epidemiology » Volume 12
Replicating Randomized Trial Results with Observational Data Using the Parametric g-Formula: An Application to Intravenous Iron Treatment in Hemodialysis Patients
Authors Karaboyas A ![]() , Morgenstern H, Fleischer NL, Schaubel DE, Robinson BM
, Morgenstern H, Fleischer NL, Schaubel DE, Robinson BM
Received 22 September 2020
Accepted for publication 27 October 2020
Published 11 November 2020 Volume 2020:12 Pages 1249—1260
DOI https://doi.org/10.2147/CLEP.S283321
Checked for plagiarism Yes
Review by Single anonymous peer review
Peer reviewer comments 2
Editor who approved publication: Dr Eyal Cohen
Angelo Karaboyas,1,2 Hal Morgenstern,3 Nancy L Fleischer,2 Douglas E Schaubel,4,5 Bruce M Robinson1,6
1Arbor Research Collaborative for Health, Ann Arbor, MI, USA; 2University of Michigan, Department of Epidemiology, Ann Arbor, MI, USA; 3University of Michigan, Departments of Epidemiology and Environmental Health Sciences, School of Public Health, and Department of Urology, Medical School, Ann Arbor, MI, USA; 4University of Michigan, Department of Biostatistics, Ann Arbor, MI, USA; 5University of Pennsylvania, Department of Biostatistics, Epidemiology and Informatics, Philadelphia, PA, USA; 6University of Michigan, Department of Internal Medicine, Ann Arbor, MI, USA
Correspondence: Angelo Karaboyas
Arbor Research Collaborative for Health, 3700 Earhart Road, Ann Arbor, MI 48105, USA
Tel +1 (734) 665-4108
Email [email protected]
Background: Reproducibility of clinical and epidemiologic research is important to generalize findings and has increasingly been scrutinized. A recently published randomized trial, PIVOTAL, evaluated high vs low intravenous iron dosing strategies to manage anemia in hemodialysis patients in the UK. Our objective was to assess the reproducibility of the PIVOTAL trial findings using data from a well-established cohort study, the Dialysis Outcomes and Practice Patterns Study (DOPPS).
Methods: To overcome the absence of randomization in the DOPPS, we applied the parametric g-formula, an extension of standardization to longitudinal data. We estimated the effect of a proactive high-dose vs reactive low-dose iron supplementation strategy on all-cause mortality (primary outcome), hemoglobin, two measures of iron concentration (ferritin and TSAT), and erythropoiesis-stimulating agent dose over 12 months of follow-up in 6325 DOPPS patients.
Results: Comparing high- vs low-iron dose strategies, the 1-year mortality risk difference was 0.020 (95% CI: 0.008, 0.031) and risk ratio was 1.20 (95% CI: 1.07, 1.33), compared with null 1-year findings in the PIVOTAL trial. Differences in secondary outcomes were directionally consistent but of lesser magnitude than in the PIVOTAL trial.
Conclusion: Our findings are somewhat consistent with the recent PIVOTAL trial, with discrepancies potentially attributable to model misspecification and differences between the two study populations. In addition to the importance of our results to nephrologists and hence hemodialysis patients, our analysis illustrates the utility of the parametric g-formula for generalizing results and comparing complex and dynamic treatment strategies using observational data.
Keywords: reproducibility, causal inference, nephrology, dialysis, anemia, iron
Background
Large high-quality randomized trials are costly, time-consuming, and inflexible to different selection criteria and intervention protocols, and are often impractical or unethical to conduct. A practical alternative is to apply the parametric g-formula, an extension of standardization to longitudinal data, which is well suited to evaluate complex and dynamic treatment strategies using observational data.1–6 In this study, we present an application to anemia treatment in patients with end-stage kidney disease undergoing hemodialysis 3 times/week. Conflicting evidence from observational data exists regarding the safety of high-dose intravenous (IV) iron supplementation in hemodialysis patients.7–12 IV iron is often administered to complement erythropoiesis-stimulating agent (ESA) treatment and avoid iron deficiency by replacing the iron utilized for erythropoiesis.13 IV iron dosing decisions are, in the context of hemoglobin level, guided primarily by serum ferritin, a marker of iron stores, and transferrin saturation (TSAT), a marker of circulating iron.14 Investigators of the Proactive IV Iron Therapy in Haemodialysis Patients (PIVOTAL) study, a large, open-label, UK-based randomized controlled trial, concluded that a proactive high-dose (vs reactive low-dose) IV iron treatment regime was superior.15
The first objective of our study is to replicate findings from the PIVOTAL trial by applying the parametric g-formula to hemodialysis patients in the European arm of the Dialysis Outcomes and Practice Patterns Study (DOPPS), where anemia management practices are relatively similar to the UK.16 The second objective is to simulate the PIVOTAL study in a similar trial population by applying the parametric g-formula to DOPPS patients restricted according to PIVOTAL inclusion criteria. If the hypothetical target trial we emulate is similar enough to the actual trial, the PIVOTAL findings should be replicable in our simulation. The potential to evaluate many variations of complex intervention strategies across different populations using the parametric g-formula could prove to be enormously informative in the age of big data.
Methods
Data Source
The DOPPS is a prospective cohort study of center-based, adult chronic hemodialysis patients in 21 countries, ongoing since 1996. Study sites and patients are randomly selected to achieve nationally representative samples in each country. Details on study design and objectives are included in prior publications17,18 and at https://www.DOPPS.org/. Study approval and patient consent were obtained as required by national and local ethics committee regulations. This analysis included a cohort of hemodialysis patients from 7 European countries (Belgium, France, Germany, Italy, Spain, Sweden, UK) in DOPPS Phase 4 (2009–2011) and Phase 5 (2012–2015). Information on patient demographics and comorbidity history was abstracted from medical records at DOPPS enrollment. Measured laboratory values and medication prescriptions were abstracted from medical records at baseline and monthly during follow-up.
Protocol
We designed a target trial to match the PIVOTAL trial19 as closely as possible, and then utilized DOPPS data to emulate this target trial (and thus, the PIVOTAL trial itself). In the PIVOTAL trial,15 the IV iron dose assigned each month depended on the most recent values of ferritin and TSAT. In the proactive high-dose arm, 400 mg IV iron was administered monthly unless upper thresholds of ferritin (>700 ng/mL) or TSAT (>40%) were reached, in which case iron was withheld for 1 month. In the reactive low-dose arm, 100, 200, or 400 mg of IV iron was administered monthly, depending on levels of TSAT and ferritin (Table 1), with IV iron withheld if ferritin >700 ng/mL, TSAT >40%, or both ferritin >200 ng/mL and TSAT >20%. Protocol details and the extent to which we were able to emulate the trial are included in the Supplementary Methods and Table S1, as recommended by Lodi et al.20
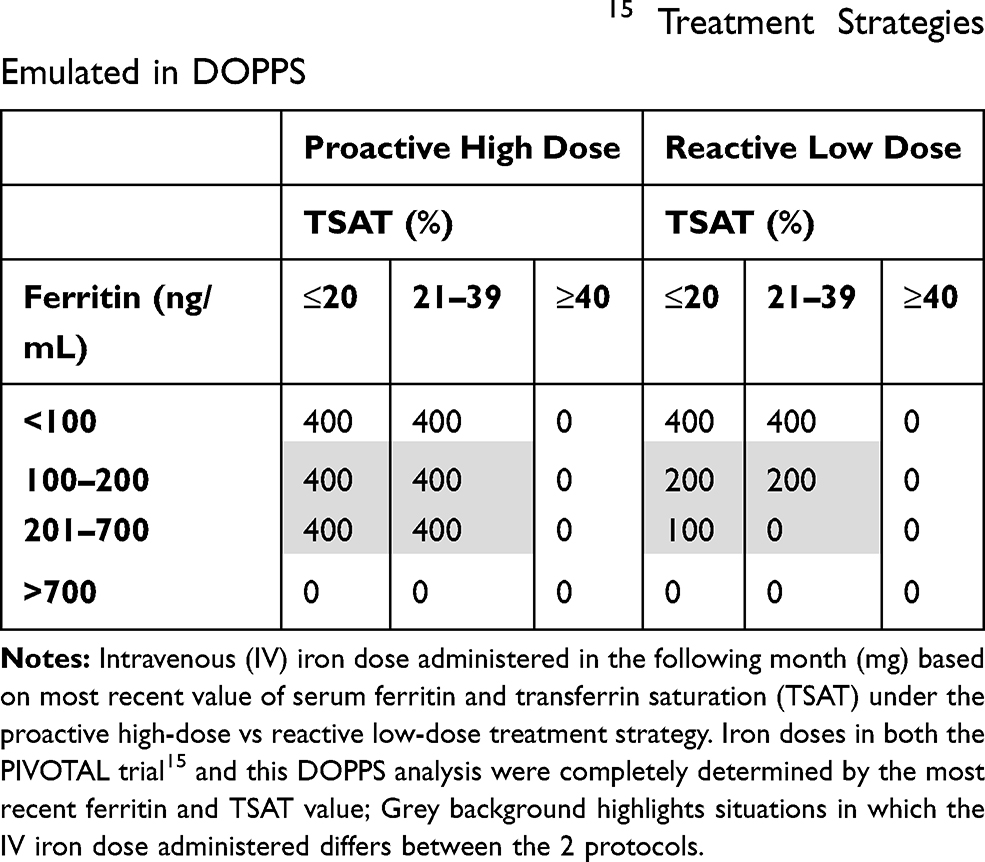 |
Table 1 Summary of PIVOTAL Trial15 Treatment Strategies Emulated in DOPPS |
Statistical Analysis
To test the high vs low-dose IV iron treatment strategies, we implemented the parametric g-formula to account for the treatment (IV iron) – confounder (ferritin, TSAT) feedback loop (Figure 1). The two primary steps of the parametric g-formula are (Step 1) modeling the joint distribution of all variables (Table 2) and (Step 2) simulating variables over the follow-up period using the estimates from Step 1. These steps are described in detail in the Supplementary Methods. Additional details related to the formulae and assumptions have been previously reported.2,21
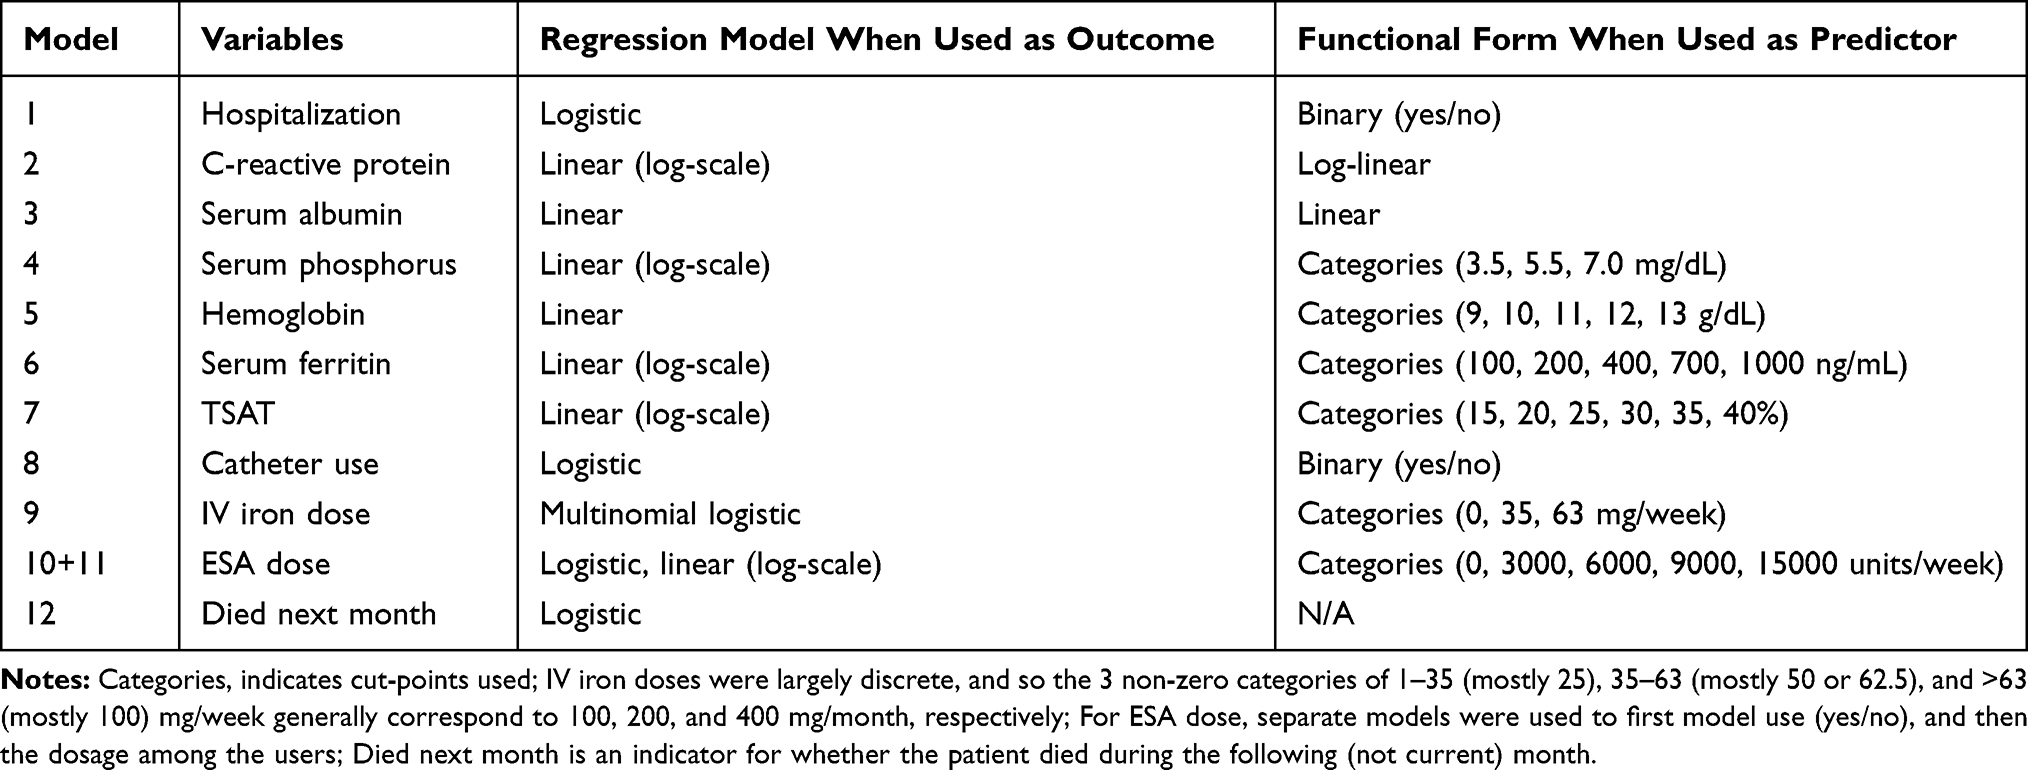 |
Table 2 Summary of Step 1 Models and Covariates |
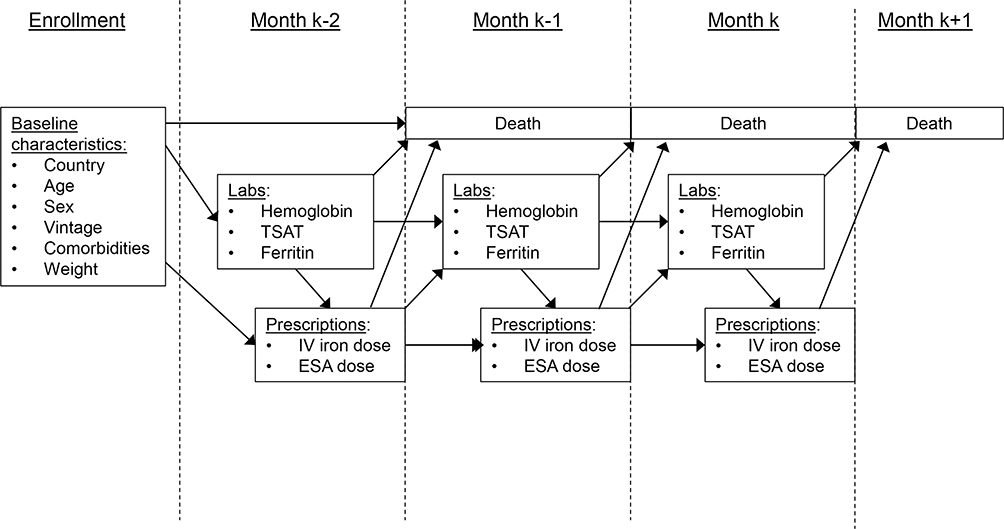 |
Figure 1 Illustration of longitudinal data collection and hypothesized relationships. |
For our second objective, we attempt to more closely replicate results from the PIVOTAL trial by restricting our DOPPS sample based on PIVOTAL inclusion criteria. We excluded patient-months (not patients) that did not meet the criteria for inclusion; then prior to Step 1, for each patient, we selected as the new “baseline” the first month that the patient met PIVOTAL eligibility criteria.19 Figure 2 summarizes these criteria and how we attempted to replicate each criterion in DOPPS. Step 1 models included the baseline month and all subsequent patient-months for eligible patients; Step 2 was then carried out as in the primary analysis.
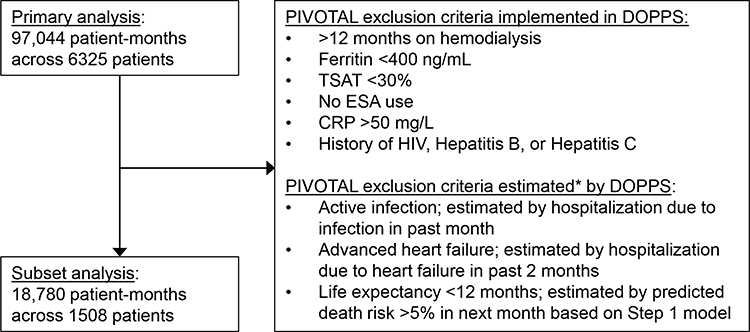 |
Figure 2 Flow diagram with PIVOTAL trial15 exclusion criteria. |
We reported 12-month trajectories for all modeled variables and mortality risk for: (1) observed DOPPS data; (2) natural course (expected) simulation; (3) PIVOTAL high-dose simulation; and (4) PIVOTAL low-dose simulation. We sought to make three comparisons: observed data vs natural course simulation (1 vs 2) to check for model misspecification; PIVOTAL high vs low-dose (3 vs 4) simulations to assess the treatment strategies; and simulated PIVOTAL strategies vs the published PIVOTAL trial15 data to assess how closely our parametric g-formula results matched a real randomized trial. From our simulations, we reported the 1-year mortality risk ratio (RR) and risk difference (RD) comparing the two PIVOTAL strategies. Confidence intervals (CIs) were estimated by combining multiple imputations with bootstrapping based on the “MI boot (pooled sample)” procedure22 previously implemented by Karaboyas et al.23 We also performed a complete-case sensitivity analysis. In general, we relied on published g-formula analyses by Taubman24 and others,2,21,25–27 following their step-by-step approach to help guide our analysis coded using SAS version 9.4 (SAS institute, Cary, NC).
Results
Study Sample
Models in Step 1 utilized data from 97,044 patient-months across 6325 patients; the median (interquartile range [IQR]) number of months contributed by each patient was 15.9,26 Table 3 shows baseline patient characteristics for1 the full DOPPS sample used in our primary analysis (N=6325);2 the DOPPS subset after restricting based on PIVOTAL eligibility criteria (N=1508); and3,4 PIVOTAL patients randomized to the high-dose and low-dose IV iron treatment protocols. Note that blank cells in the PIVOTAL columns represent variables not reported in the PIVOTAL (Table 1).15 There were several key differences between DOPPS patients and PIVOTAL participants: DOPPS patients were older, had been on hemodialysis for a longer period, weighed less, had higher levels of serum ferritin, TSAT, and hemoglobin, and were more likely to have a history of heart failure, hypertension, and peripheral vascular disease. Some of these differences were neutralized by further restriction of the DOPPS data based on PIVOTAL eligibility criteria (eg, time since hemodialysis start, ferritin, TSAT), but others were not (eg, age, weight, hemoglobin, comorbidity history). The extent of missing data in each sample is shown in Table S2.
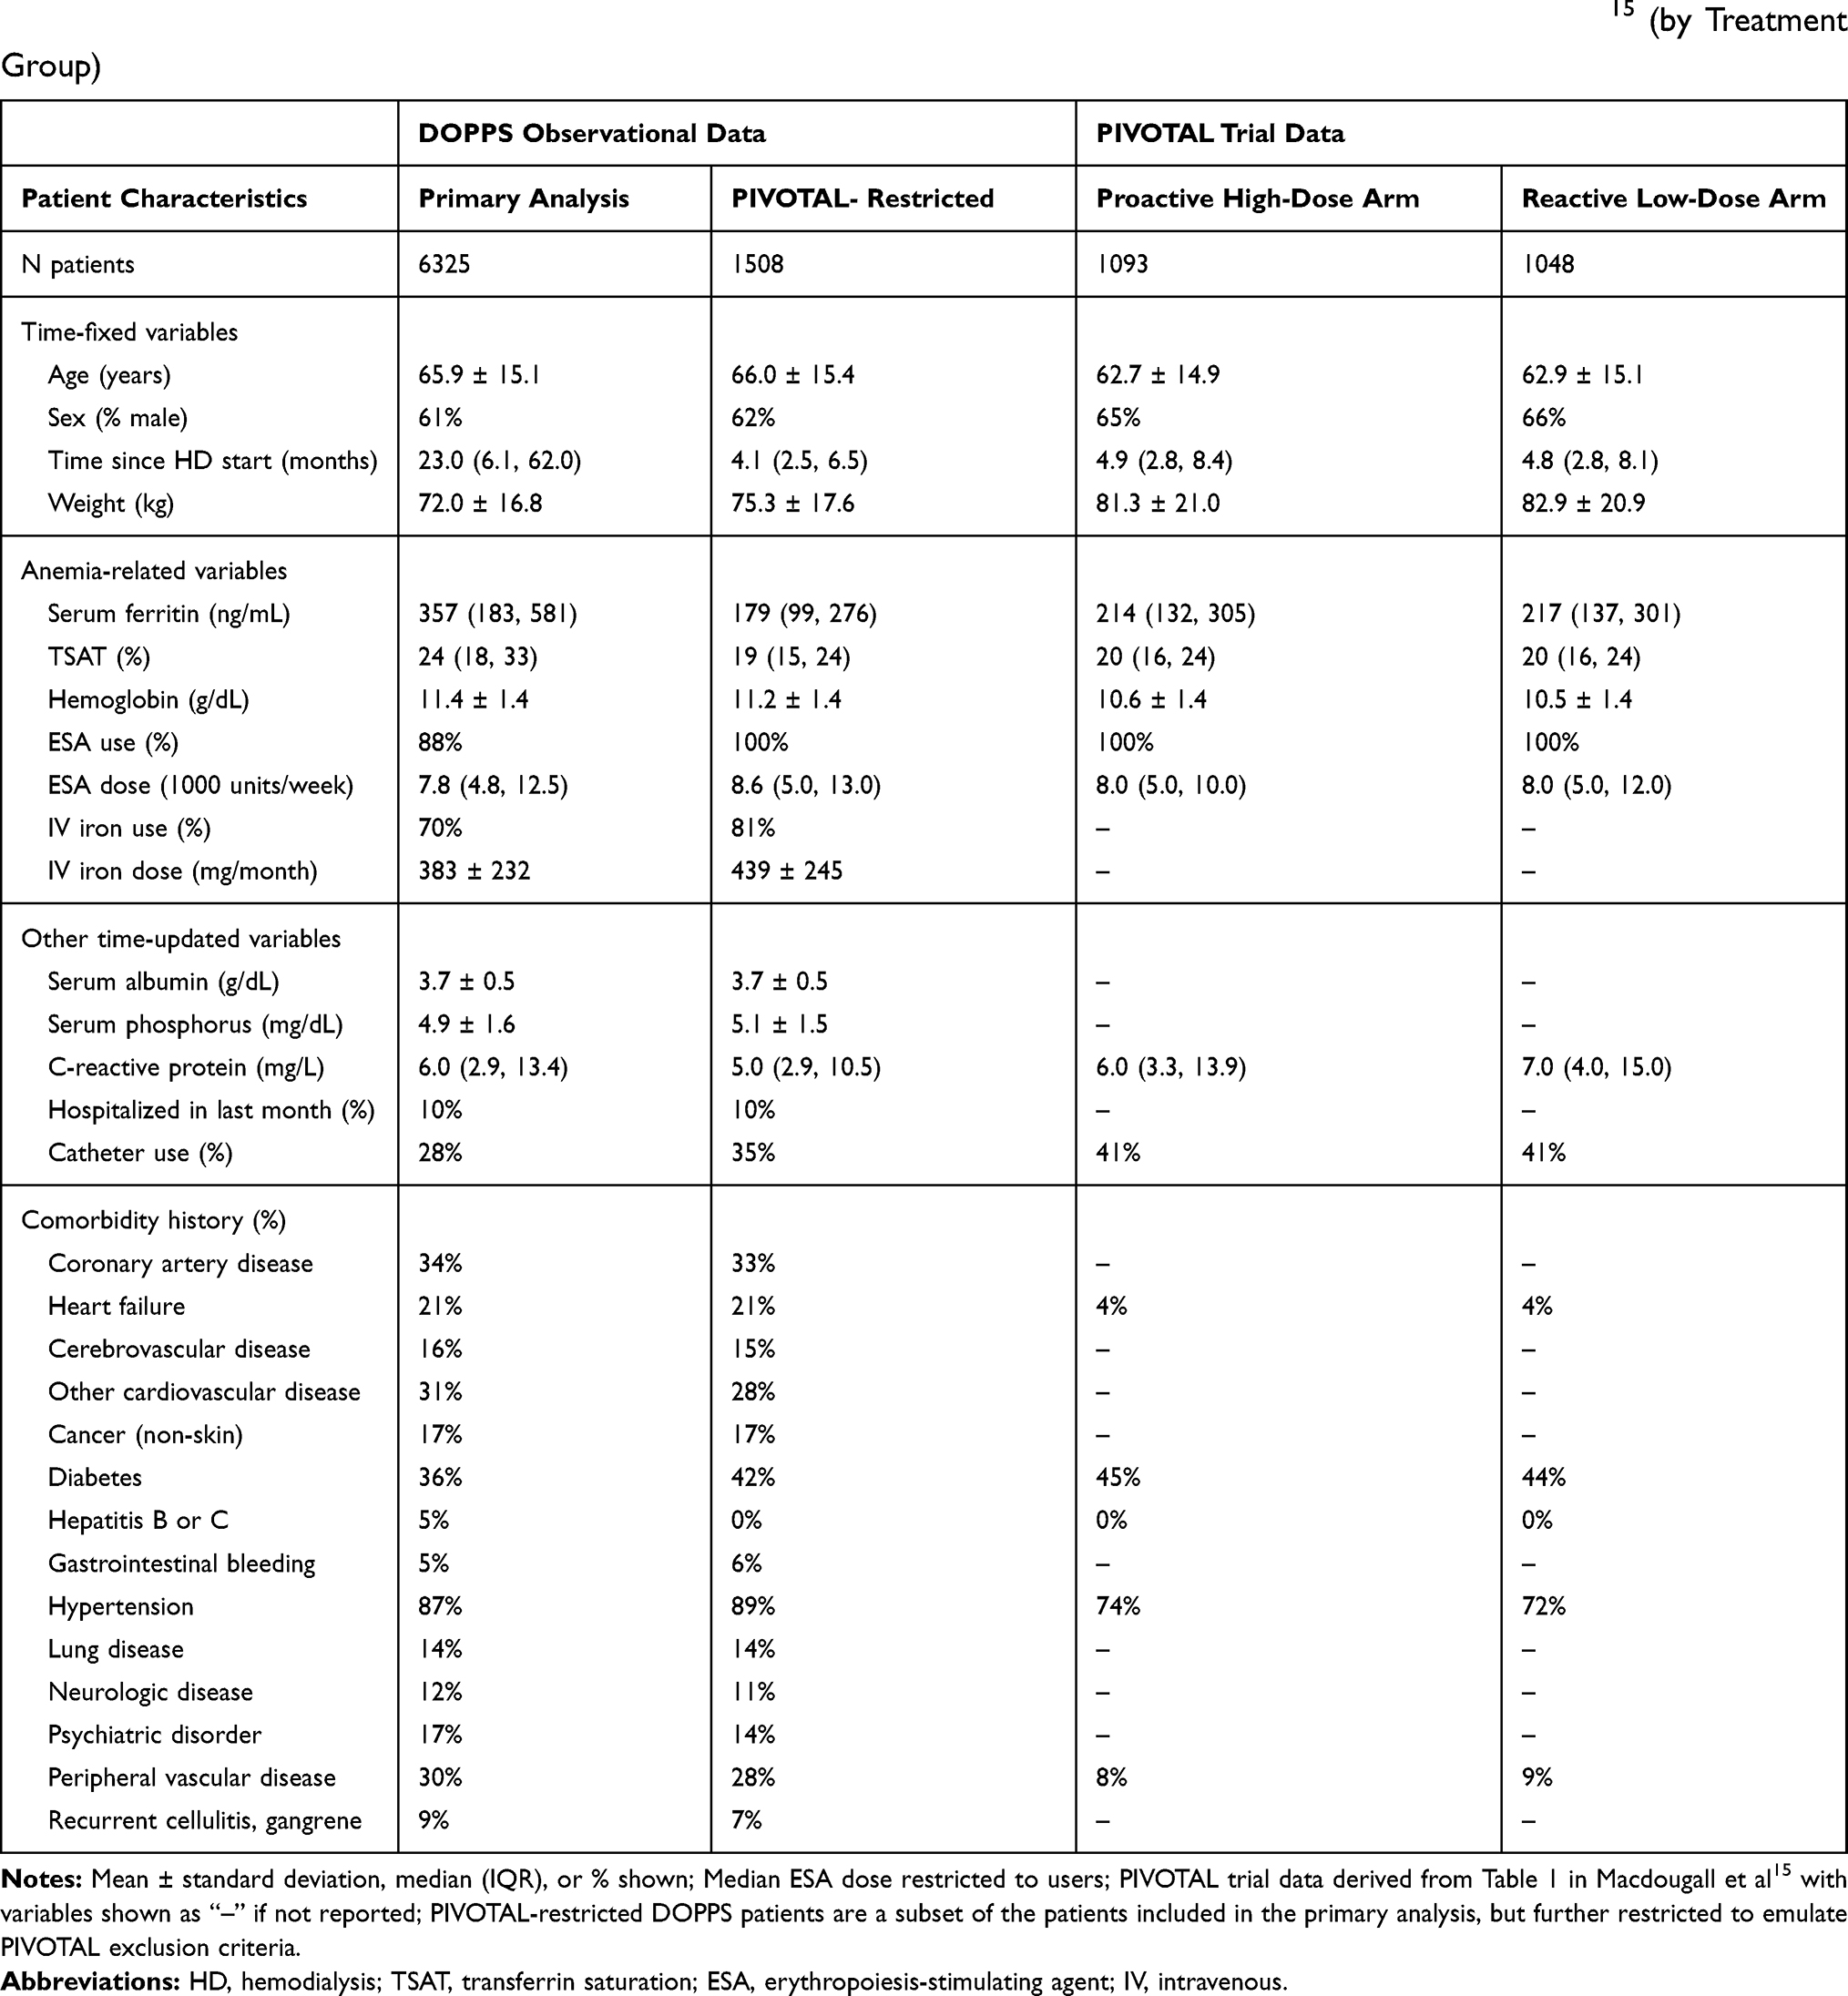 |
Table 3 Summary of Baseline Patient Characteristics in the DOPPS (by Type of Analysis) and the PIVOTAL Trial15 (by Treatment Group) |
Parametric g-Formula Results: Full DOPPS Sample
For the 6325 DOPPS patients included in our primary analysis, we first compared observed data (ie, mean or median levels for up to 12 months of DOPPS follow-up) with our natural course simulation, and found minimal deviations (Figure S1). The 1-year mortality risk in parametric g-formula simulations was 0.120 vs 0.101 under the high vs low IV iron dose simulated interventions (Figure 3A); the corresponding RR was 1.20 (95% CI: 1.07, 1.33), and the RD was 0.020 (95% CI: 0.008, 0.031). Differences in secondary outcomes under the two interventions over the 12-month simulation were as follows: mean hemoglobin was 0.13 (95% CI: 0.09, 0.17) g/dL higher for the high- vs low-dose strategy (Figure 3B). Median ferritin was 357 ng/mL at baseline and increased to 475 ng/mL under the high-dose strategy while decreasing to 292 ng/mL under the low-dose strategy, a difference at 12 months of 182 (95% CI: 171, 196) ng/mL (Figure 3C). Median TSAT was 25% and decreased slightly to 23.9% under the low-dose strategy, and gradually increased to 27.5% under the high-dose strategy, a difference of 3.6% (95% CI: 3.2%, 4.0%) (Figure 3D). Median ESA dose was 506 (95% CI: 287, 718) units/week lower (6.7% lower) under the high- vs low-dose strategy at 12 months (Figure 3E). Mean assigned IV iron dose (including 0 doses) was much greater under the high vs low IV iron dose strategy (253 vs 80 mg/month) at 12 months (Figure 3F). Comparing cumulative dosing over the 12-month period, patients assigned to the high- vs low-dose strategy received 5.8% (95% CI: 3.3%, 8.1%) less ESA and three times as much IV iron (3166 vs 981 mg) (Figure S2). Results were generally consistent in a sensitivity analysis based on a complete-case analysis of 40,721 patient-months across 3,994 patients (Figure S3).
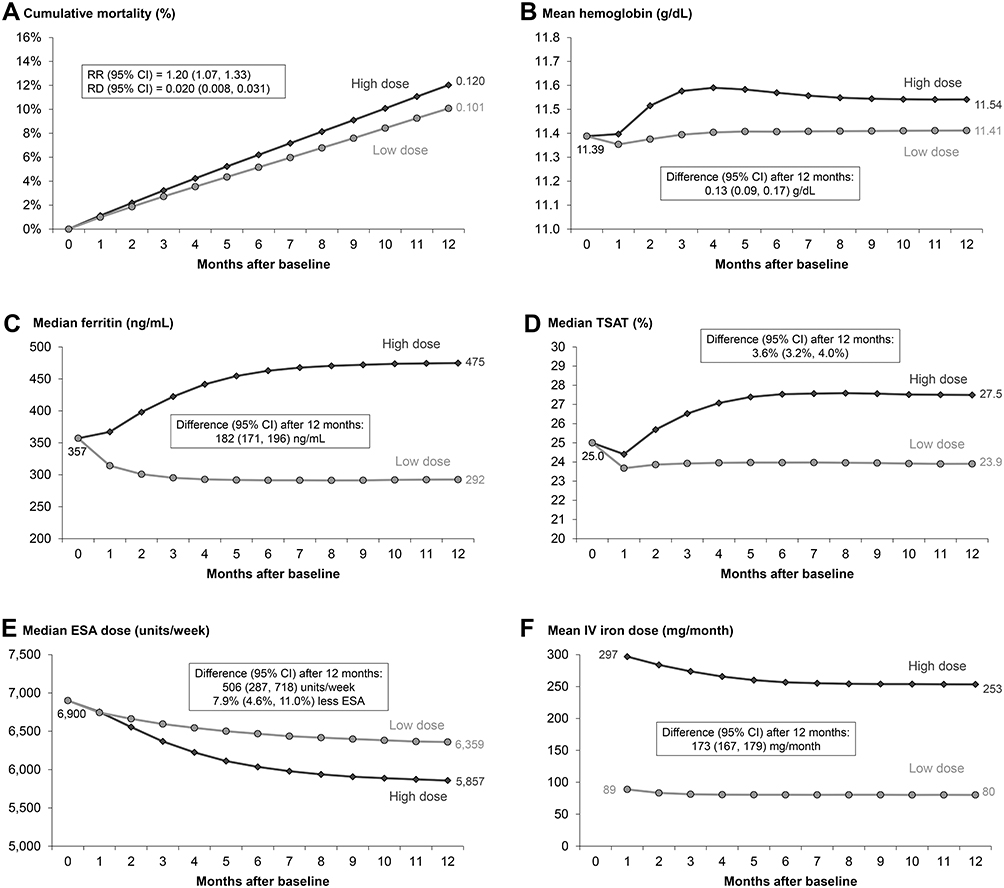 |
Figure 3 Comparison of proactive high-dose vs reactive low-dose IV iron treatment strategy over 12 months using the parametric g-formula. High-dose and low-dose strategies defined by PIVOTAL trial15 protocol as described in Table 1; Outcomes: (A) all-cause mortality, (B) hemoglobin, (C) serum ferritin, (D) TSAT, (E) ESA dose, (F) IV iron dose. |
Parametric g-Formula Results: Restricted to a PIVOTAL-Like Subset of DOPPS
In our second objective attempting to replicate the PIVOTAL population by further restriction of the DOPPS data as described in Figure 2, our sample size was reduced from 6325 to 1508 patients. In this subset, we found no major departures from the observed data in our natural-course simulation (Figure S4). The 1-year mortality risk was 0.098 vs 0.083 under the high vs low IV iron dose-simulated interventions (Figure 4A); the corresponding RR was 1.19 (95% CI: 0.84, 1.59) and the RD was 0.015 (95% CI: −0.015, 0.041) – very similar to the overall sample, albeit with less precision. Baseline levels of hemoglobin, ferritin, and TSAT were much lower in this subset compared to the primary analysis (Table 3); subsequent rises are illustrated under both treatment strategies – though more pronounced under the high-dose strategy – and after 12 months, the differences between strategies (Figure 4B–D) were comparable to those observed in the overall sample. Doses of ESA (Figure 4E) and IV iron (Figure 4F) were higher at baseline in this subset, reflecting patient differences due to PIVOTAL restrictions, but eventually reached a steady state, with doses under the two strategies similar to the overall sample.
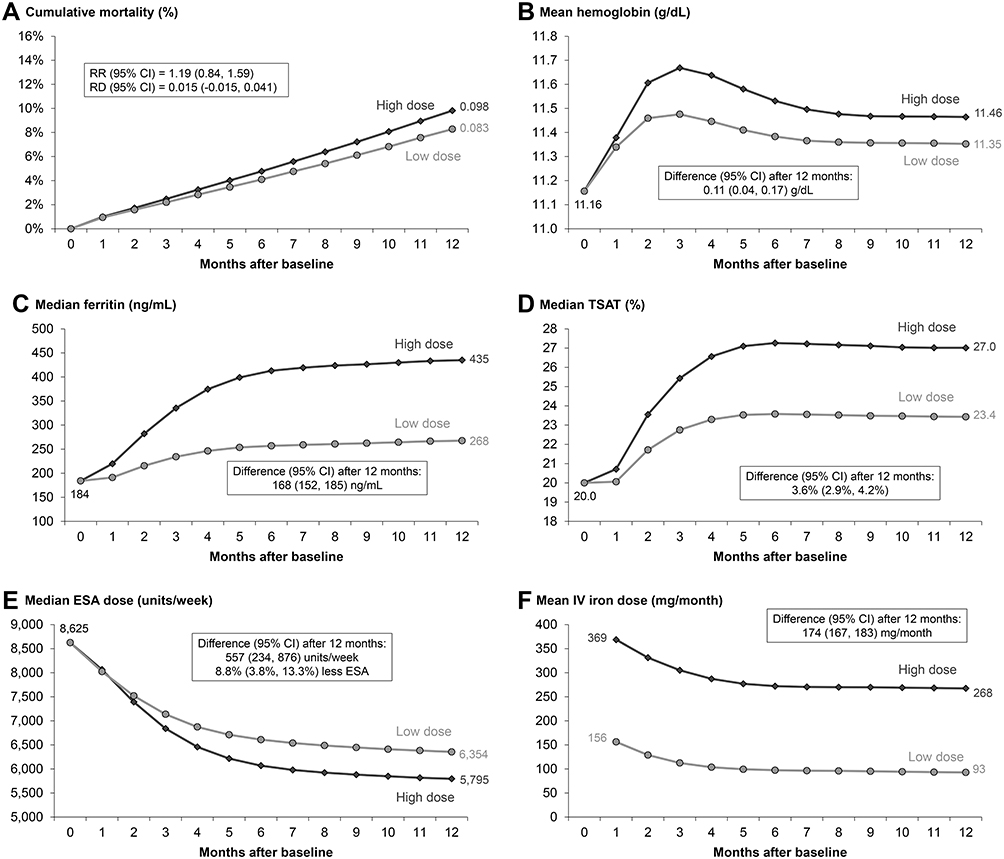 |
Figure 4 Comparison of proactive high-dose vs reactive low-dose IV iron treatment strategy over 12 months using the parametric g-formula, restricted to PIVOTAL-like patients. High-dose and low-dose strategies defined by PIVOTAL trial15 protocol as described in Table 1; N=1508 PIVOTAL-like DOPPS patients restricted to emulate PIVOTAL exclusion criteria; Outcomes: (A) all-cause mortality, (B) hemoglobin, (C) serum ferritin, (D) TSAT, (E) ESA dose, (F) IV iron dose. |
Comparisons with PIVOTAL
Table 4 summarizes our parametric g-formula results – both primary (Objective 1) and restricted (Objective 2) – in comparison to the PIVOTAL randomized trial. The 1-year mortality risk was about 0.08 in both PIVOTAL arms, whereas we observed a risk difference of 0.019 (primary) and 0.015 (restricted) under the high- vs low-dose simulation. After 12 months, the difference in the mean cumulative IV iron dose assigned under the high vs low-dose strategy was ~2000 mg in the PIVOTAL trial and in both of our analyses. We found that median cumulative ESA dose was 20,000–30,000 units lower under the high- vs low-dose strategy after 12 months; this difference was smaller than the 90,000 units lower median cumulative ESA dose reported in the PIVOTAL trial. Similarly, differences in laboratory values after 12 months under the high vs low-dose strategy in the full DOPPS analysis (0.13 g/dL higher mean hemoglobin, 183 ng/mL higher median ferritin, 3.6% higher median TSAT) were directionally consistent with PIVOTAL findings, but smaller in magnitude (as estimated from in Macdougall et al15: ~0.2 g/dL higher mean hemoglobin, ~450 ng/mL higher median ferritin, ~7% higher median TSAT).
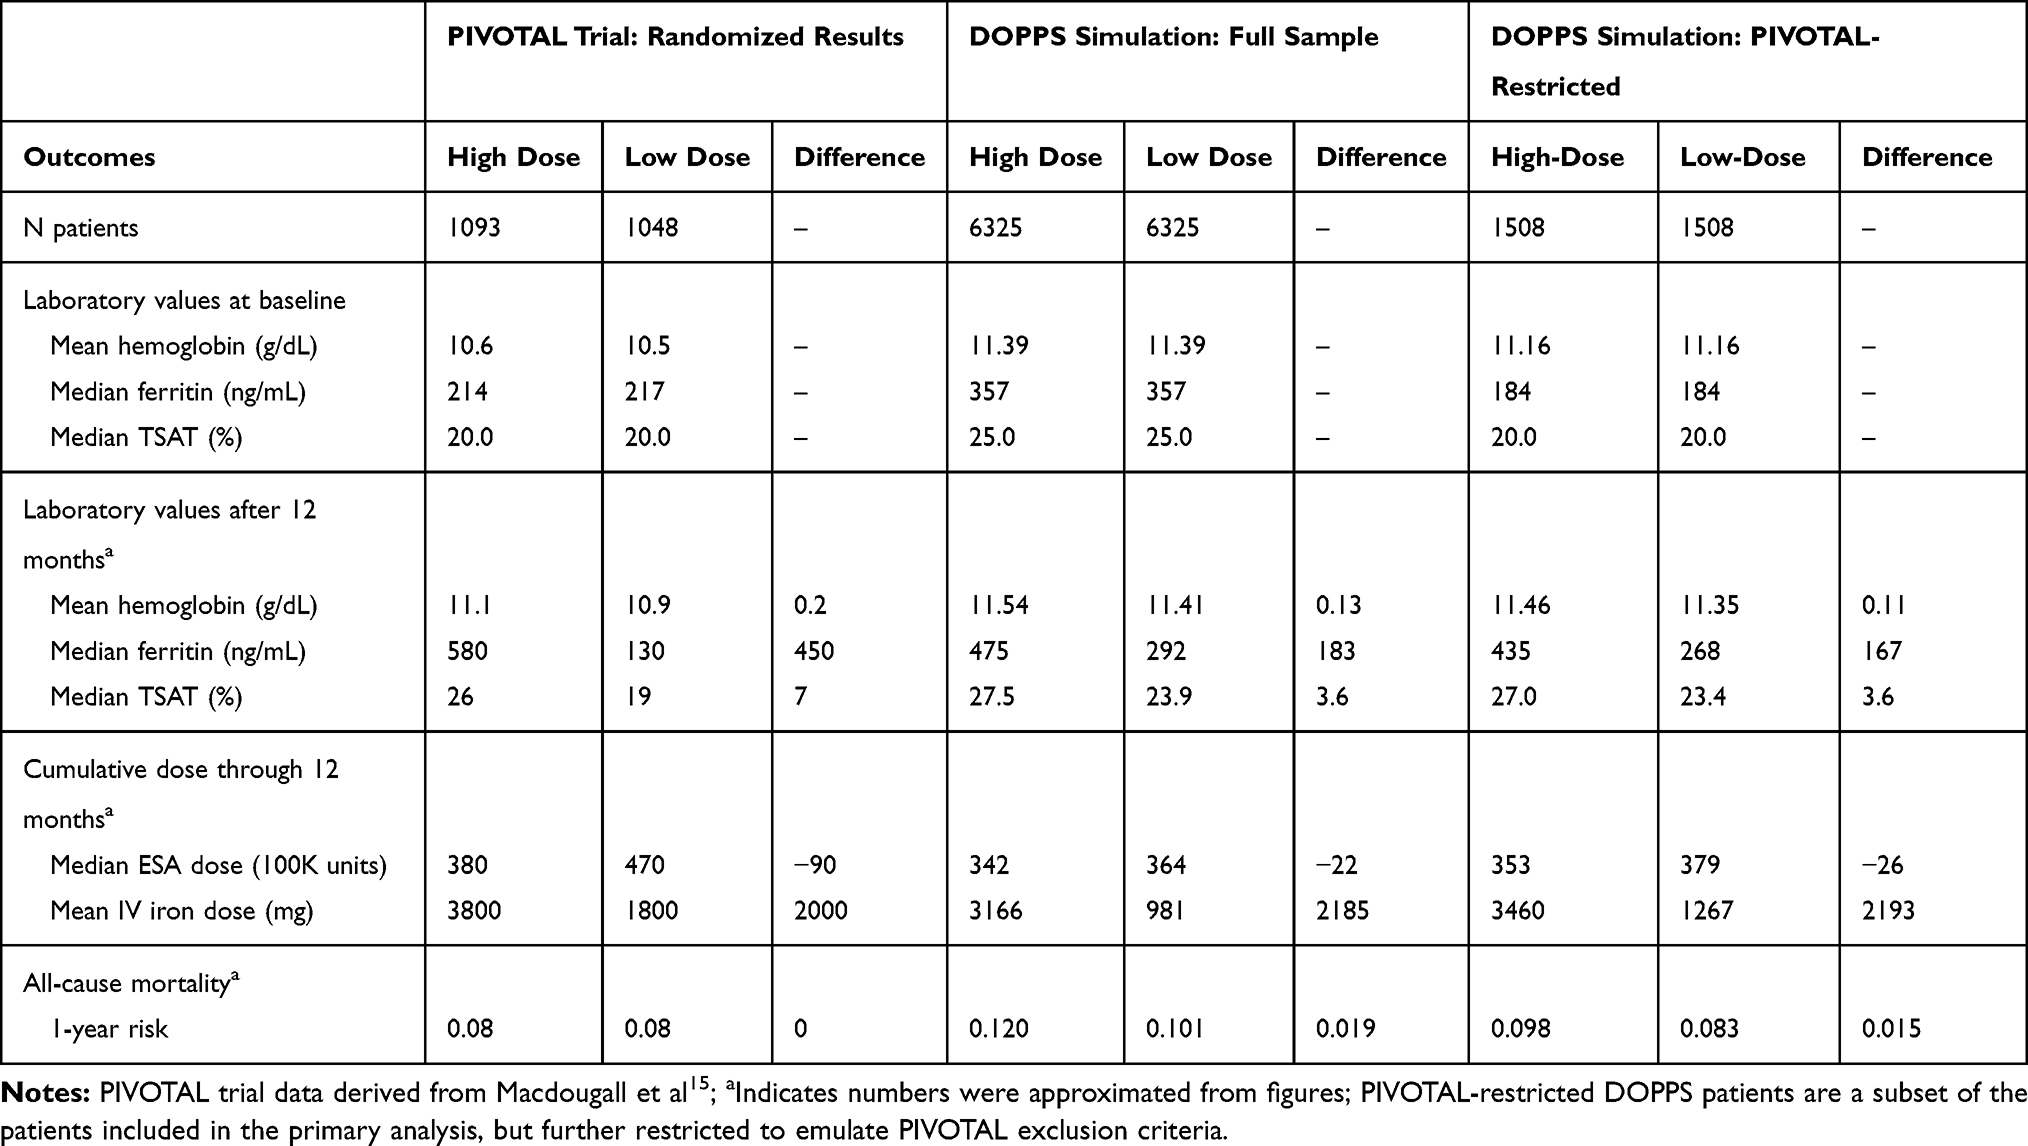 |
Table 4 Summary of Findings: Comparing PIVOTAL Trial with DOPPS Simulation Using the Full Sample (Objective 1) and PIVOTAL-Like Restricted Subset |
Discussion
In the DOPPS cohort of hemodialysis patients, we implemented the parametric g-formula to compare patient outcomes under two simulated IV iron treatment regimens defined by the protocol used in the recently published PIVOTAL randomized trial.15 In both the overall DOPPS sample and PIVOTAL-restricted subset, we found that after 12 months, the proactive high-dose vs reactive low-dose strategy resulted in much higher serum ferritin levels, slightly higher levels of hemoglobin and TSAT, and slightly lower ESA doses, but a higher risk of mortality. Thus, our findings do not suggest a preference for the proactive high IV iron dose regimen.
Our simulated differences in laboratory values after 12 months under the high vs low-dose strategy were directionally consistent with the PIVOTAL trial, but smaller in magnitude. Our mortality results were, however, not consistent with the trial; PIVOTAL authors observed a hazard ratio (HR) of 0.85 (95% CI: 0.73, 1.00) for their primary composite outcome over the full 42-month follow-up period for the high-dose vs low-dose arm, although in Macdougall et al15 appears to show no difference (HR=RR=1) in their secondary endpoint of all-cause mortality after the first 12 months of follow-up.
One possibility as to why our results did not match PIVOTAL more closely is that incident hemodialysis patients could be immediately randomized to a treatment protocol in the PIVOTAL trial, while the parametric g-formula requires 2 previous months of data to inform the models and simulations; this functionally limits us to patients with 3+ months on hemodialysis therapy, after low hemoglobin levels are likely to have been mostly corrected.28 If anemia treatments provide an initial boost to levels of hemoglobin, ferritin, and TSAT in previously untreated incident hemodialysis patients that dissipate once patients enter more of a steady-state, this may help explain why our effect sizes were smaller than in the PIVOTAL trial. Indeed, the majority of the 12-month differences in these laboratory outcomes in the PIVOTAL trial were observed within the first 3 months of follow-up.15 Another possible explanation is model misspecification in Step 1. Similarities in the trajectories of our natural course simulation vs the observed data (Figure S1) were mostly encouraging, as any departures may signify potential model misspecification. However, if we are consistently underestimating the effect of IV iron on intermediate outcomes (ie, hemoglobin, ferritin, TSAT), any biases in Step 1 models may affect predictions of ESA dose and mortality risk in the Step 2 simulation. A third possibility is that IV iron may have different effects on iron measures and survival in the generally healthier patients selected for the trial.19 There were clear differences in the DOPPS cohort vs PIVOTAL participants, many of which remained even after we attempted to restrict our sample to PIVOTAL-like patients (Table 3). While we were able to restrict on unambiguous lab cut-offs (eg, ferritin <400 ng/mL), we were limited in our ability to restrict on other more subjective criteria (eg, “life expectancy <12 months per the judgement of the investigator”). Finally, while randomized trials are considered the gold standard, our discrepancies may be in part due to the broader issue of trial reproducibility, particularly open-label trials,29 and the potential for overestimation of effects in the controlled environment of randomized trials, when the focus is on efficacy over effectiveness and only highly selected patients are enrolled.30
Some observational studies found that higher IV iron doses were associated with elevated risk of adverse events,7–9 and some did not.10–12 However, all of these studies considered IV iron as a static rather than dynamic treatment strategy; thus, we cannot expect to make a quantitatively fair comparison between those effect estimates and ours. Li et al31 used inverse probably weighted (IPW) estimation of marginal structural models to evaluate dynamic iron supplementation strategies and found – similar to our study – that patients under more intensive iron dosing strategies had higher mortality. Most of these studies were conducted in the US, where ferritin levels are much higher than in Europe.16 In the PIVOTAL trial,15 the ferritin threshold at which to discontinue IV iron in the proactive high-dose arm was 700 ng/mL, lower than the median value (800 ng/mL) observed in the US in February 2019,32 limiting generalizability of our analysis – and PIVOTAL itself – regarding optimal treatment for patients with ferritin >700 ng/mL.33
A key strength of our study was the ability to compare well-defined dynamic treatment strategies. Rather than ask whether patients who received >400 vs 200–399 mg of iron over a specified time period had better outcomes, our research question better reflects the complexities of clinical practice. This study design, in contrast to a randomized trial, is flexible to many potential interventions (eg, altering the ferritin/TSAT criteria) and inclusion criteria. Second, this method properly accounts for a treatment-confounder feedback loop (eg, ferritin → IV iron → ferritin),34 but without the possibility that unstable weights will drive results, as with IPW methods.2,25,27 Third, using a European cohort has two advantages:1 we were able to adjust for C-reactive protein (CRP), a marker of inflammation with a strong positive association with both ferritin and mortality that is not routinely measured in the US;35 and2 we avoided violations of positivity (when certain subgroups always or never receive the treatment),36 which would occur in other regions where IV iron dosing strategies are either more aggressive than the high-dose arm (US) or more conservative than the low-dose arm (Japan).16 Finally, while a small sample size can be augmented in Step 2,26 our large sample in the primary analysis allows for improved precision of the Step 1 coefficient estimation.
Our study had some limitations shared by all parametric g-formula analyses. First, the parametric g-formula can account for time-dependent confounders, but only to the extent they are measured accurately. Second, under the “g-null paradox,”2 we may still observe an association seemingly due to a treatment effect when the causal null hypothesis is true, given a large enough sample size; however, there is no evidence this occurs in practice.37 Lastly, reliance on many parametric models creates more opportunity for bias, as misspecification in one model may reverberate throughout the simulation.
As we were not able to replicate all PIVOTAL findings, the following concerns and obstacles to using large databases to mimic randomized trials should be appreciated. First, we were unable to narrow our cohort to a PIVOTAL-like population through restriction alone, despite attempts to implement the trial exclusion criteria. Second, while the maximum PIVOTAL trial follow-up was 42 months, the median DOPPS follow-up was 15 months, and so we focused on 1-year outcomes to avoid simulating follow-up beyond the limits of the empirical data. Third, we emulated a secondary endpoint of PIVOTAL – all-cause mortality – to avoid potential misclassification bias for nonfatal cardiovascular events reported in the DOPPS. Fourth, our intent-to-treat38 analysis assumed perfect adherence with the treatment strategy because IV medications are conveniently administered at each hemodialysis session 3x/week. Indeed, PIVOTAL findings were very similar when analyzed per-protocol vs intent to treat because only 1% of patients had major protocol violations,15 Fifth, ferritin and TSAT measurements were regimented monthly in the PIVOTAL trial; the DOPPS data reflect real-world clinical practice, in which these labs are sometimes only assessed every 3 months. The basic principle of the non-parametric g-formula as an extension of standardization is appealing for many reasons; but the extensive modeling is, in practice, unlikely to fully account for the many unknown associations and interactions between variables.
Conclusion
It is challenging, and often not possible,39 to replicate clinical trial evidence using observational data. Because the hypothetical target trial we emulated was not identical to the published PIVOTAL trial, we may not necessarily expect the same answer to these slightly different research questions.1 While there may be inherent limitations in perfectly reproducing the results of a randomized trial which often represents a highly specialized population, this application demonstrates the value and flexibility of the parametric g-formula for comparing many variations of complex intervention strategies and generalizing results to a broader target population. Our results provide valuable evidence to nephrologists and hence hemodialysis patients, and illustrate a framework to evaluate treatment strategies that have not been tested in randomized trials.
Data Sharing Statement
The data that support the findings of this study are available from Arbor Research Collaborative for Health, but restrictions apply to the availability of these data which were used for the current study, and so are not publicly available. Data are however available from the corresponding author upon reasonable request and with permission of Arbor Research Collaborative for Health.
Ethics Approval and Consent to Participate
Study approval and patient consent were obtained as required by national and local ethics committee regulations. DOPPS is a non-interventional, observational, prospective cohort study of HD subjects and facilities in multiple countries. DOPPS is not a clinical trial, a patient’s treatment is not affected by participation in DOPPS, and there are no treatment interventions employed as part of this study. Patient participation in DOPPS only occurs after a patient has provided written informed consent. The Data Coordinating Center works with country investigators to submit an application and, where necessary, obtain approval from their local IRB or ethics committee for participating in DOPPS.
Funding
Global support for the ongoing Dialysis Outcomes and Practice Patterns Study (DOPPS) Programs is provided by a consortium of public and industry funders without restriction on publications. See https://www.dopps.org/AboutUs/Support.aspx for more information and up-to-date list of funders. No funders had any input on this analysis.
Disclosure
Dr. Karaboyas and Dr. Robinson are employees of Arbor Research Collaborative for Health, which administers the DOPPS data used in this analysis. Dr. Morgenstern has been a consultant at Arbor Research Collaborative for Health. Dr Angelo Karaboyas report grants to Arbor Research Collaborative for Health from Amgen, Association of German Nephrology Centres (Verband Deutsche Nierenzentren e.V.), AstraZeneca, European Renal Association-European Dialysis & Transplant Association (ERA-EDTA), German Society of Nephrology (DGfN), Hexal AG, Janssen, Japanese Society for Peritoneal Dialysis (JSPD), Keryx, Proteon, Relypsa, Roche, Società Italiana di Nefrologia (SIN), Spanish Society of Nephrology, Vifor Fresenius Medical Care Renal Pharma, Australia: National Health & Medical Research Council (NHMRC), Canada: Canadian Institutes of Health Research (CIHR) and Ontario Renal Network, France: Agence Nationale de la Recherche, Thailand: Thailand Research Foundation (TRF), Chulalongkorn University Matching Fund, King Chulalongkorn Memorial Hospital Matching Fund, and the National Research Council of Thailand (NRCT), United Kingdom: National Institute for Health Research (NIHR) via the Comprehensive Clinical Research Network (CCRN), United States: National Institutes of Health (NIH) and Patient-Centered Outcomes Research Institute (PCORI), during the conduct of the study. The authors report no other conflicts of interest in this work.
References
1. Hernán MA, Robins JM. Using big data to emulate a target trial when a randomized trial is not available. Am J Epidemiol. 2016;183(8):758–764. doi:10.1093/aje/kwv254
2. Young JG, Cain LE, Robins JM, O’Reilly EJ, Hernán MA. Comparative effectiveness of dynamic treatment regimes: an application of the parametric g-formula. Stat Biosci. 2011;3(1):119–143. doi:10.1007/s12561-011-9040-7
3. Robins J. A new approach to causal inference in mortality studies with a sustained exposure period - application to control of the healthy worker survivor effect. Math Model. 1986;7(9–12):1393–1512. doi:10.1016/0270-0255(86)90088-6
4. Hernán MA, Robins JM. Causal Inference. Boca Raton: Chapman & Hall/CRC, forthcoming; 2019.
5. Daniel RM, Cousens SN, De Stavola BL, Kenward MG, Sterne JAC. Methods for dealing with time-dependent confounding. Stat Med. 2013;32(9):1584–1618. doi:10.1002/sim.5686
6. Rothman KJ, Greenland S, Lash TJ. Modern Epidemiology.
7. Bailie GR, Larkina M, Goodkin DA, et al. Data from the dialysis outcomes and practice patterns study validate an association between high intravenous iron doses and mortality. Kidney Int. 2015;87(1):162–168. doi:10.1038/ki.2014.275
8. Brookhart MA, Schneeweiss S, Avorn J, Bradbury BD, Liu J, Winkelmayer WC. Comparative mortality risk of anemia management practices in incident hemodialysis patients. JAMA. 2010;303(9):857–864. doi:10.1001/jama.2010.206
9. Kalantar-Zadeh K, Regidor DL, McAllister CJ, Beckie M, Warnock DG. Time-dependent associations between iron and mortality in hemodialysis patients. J Am Soc Nephrol. 2005;16(10):3070–3080. doi:10.1681/ASN.2005040423
10. Feldman HI, Joffe M, Robinson BM, et al. Administration of parenteral iron and mortality among hemodialysis patients. J Am Soc Nephrol. 2004;15(6):1623–1632. doi:10.1097/01.ASN.0000128009.69594.BE
11. Miskulin DC, Tangri N, Bandeen-Roche K, et al. Intravenous iron exposure and mortality in patients on hemodialysis. Clin J Am Soc Nephrol. 2014;9(11):1930–1939. doi:10.2215/CJN.03370414
12. Tangri N, Miskulin DC, Zhou J, et al. Effect of intravenous iron use on hospitalizations in patients undergoing hemodialysis: a comparative effectiveness analysis from the DEcIDE-ESRD study. Nephrol Dial Transplant. 2015;30(4):667–675. doi:10.1093/ndt/gfu349
13. Kalantar-Zadeh K, Streja E, Miller JE, Nissenson AR. Intravenous iron versus erythropoiesis-stimulating agents: friends or foes in treating chronic kidney disease anemia? Adv Chronic Kidney Dis. 2009;16(2):143–151. doi:10.1053/j.ackd.2008.12.008
14. Coyne DW. Iron indices: what do they really mean? Kidney Int. 2006;69(Suppl101):S4–8. doi:10.1038/sj.ki.5000404
15. Macdougall IC, White C, Anker SD, et al. Intravenous iron in patients undergoing maintenance hemodialysis. N Engl J Med. 2018;380(5):447–458. doi:10.1056/NEJMoa1810742
16. Karaboyas A, Morgenstern H, Pisoni RL, et al. Association between serum ferritin and mortality: findings from the USA, Japan and European dialysis outcomes and practice patterns study. Nephrol Dial Transplant. 2018;33(12):2234–2244. doi:10.1093/ndt/gfy190
17. Pisoni RL, Gillespie BW, Dickinson DM, Chen K, Kutner MH, Wolfe RA. The dialysis outcomes and practice patterns study (DOPPS): design, data elements, and methodology. Am J Kidney Dis. 2004;44:S7–15. doi:10.1016/S0272-6386(04)01099-6
18. Young EW, Goodkin DA, Mapes DL, et al. The dialysis outcomes and practice patterns study (DOPPS): an international hemodialysis study. Kidney Int. 2000;57(Suppl74):S74–81. doi:10.1046/j.1523-1755.2000.07413.x
19. Macdougall IC, White C, Anker SD, et al. Randomized trial comparing proactive, high-dose versus reactive, low-dose intravenous iron supplementation in hemodialysis (PIVOTAL): study design and baseline data. Am J Nephrol. 2018;48(4):260–268. doi:10.1159/000493551
20. Lodi S, Phillips A, Lundgren J, et al. Effect estimates in randomized trials and observational studies: comparing apples with apples. Am J Epidemiol. 2019;188(8):1569–1577. doi:10.1093/aje/kwz100
21. Cole SR, Richardson DB, Chu H, Naimi AI. Analysis of occupational asbestos exposure and lung cancer mortality using the G formula. Am J Epidemiol. 2013;177(9):989–996. doi:10.1093/aje/kws343
22. Schomaker M, Heumann C. Bootstrap inference when using multiple imputation. Stat Med. 2018;37(14):2252–2266. doi:10.1002/sim.7654
23. Karaboyas A, Morgenstern H, Li Y, et al. Estimating the fraction of first-year hemodialysis deaths attributable to potentially modifiable risk factors: results from the DOPPS. Clin Epidemiol. 2020;12:51–60. doi:10.2147/CLEP.S233197
24. Taubman SL, Robins JM, Mittleman MA, Hernán MA. Intervening on risk factors for coronary heart disease: an application of the parametric g-formula. Int J Epidemiol. 2009;38(6):1599–1611. doi:10.1093/ije/dyp192
25. Westreich D, Cole SR, Young JG, et al. The parametric g-formula to estimate the effect of highly active antiretroviral therapy on incident AIDS or death. Stat Med. 2012;31(18):2000–2009. doi:10.1002/sim.5316
26. Keil AP, Edwards JK, Richardson DB, Naimi AI, Cole SR. The parametric g-formula for time-to-event data: intuition and a worked example. Epidemiology. 2014;25(6):889–897. doi:10.1097/EDE.0000000000000160
27. Zhang Y, Young JG, Thamer M, Hernán MA. Comparing the effectiveness of dynamic treatment strategies using electronic health records: an application of the parametric g-formula to anemia management strategies. Health Serv Res. 2018;53(3):1900–1918. doi:10.1111/1475-6773.12718
28. United States Renal Data System. 2018 USRDS annual data report: epidemiology of kidney disease in the United States. Bethesda, MD; 2018.
29. Munafò MR, Nosek BA, Bishop DVM, et al. A manifesto for reproducible science. Nat Hum Behav. 2017;1(1):1–9. doi:10.1038/s41562-016-0021
30. Alahdab F, Farah W, Almasri J, et al. Treatment effect in earlier trials of patients with chronic medical conditions: a meta-epidemiologic study. Mayo Clin Proc. 2018;93(3):278–283. doi:10.1016/j.mayocp.2017.10.020
31. Li X, Cole SR, Kshirsagar AV, Fine JP, Stürmer T, Brookhart MA. Safety of dynamic intravenous iron administration strategies in hemodialysis patients. Clin J Am Soc Nephrol. 2019;14(5):728–737. doi:10.2215/CJN.03970318
32. US-DOPPS Practice Monitor (DPM). April 2019 [
33. Collister D, Tangri N. Post-PIVOTAL iron dosing with maintenance hemodialysis. Clin J Am Soc Nephrol. 2019;14(10):1533–1535. doi:10.2215/CJN.02300219
34. Coyne DW, Kapoian T, Suki W, et al. Ferric gluconate is highly efficacious in anemic hemodialysis patients with high serum ferritin and low transferrin saturation: results of the dialysis patients’ response to IV iron with elevated ferritin (DRIVE) study. J Am Soc Nephrol. 2007;18(3):975–984. doi:10.1681/ASN.2006091034
35. Bazeley J, Bieber BA, Li Y, et al. C-reactive protein and prediction of 1-year mortality in prevalent hemodialysis patients. Clin J Am Soc Nephrol. 2011;6(10):2452–2461. doi:10.2215/CJN.00710111
36. Westreich D, Cole SR. Invited commentary: positivity in practice. Am J Epidemiol. 2010;171(6):674–677. doi:10.1093/aje/kwp436
37. Newsome SJ, Keogh RH, Daniel RM. Estimating long-term treatment effects in observational data: a comparison of the performance of different methods under real-world uncertainty. Stat Med. 2018;37(15):2367–2390. doi:10.1002/sim.7664
38. Hernán MA, Robins JM. Per-protocol analyses of pragmatic trials. N Engl J Med. 2017;377(14):1391–1398. doi:10.1056/NEJMsm1605385
39. Bartlett VL, Dhruva SS, Shah ND, Ryan P, Ross JS. Feasibility of using real-world data to replicate clinical trial evidence. JAMA Netw open. 2019;2(10):e1912869. doi:10.1001/jamanetworkopen.2019.12869
 © 2020 The Author(s). This work is published and licensed by Dove Medical Press Limited. The
full terms of this license are available at https://www.dovepress.com/terms
and incorporate the Creative Commons Attribution
- Non Commercial (unported, 3.0) License.
By accessing the work you hereby accept the Terms. Non-commercial uses of the work are permitted
without any further permission from Dove Medical Press Limited, provided the work is properly
attributed. For permission for commercial use of this work, please see paragraphs 4.2 and 5 of our Terms.
© 2020 The Author(s). This work is published and licensed by Dove Medical Press Limited. The
full terms of this license are available at https://www.dovepress.com/terms
and incorporate the Creative Commons Attribution
- Non Commercial (unported, 3.0) License.
By accessing the work you hereby accept the Terms. Non-commercial uses of the work are permitted
without any further permission from Dove Medical Press Limited, provided the work is properly
attributed. For permission for commercial use of this work, please see paragraphs 4.2 and 5 of our Terms.