Back to Journals » Nature and Science of Sleep » Volume 16
Reoxygenation Mitigates Intermittent Hypoxia-Induced Systemic Inflammation and Gut Microbiota Dysbiosis in High-Fat Diet-Induced Obese Rats
Authors Dong M, Liang X, Zhu T, Xu T, Xie L, Feng Y ![]()
Received 10 December 2023
Accepted for publication 12 May 2024
Published 25 May 2024 Volume 2024:16 Pages 517—530
DOI https://doi.org/10.2147/NSS.S454297
Checked for plagiarism Yes
Review by Single anonymous peer review
Peer reviewer comments 2
Editor who approved publication: Prof. Dr. Ahmed BaHammam
Menglu Dong,1 Xili Liang,1 Tian Zhu,1 Ting Xu,1 Liwei Xie,2,3 Yuan Feng1,4,5
1Sleep Medicine Center, Department of Psychiatric, Nanfang Hospital, Southern Medical University, Guangzhou, People’s Republic of China; 2Guangdong Provincial Key Laboratory of Microbial Culture Collection and Application, State Key Laboratory of Applied Microbiology Southern China, Institute of Microbiology, Guangdong Academy of Sciences, Guangzhou, People’s Republic of China; 3Department of Endocrinology and Metabolism, Zhujiang Hospital, Southern Medical University, Guangzhou, People’s Republic of China; 4Institute of Brain Disease, Nanfang Hospital of Southern Medical University, Guangzhou, People’s Republic of China; 5Guangdong Provincial Key Laboratory of Proteomics, School of Basic Medical Science, Southern Medical University, Guangzhou, People’s Republic of China
Correspondence: Liwei Xie, Email [email protected]; Yuan Feng, Sleep Medicine Center, Department of Psychiatric, Nanfang Hospital, Southern Medical University, 1838 North Guangzhou Avenue, Baiyun District, Guangzhou, 510515, People’s Republic of China, Email [email protected]
Background: Obstructive sleep apnea (OSA) is a prevalent sleep breathing disorder characterized by intermittent hypoxia (IH), with continuous positive airway pressure (CPAP) as its standard treatment. However, the effects of intermittent hypoxia/reoxygenation (IH/R) on weight regulation in obesity and its underlying mechanism remain unclear. Gut microbiota has gained attention for its strong association with various diseases. This study aims to explore the combined influence of IH and obesity on gut microbiota and to investigate the impact of reoxygenation on IH-induced alterations.
Methods: Diet-induced obese (DIO) rats were created by 8-week high-fat diet (HFD) feeding and randomly assigned into three groups (n=15 per group): normoxia (NM), IH (6% O2, 30 cycles/h, 8 h/day, 4 weeks), or hypoxia/reoxygenation (HR, 2-week IH followed by 2-week reoxygenation) management. After modeling and exposure, body weight and biochemical indicators were measured, and fecal samples were collected for 16S rRNA sequencing.
Results: DIO rats in the IH group showed increased weight gain (p=0.0016) and elevated systemic inflammation, including IL-6 (p=0.0070) and leptin (p=0.0004). Moreover, IH rats exhibited greater microbial diversity (p< 0.0167), and significant alterations in the microbial structure (p=0.014), notably the order Clostridiales, accompanied by an upregulation of bile acid metabolism predicted pathway (p=0.0043). Reoxygenation not only improved IH-exacerbated obesity, systemic inflammation, leptin resistance, and sympathetic activation, but also showed the potential to restore IH-induced microbial alterations. Elevated leptin levels were associated with Ruminococcaceae (p=0.0008) and Clostridiales (p=0.0019), while body weight was linked to Blautia producta (p=0.0377). Additionally, the abundance of Lactobacillus was negatively correlated with leptin levels (p=0.0006) and weight (p=0.0339).
Conclusion: IH leads to gut dysbiosis and metabolic disorders, while reoxygenation therapy demonstrates a potentially protective effect by restoring gut homeostasis and mitigating inflammation. It highlights the potential benefits of CPAP in reducing metabolic risk among obese patients with OSA.
Keywords: intermittent hypoxia, reoxygenation, high-fat diet-induced obese, gut microbiota, 16S rRNA
Introduction
Gut microbiota, the most abundant microorganism within the human body, exhibits a symbiotic relationship with the host and assumes a crucial function in the preservation of healthy homeostasis as the “second genome”.1,2 Diet and environmental factors impact the structure and function of gut microbiota, and disturbances in gut microbiota have been implicated in various metabolic and immune disorders. With advancements in bioinformation technology, targeting gut microbiota to regulate gut homeostasis offers promising prospects for disease prevention and treatment.
Obstructive sleep apnea (OSA), the most common sleep breathing disorder, is characterized by recurrent episodes of complete obstruction (apnea) or partial collapse (hypopnea) of the upper airway during sleep, followed by intermittent low O2 (hypoxia) with or without high CO2 (hypercapnia), which mostly affects middle-aged and elderly males. Intermittent hypoxia (IH), a key component of OSA, elicits detrimental pathophysiological processes.3–5 including oxidative stress, low-grade systemic inflammation, endothelial dysfunction, sympathetic nerve activity (SNA), and metabolic dysfunction, part of which are mediated via gut microbiota.6,7 Extensive studies have established connections between gut microbiota and cardiovascular as well as metabolic diseases,8–12 which also are common complications of OSA. Recent researches further indicate the associations between IH and gut microbiota.6,13–15 IH disturbs the intestinal epithelial barrier, leading to increased intestinal permeability (leaky gut),15–17 which fosters an inflammatory milieu and alters the structure of gut microbiota.13,14,16 Gut strategies, probiotic and prebiotic supplementation, as well as microbiota transplantation, have shown promise in the prevention and reversal of OSA and its related conditions.13,14
Obesity is recognized as a high-risk factor for OSA.18,19 Evidence supports the reciprocal relationship between obesity and OSA.20,21 As the global obesity epidemic worsens, so does the incidence of OSA,22,23 approximately four times higher in obese individuals compared to those within a normal weight range.23 OSA commonly coexists with obesity, and both conditions can cause metabolic diseases.5,21 Many studies have revealed the critical role of gut microbiota and its metabolites in the occurrence and development of obesity and associated metabolic complications.24–26 Various microorganisms can exert direct and indirect effects, leading to variations in the host’s metabolic phenotype. The impact of the combined influence of IH and obesity on gut microbiota homeostasis remains unclear. Continuous positive airway pressure (CPAP), the current first-line treatment to alleviate hypoxia in patients with moderate to severe OSA, remains controversial in terms of weight management.27
We hypothesize that IH exposure could potentially alter gut microbiota and exacerbate metabolic disorders in obese rats, and that reoxygenation therapy may have a beneficial effect in restoring gut homeostasis. Therefore, the study conducted intermittent hypoxia/reoxygenation (IH/R) intervention on the diet-induced obese (DIO) rat model to investigate the assumptions.
Materials and Methods
Animals
2-week-old male Sprague-Dawley (SD) rats were obtained from SJA Laboratory Animal Co., Ltd (Hunan, China, permit number: SCXK, Hunan, 2019–0004) and utilized in this study following one week of acclimation. Throughout the experiment, the rats were kept in a controlled environment with regulated temperature and humidity with a 12-hour light/dark cycle. Based on previous studies on gut microbiota and taking into account the success rate of obese animal modeling and the mortality rate due to hypoxia intolerance,28–30 a total of 90 male SD rats were included in this study. All rats were provided with ad libitum access to diet and water. 80 rats were fed a high-fat diet (HFD) (Medicience Professionals for Lab Animal Diets Co., Ltd, Jiangsu, China) for 8 weeks to establish the DIO model, while the other 10 rats were fed a normal diet (ND) and employed as controls. The HFD formula comprised 79% standard chow, 10% lard fat, 10% powdered egg yolk, and 1% cholesterol, with a standard sodium content of 0.23%. After the 8-week feeding, the HFD rats exceeding the average weight of the ND group by 20% were identified as the DIO rats, with obese-resistant rats being excluded to ensure the successful establishment of the model. 45 modeled DIO rats were maintained on HFD and randomly allocated to different oxygen exposure conditions using the random number method for subsequent experiments. All animal care and experimental protocols were approved by the Nanfang Hospital Animal Ethic Committee (application number: NFYY-2022-0119) and followed Laboratory Animal—Guideline for ethical review of animal welfare (GB/T 35892–2018).
Intermittent Hypoxia and Reoxygenation Exposure
Following random assignment into three equal groups, 45 DIO rats were separately exposed to normoxia (NM), IH, or hypoxia/reoxygenation (HR). To simulate severe OSA, the IH rats were placed in closed hypoxia chambers equipped with a gas concentration controller (I0P1US-L, Yuyan Instruments Co., Ltd, Shanghai, China) to regulate the IH cycles. Within a 120-second cycle, the oxygen concentration gradually reduced from 21% (equivalent to room air) to 6% over a 50-s period, maintained at 6% for 20s, reoxygenated back to 21% over the following 30-s period, and then held constant for additional 20s. In the IH group, the hypoxia duration lasted for 8 hours (9:00 am to 5:00 pm) daily to coincide with the typical human sleep schedule for 4 weeks, while the HR group transitioned into normoxic conditions after 2 weeks of IH management.
ELISA
After the 4-week IH/R intervention, 45 rats underwent a 12-hour fast. Subsequently, tail vein blood was taken around 8:00 am the following day. Circulating levels of circulating IL-6, Ang-II, and leptin were respectively determined using commercial kits from LunChangShuo Biotech (Xiamen, China): rat IL-6 ELISA kit (ED-30219, sensitivity: 1 pg/mL, detection range: 5-160 pg/mL), rat Ang-II ELISA kit (ED-31165, sensitivity: 1 pg/mL, detection range: 31.25-1000 pg/mL) and rat leptin ELISA kit (ED-30771, sensitivity: 0.1 ng/mL, detection range: 0.25-8 ng/mL). The measurements were performed by an automatic microplate reader (WD-2102B, Liuyi Biotechnology Co., Ltd, Beijing, China), and the chemiluminescence signal was detected at 450 nm.
DNA Extraction and 16S rRNA Sequencing
Fecal samples were collected after IH/R management and immediately stored at -80°C for 16S rRNA sequencing. Fecal DNA was extracted from the samples using a ZR fecal DNA kit (D6010, Zymo Research, USA), and the concentration was measured using NanoDrop (840-317400, Thermo Fisher, USA).
To construct the 16S rRNA sequencing library, 50 ng of DNA was utilized with Q5 high-fidelity DNA polymerase (M0515, NEB, USA), amplified and sequenced targeting the V3-V4 region of 16S rRNA gene (forward primer 5′-GTGCCAGCMGCCGCGGT-3′, reverse primer 5′-AAGGACTACHVGGGTWTCTAAT-3′), and purified with AMPure XP SPRI reagent (A63880, Beckman Coulter, USA). All samples were sequenced using the QIIME 1.91 pipeline on an Illumina HiSeq 2500 platform.31 Operational taxonomic units were clustered within a 97% similarity threshold through the “Open-Reference” method, and microbial relative abundance at the phylum, class, order, family, genus, and species levels was calculated with taxonomy profiles analysis against GreenGenes database version 13.5.32
Bioinformatics and Statistical Analysis
To obtain the core taxa for bioinformatics analysis, microbial data with a relative abundance below 0.001 or an attendance rate below 70% in all groups were filtered using the R language package EasyMicroPlot.33
α-diversity indices, such as Pielou, Shannon, Simpson, and Invsimpson indices, comprehensively reflected the abundance and distribution of species at a consistent sequencing depth. β-diversity was assessed using weighted Bray-Curtis distances to evaluate dissimilarities in microbial composition among groups, and analysis of similarity (ANOSIM) was performed to verify the effect of grouping. Community distribution bar plots showed the relative abundance of microbial proportion in multiple samples at each taxonomic level. PICRUSt inferred the functional gene composition of samples,31 enabling the determination of metabolic pathways differences between groups against the KEGG database.34 Redundancy analysis (RDA) was based on a linear model at the family level to analyze the association between metabolic parameters and microbial samples. Random forest analysis identified statistically significant biomarkers between groups and ranked these by importance according to mean decrease accuracy. The predictive capacity of these biomarkers in IH rats was assessed using the receiver operating characteristic curve (ROC). Spearman correlation analysis tapped the internal links between microbial biomarkers and biochemical parameters.
Bioinformatics analysis was conducted using RStudio 4.2.2 and other statistical analysis was performed with IBM SPSS Statistics 26. Data were presented as the means ± standard deviation (SD) in tables or the means ± standard error of the mean (SEM) in figures. Normality was assessed using the Shapiro-Wilk method, while homogeneity of variance was evaluated using Levene’s test. Differences between HFD and ND groups were assessed using independent two-sample t-test or Welch’s correction t-test, depending on the homogeneity of variance. For multiple groups with normally distributed data, one-way analysis of variance (ANOVA) followed by the least significant difference (LSD) method as a post hoc test was employed, and Kruskal-Wallis H-test was conducted if data did not conform to the normal distribution or homogeneity of variance. A Bonferroni corrected p-value of less than 0.0167 (0.05/3) was considered statistically significant in multiple comparisons.
Results
IH/R Promotes Metabolic Disorders in DIO Rats
An overview of the study is depicted in Figure 1. After 8 weeks of feeding, rats in the HFD group gained 23.78% over the ND group (523.60±36.24 g vs 423.00±8.91 g, p<0.0001), confirming the successful construction of the DIO rat model (Table 1). As shown in Table 2, the IH group gained more weight (570.80±26.52 g vs 528.40±24.10 g, p=0. 0.0016) than the NM group after 4-week hypoxia exposure, while the body weight of the HR group inclined to decrease (542.90±30.28 g vs 570.80±26.52 g, p=0.0292) after reoxygenation. IH markedly increased body weight in DIO rats, while the same duration of reoxygenation contributed to weight loss, although not statistically significant. Moreover, IH induced a considerable elevation in circulating IL-6 (33.92±2.83 pg/mL vs 29.53±3.31 pg/mL, p=0.0070) and leptin (1.43±0.15 ng/mL vs 1.16±0.14 ng/mL, p=0.0004) in DIO rats, while biochemical indicators in the HR group (IL-6: 30.15±3.31 pg/mL, p=0.0184; leptin: 1.21±0.12 ng/mL, p=0.0026) decreased compared to the persistent hypoxia group (Table 2). Ang-II content exhibited a similar trend, although the difference was not statistically significant (p=0.0608). These results implicate that IH is responsible for subclinical inflammation, leptin resistance and SNA, and that reoxygenation treatment has potential benefit in restoring IH-induced metabolic disorders. Overall, IH promotes macrometabolic abnormalities in DIO rats, leading to weight gain, which can be ameliorated by reoxygenation treatment.
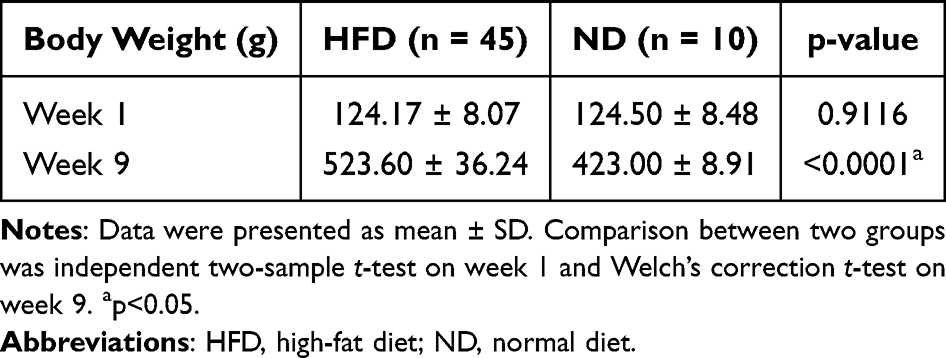 |
Table 1 Baseline Body Weight Between the HFD and ND Group |
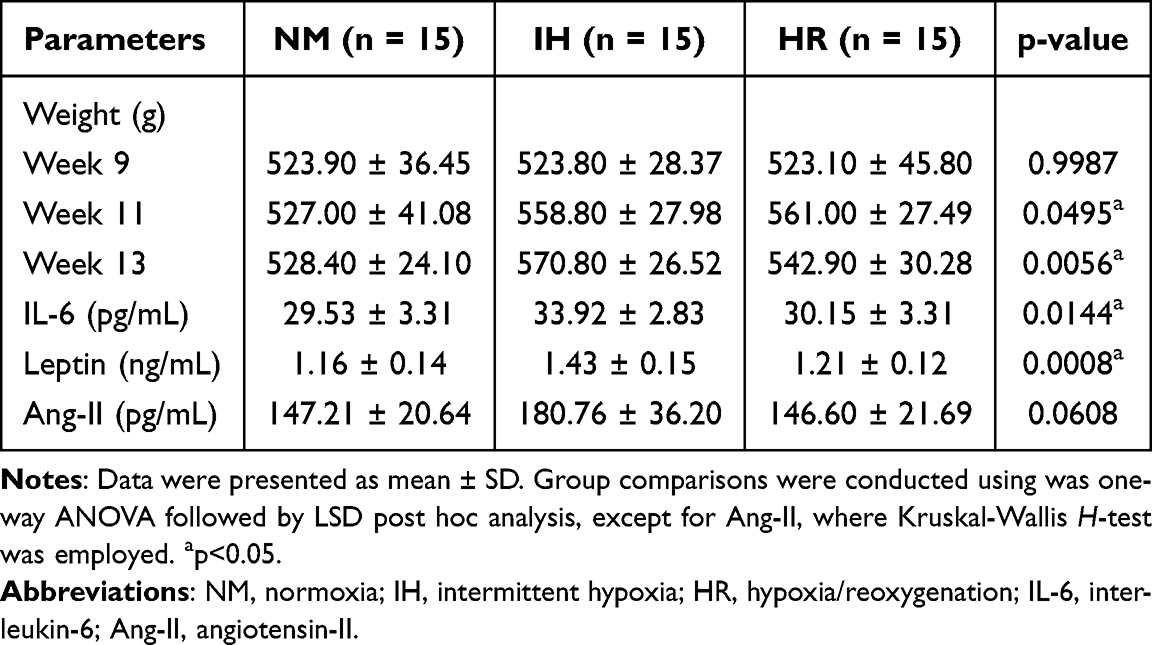 |
Table 2 Metabolic Parameters of NM, IH and HR Group |
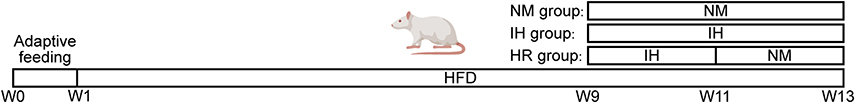 |
Figure 1 Timeline protocol for intermittent hypoxia/reoxygenation (IH/R) procedures in diet-induced obese (DIO) rat model. Abbreviations: HFD, high-fat diet; W, week; NM, normoxia; IH, intermittent hypoxia; HR, hypoxia/reoxygenation. |
IH/R Disturbs Microbial Diversity in DIO Rats
The gut microbiota α-diversity indices, including Pielou (p=0.0019), Shannon (p=0.0018), Simpson (p=0.0128), and Invsimpson indices (p=0.0128), were notably higher in the IH-exposed groups compared to the controls, and there was a downward trend after reoxygenation treatment (Figure 2A). In addition, principal coordinate analysis (PCoA) based on Bray-Curtis distances showed substantial changes (p=0.014) in the overall microbial structure across all three groups, with samples from each group being distinctly separated (Figure 2B). PCoA1 and PCoA2 explain 39.11% and 16.54% respectively of the total variation. In PCoA1, gut microbiota in the IH group was clustered and distinct from the NM controls (p=0.0128) and HR groups (p=0.0022) (Figure 2B), implying significant microbial structural changes under IH exposure. These results indicated that IH profoundly impacts the microbial community in DIO rats, while reoxygenation intervention shows a positive regulatory effect, thus presenting a microbial diversity and composition similar to that of the NM group.
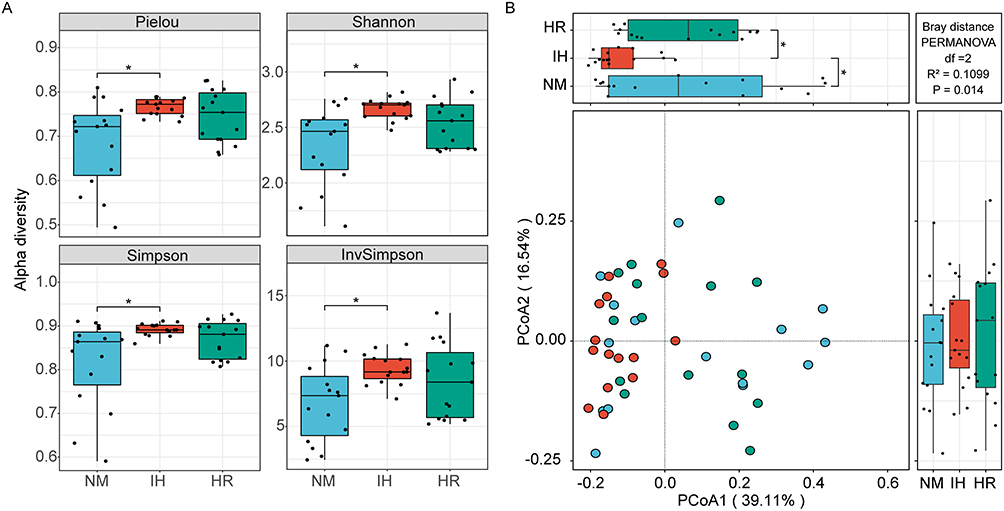 |
Figure 2 Impact of IH/R on gut microbial diversity at the species level. (A) α-diversity is depicted by box plots presenting Pielou, Shannon, Simpson, and Invsimpson indices. (B) Principal coordinate analysis (PCoA) was assessed using Bray-Curtis distances. Data were presented as mean ± SEM. Comparison among multiple groups was Kruskal-Wallis H-test. n=15 per group. *p<0.0167. |
IH/R Dramatically Impacts the Microbial Distributions in Taxa
The microbial distribution of the most abundant taxa among groups was analyzed separately. The phylum Bacteroidetes, Firmicutes, Actinobacteria, and Proteobacteria are the most contributing strains, with Firmicutes accounting for the largest proportion (Figure 3A). However, no significant changes in microbial distribution at the phylum level were observed (Figure 3B). Fortunately, notable shifts in microbial distribution were evident at the family level (Figure 3C). IH caused changes in relative abundance, including an increase in Ruminococcaceae (p=0.0323), Clostridiales Unclassified (p=0.0046), and Streptococcaceae (p=0.0016), all within the phylum Firmicutes (Figure 3D). Among those altered microbiota, Clostridiales Unclassified (p=0.0195) and Ruminococcaceae (p=0.0252) tended to recover after reoxygenation treatment, but the interruption of IH did not prevent the persistent increase in Streptococcacea (p=0.0114, vs the NM group) (Figure 3D). Similarly, altered microbial abundance due to IH/R was observed at the genus level (Figure 3E). IH enriched the genus Ruminococcaceae Unclassified (p=0.0312), Clostridiales Unclassified (p=0.0046), Dorea (p=0.0043), and Erysipelotrichaceae Unclassified (p=0.0270) (all belonging to the order Clostridiales), with these alterations showing a tendency to recover after reoxygenation (Ruminococcaceae Unclassified, p=0.0188; Clostridiales Unclassified, p=0.0195) (Figure 3F). Expect for the continuously elevated Erysipelotrichaceae Unclassified (p=0.0146, vs the NM group) in the HR group (Figure 3F). Additionally, the relative abundance of Lactobacillus (p=0.0694) showed a tendency to decrease after hypoxia and enrich after reoxygenation during the IH/R process (Figure 3F). In summary, IH influences the composition of gut microbiota in DIO rats, with some of these alterations tending to be restored through reoxygenation treatment.
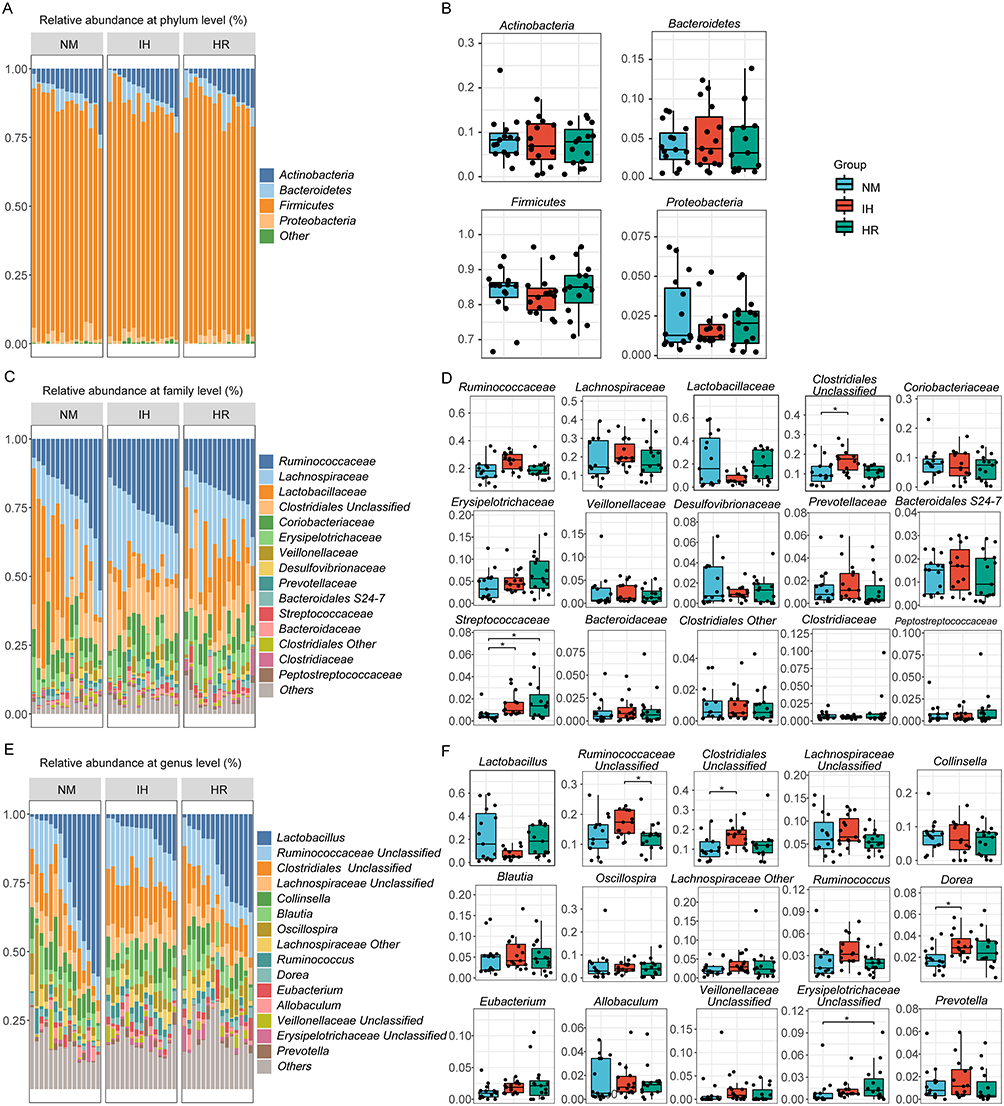 |
Figure 3 IH/R altered the gut microbial distributions in DIO rats. (A) Community distribution bar plot at the phylum level, and (B) relative abundance of the top 4 most abundant phyla. (C) Community distribution bar plot at the family level, and (D) relative abundance of the top 15 most abundant families. (E) Community distribution bar plot at the genus level, and (F) relative abundance of the top 15 most abundant genera. Data were presented as mean ± SEM. Comparison among multiple groups was Kruskal-Wallis H-test. n=15 per group. *p<0.0167. |
IH/R Interferes with Predicted Macro-Genome Function in DIO Rats
We employed the PICRUSt tool to infer macro-genome function by comparing species information obtained from the 16S rRNA sequencing data to analyze functional differences. Based on the Kruskal-Wallis H-test, 11 candidate pathways (p<0.05) were identified from 328 predicted KEGG metabolic pathways to annotate the heat map, indicating that different hypoxia exposures lead to changes in gut microbiota metabolism. The predicted function disclosed that IH increased pathway associated with ether lipid metabolism, bile secretion, mineral absorption, flavonoid biosynthesis, carotenoid biosynthesis and electron transfer carriers, while downregulating pathways like fluorobenzoate degradation and ion channels (Figure 4). These findings suggest the essential role of IH in activating metabolic pathways associated with absorption, synthesis and secretion. Predicted results demonstrate that IH-induced gut dysbiosis in obese rats disrupts the microbiota metabolic function, potentially contributing to host metabolic disorders and diseases.
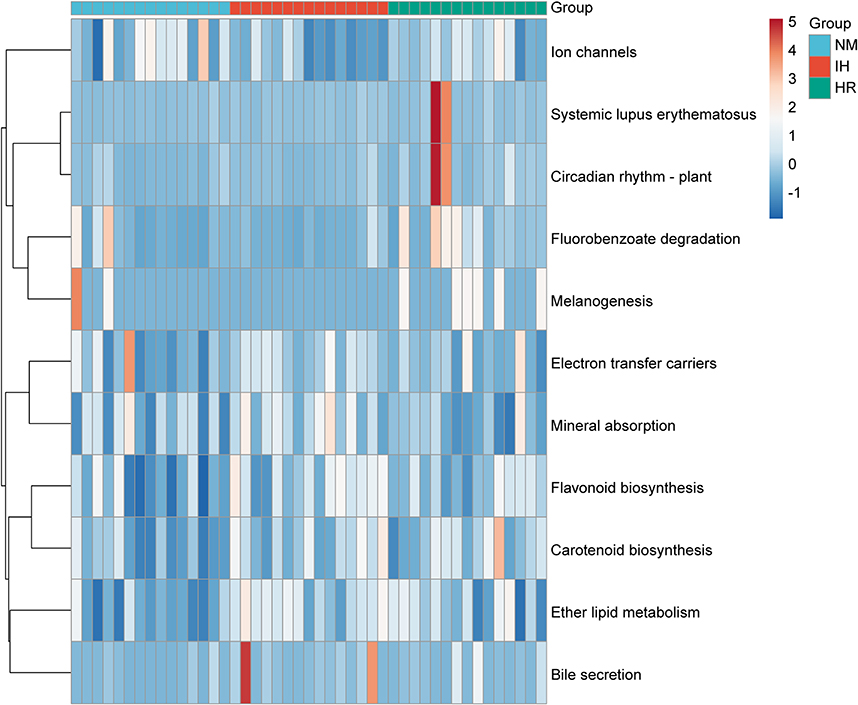 |
Figure 4 Heatmap depicting 11 significant pathways selected from 328 predicted KEGG metabolic pathways. n=15 per group. Color indicates correlations according to Spearman correlation coefficients (blue=negative, red=positive). |
Gut Microbiota Alterations are Closely Connected to Metabolic Parameters
As described earlier, IH/R resulted in obvious changes in body weight, biochemical indicators, and gut microbiota in DIO rats. RDA was applied to connect metabolic parameters with microbial relative abundance at the family level, aiming to investigate the connection between metabolic disorders and gut dysbiosis. Results suggested that metabolic disturbances due to IH/R were highly correlated with gut microbiota segregation and aggregation among groups. 28.16% of the variance could be explained by 4 metabolic factors, with RDA1 and RDA2 accounting for 13.75% and 7.627% of the variance respectively (Figure 5). Monte Carlo permutation test revealed that metabolic parameters, including body weight (p<0.001), IL-6 (p<0.001), leptin (p<0.001), and Ang-II (p=0.028), were closely correlated with microbial taxa.
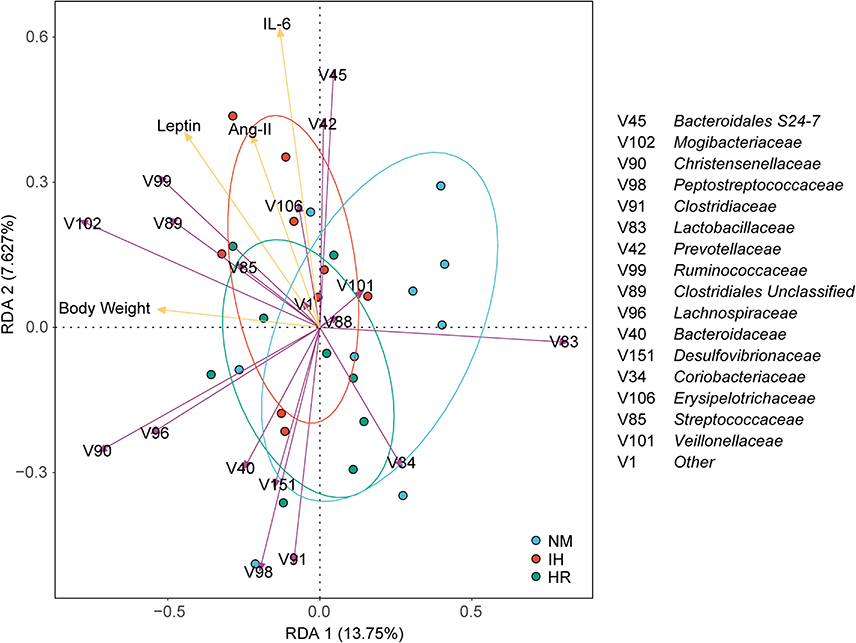 |
Figure 5 Redundancy analysis (RDA) tri-plot was performed on the microbial families and metabolic parameters (body weight, IL-6, leptin, and Ang-II). Purple arrows represent microbial families, yellow arrows represent metabolic parameters, arrow length indicates correlation strength, and arrow direction reflects parameter trends. Angle formed signifies correlation direction, with sharp angles denoting positive correlation and obtuse angles denoting negative correlation. |
Identification of Biomarker Species Associated with IH/R
The model identified 9 biomarker species by random forest and five-fold cross-validation of 10 trials to discern valuable microbial biomarkers (Figure 6A). Biomarker species were screened to establish an IH predictive model in DIO rats, effectively discriminating IH rats from the NM group, with an area under curve (AUC) equal to 0.867 (Figure 6B). The abundance of biomarkers altered during the IH/R process. Specifically, IH increased the relative abundance of Streptococcus (p=0.0016), Clostridiales (p=0.0046), Ruminococcaceae (p=0.0312), Dorea (p=0.0050), and Coriobacteriaceae (p=0.0071) (Figure 4C). In addition, the relative abundance of Streptococcus (p=0.014) and Erysipelotrichaceae (p=0.0146) remained elevated after reoxygenation, while Clostridiales (p=0.0195) and Ruminococcaceae (p=0.0188) tended to rebound (Figure 6C). The richness of Clostridiales, Lactobacillus, Ruminococcaceae, and Blautia producta inclined to oscillate with the IH/R transition (Figure 6C).
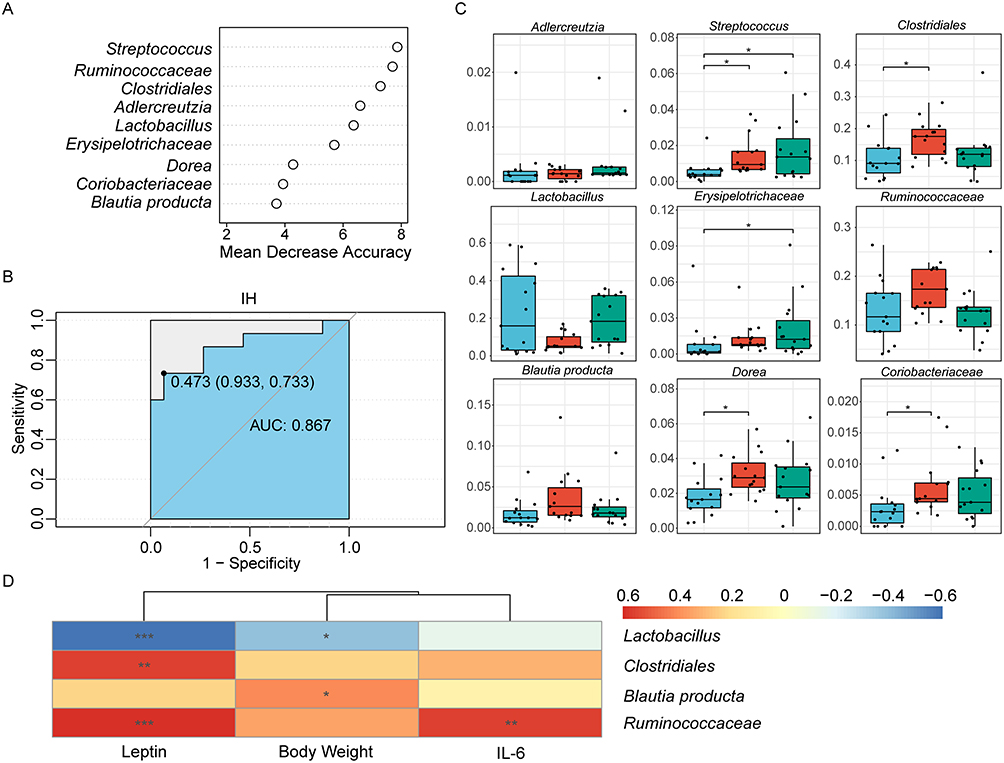 |
Figure 6 Identification of characteristic biomarkers in the DIO rats model related to IH by random forest analysis. (A) Screening of 9 biomarker species based on rank according to mean decrease accuracy score in the random forest predictive model. (B) Assessment of discriminatory ability by the receiver operating characteristic curve (ROC). (C) Relative abundances of the 9 filtered biomarker species. Data were presented as mean ± SEM. Comparison among multiple groups was Kruskal-Wallis H-test. *p<0.0167. (D) Correlations between metabolic parameters and biomarker species, with color representing Spearman correlation coefficients (blue=negative, red=positive, *p<0.05, **p<0.01, ***p<0.001). n=15 per group. Abbreviation: AUC, area under curve. |
According to Spearman correlation analysis, three metabolic parameters, except Ang-II, were strongly correlated with alterations in the biomarkers. Leptin (p=0.0008) and IL-6 (p=0.0020) were positively correlated with changes in the relative abundance of Ruminococcaceae (Figure 6D). Clostridiales (p=0.0019) showed a positive correlation with leptin, while Blautia producta (p=0.0377) was positively correlated with body weight (Figure 6D). In contrast, Lactobacillus was negatively correlated with leptin (p=0.0006) and body weight (p=0.0339) (Figure 6D).
Discussion
The study investigates the impact of IH/R protocol on gut microbiota in obese rats. Results demonstrated a significant increase in microbial α-diversity following IH exposure, along with shifts in microbial composition characterized by an enrichment of the order Clostridiales, including Ruminococcaceae and Dorea. Besides, there was a decreasing trend in the abundance of the genus Lactobacillus in DIO rats, with both bacterial communities undergoing shifts during the IH/R transition. Meanwhile, IH exposure led to the upregulation of bile acid metabolism pathways, suggesting implications for host energy metabolism. ROC curves, constructed using 9 biomarker species such as Ruminococcaceae, Clostridiales, Dorea, Blautia producta, and Lactobacillus, facilitated the development of a predictive model for distinguishing IH-exposed obese rats from those obese counterparts. Furthermore, the observed IH-induced microbial alterations were closely correlated with changes in body weight and circulating levels of IL-6 and leptin. Notably, reoxygenation treatment, equivalent to CPAP, potentially mitigated IH-induced alterations in weight, microbiota, and inflammatory markers, with leptin levels reverting to the pre-IH states.
Weight gain in DIO rats is influenced by several factors, including animal strain and batch, sex, age at initiation of dietary intervention, housing conditions, and food texture.35 Studies have shown that initiating dietary intervention at a younger age may not result in a readily apparent obesity phenotype.36 After a period of HFD feeding, DIO rats typically reach a weight plateau to regulate unrestricted weight gain. However, IH stimulation may disturb this equilibrium, leading to an energy imbalance and constant weight gain, thus forming a detrimental hypoxic-metabolic cycle. Previous studies on IH have predominantly centered on non-obese individuals, overlooking the high prevalence of obesity. Therefore, the synergistic effects of OSA and obesity need to be taken into consideration, which is the reason for the focus on DIO rats in our study.
We noted a striking rise in gut microbiota α-diversity and a cluster shift based on the Bray-Curtis distances among the IH obese rats, consistent with previous findings on non-obese animals.15,37,38 It implies that hypoxia promotes the proliferation of bacteria, particularly anaerobes such as those belonging to the class Clostridia. Interestingly, the IH group exhibited a more diverse community structure and a more intricate and stable ecological co-occurrence network, potentially serving as an adaptive response of the gut to the hypoxic environment. However, despite these microbial changes, no significant shift was observed at the phylum level in IH obese rats, and the microbial dysbiosis index closely linked to obesity, namely the Firmicutes/Bacteroidetes ratio, remained elevated. In line with our findings, a randomized clinical trial showed that although 7 days of mild IH exposure did not affect microbial diversity in overweight or obese men, it did lead to a marked increase in the abundance of specialized anaerobic bacterial genera.39 Furthermore, previous animal experiments observed that the mice treated with IH combined with HFD were lighter than those on HFD alone,40,41 contrary to our findings. These experiments were conducted with IH and diet intervention at the same time, whereas our research commenced with the HFD intervention to establish the DIO animal model before IH exposure, thereby excluding the involvement of obesity-resistant animals and precisely focusing on obese individuals.
Whether obese or non-obese, IH induces enhanced community richness and the enrichment of Clostridiales and reduces the abundance of Lactobacillus.15,37 Moreover, several studies in non-obese individuals have found that IH induces an obvious rise in the family Desulfovibrionaceae,15,37,42,43 which is implicated in intestinal barrier disruption by mucins degradation,44 increased intestinal permeability, bacterial translocation, and compromised tight junction integrity, allowing for heightened systemic inflammation. Rather, the alteration in Desulfovibrionaceae following the IH/R process in our study was not significant, with some samples even showing a reduction after IH, implying a potential protective effect of obesity on the intestinal barrier in combination with IH exposure. Except for the families Streptococcaceae and the genus Erysipelotrichaceae Unclassified, which remained consistently elevated, other abundant taxa exhibited a tendency to return to normoxic levels after reoxygenation. Contrary to our findings, Isabel et al reported incomplete recovery of microbial community ratios to normal levels after 6-week reoxygenation following 6-week IH exposure in non-obese mice, indicating potentially irreversible changes at various taxonomic levels.45 These disparities could be attributed to differences in IH duration and cycle settings, as the mice in their studies experienced more severe and prolonged IH exposure. The potential reversal effects of reoxygenation in obese IH rats suggest that the potent influence of obesity may partially mask the adverse consequences of IH. However, gut microbiota and circulating inflammatory factors did not fully restore after reoxygenation, possibly due to insufficient reoxygenation time.
Pro-inflammatory factors, including IL-6, leptin and Ang-II, are related to OSA and obesity. IH leads to increased leptin levels and subsequent leptin resistance, leading to weight gain.46 Consequently, the increased release of leptin by adipose tissue exacerbates systemic nonspecific inflammation, impairing the weight-loss effects of leptin.47 IH-induced gut dysbiosis disrupts the intestinal barrier and upregulates the expression of inflammatory factors, like IL-6.48,49 Obese patients with co-existing OSA have higher levels of leptin and inflammatory factors,50 which can be improved by effective CPAP treatment.51,52 Similarly, OSA is correlated with elevated Ang-II concentrations, a marker of SNA,53 which contributes to cardiovascular diseases like hypertension.54 In contrast, short-term CPAP treatment may aid in the recovery of DIO rats to their pre-IH metabolic state, with the extent of recovery being influenced by the severity of hypoxia, the duration of reoxygenation treatment, and the individual’s obesity status.
Core bacteria alter in response to IH/R, and RDA confirms the correlation between microbial taxa and metabolic parameters. Two well-known groups of bacteria, notably the order Clostridiales, exhibit a salient shift in the IH/R process. Clostridiales, a prominent gut microbial commensal, is anaerobic and serves as an essential chemotrophic bacterium beneficial for nutrient digestion and absorption. It plays a key role in carbohydrate and fiber fermentation, generating short-chain fatty acids (SCFAs), such as butyric, acetic, and propionic acids to provide energy to colonic cells.55,56 The effects of IH on SCFAs-producing bacteria appear inconsistent, as some studies report a reduction in SCFAs-producing bacteria in patients with OSA,38 while others argue that it is not affected by IH exposure.57 Increased SCFAs production has been observed in obesity,58–60 providing an additional energy source to the host,26,61 thereby promoting lipid biosynthesis and lipid accumulation. However, contrary findings suggest that SCFAs have positive effects by reducing inflammation, improving insulin resistance and suppressing appetite, and are beneficial in weight loss.62
Another microbial community, Lactobacillus, tends to decrease in obese IH rats and increase after reoxygenation treatment. As a typical intestinal probiotic, Lactobacillus colonizes and proliferates in the gut, inhibiting the growth of pathogenic bacteria, thereby improving the intestinal environment and maintaining gut microbiota homeostasis. Lactobacillus supplementation can improve host intestinal glucose transport function, increase the abundance of beneficial gut bacteria, exert the hypoglycemic and hypolipidemic effects, and improve glucose and cholesterol metabolism in DIO animals through modulating the transcription of key genes for ion channels and glucose and cholesterol metabolism.63,64 Furthermore, Lactobacillus improves gut dysbiosis, reinforces the intestinal barrier, prevents bacterial toxins translocation, and mitigates systemic low-grade inflammation in DIO animals.65
In addition, metabolic functional pathways related to absorption, synthesis, and secretion were enriched in the IH group, with the exuberant bile secretion metabolism. Bile acids (BAs), the main component of bile, are amphipathic molecules synthesized by hepatocytes. BAs facilitate lipid absorption in the gut and modulate metabolic and inflammatory signaling pathways, primarily through the farnesoid X receptor (FXR) and the Takeda G protein-coupled receptor 5 (TGR5).66,67 The gut microbiota participates in BAs metabolism by converting primary BAs to secondary BAs and regulating the activity of BAs-activated receptors.68 Similar to SCFAs, BAs have dual functionality. On the one hand, it promotes intestinal epithelial cell proliferation to reduce intestinal permeability and also increase insulin sensitivity.69 In non-obese IH mice, the downregulation of bacterial enzymes regulating secondary BAs conversion contributes to intestinal inflammation.37 On the other hand, elevated levels of BAs in obesity compared to non-obese individuals may be related to the inhibition of FXR and TGR5 in response to insulin resistance, leading to compensatory elevation of BAs ligands.70 Clostridiales is involved in the BAs metabolism of the host.71 Studies have shown that the decrease in Clostridiales and its metabolite concentrations in patients after bariatric surgery enables an increase in metabolite concentrations via reverse concentration transport,72 potentially explaining the weight changes due to IH/R.
Our work has several limitations. Firstly, the study lacked the standard diet rats in room air as a true blank control group. Secondly, due to the absence of blood pressure monitoring, the rough assessment of hypertension-related factors Ang-II may not accurately reflect blood pressure levels. Additionally, the relatively short duration of IH exposure may not adequately elucidate the OSA condition in the actual obese population. Furthermore, the composition of the macro-genome function is predicted to rely on 16S rRNA sequencing data. Subsequent studies require further integration with serum metabolome analysis to explore the specific mechanisms of gut microbiota dysbiosis in the IH/R process.
Conclusion
In summary, the study elucidated the changes in body weight, biochemical indicators, and gut microbiota in obese rats undergoing the IH/R transition. It demonstrated the strong association between gut microbiota and metabolic phenotype in obese rats subjected to IH, highlighting the potentially protective effects of reoxygenation treatment. Currently, CPAP therapy alone exhibits heterogeneous efficacy in improving the metabolism and body weight in individuals, especially obese subjects with OSA. The underlying mechanism is worth exploring. Gut microbiota is closely associated with numerous abnormalities, especially in metabolism. This study lays the groundwork for studying to which extent CPAP alone can reverse IH-induced metabolic disorders and obesity, and elucidating potential mechanisms involving gut microbiota. Additional probiotics, as a supplementary strategy just like lifestyle intervention, may offer a valuable application for improving metabolic status and losing weight alongside CPAP treatment.
Funding
Financial support was provided by National Natural Science Foundation of China (NSFC) grant 81900089 to conduct this study. The funding body had no role in any stage from research design to the submission of papers for publication.
Disclosure
The authors report no conflicts of interest in this work.
References
1. Scheithauer TP, Dallinga-Thie GM, de Vos WM, et al. Causality of small and large intestinal microbiota in weight regulation and insulin resistance. Mol Metab. 2016;5(9):759–770. doi:10.1016/j.molmet.2016.06.002
2. Valdes AM, Walter J, Segal E, et al. Role of the gut microbiota in nutrition and health. BMJ. 2018;361:k2179. doi:10.1136/bmj.k2179
3. Gottlieb DJ, Punjabi NM. Diagnosis and management of obstructive sleep apnea: a review. JAMA. 2020;323(14):1389–1400. doi:10.1001/jama.2020.3514
4. Dempsey JA, Veasey SC, Morgan BJ, et al. Pathophysiology of sleep apnea. Physiol Rev. 2010;90(1):47–112. doi:10.1152/physrev.00043.2008
5. Gleeson M, McNicholas WT. Bidirectional relationships of comorbidity with obstructive sleep apnoea. Eur Respir Rev. 2022;31(164):210256. doi:10.1183/16000617.0256-2021
6. Badran M, Mashaqi S, Gozal D. The gut microbiome as a target for adjuvant therapy in obstructive sleep apnea. Expert Opin Ther Targets. 2020;24(12):1263–1282. doi:10.1080/14728222.2020.1841749
7. Zhang X, Wang S, Xu H, et al. Metabolomics and microbiome profiling as biomarkers in obstructive sleep apnoea: a comprehensive review. Eur Respir Rev. 2021;30(160):200220. doi:10.1183/16000617.0220-2020
8. Mochol J, Gawrys J, Gajecki D, et al. Cardiovascular disorders triggered by obstructive sleep apnea-a focus on endothelium and blood components. Int J Mol Sci. 2021;22(10):5139. doi:10.3390/ijms22105139
9. Song SO, He K, Narla RR, et al. Metabolic consequences of obstructive sleep apnea especially pertaining to diabetes mellitus and insulin sensitivity. Diabetes Metab J. 2019;43(2):144–155. doi:10.4093/dmj.2018.0256
10. Kheirandish-Gozal L, Gozal D. Obstructive sleep apnea and inflammation: proof of concept based on two illustrative cytokines. Int J Mol Sci. 2019;20(3):459. doi:10.3390/ijms20030459
11. Barros D, Garcia-Rio F. Obstructive sleep apnea and dyslipidemia: from animal models to clinical evidence. Sleep. 2019;42(3). doi:10.1093/sleep/zsy236
12. Li M, Li X, Lu Y. Obstructive sleep apnea syndrome and metabolic diseases. Endocrinology. 2018;159(7):2670–2675. doi:10.1210/en.2018-00248
13. Cai Y, Juszczak HM, Cope EK, et al. The microbiome in obstructive sleep apnea. Sleep. 2021;44(8). doi:10.1093/sleep/zsab061
14. Durgan DJ, Ganesh BP, Cope JL, et al. Role of the gut microbiome in obstructive sleep apnea-induced hypertension. Hypertension. 2016;67(2):469–474. doi:10.1161/HYPERTENSIONAHA.115.06672
15. Moreno-Indias I, Torres M, Montserrat JM, et al. Intermittent hypoxia alters gut microbiota diversity in a mouse model of sleep apnoea. Eur Respir J. 2015;45(4):1055–1065. doi:10.1183/09031936.00184314
16. Mashaqi S, Gozal D. Obstructive sleep apnea and systemic hypertension: gut dysbiosis as the mediator? J Clin Sleep Med. 2019;15(10):1517–1527. doi:10.5664/jcsm.7990
17. Xu DZ, Lu Q, Kubicka R, et al. The effect of hypoxia/reoxygenation on the cellular function of intestinal epithelial cells. J Trauma. 1999;46(2):280–285. doi:10.1097/00005373-199902000-00014
18. Peppard PE, Young T, Palta M, et al. Longitudinal study of moderate weight change and sleep-disordered breathing. JAMA. 2000;284(23):3015–3021. doi:10.1001/jama.284.23.3015
19. Yeghiazarians Y, Jneid H, Tietjens JR, et al. Obstructive sleep apnea and cardiovascular disease: a scientific statement from the American heart association. Circulation. 2021;144(3):e56–e67. doi:10.1161/CIR.0000000000000988
20. Rodrigues GD, Fiorelli EM, Furlan L, et al. Obesity and sleep disturbances: the ”chicken or the egg” question. Eur J Intern Med. 2021;92:11–16. doi:10.1016/j.ejim.2021.04.017
21. Wei Z, Chen Y, Upender RP. Sleep Disturbance and Metabolic Dysfunction: the Roles of Adipokines. Int J Mol Sci. 2022;23(3). doi:10.3390/ijms23031706
22. Fietze I, Laharnar N, Obst A, et al. Prevalence and association analysis of obstructive sleep apnea with gender and age differences - Results of SHIP-Trend. J Sleep Res. 2019;28(5):e12770. doi:10.1111/jsr.12770
23. Peppard PE, Young T, Barnet JH, et al. Increased prevalence of sleep-disordered breathing in adults. Am J Epidemiol. 2013;177(9):1006–1014. doi:10.1093/aje/kws342
24. Lee CJ, Sears CL, Maruthur N. Gut microbiome and its role in obesity and insulin resistance. Ann N Y Acad Sci. 2020;1461(1):37–52. doi:10.1111/nyas.14107
25. Liu BN, Liu XT, Liang ZH, et al. Gut microbiota in obesity. World J Gastroenterol. 2021;27(25):3837–3850. doi:10.3748/wjg.v27.i25.3837
26. Scheithauer TPM, Rampanelli E, Nieuwdorp M, et al. Gut microbiota as a trigger for metabolic inflammation in obesity and type 2 Diabetes. Front Immunol. 2020;11:571731. doi:10.3389/fimmu.2020.571731
27. Ng SS, Tam WWS, Lee RWW, et al. Effect of weight loss and continuous positive airway pressure on obstructive sleep apnea and metabolic profile stratified by craniofacial phenotype: a randomized clinical trial. Am J Respir Crit Care Med. 2022;205(6):711–720. doi:10.1164/rccm.202106-1401OC
28. Khalyfa A, Ericsson A, Qiao Z, et al. Circulating exosomes and gut microbiome induced insulin resistance in mice exposed to intermittent hypoxia: effects of physical activity. EBioMedicine. 2021;64:103208. doi:10.1016/j.ebiom.2021.103208
29. Olson CA, Iniguez AJ, Yang GE, et al. Alterations in the gut microbiota contribute to cognitive impairment induced by the ketogenic diet and hypoxia. Cell Host Microbe. 2021;29(9):1378–1392 e6. doi:10.1016/j.chom.2021.07.004
30. Zhang XY, Guo CC, Yu YX, et al. Establishment of high-fat diet-induced obesity and insulin resistance model in rats. Beijing Da Xue Xue Bao Yi Xue Ban. 2020;52(3):557–563. doi:10.19723/j.issn.1671-167X.2020.03.024
31. Bolyen E, Rideout JR, Dillon MR, et al. Reproducible, interactive, scalable and extensible microbiome data science using QIIME 2. Nat Biotechnol. 2019;37(8):852–857. doi:10.1038/s41587-019-0209-9
32. McDonald D, Price MN, Goodrich J, et al. An improved Greengenes taxonomy with explicit ranks for ecological and evolutionary analyses of bacteria and archaea. ISME J. 2012;6(3):610–618. doi:10.1038/ismej.2011.139
33. Liu B, Huang L, Liu Z, et al. EasyMicroPlot: an efficient and convenient r package in microbiome downstream analysis and visualization for clinical study. Front Genet. 2021;12:803627. doi:10.3389/fgene.2021.803627
34. Kanehisa M, Goto S. KEGG: Kyoto encyclopedia of genes and genomes. Nucleic Acids Res. 2000;28(1):27–30. doi:10.1093/nar/28.1.27
35. Kleinert M, Clemmensen C, Hofmann SM, et al. Animal models of obesity and diabetes mellitus. Nat Rev Endocrinol. 2018;14(3):140–162. doi:10.1038/nrendo.2017.161
36. Nishikawa S, Yasoshima A, Doi K, et al. Involvement of sex, strain and age factors in high fat diet-induced obesity in C57BL/6J and BALB/cA mice. Exp Anim. 2007;56(4):263–272. doi:10.1538/expanim.56.263
37. Zhang Y, Luo H, Niu Y, et al. Chronic intermittent hypoxia induces gut microbial dysbiosis and infers metabolic dysfunction in mice. Sleep Med. 2022;91:84–92. doi:10.1016/j.sleep.2022.02.003
38. Ko CY, Liu QQ, Su HZ, et al. Gut microbiota in obstructive sleep apnea-hypopnea syndrome: disease-related dysbiosis and metabolic comorbidities. Clin Sci. 2019;133(7):905–917. doi:10.1042/CS20180891
39. Van Meijel RLJ, Venema K, Canfora EE, et al. Mild intermittent hypoxia exposure alters gut microbiota composition in men with overweight and obesity. Benef Microbes. 2022;13(4):355–363. doi:10.3920/BM2021.0159
40. Wang F, Zou J, Xu H, et al. Effects of chronic intermittent hypoxia and chronic sleep fragmentation on gut microbiome, serum metabolome, liver and adipose tissue morphology. Front Endocrinol. 2022;13:820939. doi:10.3389/fendo.2022.820939
41. Wu JX, He Q, Zhou Y, et al. Protective effect and mechanism of lactoferrin combined with hypoxia against high-fat diet induced obesity and non-alcoholic fatty liver disease in mice. Int J Biol Macromol. 2023;227:839–850. doi:10.1016/j.ijbiomac.2022.12.211
42. Farre N, Farre R, Gozal D. Sleep apnea morbidity: a consequence of microbial-immune cross-talk? Chest. 2018;154(4):754–759. doi:10.1016/j.chest.2018.03.001
43. Badran M, Khalyfa A, Ericsson A, et al. Fecal microbiota transplantation from mice exposed to chronic intermittent hypoxia elicits sleep disturbances in naive mice. Exp Neurol. 2020;334:113439. doi:10.1016/j.expneurol.2020.113439
44. Wright DP, Rosendale DI, Robertson AM. Prevotella enzymes involved in mucin oligosaccharide degradation and evidence for a small operon of genes expressed during growth on mucin. FEMS Microbiol Lett. 2000;190(1):73–79. doi:10.1111/j.1574-6968.2000.tb09265.x
45. Moreno-Indias I, Torres M, Sanchez-Alcoholado L, et al. Normoxic recovery mimicking treatment of sleep apnea does not reverse intermittent hypoxia-induced bacterial dysbiosis and low-grade endotoxemia in mice. Sleep. 2016;39(10):1891–1897. doi:10.5665/sleep.6176
46. Ciriello J, Moreau JM, Caverson MM, et al. Leptin: a potential link between obstructive sleep apnea and obesity. Front Physiol. 2021:767318. doi:10.3389/fphys.2021.767318
47. Tulipano G, Vergoni AV, Soldi D, et al. Characterization of the resistance to the anorectic and endocrine effects of leptin in obesity-prone and obesity-resistant rats fed a high-fat diet. J Endocrinol. 2004;183(2):289–298. doi:10.1677/joe.1.05819
48. Forte N, Fernandez-Rilo AC, Palomba L, et al. Obesity affects the microbiota-gut-brain axis and the regulation thereof by endocannabinoids and related mediators. Int J Mol Sci. 2020;21(5):1554. doi:10.3390/ijms21051554
49. Poroyko VA, Carreras A, Khalyfa A, et al. Chronic sleep disruption alters gut microbiota, induces systemic and adipose tissue inflammation and insulin resistance in mice. Sci Rep. 2016;6:35405. doi:10.1038/srep35405
50. Bhatt SP, Guleria R, Kabra SK. Metabolic alterations and systemic inflammation in overweight/obese children with obstructive sleep apnea. PLoS One. 2021;16(6):e0252353. doi:10.1371/journal.pone.0252353
51. Oyama J, Yamamoto H, Maeda T, et al. Continuous positive airway pressure therapy improves vascular dysfunction and decreases oxidative stress in patients with the metabolic syndrome and obstructive sleep apnea syndrome. Clin Cardiol. 2012;35(4):231–236. doi:10.1002/clc.21010
52. Chen X, Niu X, Xiao Y, et al. Effect of continuous positive airway pressure on leptin levels in patients with obstructive sleep apnea: a meta-analysis. Otolaryngol Head Neck Surg. 2015;152(4):610–618. doi:10.1177/0194599814562719
53. Carmichael CY, Wainford RD. Hypothalamic signaling mechanisms in hypertension. Curr Hypertens Rep. 2015;17(5):39. doi:10.1007/s11906-015-0550-4
54. Wolk R, Shamsuzzaman AS, Somers VK. Obesity, sleep apnea, and hypertension. Hypertension. 2003;42(6):1067–1074. doi:10.1161/01.HYP.0000101686.98973.A3
55. Morrison DJ, Preston T. Formation of short chain fatty acids by the gut microbiota and their impact on human metabolism. Gut Microbes. 2016;7(3):189–200. doi:10.1080/19490976.2015.1134082
56. Martin-Gallausiaux C, Marinelli L, Blottiere HM, et al. SCFA: mechanisms and functional importance in the gut. Proc Nutr Soc. 2021;80(1):37–49. doi:10.1017/S0029665120006916
57. O’Connor KM, Lucking EF, Bastiaanssen TFS, et al. Prebiotic administration modulates gut microbiota and faecal short-chain fatty acid concentrations but does not prevent chronic intermittent hypoxia-induced apnoea and hypertension in adult rats. EBioMedicine. 2020;59:102968. doi:10.1016/j.ebiom.2020.102968
58. Rahat-Rozenbloom S, Fernandes J, Gloor GB, et al. Evidence for greater production of colonic short-chain fatty acids in overweight than lean humans. Int J Obes Lond. 2014;38(12):1525–1531. doi:10.1038/ijo.2014.46
59. de la Cuesta-Zuluaga J, Mueller NT, Alvarez-Quintero R, et al. Higher fecal short-chain fatty acid levels are associated with gut microbiome dysbiosis, obesity, hypertension and cardiometabolic disease risk factors. Nutrients. 2018;11(1):51. doi:10.3390/nu11010051
60. Jiao N, Baker SS, Nugent CA, et al. Gut microbiome may contribute to insulin resistance and systemic inflammation in obese rodents: a meta-analysis. Physiol Genomics. 2018;50(4):244–254. doi:10.1152/physiolgenomics.00114.2017
61. Schwiertz A, Taras D, Schafer K, et al. Microbiota and SCFA in lean and overweight healthy subjects. Obesity. 2010;18(1):190–195. doi:10.1038/oby.2009.167
62. Chambers ES, Viardot A, Psichas A, et al. Effects of targeted delivery of propionate to the human colon on appetite regulation, body weight maintenance and adiposity in overweight adults. Gut. 2015;64(11):1744–1754. doi:10.1136/gutjnl-2014-307913
63. Sun Q, Zhang Y, Li Z, et al. Mechanism analysis of improved glucose homeostasis and cholesterol metabolism in high-fat-induced obese mice treated with La -SJLH001 via transcriptomics and culturomics. Food Funct. 2019;10(6):3556–3566. doi:10.1039/c9fo00205g
64. Rodrigues RR, Gurung M, Li Z, et al. Transkingdom interactions between Lactobacilli and hepatic mitochondria attenuate western diet-induced diabetes. Nat Commun. 2021;12(1):101. doi:10.1038/s41467-020-20313-x
65. Balakumar M, Prabhu D, Sathishkumar C, et al. Improvement in glucose tolerance and insulin sensitivity by probiotic strains of Indian gut origin in high-fat diet-fed C57BL/6J mice. Eur J Nutr. 2018;57(1):279–295. doi:10.1007/s00394-016-1317-7
66. Jia W, Xie G, Jia W. Bile acid-microbiota crosstalk in gastrointestinal inflammation and carcinogenesis. Nat Rev Gastroenterol Hepatol. 2018;15(2):111–128. doi:10.1038/nrgastro.2017.119
67. Just S, Mondot S, Ecker J, et al. The gut microbiota drives the impact of bile acids and fat source in diet on mouse metabolism. Microbiome. 2018;6(1):134. doi:10.1186/s40168-018-0510-8
68. Li Y, Tang R, Leung PSC, et al. Bile acids and intestinal microbiota in autoimmune cholestatic liver diseases. Autoimmun Rev. 2017;16(9):885–896. doi:10.1016/j.autrev.2017.07.002
69. Wahlstrom A, Sayin SI, Marschall HU, et al. Intestinal crosstalk between bile acids and microbiota and its impact on host metabolism. Cell Metab. 2016;24(1):41–50. doi:10.1016/j.cmet.2016.05.005
70. Cariou B, Chetiveaux M, Zair Y, et al. Fasting plasma chenodeoxycholic acid and cholic acid concentrations are inversely correlated with insulin sensitivity in adults. Nutr Metab. 2011;8(1):48. doi:10.1186/1743-7075-8-48
71. Long SL, Gahan CGM, Joyce SA. Interactions between gut bacteria and bile in health and disease. Mol Aspects Med. 2017;56:54–65. doi:10.1016/j.mam.2017.06.002
72. Chaudhari SN, Luo JN, Harris DA, et al. A microbial metabolite remodels the gut-liver axis following bariatric surgery. Cell Host Microbe. 2021;29(3):408–424 e7. doi:10.1016/j.chom.2020.12.004
 © 2024 The Author(s). This work is published and licensed by Dove Medical Press Limited. The
full terms of this license are available at https://www.dovepress.com/terms
and incorporate the Creative Commons Attribution
- Non Commercial (unported, 3.0) License.
By accessing the work you hereby accept the Terms. Non-commercial uses of the work are permitted
without any further permission from Dove Medical Press Limited, provided the work is properly
attributed. For permission for commercial use of this work, please see paragraphs 4.2 and 5 of our Terms.
© 2024 The Author(s). This work is published and licensed by Dove Medical Press Limited. The
full terms of this license are available at https://www.dovepress.com/terms
and incorporate the Creative Commons Attribution
- Non Commercial (unported, 3.0) License.
By accessing the work you hereby accept the Terms. Non-commercial uses of the work are permitted
without any further permission from Dove Medical Press Limited, provided the work is properly
attributed. For permission for commercial use of this work, please see paragraphs 4.2 and 5 of our Terms.