Back to Journals » Journal of Pain Research » Volume 19
Reliability and Validity of Non-Invasive Electrical Detection and Pain Thresholds Using PainVision® in Healthy Young Adults
Authors Yu S, Yang Z, Chen B, Wang L, Huang J, Gou L, Yang L
Received 17 August 2025
Accepted for publication 12 February 2026
Published 17 February 2026 Volume 2026:19 561240
DOI https://doi.org/10.2147/JPR.S561240
Checked for plagiarism Yes
Review by Single anonymous peer review
Peer reviewer comments 2
Editor who approved publication: Professor E Alfonso Romero-Sandoval
Shiya Yu,1,2 Zhimo Yang,1,2 Baoyu Chen,1,2 Lisheng Wang,1,2 Jielei Huang,1,2 Li Gou,1,2 Lin Yang1,2
1Department of Rehabilitation Medicine Center, Sichuan University West China Hospital, Chengdu, Sichuan, 610041, People’s Republic of China; 2Rehabilitation Key Laboratory of Sichuan Province, West China Hospital, Sichuan University, Chengdu, People’s Republic of China
Correspondence: Lin Yang, Department of Rehabilitation Medicine Center, Sichuan University West China Hospital, Chengdu, Sichuan, 610041, People’s Republic of China, Email [email protected]
Background: Electrical detection threshold (EDT) and electrical pain threshold (EPT) measured via PainVision® offer a non-invasive method to objectively assess sensory function, directly targeting specific nerve fibers. This study aimed to evaluate the reliability and preliminary validity of EDT and EPT across different anatomical sites in healthy young adults.
Patients and Methods: Forty-six participants underwent EDT and EPT assessments at four sites across two sessions separated by 2– 3 days. Pain intensity at the medial forearm was recorded using the visual analogue scale (VAS) following 30-second electrical stimulation. Intraclass correlation coefficients (ICC) and minimal detectable changes (MDC) were calculated, and correlations between EPT and VAS were analyzed.
Results: EDT and EPT showed good to excellent reliability (ICC 0.75– 0.95 and 0.83– 0.99, respectively). MDC ranged from 1.26– 1.81 for EDT and 1.18– 1.99 for EPT. EPT was negatively correlated with VAS scores (r = − 0.746, 95% CI [− 0.852, − 0.582]).
Conclusion: EDT and EPT measurements using PainVision® demonstrated robust reliability and preliminary validity in healthy young adults, highlighting their potential as a standardized, non-invasive tool for assessing electrical sensory thresholds. This study provides baseline data for future research in clinical populations.
Keywords: electrical detection threshold, electrical pain threshold, reliability, validity, pain assessment
Introduction
Sensory provides essential information on how individuals perceive and interact with environment, whose pathways contribute to the interaction with external stimuli. However, pain emerges as a unique modality within broad spectrum of sensory experience, integral to signaling potential harm and prompting protective responses. Accurate and reliable measurement of sensory threshold and pain threshold is essential for diagnosing, monitoring, and managing conditions related to nervous impairments and pain disorders, even in understanding nociceptive processing and initiating appropriate responses.1,2 Quantitative Sensory Tests (QST) refer to a set of protocols designed to assess, quantify and analyze sensory function.3 In contrast to Visual Analog Scale (VAS) or Numerical Pain Rating Scale (NPRS), which are entirely subjective, QST measures sensory thresholds by using controlled stimuli to activate specific peripheral receptors. However, its reliability and accuracy are compromised since many QST paradigms are still susceptible to various factors, such as environment, procedural variations and participants’ judgement.4
As a perceptual modality, electrical current presents highly standardized to minimize interference from external environmental factors and subjective participant feedback during the measurement process. Electrical detection threshold (EDT) is defined as the minimum current intensity where the participant perceives a faint sensation transmitted by an electrical current, while electrical pain threshold (EPT) is defined as the current intensity where the sensation shifts from vibration to pain or discomfort. Previous studies suggested the application of EDT and EPT in peripheral nervous assessment,5,6 indicating that differences in individual responses to electrical stimulation provides insights into variations in pain perception and tolerance. Common EDT and EPT paradigms usually involve the inserting needle electrodes to stimulate subcutaneous tissue.7,8 However, it is shown that nociceptive signal processing and descending pain modulation pathway differed between superficial skin and deep subcutaneous tissue.9 To date, insufficient evidence was reported to support the application of EDT and EPT without invasive procedures.
Considering that body composition has been identified as one of the contributing factors of EDT,10 and fat content varies naturally across different body regions, we hypothesized that susceptibility to transcutaneous electrical current would vary among different body regions. To rigorously examine this issue and to minimize confounding influences such as illness or medication on nerve conduction, healthy young adults were recruited as recommended in previous methodological studies.3 Thus, establishing the reliability and validity of transcutaneous EDT and EPT in this controlled population provides essential baseline data, which can serve as a foundation for subsequent clinical investigations in patients with pain or neurological disorders. To address these gaps, this study aims to systematically evaluated the reliability, validity, and region-specific sensitivity of non-invasive transcutaneous EDT and EPT in healthy young adults. We hypothesized that: (1) EDT and EPT would demonstrate acceptable reliability in a controlled healthy population and (2) susceptibility to transcutaneous electrical stimulation would vary across different body regions.
Materials and Methods
Participants
Participants were recruited between 01 June 2024 and 30 September 2024. According to the consensus statement by the EUROPAIN and NEUROPAIN consortia,3 all the participants were without musculoskeletal lesions 3 months before the trail and without neurological or diabetic history. Exclusion criteria were: (1) taking any medication that may relieve pain or alter sensory perception within 24 hours prior to each test session; (2) receiving transcutaneous electrical nerve stimulation, acupuncture or other interventions affecting sensory nerve conduction 48 hours prior to each test session; (3) having a diagnosis of osteoarthritis, immune disease or psychosomatic disease; (4) Hospital Anxiety and Depression Scale (HADS) above 8 points; (5) the skin surface at test site is damaged, red or swollen. Written informed consent was obtained from all participants before data collection. This study was conducted in accordance with the principles of the Declaration of Helsinki. This study was approved by Human Ethics Committee of West China Hospital of Sichuan University (2024–418).
Sample size calculation was performed for EPT with α set at 0.05 using a two-way random effects model. With an intraclass correlation coefficients (ICC) confidence interval range of 0.3 and a good-level ICC of 0.75,11 the required sample size was 37. A total of 46 participants were recruited, considering 20% dropout rate.
Study Procedure
All tests were implemented in a quiet room with constant temperature and humidity between 10 am and 5 pm. Demographic information was collected 20 minutes before the first test by a researcher not involved in the test sessions. Each participant received two test sessions with an interval of 2–3 days with the same identical instruction provided by the same rater to ensure consistency between sessions. Before each test session, all participant were asked to rest for 5 minutes in another quiet room. EDT and EPT were tested in two blocks, lasting approximately 10 minutes for each, separated by 3-minute break. Temporal summation of pain (TSP) was scheduled following 3 minutes after the second session because the mild discomfort elicited by TSP may have affected the pain perception (see Figure 1).
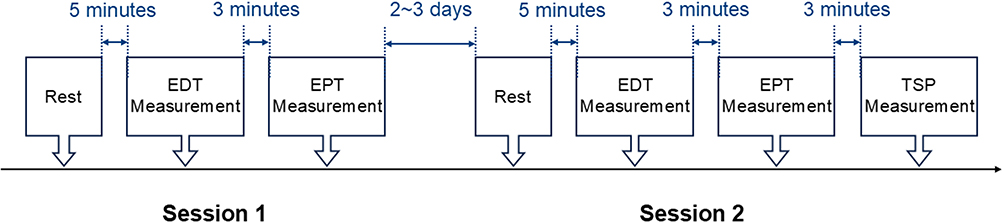 |
Figure 1 Study protocol. Abbreviations: EDT, electrical detection threshold; EPT, electrical pain threshold. |
EDT and EDT Measurement Protocol
Considering common somatosensory evoked potential detection sites and sites of central sensation related to chronic musculoskeletal pain, the following four anatomical sites were selected for EDT and EPT measurement: (1) medial forearm (MF), the belly of wrist flexors 2 cm lateral to the midline of the elbow creases; (2) lateral calf (LC), the belly of peroneus longus and brevis muscle 3 cm distal to the caput fibulae; (3) cervical spine (CS), cervical extensors 2 cm lateral to the C5 spinous process; and (4) lumbar spine (LS), erector spinae muscles 2 cm lateral to the L4 spinous process. All sites were marked before measurement. Dominant side of MF and LC was tested among all participants. Assessment of MF and LC were performed in sitting position with forearm supported by a table and elbow, hip, knee and ankle joints remaining 90 degrees of flexion. Assessment of CS and LS were performed in a prone position with a soft pillow under the belly. Alcohol wipes were used to remove excess surface oil before testing to eliminate the influence of secretions on conductivity. If necessary, local skin depilation would be performed.
The testing order for each session was determined using a computer-generated random sequence before the testing. In this study, the PainVision® PS-2100 (SANYOSEIKO CO., Ltd, Otsuki, Yamanashi Prefecture, Japan) was utilized to assess both EDT and EPT, shown in Figure 2. Before the testing, all participants underwent a preliminary experiment to familiarize themselves with the sensation of electrical stimulation and the use of the handheld switch. The stimulation parameters were set to a frequency of 50 Hz with bidirectional sharp waves, a current intensity range of 0–256 μA, and a pulse duration of 0.3ms. For safety considerations, if the output current reaches the maximum threshold of 256 μA or duration exceeds 120 seconds, the system will automatically halt the current. Researchers placed disposable electrode EL-BAND on the marked test sites, then participants received electrical stimulation starting at 0 μA, with a gradual increase of 0.5 μA/s.12 Participants were asked to halt the current escalation by a handheld switch at their discretion. We conducted the EDT test using standardized instructions recommended by the German Research Network on Neuropathic Pain: “This test primarily evaluates your sensitivity to electrical currents. Once the test begins, the current intensity will gradually increase. If you feel any slight sensation in the area where the electrodes are attached, please press the handheld switch immediately”.3 As for EPT measurement, the current was increased from 0 μA at a rate of 0.5 μA/s. We employed the following recommended standardized instructions: “This test mainly evaluates your sensitivity to pain, and the current intensity will gradually increase. Initially, you may feel a vibrating sensation. Once you experience pain or discomfort in the tested area, please press the handheld switch immediately. Remember, this is not a test of pain tolerance; you do not need to endure the pain”. Accordingly, the minimal current intensity that elicited slight sensation was considered as EDT and that elicited unpleasant pain was considered as EPT. The order of measurements at the four sites was randomly generated by the software. For each EDT or EPT measurement, researchers performed three tests at each anatomical site, with a 1-minute interval. The average of the three measurements was considered as the results, unless the measurements varied significantly, then a fourth measurement was performed.
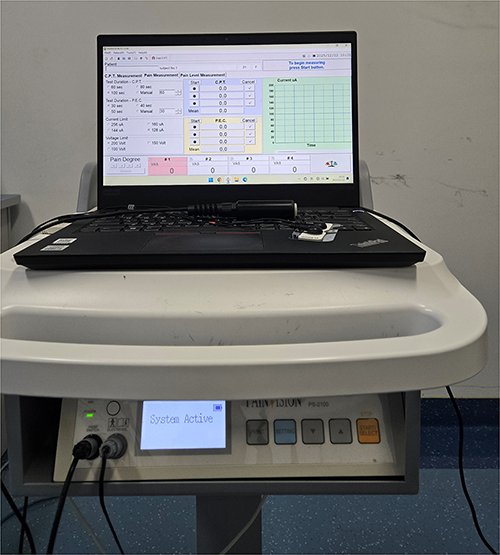 |
Figure 2 PainVision® PS-2100 apparatus used for measuring electrical detection threshold and electrical pain threshold. |
All assessments were conducted by a single rater to ensure consistency, while demographic data were collected by a separate researcher who did not participate in testing. Data analysis was performed by an independent researcher blinded to measurement order and participant identity.
Temporal Summation of Pain Protocol
Similarly, the researcher placed the electrode pads on participant’s MF and pressed the start button. All participants were continuously exposed to electrical stimulation for 30 seconds, with the intensity gradually increasing at a rate of 0.5 μA/s starting from 0 μA. The researcher pressed the handle to stop the stimulation after 30 seconds. If the pain was too intense, participant was asked to inform the researcher to press the handle immediately, then researcher would exam the skin surface at the tested site. Following the stimulation, the participants rated their pain intensity at the end of the stimulation using the VAS, with 0 points representing no pain and 100 points representing the worst pain. The researcher recorded the VAS scores for subjective pain intensity assessment.
Statistical Analysis
Statistical analysis was performed using SPSS 25 (IBM SPSS 25 for Windows, Armonk, NY, USA) and R version 4.5.0 (R Core Team, 2025) with code implemented in RStudio (Posit, 2025). Statistical significance was set at p < 0.05. Shapiro–Wilk’s test was used to test the normality of EDT, EPT, TSP and VAS. As several variable deviated from normality and given that pain threshold data are typically right-skewed and known to approximate normality after logarithmic transformation, all EDT and EPT values were log-transformed using the natural logarithm (ln) prior to reliability analysis.13 The test–retest reliability of ln-transformed EDT and EPT values between sessions was assessed using ICC, calculated based on a two-way mixed-effects model with absolute agreement. The magnitude of reliability was interpreted following standard thresholds: ICC > 0.90 indicated excellent reliability, 0.75 ≤ ICC < 0.90 indicated good reliability, 0.50 ≤ ICC < 0.75 indicated moderate reliability, and ICC < 0.50 indicated poor reliability.11 Absolute reliability was further quantified using the standard error of measurement (SEM) and the minimum detectable change (MDC), calculated on the log scale using the following formulas:  ;
;  . To improve clinical interpretability, MDC and 95% limit of agreement (LoA) values were subsequently back-transformed using the exponential function to reflect the minimum detectable ratio change on the original scale.14 Bland-Altman plots were used to represent the systematic error and consistency levels of reliability, with 95% confidence intervals as boundaries. To evaluate validity, the relationship between TSP and EPT was examined using Pearson or Spearman correlation coefficients, depending on the distribution of variables. Subsequently, a multiple linear regression analysis was performed to investigate whether EPT predicted TSP, adjusting for potential covariates including BMI and gender. Differences in EDT and EPT across anatomical regions and sessions were analyzed using linear mixed-effects models (LMM). Region and Session were entered as fixed effects, with Subject specified as a random intercept. Gender and BMI were included as covariates to control for potential confounding. Bonferroni adjustments were applied for post hoc comparisons when necessary.
Results
A total of forty-six healthy young adults (nineteen males and twenty-seven females) were recruited. Demographic data are presented in Table 1. Among all participants, the mean age was 21.57 ± 2.43 years, the mean BMI was 21.69 ± 2.38 kg/m2, and the proportion of females was 58.7%. Two participants, one male and one female, were left-handed. All participants had HADS scores below seven and completed all tests.
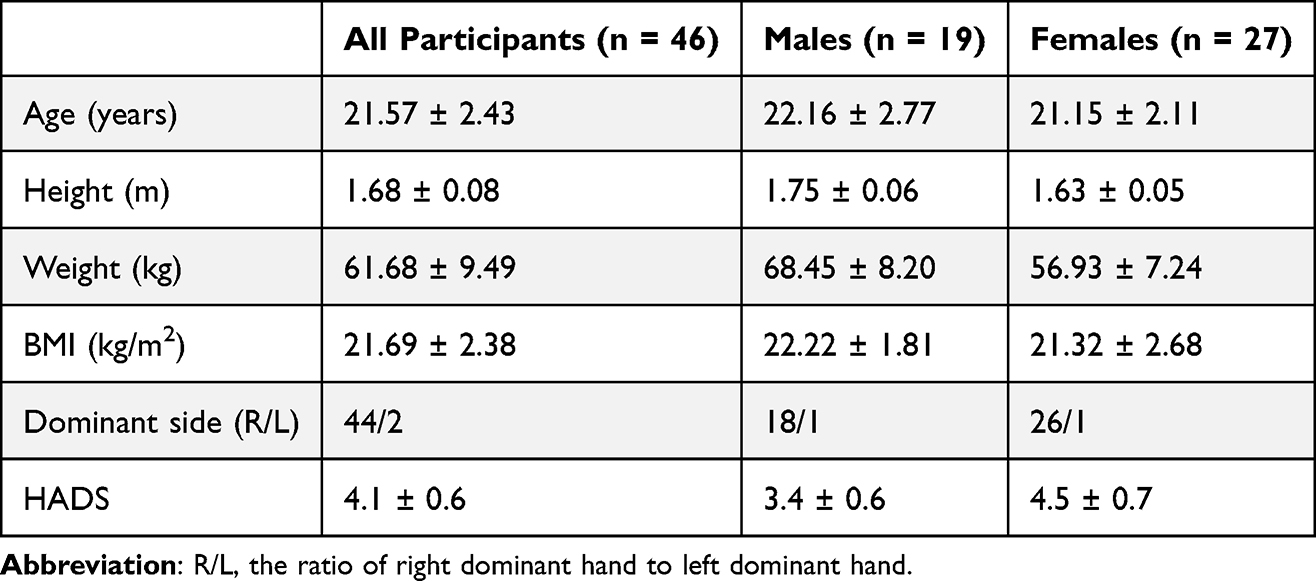 |
Table 1 Summary of Participant’s Characteristics (Mean ± SD) |
Distribution of EDT & EPT Measurements
To ensure consistency in statistical analysis, all EDT and EPT data were subjected to natural logarithmic transformation, regardless of whether the raw values followed a normal distribution, which was based on the fact that some metrics did not meet the assumption of normality, and applying a consistent transformation across all data ensured comparability.11 In addition, gender has been identified as a potential influencing factor in previous studies and was further supported by LMM results.10 Thus, the EDT and EPT measurements were presented separately for males and females in Tables 2 and 3, respectively. In EDT measurements, only the CS measurements showed a normal distribution across two sessions. The MF, LC and LS regions required ln-transformation. In the subgroup analysis, MF, LC, and CS exhibited normal distributions in males, whereas MF and LS exhibited such distributions in females. All other measurements were normalized after transformation. In EPT measurements, only MF, CS and LS showed normal distribution across both sessions in male subgroup. All other measurements followed normal distribution after ln-transformation.
 |
Table 2 Means and SDs of EDT Between Sessions for All Tested Sites |
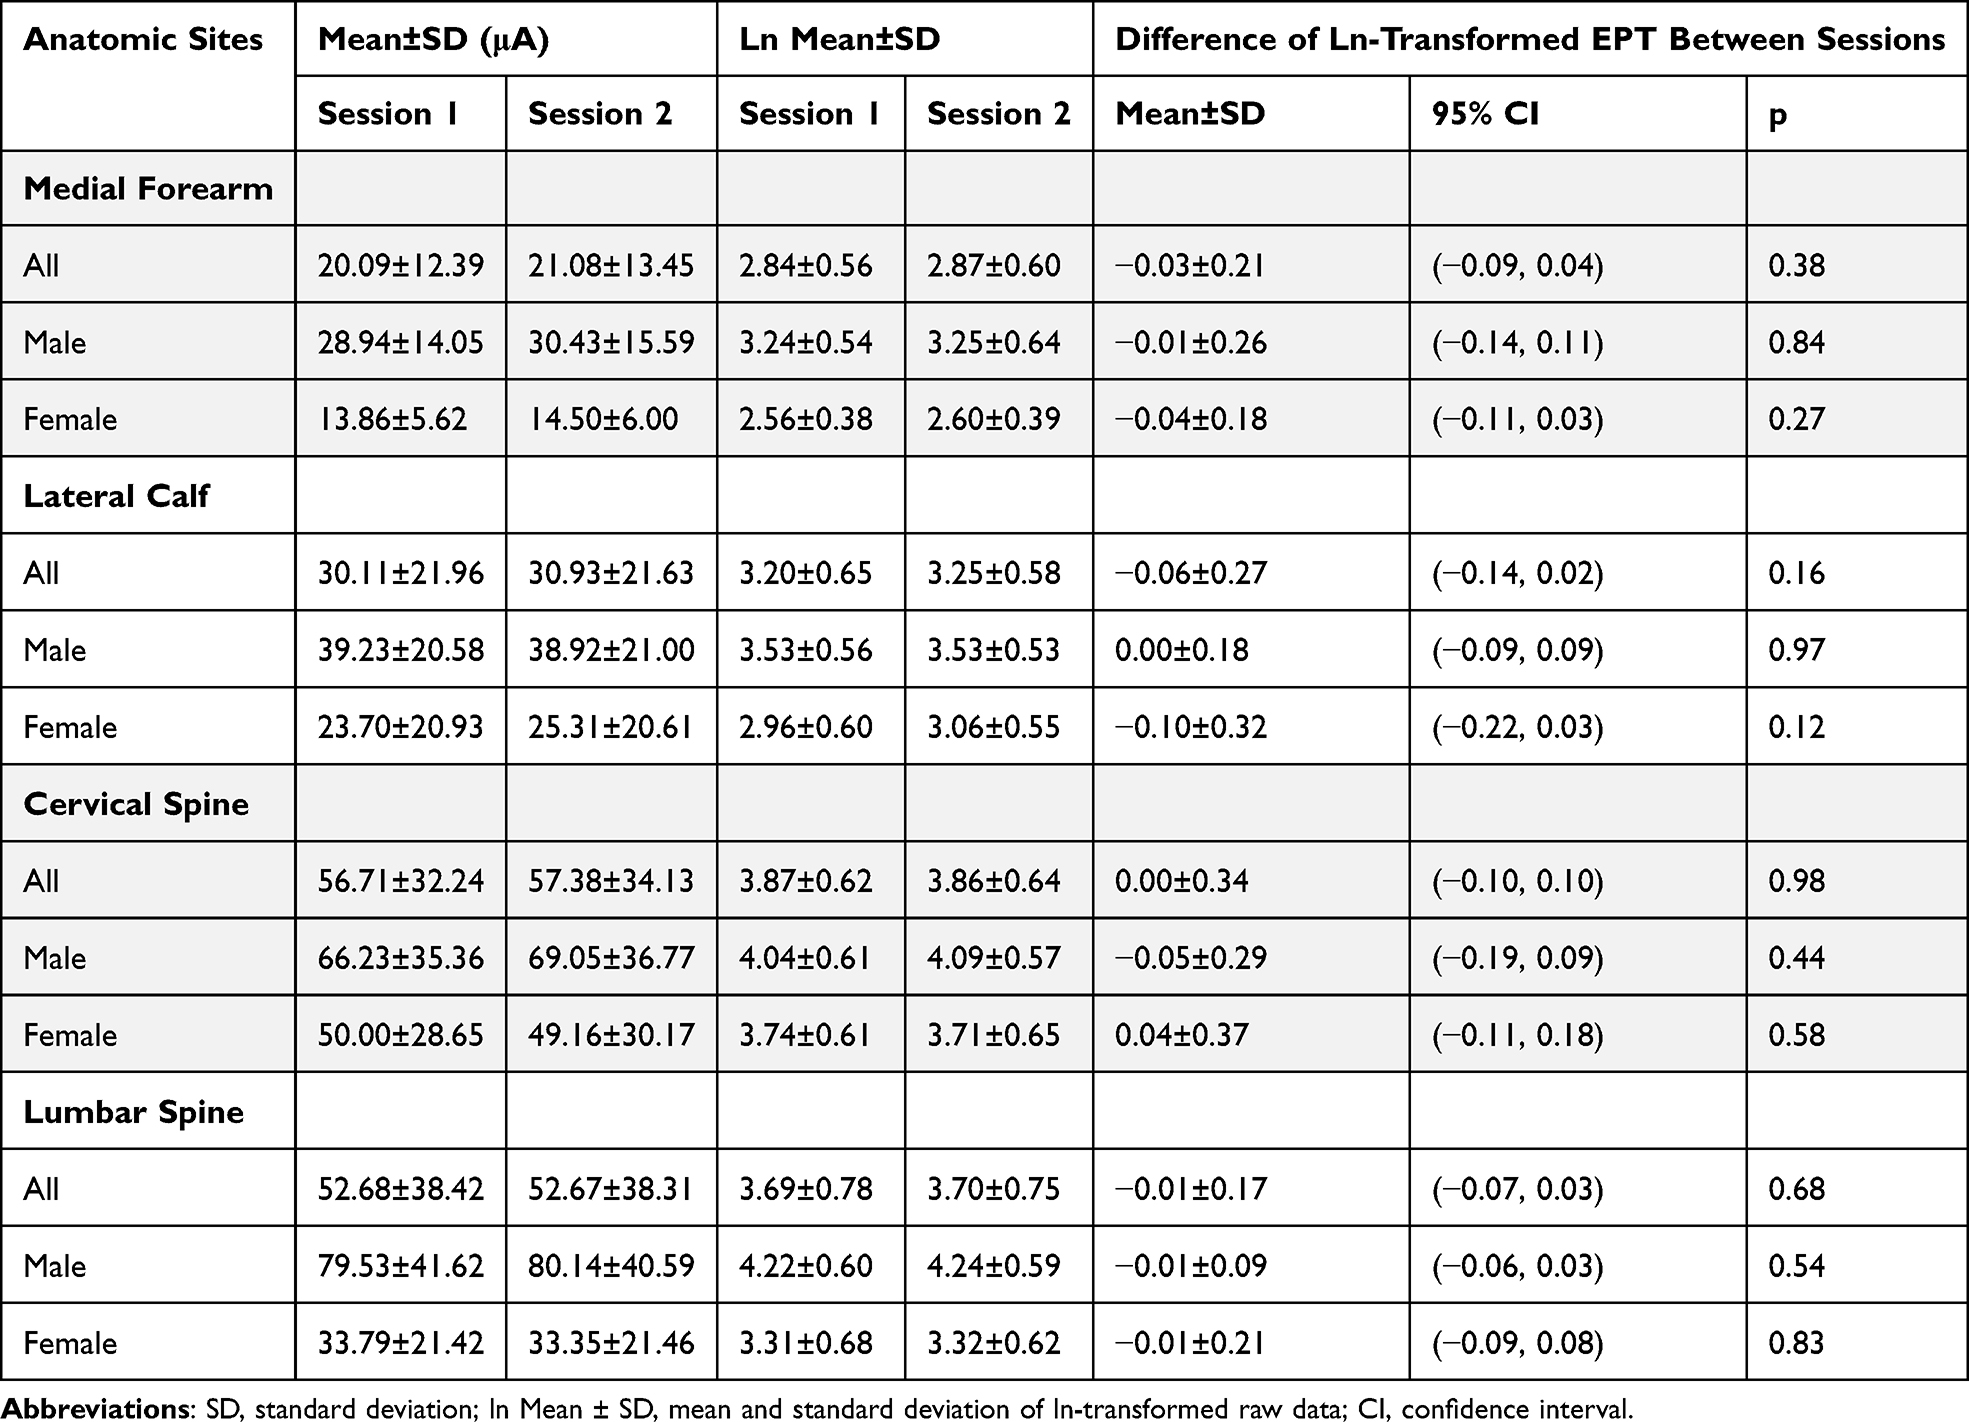 |
Table 3 Means and SDs of EPT Between Sessions for All Tested Sites |
Intraclass Correlation Coefficients
The test–retest ICC values of EDT were good to excellent for MF, LC, CS and LS among all participants (ranging 0.80 from 0.95), shown in Table 4. In male subgroup, the ICC values of all tested sites were excellent ranging from 0.82 to 0.92, whereas those in female subgroup were good to excellent ranging from 0.75 to 0.93. The highest ICC value of EDT was observed for LC in all participants and the lowest was observed for CS and LS in female subgroup.
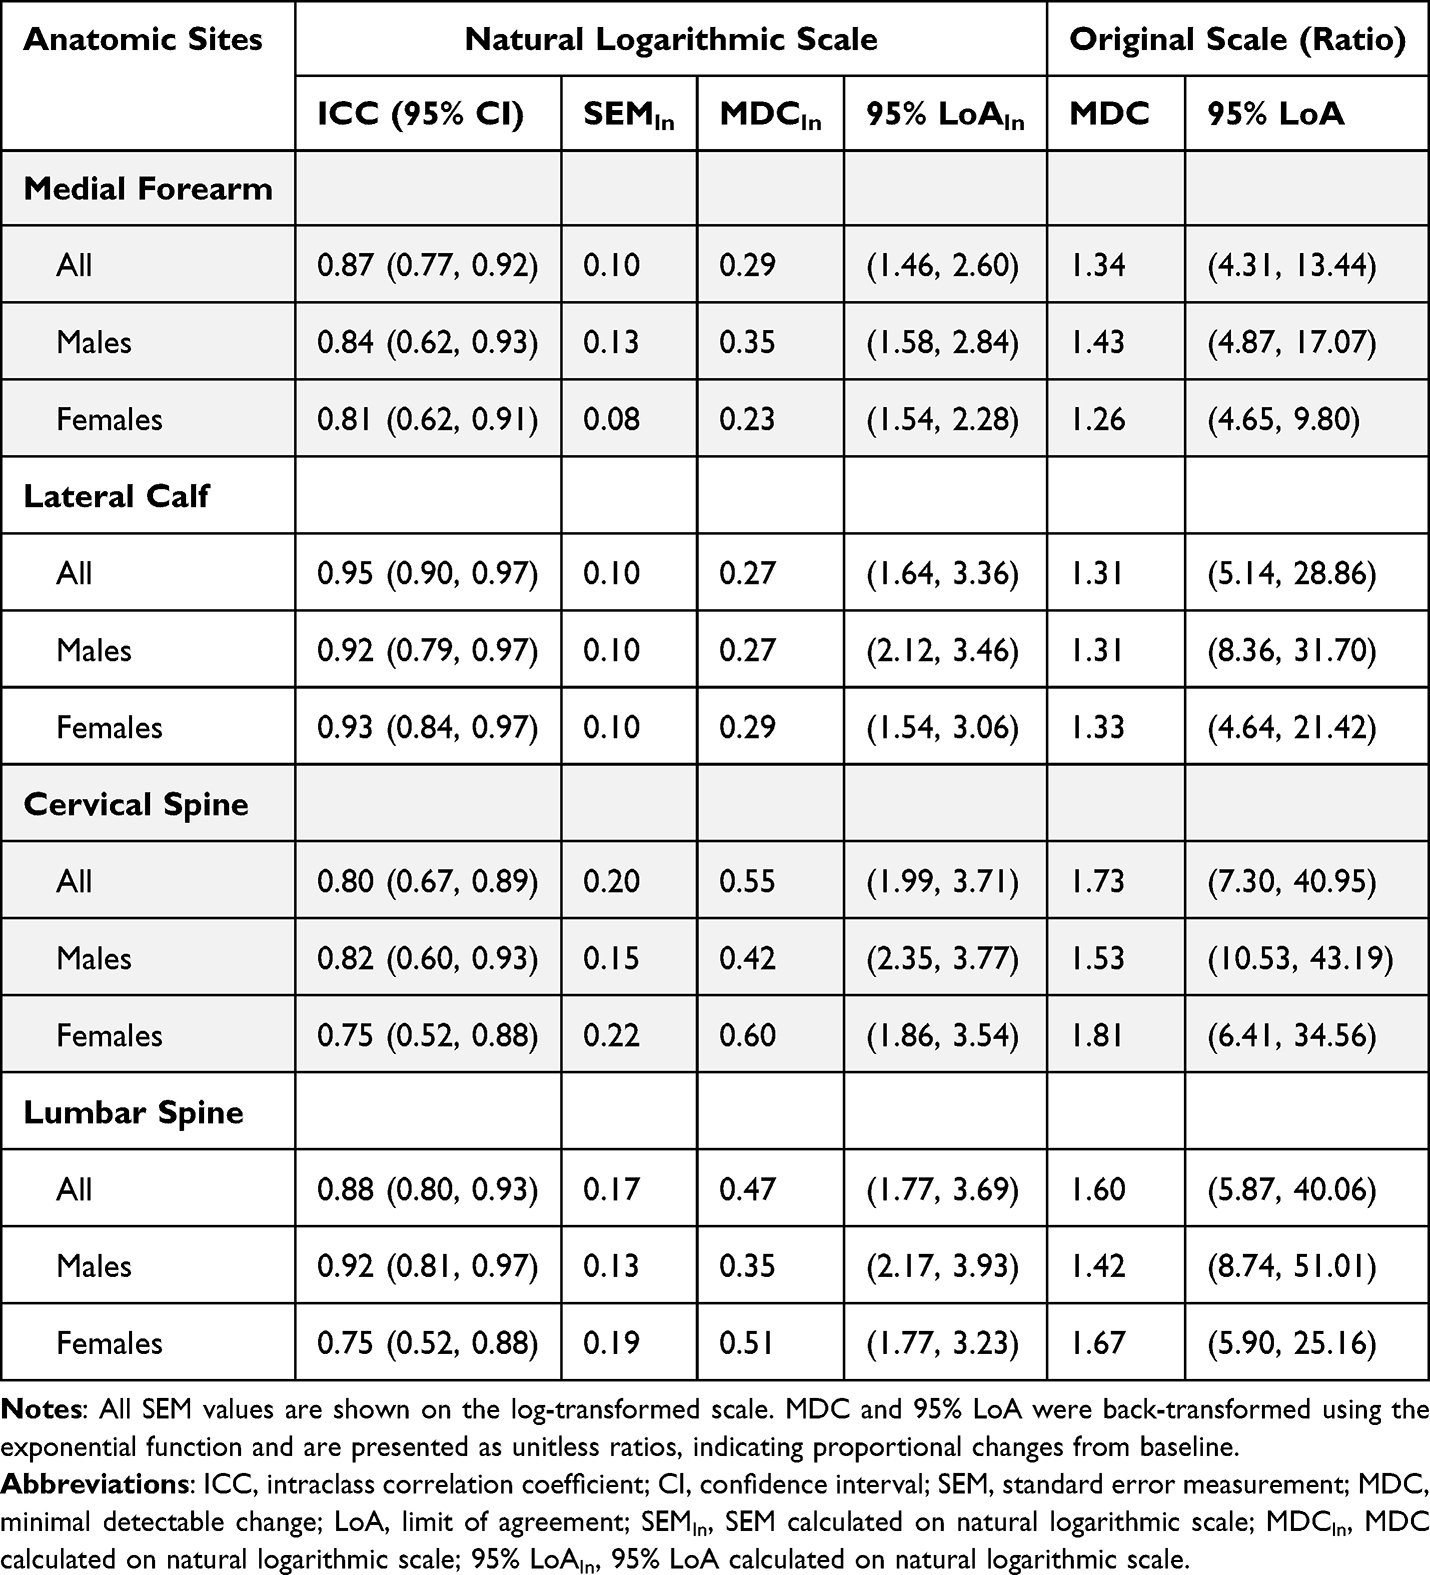 |
Table 4 Within-Session Reliability of EDT Among All Tested Sites |
As for EPT measurement, the test–retest ICC values were good to excellent for all tested sites among all participants (ranging 0.86 to 0.98), shown in Table 5. In male subgroup, the ICC values of all tested sites were excellent ranging from 0.88 to 0.99, whereas those in female subgroup were good to excellent, ranging from 0.83 to 0.95. The highest ICC value of EPT was observed for LS in male subgroup and the lowest was observed for CS in female subgroup.
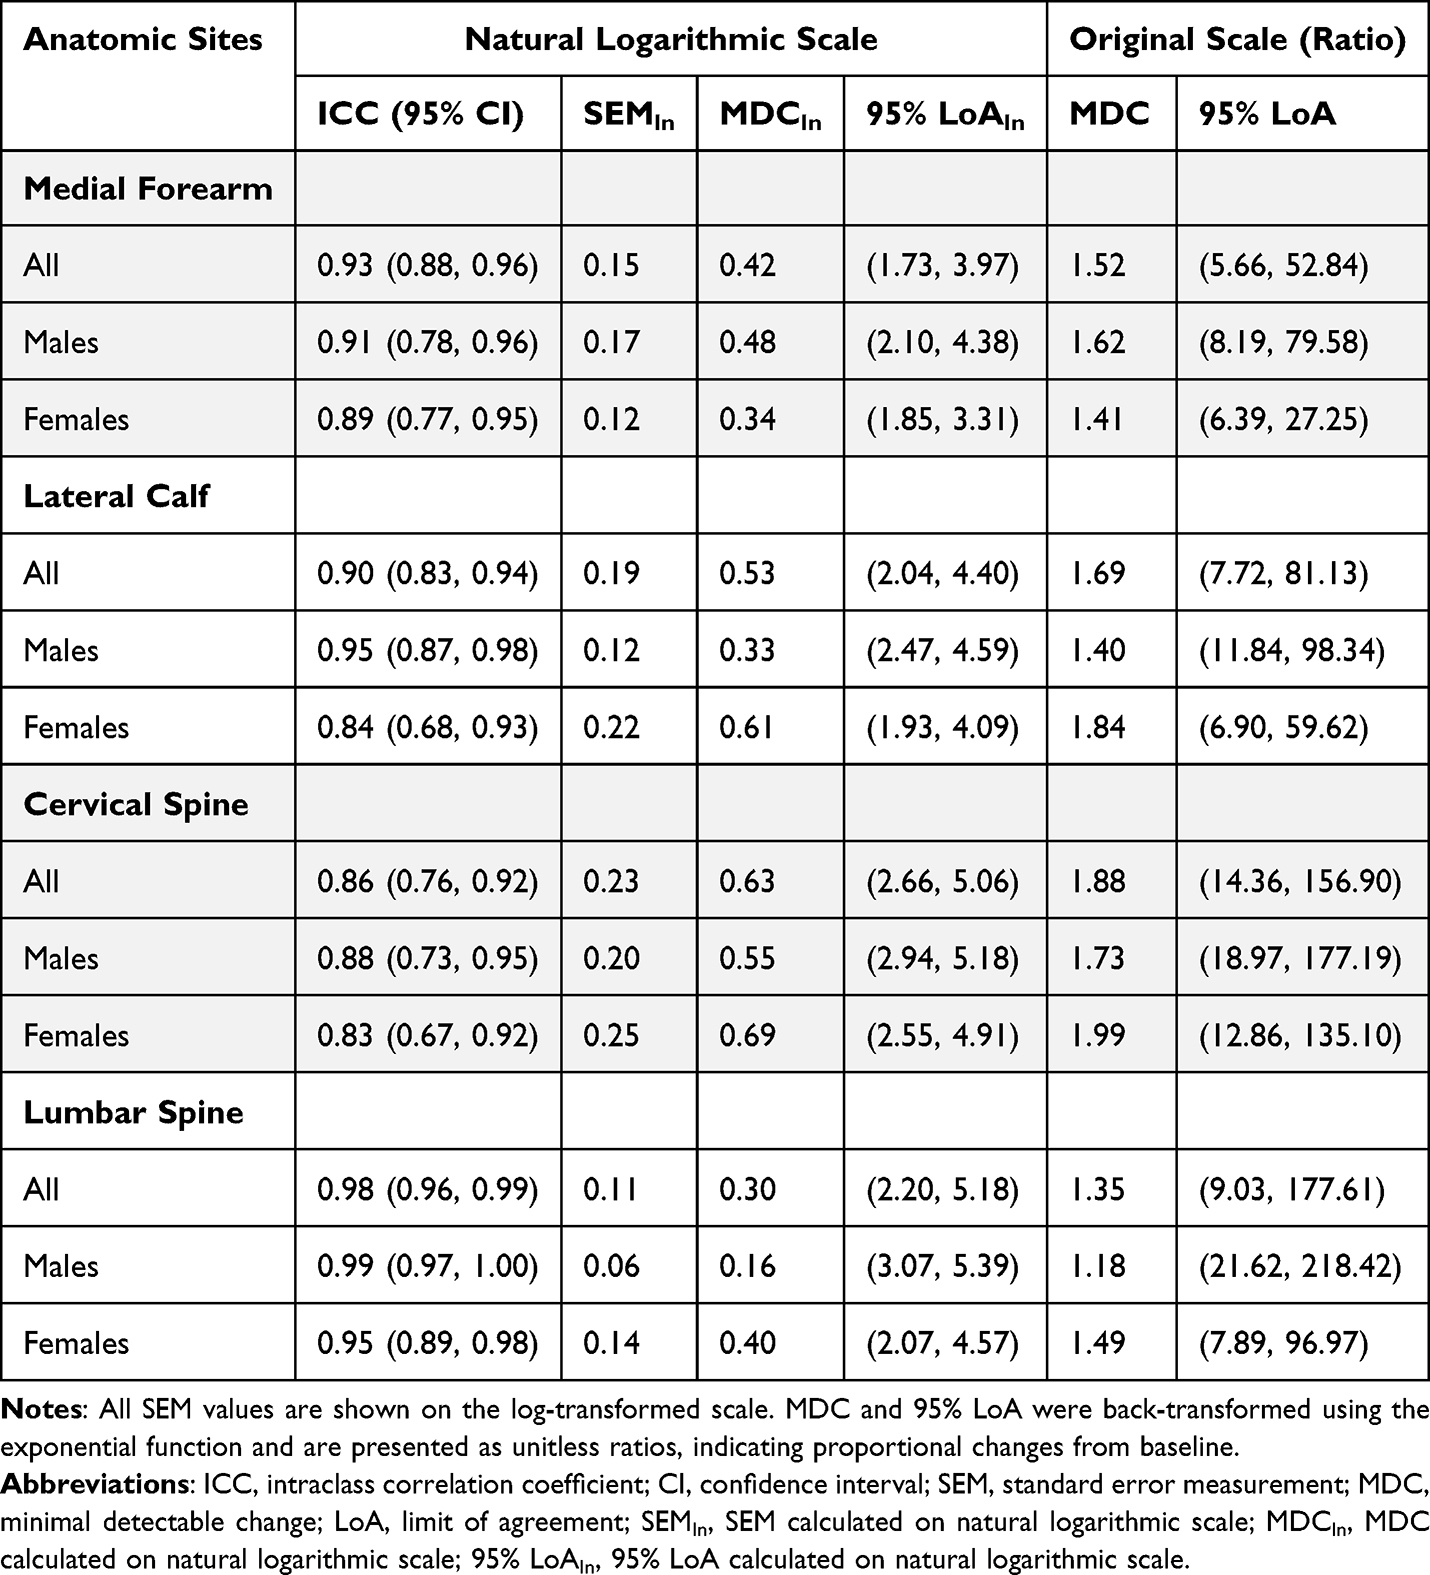 |
Table 5 Within-Session Reliability of EPT Among All Tested Sites |
Absolute Reliability for EDT & EPT
No significant difference between EDT and EPT measurements was observed between session 1 and session 2 for all tested sites (Table 2 and Table 3). Considering the characteristics of SEM, MDC, and 95% LoA, all calculations were performed on ln-transformed scale to ensure consistency, especially since some datasets did not conform to a normal distribution. While SEM, MDC, and 95% LoA are all reported in the tables for completeness, only MDC is discussed in the main text, as it incorporates SEM and is more directly interpretable for evaluating measurement error.14 To facilitate clinical interpretation, both MDC and 95% LoA were back-transformed using the exponential function and are presented as ratios, indicating the proportional change required to exceed measurement error or agreement bounds.
Overall, the MDC values for EDT were lower than those for EPT across most anatomical sites, with the exception of the LS region. Among all sites, the CS region consistently showed the highest MDC values, whereas the MF region tended to have the lowest. Specifically, for EDT, the highest MDC was observed at the CS site in the female subgroup, while the lowest was at the MF site in the same subgroup. In contrast, for EPT, the CS site in males showed the highest MDC, and the LS site in males showed the lowest.
From the perspective of consistency of agreement, the minimal mean difference was found almost zero in MF in EDT measurement (MD [95% CI], 0.00 μA [−2.59 μA, 2.58 μA]), shown in Figure 3a. Other mean differences of EDT measurement were found −0.10 μA [−3.51 μA, 3.31 μA], −0.19 μA [−9.14 μA, 8.76 μA], −0.10 μA [−9.14 μA, 7.80 μA] in LC, CS and LS respectively, shown in Figure 3b–3d. In EPT measurement, the maximal mean difference was observed in MF (MD [95% CI], −0.99 μA [−8.77 μA, 6.79 μA]), shown in Figure 4a. Other mean differences of EDT measurement were found −0.82 μA [−14.89 μA, 13.25μA], −0.67 μA [−28.81 μA, 27.47 μA], −0.67 μA [−14.91 μA, 14.84 μA] in LC, CS and LS respectively, shown in Figure 4b–4d.
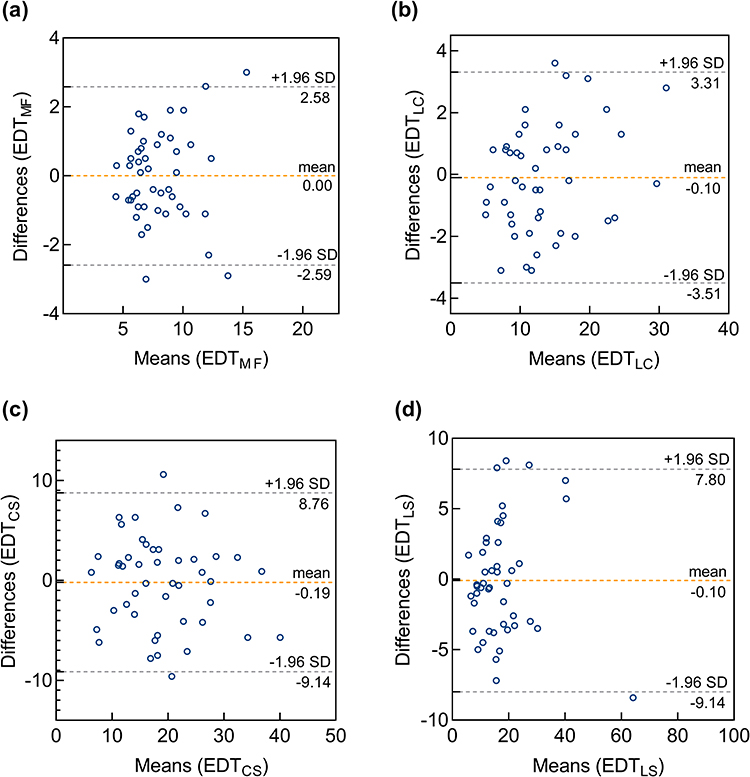 |
Figure 3 Bland-Altman plots for reliability of EDT in (a) MF, Medial Forearm; (b) LC, Lateral Calf; (c) CS, Cervical Spine; (d) LS, Lumbar Spine. The dashed line indicates the bias between sessions (the average of the differences), and the limits of agreement, calculated as 1.96 times the standard deviation (SD) of the differences in measurements. |
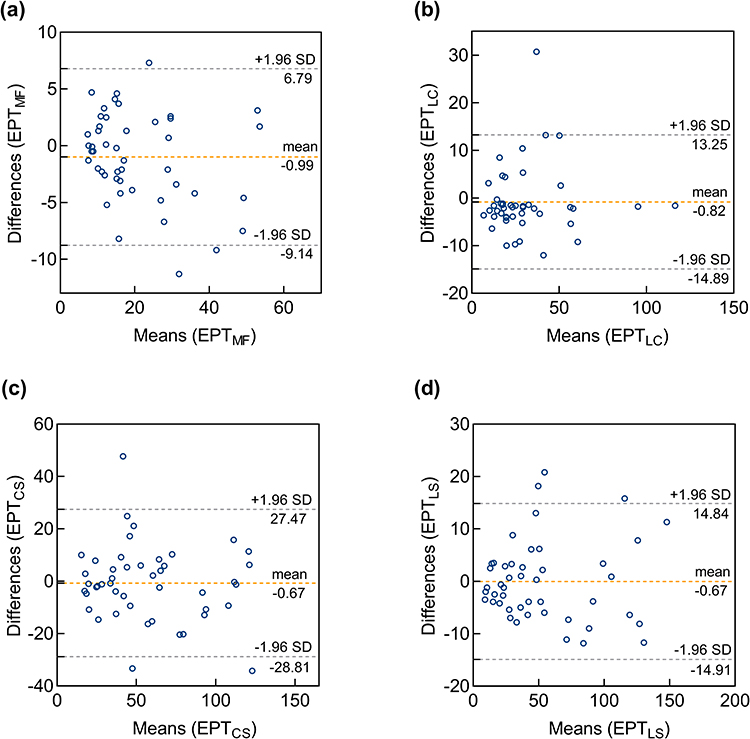 |
Figure 4 Bland-Altman plots for reliability of EPT in (a) MF, Medial Forearm; (b) LC, Lateral Calf; (c) CS, Cervical Spine; (d) LS, Lumbar Spine. The dashed line indicates the bias between sessions (the average of the differences), and the limits of agreement, calculated as 1.96 times the standard deviation (SD) of the differences in measurements. |
Correlation Between TSP and EPT
The natural logarithm of the mean value derived from the two MF sessions was employed as the outcome variable in the analysis of correlation. Temporal summation of pain intensity scale was associated with the ln-transformed EPT measurements of MF (r = −0.746, 95% CI [−0.852, −0.582], p < 0.001). A multiple linear regression analysis was conducted with TSP as the dependent variable and ln-transformed EPT, BMI and gender as independent variables. The overall model was significant (F (3, 42) = 18.48, p < 0.001), explaining approximately 53.8% of the variance in TSP (Adjusted R2 = 0.538). Among the predictors, ln-transformed EPT was a significant negative predictor of TSP (β = −16.33, 95% CI [−21.03, −11.63], p < 0.001), indicating that higher EPT was associated with lower self-reported pain. BMI and gender were not significantly associated with TSP. No multicollinearity was detected (all VIFs < 2).
Difference of EDT and EPT in Different Anatomical Regions
In EDT measurements, there was no significant interaction between Session and Region (p = 0.88). Significant main effects were found for Region (p < 0.001) and gender (p < 0.001), but not for Session and BMI. Post hoc comparisons showed that EDT measured at MF was significantly lower than at LC, CS and LS. LC also differed significantly from CS and LS, while no difference was found between CS and LS, shown in Figure 5a. Higher EDT was found in male subgroup than females.
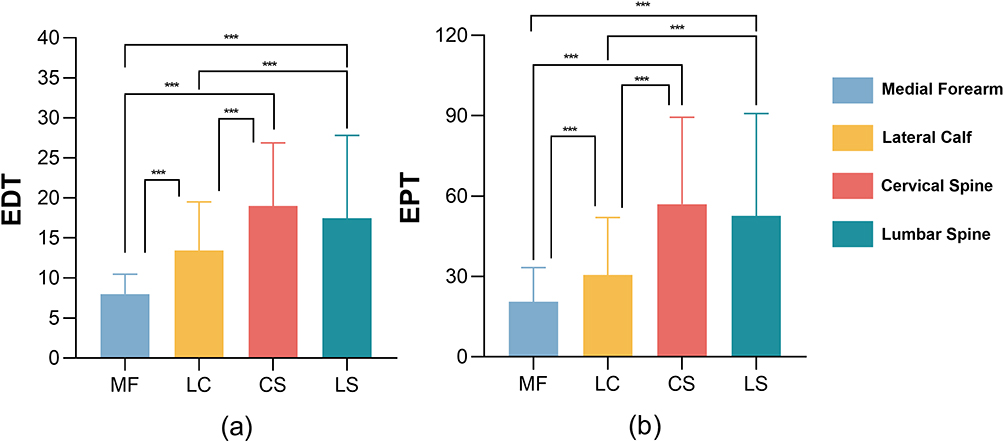 |
Figure 5 Different regions of ln-transformed measurements of (a) ln-transformed EDT and (b) EPT. *** p < 0.001. |
In EPT measurements, no significant Session × Region interaction was observed (p = 0.999). Significant main effects were found for Region (p < 0.001) and gender (p < 0.001), but not for Session. Post hoc tests indicated that EPT at MF was significantly lower than at LC, CS, and LS. LC also differed from CS and LS, while CS and LS showed no significant difference, shown in Figure 5b. Males had significantly higher EPT values than females. Detailed results of LMM are presented in Supplementary Tables S1 and S2.
Discussion
Measuring sensory threshold enables precise quantification of sensory function and nociceptive processing, facilitating objective assessment of neural integrity and feedback across sensory modalities. By identifying deviations in sensory thresholds, clinicians gain insights into the function of specific nerve fibers, informing diagnosis, monitoring, and treatment evaluation.15–17 Consequently, pain threshold emerges as a crucial metric for examining nociceptive processing and potential sensory dysfunctions, highlighting its importance in clinical diagnosis and therapeutic decision-making.13 Transcutaneous electrical stimulation represents a modality for evaluating sensory thresholds; however, its reliability and validity have not been fully established. This study examined the reliability and validity of EDT and EPT assessed using transcutaneous electrical stimulation in healthy young adults. Overall, our findings demonstrate that non-invasive transcutaneous EDT and EPT can reliably quantify sensory thresholds, providing objective metrics to inform diagnosis, monitor neural function, and guide therapeutic decisions. Establishing robust baseline data in healthy adults provides a foundation for future clinical applications in patients with pain or neurological disorders.
Specific neural circuits can be identified by isolating various modalities using controlled QST paradigms. Commonly used QST paradigms include PPT, WPT, and CPT. PPT activates large- and small-diameter fibers, WPT primarily activates C fibers, and CPT activates both Aδ and C fibers and is commonly used to assess neuropathic pain severity.18–20 Compared to those QST paradigms, EPT primarily activates Aδ fibers while minimally stimulating C fibers or other receptors,12,13 thereby representing a more stable method for assessing sensory function.
To our knowledge, this is the first study to determine the reliability and validity of EDT and EPT using a non-invasive patch electrode approach. The test–retest reliability of EDT and EPT measurements was good to excellent across all tested sites. In contrast, previous studies using needle electrodes reported different results for EDT and EPT of cutaneous primary afferents.7,8 The discrepancy may be attributed to potential tissue damage caused by needle electrodes to superficial skin layers during testing, leading to increased noxious signal input, as prior studies have found that receptors and afferent terminals were densely distributed in the superficial fascia to support sensory adaptability.21 Additionally, high procedural variability may have contributed to increased measurement variability. Moreover, factors such as the duration, frequency, and spatial summation of pain may further affect measurement reliability.22,23 However, transcutaneous electrical stimulation provided a more uniform stimulation effect at targeted sites, is better tolerated by participants, minimizes interference from noxious signals, and yielded more consistent inter-individual responses,24 resulting in more stable measurement values.
This study provides new evidence supporting sensory assessment and demonstrate that transcutaneous electrical stimulation can serve as a reliable method for the functional evaluation of afferent fibers. Previous studies have shown that pain-related evoked potentials elicited by conventional surface electrical stimulation have been used to explore selective activation of nociceptive Aδ fibers, suggesting involvement of the somatosensory pathway in pain processing.25 Katsarava et al found that the nerve conduction velocity associated with pain-related evoked potentials was 11.6±5.1m/s,26 consistent with the conduction velocity of myelinated Aδ fibers.27 Meanwhile, Siedler et al measured pain-related evoked potentials in patients with various types of nerve fiber damage and concluded that this method could effectively screen for Aδ fiber lesions.6 The pain elicited by EPT was characterized as a “pricking”, indicating Aδ fiber activation. Further, the strong correlation between the natural logarithm of EPT measurements and subjective pain ratings obtained during TSP suggested that Aδ fibers sensitivity can be assessed via transcutaneous electrical stimulation. However, C-fiber activation during this process remains unclear. Although unmyelinated fibers may show limited activation during low-intensity subthreshold stimulation,28 none of the participants reported sensations indicative of C-fiber involvement.
Bland-Altman analysis showed that mean differences between test and retest values were close to zero across all regions for both EDT and EPT measurements, indicating minimal systematic bias. The smallest mean difference was observed at the MF region for EDT, suggesting high measurement consistency at this location. However, relatively wide 95% confidence intervals and limits of agreement were observed in several regions, especially for EPT in the CS region. Previous studies indicate heightened pain sensitivity in the cervical region,29,30 which may lead to more pronounced inter-individual responses to nociceptive stimulation. This increased sensitivity likely contributes to substantial variability in observed, consistent with the wide LoA observed in Bland-Altman analysis. These findings indicate considerable variation in repeated EPT measurements at the CS site. Therefore, when applying these measurement tools in clinical or research settings, it may be advisable to integrate complementary objective indicators to enhance reliability and improve interpretability, particularly for assessments at the cervical region.
Different sensory perceptions elicited by transcutaneous electrical stimulation were observed across body regions. EDT and EPT values measured at MF were significantly lower than those on LC, CS, and LS, indicating greater sensory sensitivity at MF. Extremities typically exhibit denser nerve innervation and less subcutaneous fat than the trunk,31 which may enhance electrical conductivity and sensory responsiveness, consistent with the smallest MDC observed at MF in this study. In contrast, relatively thicker fascial tissue at CS and LS may contribute to higher EPT values compared with LC. Previous evidence suggested that pain threshold may also be influenced by the length and complexity of conduction pathways across body regions.32 No significant differences were found between EDT and EPT measurements at CS and LS consistent with prior findings showing similar sensory thresholds across thoracic dermatomes,33 potentially due to shorter peripheral innervation pathways. Additionally, both EDT and EPT were significantly lower in female than in male, suggesting greater sensitivity to transcutaneous electrical stimulation in females. This sex-related difference may be partly attributed to hormonal influences, as estrogen has been shown to modulate nociceptive processing and enhance peripheral nerve sensitivity,34,35 potentially contributing to lower pain thresholds in females.
Limitations
The participants in this study were healthy young adults, which may limit the generalizability of the findings to older or clinical populations. However, this design enhanced methodological rigor by minimizing variability related to neurophysiological status, lifestyle factors, and medication use, thereby allowing a clearer evaluation of the reliability and validity of EDT and EPT measurements. Importantly, establishing robust measurement properties in a healthy population provides a necessary foundation for future studies in patient cohorts. However, a potential limitation is the relatively short 1-minute interval between repeated EDT and EPT measurements. Although this interval was selected to optimize efficiency and participant comfort, prior studies often average multiple trials without clearly reporting inter-trial intervals. Evidence from a recent pilot study suggests that EDT appear to recover rapidly, whereas EPT may show greater variability and could be influenced by temporal summation or carry-over effects,36 potentially affecting test–retest reliability. Additionally, factors such as race, gender, and body fat percentage may influence current sensitivity; however, given the relatively homogeneous sample and the primary focus on measurement reliability rather than absolute sensitivity, these factors were unlikely to have substantially influenced the results.
Conclusion
Transcutaneous electrical stimulation induced by PainVision® PS-2100 apparatus serves a reliable and valid method for practitioners to assess EDT and EPT across anatomical sites. The negative correlation indicates the construct validity of EPT as a metric for nociceptive processing, indicating that individuals with higher electrical pain tolerance tend to lower pain response to sustained stimulation. These findings support the potential utility of this non-invasive approach for quantifying sensory thresholds, providing baseline data for future studies in clinical populations, and potentially aiding in evaluating pain perception, monitoring neural function, and guiding individualized interventions. However, the modest sample size and cross-sectional design limit the generalizability to broader or patient populations. Future studies involving larger and more diverse cohorts, including individuals with pain or neurological disorders, are warranted to validate the clinical applicability and refine practical guidelines for transcutaneous sensory assessment.
Registration Number
ChiCTR2400084361
Abbreviations
CPT, cold pain threshold; CS, cervical spine; EDT, electrical detection threshold; EPT, electrical pain threshold; HADS, hospital anxiety and depression scale; ICC, intraclass correlation coefficient; LC, lateral calf; LMM, linear mixed-effects mo LoA, limit of agreement; LS, lumbar spine; MDC, minimal detectable change; MF, medial forearm; NPRS, numerical pain rating scale; PPT, pressure pain threshold; QST, quantitative sensory test; SEM, standard error of measurement; TSP, temporal summation of pain; WPT, warm pain threshold; VAS, visual analog scale.
Data Sharing Statement
Data cannot be shared publicly because the data also forms part of an ongoing study. The data that support the findings of this study are available on request from the corresponding author.
Ethics Approval and Informed Consent
This study was approved by Human Ethics Committee of West China Hospital of Sichuan University (No. 2024-418). Written informed consents were obtained from individuals participated in this study.
Acknowledgments
We would like to thank our colleagues Chen Ganglin, Li Shixin, Song Xinyue, Wei Yixin, Zhao Yuxuan for their collaboration and assistance throughout this project. Their contributions in data collection, and experimental procedures were invaluable.
Author Contributions
All authors made a significant contribution to the work reported, whether in the conception, study design, execution, acquisition of data, analysis and interpretation, or in all these areas; took part in drafting, revising or critically reviewing the article; gave final approval of the version to be published; have agreed on the journal to which the article has been submitted; and agree to be accountable for all aspects of the work.
Funding
This work was supported by the Sichuan Science and Technology Program (grant number 2019YJ0130). The funders had no role in study design, data collection and analysis, decision to publish, or preparation of the manuscript.
Disclosure
The authors report no conflicts of interest in this work.
References
1. Arant KR, Katz JN, Neogi T. Quantitative sensory testing: identifying pain characteristics in patients with osteoarthritis. Osteoarthritis Cartilage. 2022;30(1):17–15. doi:10.1016/j.joca.2021.09.011
2. Gwathmey KG, Pearson KT. Diagnosis and management of sensory polyneuropathy. BMJ. 2019;365:l1108. doi:10.1136/bmj.l1108
3. Gierthmühlen J, Enax-Krumova EK, Attal N, et al. Who is healthy? Aspects to consider when including healthy volunteers in QST--based studies-a consensus statement by the EUROPAIN and NEUROPAIN consortia. Pain. 2015;156(11):2203–2211. doi:10.1097/j.pain.0000000000000227
4. Taneja P, Krause-Hirsch C, Laursen S, et al. Reliability of orofacial quantitative sensory testing for pleasantness and unpleasantness. Cephalalgia. 2020;40(11):1191–1201. doi:10.1177/0333102420929700
5. Røikjer J, Croosu SS, Frøkjær JB, et al. Perception threshold tracking: validating a novel method for assessing function of large and small sensory nerve fibers in diabetic peripheral neuropathy with and without pain. Pain. 2023;164(4):886–894. doi:10.1097/j.pain.0000000000002780
6. Siedler G, Sommer C, Üçeyler N. Pain-related evoked potentials in patients with large, mixed, and small fiber neuropathy. Clin Neurophysiol. 2020;131(3):635–641. doi:10.1016/j.clinph.2019.12.006
7. Goudman L, Huysmans E, Coppieters I, et al. Electrical (pain) thresholds and conditioned pain modulation in patients with low back-related leg pain and patients with failed back surgery syndrome: a cross-sectional pilot study. Pain Med. 2020;21(3):538–547. doi:10.1093/pm/pnz118
8. Streuli D, Nyirö L, Rosner J, Schilder A, Csato M, Schweinhardt P. Intra- and inter-session reliability of electrical detection and pain thresholds of cutaneous and muscle primary afferents in the lower back of healthy individuals. Pflugers Arch. 2023;475(10):1211–1223. doi:10.1007/s00424-023-02851-7
9. Stucky CL, Mikesell AR. Cutaneous pain in disorders affecting peripheral nerves. Neurosci Lett. 2021;765:136233. doi:10.1016/j.neulet.2021.136233
10. Seno SI, Shimazu H, Kogure E, Watanabe A, Kobayashi H. Factors affecting and adjustments for sex differences in current perception threshold with transcutaneous electrical stimulation in healthy subjects. Neuromodulation. 2019;22(5):573–579. doi:10.1111/ner.12889
11. Koo TK, Li MY. A guideline of selecting and reporting intraclass correlation coefficients for reliability research. J Chiropr Med. 2016;15(2):155–163. doi:10.1016/j.jcm.2016.02.012
12. Wang BK, Liu TH, Xie F, Liu YQ. Pain vision system for evaluating chronic pain: a comparison with VAS scoring. Pain Res Manag. 2020;2020:1–4. doi:10.1155/2020/6312581
13. Rolke R, Magerl W, Campbell KA, et al. Quantitative sensory testing: a comprehensive protocol for clinical trials. Eur J Pain. 2006;10(1):77. doi:10.1016/j.ejpain.2005.02.003
14. Weir JP. Quantifying test-retest reliability using the intraclass correlation coefficient and the SEM. J Strength Cond Res. 2005;19(1):231–240. doi:10.1519/15184.1
15. Bellosta-López P, Doménech-García V, Ortiz-Lucas M, et al. Longitudinal changes and associations between quantitative sensory testing and psychological factors in whiplash-associated disorders: a systematic review and meta-analyses-based data synthesis. J Pain. 2024;25(1):12–30. doi:10.1016/j.jpain.2023.07.021
16. Lee GI, Neumeister MW. Pain: pathways and Physiology. Clin Plast Surg. 2020;47(2):173–180. doi:10.1016/j.cps.2019.11.001
17. Listik C, Cury RG, da Silva VA, et al. Abnormal sensory thresholds of dystonic patients are not affected by deep brain stimulation. Eur J Pain. 2021;25(6):1355–1366. doi:10.1002/ejp.1757
18. Mailloux C, Beaulieu LD, Wideman TH, Massé-Alarie H. Within-session test-retest reliability of pressure pain threshold and mechanical temporal summation in healthy subjects. PLoS One. 2021;16(1):e0245278. doi:10.1371/journal.pone.0245278
19. Trouvin AP, Simunek A, Coste J, et al. Mechanisms of chronic pain in inflammatory rheumatism: the role of descending modulation. Pain. 2023;164(3):605–612. doi:10.1097/j.pain.0000000000002745
20. Vale TA, Symmonds M, Polydefkis M, et al. Chronic non-freezing cold injury results in neuropathic pain due to a sensory neuropathy. Brain. 2017;140(10):2557–2569. doi:10.1093/brain/awx215
21. Barry CM, Kestell G, Gillan M, Haberberger RV, Gibbins IL. Sensory nerve fibers containing calcitonin gene-related peptide in gastrocnemius, latissimus dorsi and erector spinae muscles and thoracolumbar fascia in mice. Neuroscience. 2015;291:106–117. doi:10.1016/j.neuroscience.2015.01.062
22. Lozano R, Gilmore KJ, Thompson BC, et al. Electrical stimulation enhances the acetylcholine receptors available for neuromuscular junction formation. Acta Biomater. 2016;45:328–339. doi:10.1016/j.actbio.2016.08.006
23. Quevedo AS, Coghill RC. Attentional modulation of spatial integration of pain: evidence for dynamic spatial tuning. J Neurosci. 2007;27(43):11635–11640. doi:10.1523/JNEUROSCI.3356-07.2007
24. Legrain V, Mouraux A. Activating selectively and reliably nociceptive afferents with concentric electrode stimulation: yes we can! Provided that low stimulus intensities are used! Clin Neurophysiol. 2013;124(2):424. doi:10.1016/j.clinph.2012.05.026
25. Mouraux A, Iannetti GD, Plaghki L. Low intensity intra-epidermal electrical stimulation can activate Aδ-nociceptors selectively. Pain. 2010;150(1):199–207. doi:10.1016/j.pain.2010.04.026
26. Katsarava Z, Ayzenberg I, Sack F, Limmroth V, Diener HC, Kaube H. A novel method of eliciting pain-related potentials by transcutaneous electrical stimulation. Headache. 2006;46(10):1511–1517. doi:10.1111/j.1526-4610.2006.00446.x
27. Inui K, Tran TD, Hoshiyama M, Kakigi R. Preferential stimulation of Adelta fibers by intra-epidermal needle electrode in humans. Pain. 2002;96(3):247–252. doi:10.1016/S0304-3959(01)00453-5
28. Schnakenberg M, Thomas C, Schmelz M, Rukwied R. Nerve growth factor sensitizes nociceptors to C-fibre selective supra-threshold electrical stimuli in human skin. Eur J Pain. 2021;25(2):385–397. doi:10.1002/ejp.1678
29. Nogueira N, Oliveira-Campelo N, Lopes Â, Torres R, Sousa ASP, Ribeiro F. The acute effects of manual and instrument-assisted cervical spine manipulation on pressure pain threshold, pressure pain perception, and muscle-related variables in asymptomatic subjects: a randomized controlled trial. J Manipulative Physiol Ther. 2020;43(3):179–188. doi:10.1016/j.jmpt.2019.05.007
30. Keating L, Lubke C, Powell V, Young T, Souvlis T, Jull G. Mid-thoracic tenderness: a comparison of pressure pain threshold between spinal regions, in asymptomatic subjects. Man Ther. 2001;6(1):34–39. doi:10.1054/math.2000.0377
31. Sulaiman S, Soames R, Lamb C. The sensory distribution in the dorsum of the hand: anatomical study with clinical implications. Surg Radiol Anat. 2015;37(7):779–785. doi:10.1007/s00276-014-1416-1
32. Plaghki L, Decruynaere C, Van Dooren P, Le Bars D. The fine tuning of pain thresholds: a sophisticated double alarm system. PLoS One. 2010;5(4):e10269. doi:10.1371/journal.pone.0010269
33. Savic G, Bergström EMK, Frankel HL, Jamous MA, Ellaway PH, Davey NJ. Perceptual threshold to cutaneous electrical stimulation in patients with spinal cord injury. Spinal Cord. 2006;44(9):560–566. doi:10.1038/sj.sc.3101921
34. Failla MD, Beach PA, Atalla S, et al. Gender differences in pain threshold, unpleasantness, and descending pain modulatory activation across the adult life span: a cross sectional study. J Pain. 2024;25(4):1059–1069. doi:10.1016/j.jpain.2023.10.027
35. Kowalczyk WJ, Sullivan MA, Evans SM, Bisaga AM, Vosburg SK, Comer SD. Sex differences and hormonal influences on response to mechanical pressure pain in humans. J Pain. 2010;11(4):330–342. doi:10.1016/j.jpain.2009.08.004
36. Ríos-Asín I, Malo-Urriés M, Pérez-Rey J, García-Díez M, Burgos-Garlito L, Bueno-Gracia E. Recovery time of electrical sensory, motor, and pain thresholds: a pilot study towards standardization of quantitative sensory testing in healthy population. Healthcare. 2025;13(19):2492. doi:10.3390/healthcare13192492
 © 2026 The Author(s). This work is published and licensed by Dove Medical Press Limited. The
full terms of this license are available at https://www.dovepress.com/terms
and incorporate the Creative Commons Attribution
- Non Commercial (unported, 4.0) License.
By accessing the work you hereby accept the Terms. Non-commercial uses of the work are permitted
without any further permission from Dove Medical Press Limited, provided the work is properly
attributed. For permission for commercial use of this work, please see paragraphs 4.2 and 5 of our Terms.
© 2026 The Author(s). This work is published and licensed by Dove Medical Press Limited. The
full terms of this license are available at https://www.dovepress.com/terms
and incorporate the Creative Commons Attribution
- Non Commercial (unported, 4.0) License.
By accessing the work you hereby accept the Terms. Non-commercial uses of the work are permitted
without any further permission from Dove Medical Press Limited, provided the work is properly
attributed. For permission for commercial use of this work, please see paragraphs 4.2 and 5 of our Terms.