Back to Journals » International Journal of General Medicine » Volume 17
Relevance Analysis of TPM2 and Clinicopathological Characteristics in Breast Cancer
Authors Zhou X, Li Z, Chen H, Jiao M, Zhou C, Li H
Received 7 October 2023
Accepted for publication 28 December 2023
Published 10 January 2024 Volume 2024:17 Pages 59—74
DOI https://doi.org/10.2147/IJGM.S442004
Checked for plagiarism Yes
Review by Single anonymous peer review
Peer reviewer comments 2
Editor who approved publication: Dr Scott Fraser
Xingchen Zhou, Zhishuang Li, Huan Chen, Meng Jiao, Chengjun Zhou, Hui Li
Department of Pathology, The Second Hospital, Cheeloo College of Medicine, Shandong University, Jinan, Shandong, 250012, People’s Republic of China
Correspondence: Hui Li, Department of Pathology, The Second Hospital, Cheeloo College of Medicine, Shandong University, No. 247, Beiyuan Street, Jinan City, Shandong Province, 250012, People’s Republic of China, Email [email protected]
Background: The function of tropomyosin 2 (TPM2) in breast cancer is still far understudied. In this study, we aim to explore the roles of TPM2 in breast cancer progression.
Methods: This research included 155 breast cancer tissues. The expression of TPM2 was analyzed by immunohistochemical staining and grading. The mRNA expression of TPM2 in pan-cancer was analyzed with The Cancer Genome Atlas (TCGA) data plate form. The differential expression of TPM2 protein and the differential promoter methylation level of TPM2 between breast cancer tissues and normal breast tissues were analyzed by the UALCAN online database. The relationship between TPM2 and signaling pathways was interpreted by Gene Ontology (GO), Kyoto Encyclopedia of Genes and Genomes (KEGG), and Gene Set Enrichment Analysis (GSEA) pathway enrichment analyses. The survival curve of TPM2 was analyzed across the Kaplan–Meier plotter online database. Furthermore, the relationship between TPM2 expression and infiltrating macrophages was validated through in vitro co-culture experiments.
Results: TPM2 expression was significantly down-regulated in breast cancer samples. In addition, TPM2 expression was correlated with lymph node metastasis and high-grade histopathological morphology. The receiver operating characteristic (ROC) curve indicated that TPM2 expression could well distinguish between normal breast tissue and breast cancer tissue. TPM2 may have potential value in breast cancer diagnosis. Bioinformatics analysis illustrated that TPM2 was mainly involved in extracellular matrix organization, collagen fibril organization, cell junction assembly, focal adhesion, cAMP signaling pathway, estrogen signaling pathway, Wnt signaling pathway, and adaptive immune system. TPM2 expression was correlated with immune infiltrating cells and immune checkpoint molecules. Our in vitro co-culture experiments showed that the M2 macrophages could upregulate the expression of TPM2.
Conclusion: TPM2 may play key roles in breast cancer occurrence and development, especially in cancer metastasis. TPM2 may be a potential biomarker for breast cancer diagnosis.
Keywords: breast cancer, TPM2, bioinformatics, cytoskeleton
Introduction
Breast cancer is a heterogeneous disease and is the most common cancer among females worldwide.1 Metastasis is the main cause of cancer-associated death, which involves multiple processes such as cell migration and cell aggregation. Metastasis is a slowly developing process due to genetic and epigenetic modifications that enable tumor cells to acquire the ability to survive, migrate, and adapt to new microenvironments, and eventually form macroscopic lesions.2,3 Previous researches indicated that tropomyosins (TPMs) inhibit tumor metastasis in several types of tumors, such as prostate cancer, breast cancer, and brain tumor.4–6 Tropomyosins (TPMs) are a family of actin-binding proteins, which have obvious tissue specificity. The main functions of TPMs were integrating and stabilizing actin microfilaments.7,8 The human TPMs family has four members, including TPM1, TPM2, TPM3, and TPM4. Previous research has reported that TPMs play vital roles in regulating cell proliferation, migration, apoptosis, vesicle transport, and cytokinesis.9,10 The abnormal expression of TPMs may result in tumorigenesis and tumor development.11 As a tumor suppressor gene, TPM1 was down-regulated in several different types of cancers and suppressed cancer progression, including bladder carcinoma,12 lung cancer,13 gastric cancer,14 and intrahepatic cholangiocarcinoma.15 Inversely, TPM3 has been reported as an oncogene. Abnormally high expression of TPM3 could facilitate hepatocellular carcinoma progression.16,17 TPM3 promotes cell proliferation and invasion through epithelial–mesenchymal transition in hepatocellular carcinoma.18 It was reported that the high expression of TPM4 was associated with tumorigenesis and tumor development in several malignant tumors, such as ovarian cancer,19 hepatic carcinogenesis,20 and colon cancer.21
TPM2 (also known as beta-tropomyosin) is mainly expressed in skeletal muscle cells, fibroblasts, and smooth muscles. In the normal physiological processes, TPM2 participates in cell movement and muscle regulation.22 Although former researches reported that abnormal TPM2 expression was mostly related to rare myopathies, recent studies also proved that TPM2 was involved in tumor development.23 The function and the underlying molecular mechanism of TPM2 in breast cancer are still unclear. In the present study, we explore the role of TPM2 in breast cancer by clinicopathological analysis and bioinformatics analysis. We analyzed the correlation between TPM2 expression level and clinicopathological parameters. Furthermore, we excavated the value of TPM2 expression in breast cancer diagnosis by ROC curve analysis. We also preliminarily explored the potential molecular mechanisms by GO/KEGG analysis and GSEA analysis. This study provides a theoretical foundation for exploring the mechanisms of breast cancer occurrence and development.
Materials and Methods
Case Collection
We collected 155 breast cancer patients who underwent radical surgery and did not receive any chemotherapy from the Second Hospital of Shandong University during 2018. We gathered 155 breast cancer tissues and 51 normal adjacent breast tissues from these patients. The clinicopathological parameters of these patients included age, gender, tumor size, molecular subtypes, histological grade, lymph node metastasis, status of estrogen receptor (ER), progesterone receptor (PR), HER2, and Ki-67. In the patient cohort, there were 107 patients (69.0%) younger than 60 years old, and 48 patients (31.0%) elder than 60 years old. Breast cancer tissues in histological grades I and II accounted for 60.0%; and breast cancer tissues in histological grade III accounted for 40.0%. Histological grades I and II were considered to have low-grade histologic morphology. Histological grade III was considered to have a high-grade histologic morphology. Breast cancer tumors with size less than 2.0 cm, more than 2 cm but less than 5.0 cm, more than 5 cm, accounted for 42.6%, 55.4%, and 2.0% separately. Patients with lymph node metastasis occupied 42.6%, and patients without lymph node metastasis occupied 57.4%. Furthermore, the expression level of HER2 was as follows: 0: 17.4%; 1+: 25.8%; 2+: 37.4%, and 3+: 19.4%. In the 155 patients, 23 patients (14.8%) belonged to Luminal A subtype, 108 patients (69.7%) belonged to Luminal B subtype, 11 patients (7.1%) belonged to the HER2-enriched subtype, and 13 patients (8.4%) belonged to the triple negative subtype.
Immunohistochemistry
Breast cancer tissue blocks were fixed in phosphate-buffered formalin and then embedded in paraffin. The paraffin slides were at a thickness of 4 μm. The TPM2 antibody (PS03588) was purchased from Abmart, Shanghai, China. The immunohistochemical staining and grading was performed as described previously.24 The staining results were independently assessed by two senior pathologists in a blind manner. The intensity of TPM2 staining was graded into four levels: no cellular staining was considered 0, weak staining was considered as 1 point, moderate staining was considered as 2 points, and diffuse strong positivity was considered as 3 points. The range of tumor staining was graded into four grades: 1–25% was judged as 1 point, 26–50% was judged as 2 points, 51–75% was judged as 3 points, and 76–100% was judged as 4 points. The IHC score was equal to the intensity value multiplied by the staining range level. IHC score < 6 was defined as a low TPM2 expression, and IHC score ≥ 6 was defined as a high TPM2 expression (6 was the median value of IHC score). More than 1% cell nuclear staining was defined as positive for hormone receptors (ER/PR) in breast cancer.25 The IHC score of HER2 was graded on a 4-points scale from 0 to 3+. HER2 testing reports should be combined with IHC and in situ hybridization (ISH). HER2-negative is defined as IHC 0, 1+, or 2+/ISH not-amplified. HER2-positive is defined as IHC 3+ or IHC 2+/ISH amplified.26
The Molecular Subtypes of Breast Cancer
The breast cancer cases were divided into four subtypes: Luminal A (ER and/or PR positive, Ki-67 <14% and HER2 negative), Luminal B (ER and/or PR positive, Ki-67 ≥14% and/or HER2 positive), HER2-enriched (HER2 overexpressed or amplified, ER and PR negative), and triple negative (ER, PR, and HER2 negative).
Original Data Sources
We used the TCGA database (https://portal.gdc.cancer.gov), which is a large database that includes 33 types of cancer related data.27 We analyzed the following information: the mRNA expression of TPM2 in the pan-cancer, the differential expression of TPM2 between breast cancer tissues and normal breast tissues, and the relationship between TPM2 and immune infiltrating cells in breast cancer. The expression level of TPM2 protein and the promoter methylation level of TPM2 in breast cancer were studied with the UALCAN online database.
Functional Enrichment Analysis and Gene Set Enrichment Analysis
Gene Ontology (GO) gene enrichment and Kyoto Encyclopedia of Genes and Genomes (KEGG) enrichment analysis were downloaded from the TCGA database. Calibrated P values of less than 0.05 and fold change (log2) of more than 1.5 were considered statistically significant. The analysis was plotted by R packages (v3.6.3). In Gene Set Enrichment Analysis (GSEA), the gene sets with p<0.05 and false discovery rate (FDR) < 0.25 were considered as obviously enriched.
In Vitro Co-Culture Experiments
The THP-1 monocytes were differentiated to M0 macrophages by adding with 100 ng/mL PMA (phorbol 12-myristate 13-acetate) (MCE, New Jersey, USA) and incubating for 48 hr. Then, the M0 macrophages were incubated with 20 ng/mL IL4 and 20ng/mL IL3 for 48 hr to get M2 macrophages.28,29 The co-culture model of macrophages and breast cancer cells used the non-contact co-culture transwell system (Corning, New York, USA). After 48 hr, the macrophages and the breast cancer cells were collected for subsequent RT-qPCR experiments. The primer sequences for TPM2 RT-qPCR were as follows: (forward) 5’-AAGGGGACAGAGGATGAG-3’ and (reverse) 5’-CTTTCTCAGCCTCCTCCA-3’.
Statistical Analysis
Statistical analysis was performed using GraphPad Prism software. The association between the expression of TPM2 and clinicopathological parameters was performed by the χ2 test and Fisher’s exact tests. To compare the expression of TPM2 in different molecular subtypes of breast cancer, the ANOVA test was used. The receiver operating characteristic (ROC) curves were drawn, and the area under the curves (AUC) was calculated to assess the diagnostic value of TPM2. The p value of less than 0.05 was defined as statistically significant.
Results
Bioinformatics Analysis of the TPM2 Expression in Breast Cancer
We analyzed the RNA-seq data of TPM2 from the database of TCGA. In pan-cancers, the expression of TPM2 is altered abnormally. The data showed that the mRNA expression level of TPM2 was down-regulated in 20 cancer types and up-regulated in nine cancer types compared to normal tissues (Figure 1A). The paired and unpaired analysis suggested that TPM2 mRNA expression in breast cancer tissues was significantly lower than that of normal breast tissues (Figure 1B and C). Moreover, we analyzed the TPM2 protein expression alterations and the promoter methylation level of TPM2 through the UALCAN online database. Consistent with the TPM2 mRNA expression changes, the protein expression level of TPM2 was significantly downregulated in breast cancer tissues (Figure 1D). Significantly, the promoter methylation level of TPM2 in breast cancer tissues was much higher than that in normal breast tissue (Figure 1E). In breast cancer tissues, TPM2 may be downregulated by promoter methylation. Based on TCGA data, we used ROC curve analysis to detect the diagnostic accuracy of TPM2 for breast cancer. The AUC (Area Under Curve) was 0.770 (Figure 1F). These results indicate that TPM2 may function as a useful index for breast cancer diagnosis. Furthermore, breast cancer patients with lower TPM2 expression had a poorer prognosis (Figure 1G).
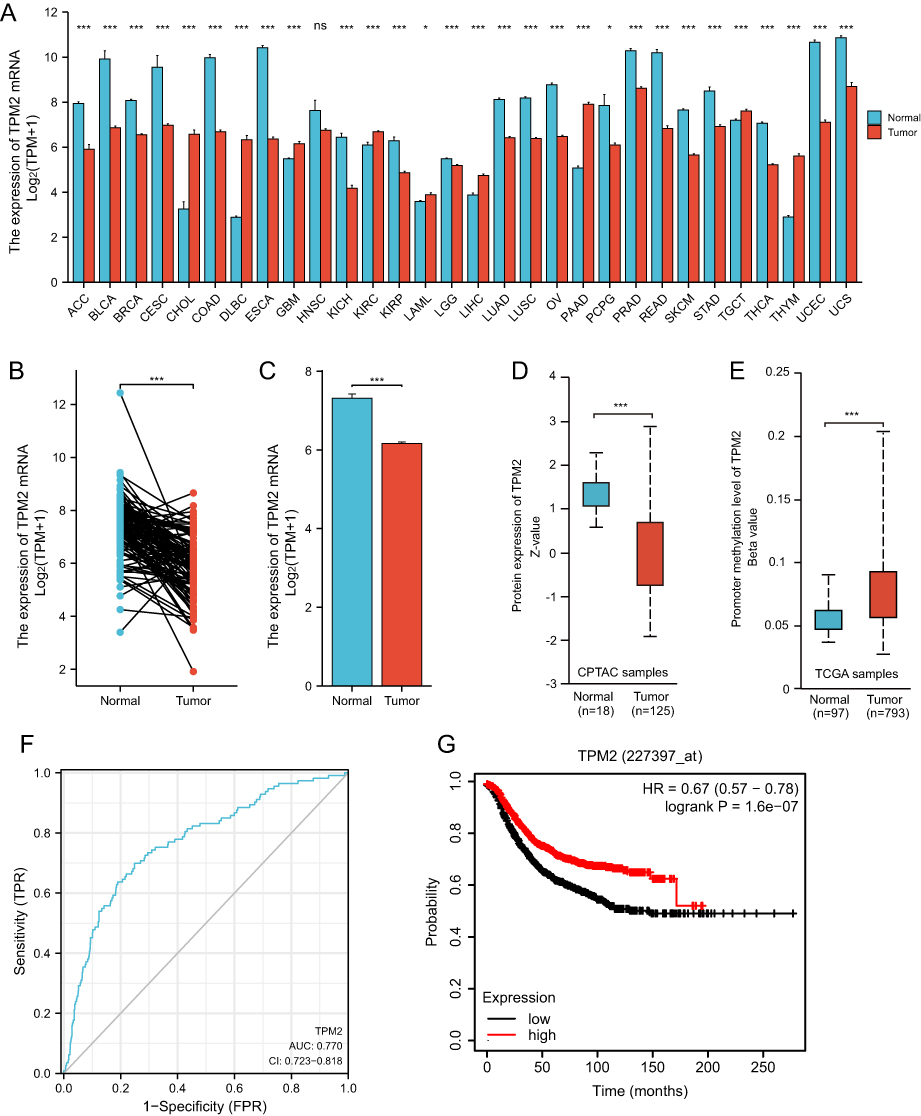 |
Figure 1 The RNA-seq data of TCGA databases and survival analysis of TPM2 in breast cancer. (A)The mRNA expression of TPM2 in cancer tissues compared with normal tissues in Pan-cancer. (*P < 0.05; ***P < 0.001; ns, no significance; ACC, Adrenocortical carcinoma; BLCA, Bladder Urothelial Carcinoma; BRCA, Breast invasive carcinoma; CESC, Cervical squamous cell carcinoma and endocervical adenocarcinoma; CHOL, Cholangio carcinoma; COAD, Colon adenocarcinoma; DLBC, Lymphoid Neoplasm Diffuse Large B-cell Lymphoma; ESCA, Esophageal carcinoma; GBM, Glioblastoma multiforme; HNSC, Head and Neck squamous cell carcinoma; KICH, Kidney Chromophobe; KIRC, Kidney renal clear cell carcinoma; KIRP, Kidney renal papillary cell carcinoma; LAML, Acute Myeloid Leukemia; LGG, Brain Lower Grade Glioma; LIHC, Liver hepatocellular carcinoma; LUAD, Lung adenocarcinoma; LUSC, Lung squamous cell carcinoma; OV, Ovarian serous cystadenocarcinoma; PAAD, Pancreatic adenocarcinoma; PCPG, Pheochromocytoma and Paraganglioma; PRAD, Prostate adenocarcinoma; READ, Rectum adenocarcinoma; SKCM, Skin Cutaneous Melanoma; STAD, Stomach adenocarcinoma; TGCT, Testicular Germ Cell Tumors; THCA, Thyroid carcinoma; THYM, Thymoma; UCEC, Uterine Corpus Endometrial Carcinoma; UCS, Uterine Carcinosarcoma).(A)The expression of TPM2 mRNA in breast cancer tissues (n=112) was significantly decreased compared with paired para-cancerous tissues. (*** p<0.001). (B)The expression of TPM2 mRNA in breast cancer tissues (n=1109) was obviously reduced compared with unpaired normal breast tissues (n=113). (*** p<0.001).(C)The TPM2 protein expression was reduced in breast cancer (n=125) compared to normal tissue (n=18). (*** p<0.001).(D)The promoter methylation level of TPM2 in breast cancer tumors (n=793) was increased compared to normal tissues (n=97). (*** p<0.001).(E)ROC curve analysis of TPM2 in breast cancer. The AUC value was 0.770 (95% CI, 0.723–0.818, P <0.0001). (AUC, area under the curves; CI, Confidence Interval). (F)The Kaplan-Meier survival analysis showed that low TPM2 expression was associated with poor RFS. (*** p<0.001; RFS, recurrence free survival). |
The Validation of TPM2 Expression in Breast Cancer Samples and the Correlation Between TPM2 Expression Level and Clinicopathological Parameters
We collected 155 female breast cancer cases from the Second Hospital of Shandong University. Using IHC, we detected the expression of TPM2 in breast cancer samples. The TPM2 expression was mainly located in cytoplasm. In normal breast tissues, TPM2 was strongly expressed; and in breast cancer tissues, TPM2 was slightly to moderately expressed (Figure 2). TPM2 expression is obviously down-regulated in breast cancer tissues (Figure 3A). The ROC curve analysis indicated that the TPM2 expression could distinguish the breast cancer tissues and normal breast tissues well (Figure 3B).
 |
Figure 2 Immunohistochemistry staining of TPM2 in breast samples (magnification ×100).(A)The high expression of TPM2 in normal breast tissues.(B)The moderate expression of TPM2 in breast cancer tissues.(C)The low expression of TPM2 in breast cancer tissues. |
 |
Figure 3 The expression of TPM2 in breast cancer was evaluated by immunohistochemical staining and grading.(A)The expression level of TPM2 in breast cancer tissues was significantly lower than that in normal breast tissues. (*** p<0.001).(A)ROC curve of TPM2 in normal breast tissues and breast cancers. AUC value of TPM2 in the diagnostic value of breast cancer was up to 0.7572 (95% CI 0.6797–0.8346, P <0.0001). (AUC, area under the curves; CI, Confidence Interval).(B)The expression of TPM2 was associated with lymph node metastases. (*** p<0.001).(C)ROC curve of TPM2 in predicting lymph node metastasis in breast cancer. The AUC value for TPM2 expression was 0.7226 (95% CI, 0.6428–0.8024, P <0.0001). (AUC, area under the curves; CI, Confidence Interval) (D)The expression of TPM2 was associated with histological grade. (* p<0.05).(F)ROC curve of TPM2 in distinguishing histological grades. The AUC value for TPM2 expression was 0.5989 (95% CI, 0.5099–0.6878, P <0.0001). (AUC, area under the curves; CI, Confidence Interval). |
Moreover, we conducted correlation analysis between TPM2 expression level and common clinicopathological parameters, such as histological grading, tumor size, lymph node metastases (LNM), and so on in Table 1. The expression of TPM2 was irrelevant to age, tumor size, HER2 status, and the molecular subtypes. Among the patients without LNM, 28 cases (31.5%) were low expression of TPM2, in patients with LNM, 47 cases (71.2%) were low expression. These results indicated that the TPM2 expression level was lower in breast cancer tissues with LNM (Figure 3C). The ROC curve showed the value of TPM2 expression in discriminating between LNM negative and LNM positive breast cancer tissues (Figure 3D). According to histological grading, there were 93 patients in grade I+ II (low histological grade) and 62 patients in grade III (high histological grade). In low histological grade patients, 36 patients (38.7%) were low expression of TPM2; however, in high histological-grade patients, 38 patients (61.3%) had low expression of TPM2. The TPM2 expression level was significantly lower in high histological-grade patients than in low histological-grade patients (Figure 3E). However, the expression level of TPM2 had no meaning in distinguishing high histological-grade patients and low histological-grade patients (Figure 3F).
 |
Table 1 The Association Between TPM2 and Clinicopathological Parameters |
TPM2 Expression Was Associated with Important Signaling Pathways in Breast Cancer
In order to further explore the potential biological function of TPM2 in breast cancer, we conducted a functional enrichment analysis of TPM2 from the TCGA database. Differentially expressed genes (DEGs) were applied, and the samples of breast cancer were divided into high- and the low-TPM2 expression groups based on the median data. We selected 18 pathways from the GO biological function enrichment and KEGG pathway enrichment analyses, including extracellular structure organization, extracellular matrix organization, external encapsulating structure organization, collagen fibril organization, positive regulation of cell junction assembly, keratinization, cell junction assembly, regulation of membrane potential, cell aggregation, apoptotic process involved in development, ion channel complex, stress fiber, structural constituent of cytoskeleton, ECM–receptor interaction, focal adhesion, cAMP signaling pathway, estrogen signaling pathway, and Wnt signaling pathway (Figure 4A and Table 2). The GSEA analysis indicated 10 important signaling pathways, such as adaptive immune system, immunoregulatory interactions between a lymphoid and a nonlymphoid cell, cytokine signaling in immune system, regulation of actin cytoskeleton, pathways in cancer, Pi3k-akt signaling pathway, Wnt signaling, ECM proteoglycans, focal adhesion, extracellular matrix organization (Figure 4B and Table 3).
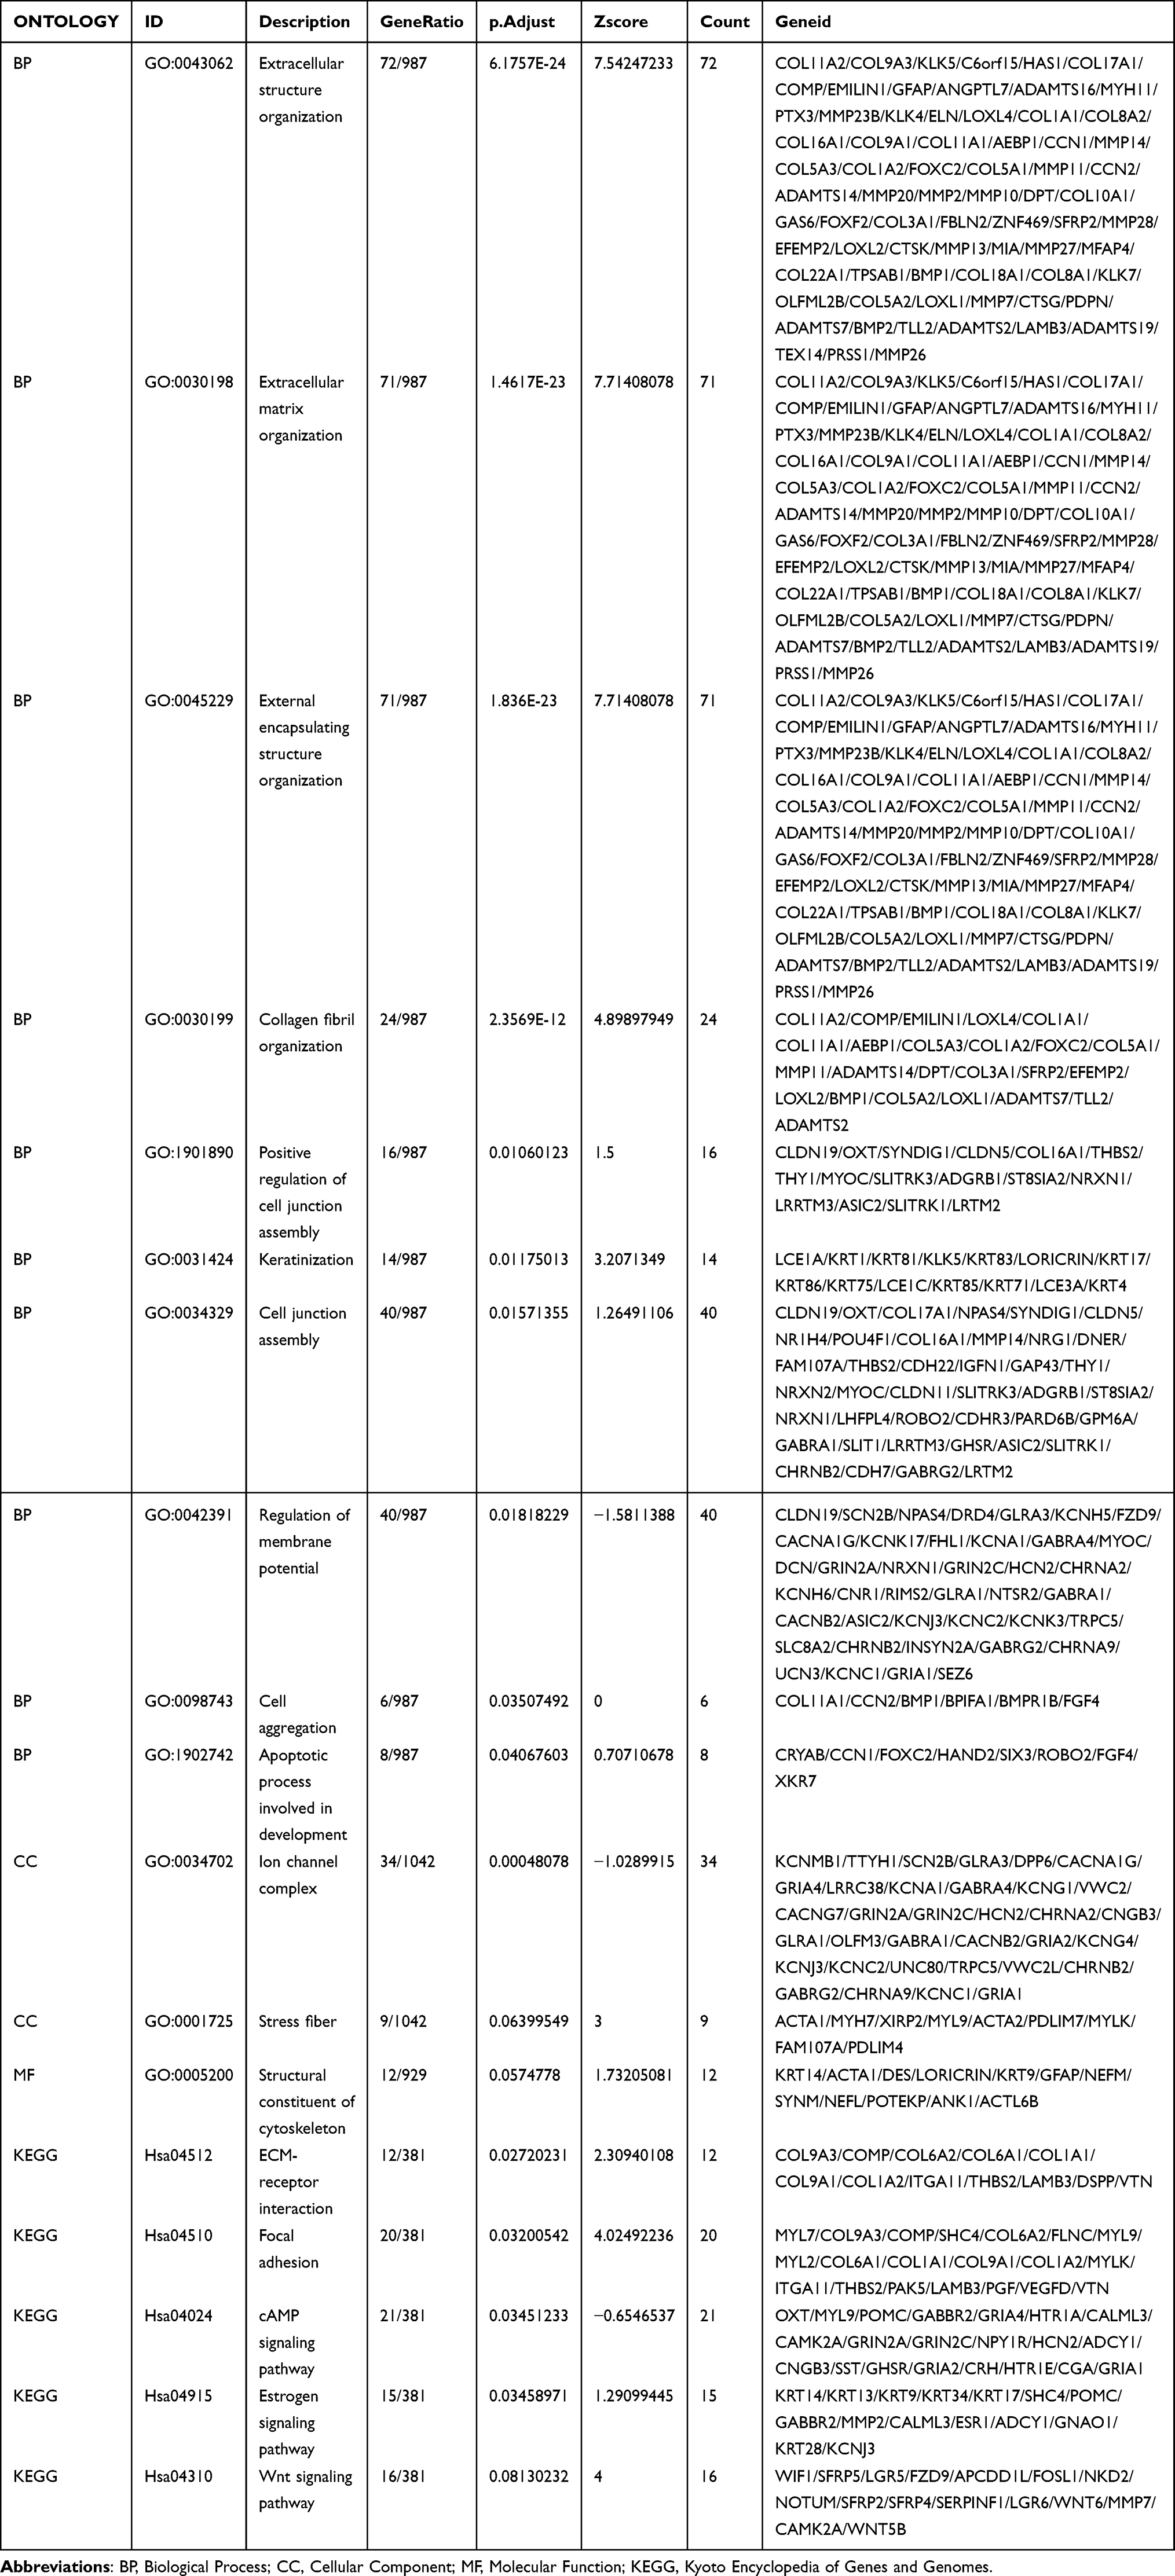 |
Table 2 The GO/KEGG Analysis of TPM2 in Breast Cancer |
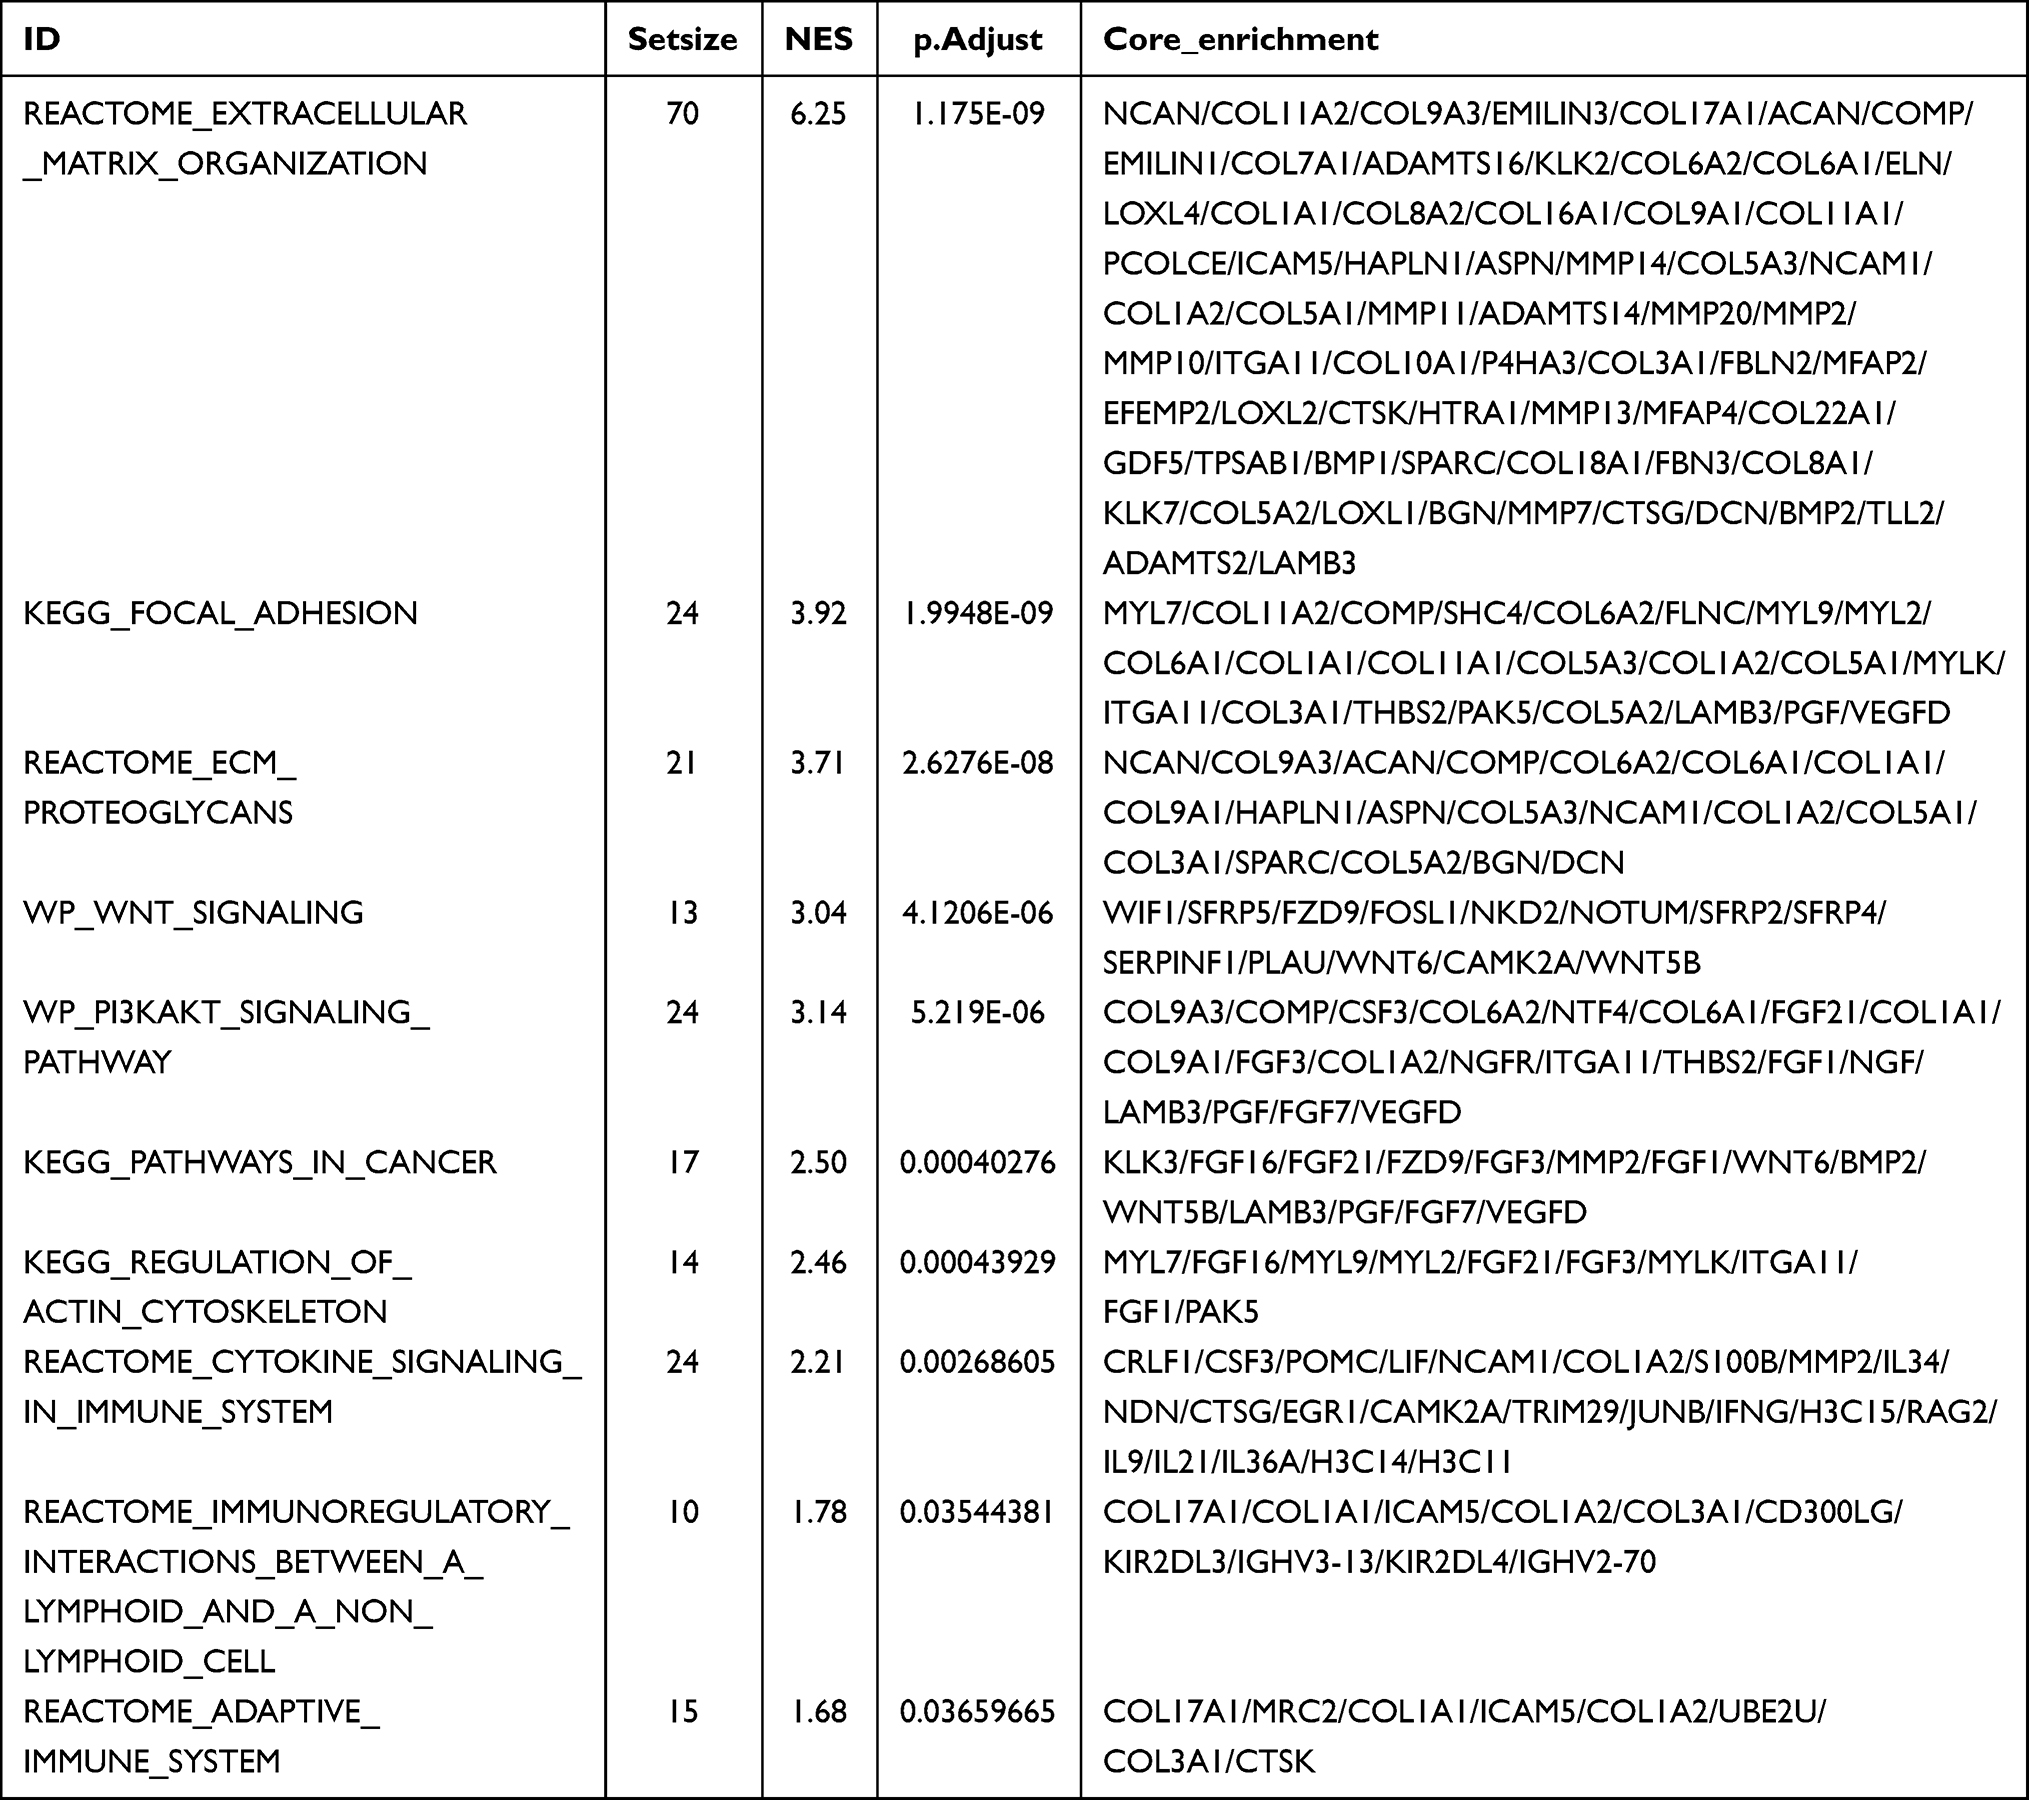 |
Table 3 The GSEA Analysis of TPM2 in Breast Cancer |
 |
Figure 4 Biological function of TPM2 in breast cancer.(A)GO and KEGG pathways were analyzed, and 18 pathways were selected. (B)GSEA signaling pathways were analyzed, and 10 pathways were chosen. (NES, normalize enrichment score). |
The Correlation Analysis of TPM2 and Tumor Immune Infiltration in Breast Cancer
The above GSEA analysis indicated that TPM2 was strongly associated with tumor immunogenicity, so we further explored the association of TPM2 expression level with tumor immune infiltrating cells using TCGA database. The TPM2 expression was positively correlated with NK cells (r = 0.49, P<0.001), pDC (r = 0.268, P<0.001), iDC (r = 0.281, P<0.001) and macrophages (r = 0.250, P<0.001) (Figure 5A–E). The TPM2 expression was negatively associated with T helper cells (r = −0.298, P<0.001), Th2 cells (r = −0.263, P<0.001), and Tcm (r = −0.254, P<0.001) (Figure 5A and F–H). To investigate the relationship between TPM2 expression and immune infiltrating cells, we introduced the in vitro co-culture model. THP-1 monocytes were differentiated into M0 macrophages and polarized into M2 macrophages. The M2 macrophages were active macrophages and the M0 macrophages were inactive macrophages.28,29 These macrophages were co-cultured with MCF-7 cells or MDA-MB-231 cells. Our results showed that M2 macrophages upregulated the mRNA expression level of TPM2 in breast cancer cell lines (Figure 5I and J). These data were coordinated with the GSEA analysis data.
 |
Figure 5 Correlation analysis of TPM2 and immune infiltration in breast cancer.(A)Correlation analysis between TPM2 expression and 18 types of common TILs in breast cancer. (B-H) The correlation analysis between TPM2 expression and NK cells (B), pDC (C), iDC (D), macrophages (E), T helper cells (F), Th2 cells (G), Tcm (H) in breast cancer.(I-J) In vitro co-culture experiments indicated that M2 macrophages upregulated the TPM2 expression in MCF-7 cells (I) and MDA-MB-231 cells (J). (* p<0.05, **P < 0.01). |
Furthermore, we analyzed the relationship between TPM2 expression level and 36 common immune checkpoint gene expression levels in breast cancer (Figure 6A). The expression of TPM2 was significantly correlated with TNFRSF4 (r = 0.433, P<0.001), CD276 (r = 0.386, P<0.001), CD200 (r = 0.349, P<0.001), and CD40 (r = 0.289, P<0.001) (Figure 6B–E). To sum up, TPM2 may affect the tumor immune response in breast cancer.
 |
Figure 6 Correlation analysis between TPM2 expression and immune checkpoint molecules expression in breast cancer. (A) The diagram of correlation analysis between TPM2 and immune checkpoint molecules. (B-E) TPM2 was positively correlated with TNFRSF4 (B), CD276 (C), CD200 (D) and CD40 (E). |
Discussion
TPM2 is located on the cell edge by interacting with focal adhesion proteins and plays a vital role in physiological function. It is mainly expressed in smooth muscle cells, skeletal muscle cells, and fibroblasts.30 In malignant tumors, TPM2 may act as a tumor suppressor gene or a tumor promoter gene.23 Previous research confirmed that TPM2 was down-regulated in esophageal squamous cell carcinoma.31 Also, TPM2 expression level declined in colon cancer, and TPM2 inhibited colon cancer cell proliferation and migration.32 In bladder cancer cell, TPM2 promoted cell proliferation and was related to poor overall and disease-specific survival.33 In ovarian cancer, TPM2 was obviously up-regulated.34 In normal breast epithelial cells, TPM2 had a relative high expression level.5 In this study, we analyzed the mRNA expression of TPM2 through TCGA database and found that TPM2 was down-regulated in 20 types of tumors, including breast cancer, and up-regulated in nine types of tumors. We collected breast cancer tissues and detected TPM2 expression by immunohistochemical staining. Our results showed that the expression of TPM2 was significantly decreased in breast cancer tissues, which was in accordance with the bioinformatics data. Furthermore, we analyzed the correlation between TPM2 expression level and clinicopathologic parameters. We defined that TPM2 expression was significantly correlated with lymph node metastases and histological grade. Through the Kaplan–Meier plotter online database, we found that patients with lower TPM2 expression had a poorer prognosis. TPM2 had a potential value for predicting prognosis in breast cancer.
Previous research has indicated that TPM2 regulates cell migration and aggregation in breast cancer.35 Researchers also reported that TPM2 maintained microfilaments assembly and inhibited cancer cells growth.36–38 In breast cancer cell lines, silencing the expression of TPM2 inhibits the stress fiber formation, thereby promoting tumor transformation.39 Under hypoxic conditions, TPM2 plays key functions in regulating cell migration and infiltration.40 The above studies demonstrated that TPM2 plays important functions in breast cancer progression. In the present study, we analyzed the potential molecular mechanism by bioinformatics analysis. Our bioinformatics data indicated TPM2 was involved in several important pathways, such as cAMP signaling pathway (Table 2 and Figure 4A), estrogen signaling pathway (Table 2 and Figure 4A), Wnt signaling pathway (Table 2 and Figure 4A), pathways in cancer (Table 3 and Figure 4B) and Pi3k-akt signaling pathway (Table 3 and Figure 4B). Additionally, TPM2 was related to extracellular structural organization, collagen fibril organization, cell junction assembly, cell aggregation, apoptotic process involved in development and adaptive immune system. Cytoskeletons are mainly organized by three types of proteins: actin, proteins forming intermediate filaments and tubulin, which play important functions in multiple cellular processes such as cell proliferation, migration, differentiation, and apoptosis.41–43 Changes in the expression of actin-binding proteins could cause abnormal regulation of the actin cytoskeleton and may lead to tumor transformation.44 As actin-binding proteins, TPMs play key roles in stabilizing actin filaments during actin assembly.45 The down-regulation of TPMs led to cytoskeletal recombination and epithelial–mesenchymal transition in cancer progression.46
Nowadays immune checkpoint inhibitors (ICIs) and immunotherapy are widely used in malignant tumor treatments, including breast cancer.47–49 However, the ICIs cannot benefit every patient, and it may cause some serious immune-related damages under special conditions.50 The anti-tumor immune response plays an indispensable role in the progression of breast cancer.51,52 At present, researchers have recognized the importance of tumor immune microenvironment (TIME). To mitigate unnecessary drug toxicity, biomarkers that could predict immunotherapy response are urgently needed. Our study indicates that TPM2 may affect tumor immuno-infiltration. We found that TPM2 expression was correlated with immune infiltrating cells, such as NK cells, pDC, iDC, macrophages, T helper cells, Th2 cells, and Tcm. Immune-infiltrating cells (ICCs), including NK cells, pDC, iDC, and macrophages, affected breast cancer progression and treatment.53 NK cells can directly target and kill cancer cells without MHC molecule specificity, and play an important role in initiating adaptive immune response.54 We also analyzed the relationship between TPM2 and 36 common immune checkpoint genes in breast cancer. The expression of TPM2 was significantly correlated with TNFRSF4, CD276, CD200, and CD40. These results suggest that TPM2 plays a major role in the tumor immune microenvironment of breast cancer, and the mechanism between them needs to be further explored.
Conclusion
In summary, TPM2 expression was significantly down-regulated in breast cancer. The expression level of TPM2 was related to lymph node metastasis, clinical prognosis, and immune infiltration of breast cancer. TPM2 exerted a suppressive effect on breast cancer occurrence and development. This study elucidated the potential value of TPM2 in breast cancer diagnosis, prognosis prediction, and immunotherapy.
Ethics Approval
This research was approved by the Research Ethics Committee of the Second Hospital of Shandong University. The informed consents of patients have been obtained. Our study complied with the Declaration of Helsinki.
Author Contributions
All of the authors contributed to data analysis, drafting or revising the article, have agreed on the journal to which the article will be submitted, gave final approval of the version to be published and agreed to be accountable for all aspects of the work.
Funding
This research was supported by the grant (NO. 81802646 to Hui Li) from the National Natural Science Foundation of China.
Disclosure
The authors declare that they have no related conflict of interest. This research was conducted in the absence of any commercial or financial relationship that could be construed as a potential conflict of interest.
References
1. Siegel RL, Miller KD, Fuchs HE, et al. Cancer statistics, 2021. CA Cancer J Clin. 2021;71(1):7–33. doi:10.3322/caac.21654
2. Ganesh K, Massague J. Targeting metastatic cancer. Nat Med. 2021;27(1):34–44. doi:10.1038/s41591-020-01195-4
3. Welch DR, Hurst DR. Defining the hallmarks of metastasis. Cancer Res. 2019;79(12):3011–3027. doi:10.1158/0008-5472.CAN-19-0458
4. Wang FL, Wang Y, Wong WKet al. Two differentially expressed genes in normal human prostate tissue and in carcinoma. Cancer Res. 1996;56(16):3634–3637.
5. Franzen B, Linder S, Uryu K,et al. Expression of tropomyosin isoforms in benign and malignant human breast lesions. Br J Cancer. 1996;73(7):909–913. doi:10.1038/bjc.1996.162
6. Hughes JA, Cooke‐Yarborough CM, Chadwick NC, et al. High-molecular-weight tropomyosins localize to the contractile rings of dividing CNS cells but are absent from malignant pediatric and adult CNS tumors. Glia. 2003;42(1):25–35. doi:10.1002/glia.10174
7. Lin JJ, Warren KS, Wamboldt DDet al. Tropomyosin isoforms in nonmuscle cells. Int Rev Cytol. 1997;170:1–38.
8. Pittenger MF, Kazzaz JA, Helfman DM. Functional properties of non-muscle tropomyosin isoforms. Curr Opin Cell Biol. 1994;6(1):96–104. doi:10.1016/0955-0674(94)90122-8
9. Gunning P, O’Neill G, Hardeman E. Tropomyosin-based regulation of the actin cytoskeleton in time and space. Physiol Rev. 2008;88(1):1–35. doi:10.1152/physrev.00001.2007
10. O’Neill GM, Stehn J, Gunning PW. Tropomyosins as interpreters of the signalling environment to regulate the local cytoskeleton. Semin Cancer Biol. 2008;18(1):35–44. doi:10.1016/j.semcancer.2007.08.004
11. Hitchcock-DeGregori SE, Barua B. Tropomyosin structure, function, and interactions: a dynamic regulator. Subcell Biochem. 2017;82:253–284.
12. Liu G, Zhao X, Zhou J, et al. Long non-coding RNA MEG3 suppresses the development of bladder urothelial carcinoma by regulating miR-96 and TPM1. Cancer Biol Ther. 2018;19(11):1039–1056. doi:10.1080/15384047.2018.1480279
13. Mao Y, He J-X, Zhu M, et al. Circ0001320 inhibits lung cancer cell growth and invasion by regulating TNFAIP1 and TPM1 expression through sponging miR-558. Hum Cell. 2021;34(2):468–477. doi:10.1007/s13577-020-00453-4
14. Lin J, Shen J, Yue H, et al. miRNA‑183‑5p.1 promotes the migration and invasion of gastric cancer AGS cells by targeting TPM1. Oncol Rep. 2019;42(6):2371–2381. doi:10.3892/or.2019.7354
15. Chen Y, Hong Z, Lu S, et al. Downregulated expression of tropomyosin 1 in intrahepatic cholangiocarcinoma: a predictor of recurrence and prognosis. Med Sci Monit. 2018;24:7875–7882. doi:10.12659/MSM.907340
16. Lam CY, Yip CW, Poon TCW, et al. Identification and characterization of tropomyosin 3 associated with granulin-epithelin precursor in human hepatocellular carcinoma. PLoS One. 2012;7(7):e40324. doi:10.1371/journal.pone.0040324
17. Kim TM, Yim S-H, Shin S-H, et al. Clinical implication of recurrent copy number alterations in hepatocellular carcinoma and putative oncogenes in recurrent gains on 1q. Int J Cancer. 2008;123(12):2808–2815. doi:10.1002/ijc.23901
18. Choi HS, Yim S-H, Xu H-D, et al. Tropomyosin3 overexpression and a potential link to epithelial-mesenchymal transition in human hepatocellular carcinoma. BMC Cancer. 2010;10(1):122. doi:10.1186/1471-2407-10-122
19. Dube DK, Dube S, Abbott L, et al. Cloning, sequencing, and the expression of the elusive sarcomeric TPM4 α isoform in humans. Mol Biol Int. 2016;2016:3105478. doi:10.1155/2016/3105478
20. Li L, Ye T, Zhang Q, et al. The expression and clinical significance of TPM4 in hepatocellular carcinoma. Int J Med Sci. 2021;18(1):169–175. doi:10.7150/ijms.49906
21. Yang R, Zheng G, Ren D, et al. The clinical significance and biological function of tropomyosin 4 in colon cancer. Biomed Pharmacother. 2018;101:1–7. doi:10.1016/j.biopha.2018.01.166
22. Ma RN, Mabuchi K, Li J, et al. Cooperation between the two heads of smooth muscle myosin is essential for full activation of the motor function by phosphorylation. Biochemistry. 2013;52(36):6240–6248. doi:10.1021/bi400554s
23. Ma Y, Xiao T, Xu Q, et al. iTRAQ-based quantitative analysis of cancer-derived secretory proteome reveals TPM2 as a potential diagnostic biomarker of colorectal cancer. Front Med. 2016;10(3):278–285. doi:10.1007/s11684-016-0453-z
24. Zhou X, Zhang J, Yun H, et al. Alterations of biomarker profiles after neoadjuvant chemotherapy in breast cancer: tumor heterogeneity should be taken into consideration. Oncotarget. 2015;6(34):36894–36902. doi:10.18632/oncotarget.5050
25. Allison KH, Hammond MEH, Dowsett M, et al. Estrogen and progesterone receptor testing in breast cancer: ASCO/CAP guideline update. J Clin Oncol. 2020;38(12):1346–1366. doi:10.1200/JCO.19.02309
26. Wolff AC, Somerfield MR, Dowsett M, et al. Human epidermal growth factor receptor 2 testing in breast cancer: asco-college of American pathologists guideline update. J Clin Oncol. 2023;41(22):3867–3872. doi:10.1200/JCO.22.02864
27. Tomczak K, Czerwinska P, Wiznerowicz M. The Cancer Genome Atlas (TCGA): an immeasurable source of knowledge. Contemp Oncol. 2015;19(1A):A68–77. doi:10.5114/wo.2014.47136
28. Genin M, Clement F, Fattaccioli A, et al. M1 and M2 macrophages derived from THP-1 cells differentially modulate the response of cancer cells to etoposide. BMC Cancer. 2015;15:577. doi:10.1186/s12885-015-1546-9
29. Bosshart H, Heinzelmann M. THP-1 cells as a model for human monocytes. Ann Transl Med. 2016;4(21):438. doi:10.21037/atm.2016.08.53
30. Atherton P, Stutchbury B, Jethwa D, et al. Mechanosensitive components of integrin adhesions: role of vinculin. Exp Cell Res. 2016;343(1):21–27. doi:10.1016/j.yexcr.2015.11.017
31. Zhang J, Wang K, Zhang J, et al. Using proteomic approach to identify tumor-associated proteins as biomarkers in human esophageal squamous cell carcinoma. J Proteome Res. 2011;10(6):2863–2872. doi:10.1021/pr200141c
32. Cui J, Cai Y, Hu Y, et al. Epigenetic silencing of TPM2 contributes to colorectal cancer progression upon RhoA activation. Tumour Biol. 2016;37(9):12477–12483. doi:10.1007/s13277-016-5103-1
33. Yan Y, Li J, Ye M, et al. Tropomyosin is potential markers for the diagnosis and prognosis of bladder cancer. Dis Markers. 2022;2022:6936262. doi:10.1155/2022/6936262
34. Tang HY, Beer LA, Tanyi JL, et al. Protein isoform-specific validation defines multiple chloride intracellular channel and tropomyosin isoforms as serological biomarkers of ovarian cancer. J Proteomics. 2013;89:165–178. doi:10.1016/j.jprot.2013.06.016
35. Shin H, Kim D, Helfman DM. Tropomyosin isoform Tpm2.1 regulates collective and amoeboid cell migration and cell aggregation in breast epithelial cells. Oncotarget. 2017;8(56):95192–95205. doi:10.18632/oncotarget.19182
36. Mahadev K, Raval G, Bharadwaj S,et al. Suppression of the transformed phenotype of breast cancer by tropomyosin-1. Exp Cell Res. 2002;279(1):40–51. doi:10.1006/excr.2002.5583
37. Prasad GL, Fuldner RA, Cooper HL. Expression of transduced tropomyosin 1 cDNA suppresses neoplastic growth of cells transformed by the ras oncogene. Proc Natl Acad Sci U S A. 1993;90(15):7039–7043. doi:10.1073/pnas.90.15.7039
38. Prasad GL, Masuelli L, Raj MHG, et al. Suppression of src-induced transformed phenotype by expression of tropomyosin-1. Oncogene. 1999;18(11):2027–2031. doi:10.1038/sj.onc.1202264
39. Dube S, Thomas A, Abbott L, et al. Expression of tropomyosin 2 gene isoforms in human breast cancer cell lines. Oncol Rep. 2016;35(6):3143–3150. doi:10.3892/or.2016.4732
40. Zhang J, Zhang J, Xu S, et al. Hypoxia-induced TPM2 methylation is associated with chemoresistance and poor prognosis in breast cancer. Cell Physiol Biochem. 2018;45(2):692–705. doi:10.1159/000487162
41. Pollard TD, Cooper JA. Actin, a central player in cell shape and movement. Science. 2009;326(5957):1208–1212. doi:10.1126/science.1175862
42. Fife CM, McCarroll JA, Kavallaris M. Movers and shakers: cell cytoskeleton in cancer metastasis. Br J Pharmacol. 2014;171(24):5507–5523. doi:10.1111/bph.12704
43. Hohmann T, Dehghani F. The cytoskeleton-a complex interacting meshwork. Cells. 2019;8(4):362. doi:10.3390/cells8040362
44. Li X, Wang J. Mechanical tumor microenvironment and transduction: cytoskeleton mediates cancer cell invasion and metastasis. Int J Biol Sci. 2020;16(12):2014–2028. doi:10.7150/ijbs.44943
45. Cooper JA. Actin dynamics: tropomyosin provides stability. Curr Biol. 2002;12(15):R523–5. doi:10.1016/S0960-9822(02)01028-X
46. Gervasi M, Bianchi-Smiraglia A, Cummings M, et al. JunB contributes to Id2 repression and the epithelial-mesenchymal transition in response to transforming growth factor-beta. J Cell Biol. 2012;196(5):589–603. doi:10.1083/jcb.201109045
47. Vassilakopoulos TP, Chatzidimitriou C, Asimakopoulos JV, et al. Immunotherapy in Hodgkin lymphoma: present status and future strategies. Cancers. 2019;11(8):1071. doi:10.3390/cancers11081071
48. Rocco D, Della Gravara L, Battiloro C, et al. The role of combination chemo-immunotherapy in advanced non-small cell lung cancer. Expert Rev Anticancer Ther. 2019;19(7):561–568. doi:10.1080/14737140.2019.1631800
49. Andre T, Shiu -K-K, Kim TW, et al. Pembrolizumab in microsatellite-instability-high advanced colorectal cancer. N Engl J Med. 2020;383(23):2207–2218. doi:10.1056/NEJMoa2017699
50. Postow MA, Sidlow R, Hellmann MD. Immune-related adverse events associated with immune checkpoint blockade. N Engl J Med. 2018;378(2):158–168. doi:10.1056/NEJMra1703481
51. Foukakis T, Lövrot J, Matikas A, et al. Immune gene expression and response to chemotherapy in advanced breast cancer. Br J Cancer. 2018;118(4):480–488. doi:10.1038/bjc.2017.446
52. Law AMK, Lim E, Ormandy CJ, et al. The innate and adaptive infiltrating immune systems as targets for breast cancer immunotherapy. Endocr Relat Cancer. 2017;24(7):X1. doi:10.1530/ERC-16-0404e
53. Goff SL, Danforth DN. The role of immune cells in breast tissue and immunotherapy for the treatment of breast cancer. Clin Breast Cancer. 2021;21(1):e63–e73. doi:10.1016/j.clbc.2020.06.011
54. Ben-Shmuel A, Biber G, Barda-Saad M. Unleashing natural killer cells in the tumor microenvironment-the next generation of immunotherapy? Front Immunol. 2020;11:275. doi:10.3389/fimmu.2020.00275
 © 2024 The Author(s). This work is published and licensed by Dove Medical Press Limited. The
full terms of this license are available at https://www.dovepress.com/terms
and incorporate the Creative Commons Attribution
- Non Commercial (unported, 3.0) License.
By accessing the work you hereby accept the Terms. Non-commercial uses of the work are permitted
without any further permission from Dove Medical Press Limited, provided the work is properly
attributed. For permission for commercial use of this work, please see paragraphs 4.2 and 5 of our Terms.
© 2024 The Author(s). This work is published and licensed by Dove Medical Press Limited. The
full terms of this license are available at https://www.dovepress.com/terms
and incorporate the Creative Commons Attribution
- Non Commercial (unported, 3.0) License.
By accessing the work you hereby accept the Terms. Non-commercial uses of the work are permitted
without any further permission from Dove Medical Press Limited, provided the work is properly
attributed. For permission for commercial use of this work, please see paragraphs 4.2 and 5 of our Terms.
Recommended articles
The Involvement of Insulin-Like Growth Factor 2 Messenger Ribonucleic Acid-Binding Protein 2 in the Regulation of the Expression of Breast Cancer-Related Genes
Gao C, Li L, Jin X, Song X, Li H, Xu X, Dong C, Ma B
Breast Cancer: Targets and Therapy 2022, 14:311-322
Published Date: 10 October 2022
Identification of CISD1 as a Prognostic Biomarker for Breast Cancer
Liu X, Cui Q
International Journal of General Medicine 2022, 15:8451-8465
Published Date: 3 December 2022
Chromobox Family Proteins as Putative Biomarkers for Breast Cancer Management: A Preliminary Study Based on Bioinformatics Analysis and qRT-PCR Validation
Tian H, Zhao T, Li Y, Sun N, Ma D, Shi Q, Zhang G, Chen Q, Zhang K, Chen C, Zhang Y, Qi X
Breast Cancer: Targets and Therapy 2022, 14:515-535
Published Date: 30 December 2022
Prognostic and Immunological Roles of CES2 in Breast Cancer and Potential Application of CES2-Targeted Fluorescent Probe DDAB in Breast Surgery
Qu W, Yao Y, Liu Y, Jo H, Zhang Q, Zhao H
International Journal of General Medicine 2023, 16:1567-1580
Published Date: 27 April 2023
Network Analysis of Osteoarthritis Progression Using a Steiner Minimal Tree Algorithm
Xie Y, Shao F, Ji Y, Feng D, Wang L, Huang Z, Wu S, Sun F, Jiang H, Miyamoto A, Wang H, Zhang C
Journal of Inflammation Research 2024, 17:3201-3209
Published Date: 18 May 2024