Back to Journals » Diabetes, Metabolic Syndrome and Obesity » Volume 15
Relationships Between Indicators of Metabolic Disorders and Selected Concentrations of Bioelements and Lead in Serum and Bone Tissue in Aging Men
Authors Rył A ![]() , Szylińska A, Bohatyrewicz A, Jurewicz A, Pilarczyk B
, Szylińska A, Bohatyrewicz A, Jurewicz A, Pilarczyk B ![]() , Tomza-Marciniak A, Rotter I
, Tomza-Marciniak A, Rotter I ![]()
Received 24 August 2022
Accepted for publication 22 November 2022
Published 14 December 2022 Volume 2022:15 Pages 3901—3911
DOI https://doi.org/10.2147/DMSO.S387444
Checked for plagiarism Yes
Review by Single anonymous peer review
Peer reviewer comments 2
Editor who approved publication: Dr Konstantinos Tziomalos
Aleksandra Rył,1 Aleksandra Szylińska,1 Andrzej Bohatyrewicz,2 Alina Jurewicz,2 Bogumiła Pilarczyk,3 Agnieszka Tomza-Marciniak,3 Iwona Rotter1
1Department of Medical Rehabilitation and Clinical Physiotherapy, Pomeranian Medical University, Szczecin, Poland; 2Department of Orthopedics, Traumatology and Orthopedic Oncology, Pomeranian Medical University, Szczecin, Poland; 3Department of Animal Reproduction Biotechnology and Environmental Hygiene, West Pomeranian University of Technology, Szczecin, Poland
Correspondence: Aleksandra Rył, Department of Medical Rehabilitation and Clinical Physiotherapy, Pomeranian Medical University, Żołnierska 54, Szczecin, 71-210, Poland, Tel +4891 810 62 61, Email [email protected]
Background: The aim of this study was to investigate the relationships between serum and bone concentrations of selected bioelements, ie, zinc (Zn), copper (Cu), iron (Fe), chrome (Cr), magnesium (Mg), and selenium (Se), and a heavy metal, ie, lead (Pb), and the selected indicators of metabolic disorders - Visceral Adiposity Index (VAI), Lipid Accumulation Product (LAP) and Body Mass Index (BMI).
Material and Methods: The study comprised 151 men aged 60 to 75 years who were scheduled for hip replacement surgery due to osteoarthritis. The concentrations of elements in the serum and bone tissue were measured using inductively coupled plasma optical emission spectrometry (Mg, Zn, Cu, Cr, Fe, and Pb) and the spectrofluorometric method (Se). Fasting plasma glucose (FPG), high-density cholesterol (HDL-Ch), and triacylglycerols (TAG) were determined. Lipid accumulation product (LAP) and visceral adiposity index (VAI) were calculated.
Results: There was no relationship between serum and bone concentrations of bioelements and lead and the BMI index. Bone Mg was significantly higher in men with higher VAI, but no such relation was observed in the serum. Similarly, bone Mg and Zn were higher in patients with higher LAP, which was not observed in the serum. Multivariate logistic regression analysis with adjustment for age was performed. There was a correlation between serum Zn concentration and the cut-off point for VAI. The cut-off point for LAP was related to the bone tissue concentrations of Mg, Zn, and Cu.
Conclusion: We found some relationships between the concentrations of selected bioelements and Pb and VAI, LAP, and BMI in bone but not in the serum. VAI positively correlated with bone Mg, while LAP positively correlated with bone Cu, Zn, and Mg.
Keywords: aging men, indicators of fat accumulation, adiposity, metabolic disorders, bone tissue, bioelements
Introduction
The relationships between macronutrient and micronutrient concentrations in various body tissues and metabolic disorders are varied but still not entirely understood. They are responsible for maintaining normal osmotic pressure and electrolyte balance, they regulate various metabolic processes and are the elements of hormones, enzymes, and coenzymes.
Magnesium (Mg) deficiency in serum is associated with METS through the concept that metabolic syndrome is conditioned by the formation and development of inflammation. Mg deficiency is associated with stress and activates the hypothalamic-pituitary-adrenal (HPA) axis and the sympathetic nervous system. Activation of the renin-angiotensin-aldosterone system is a factor in the development of insulin resistance by increasing oxidative stress.1 Copper (Cu), zinc (Zn), and iron (Fe) are involved in numerous antioxidant enzymes. Blood concentrations of Cu and Fe may be positively related to diabetes risk.2 In turn, a higher dietary intake of Zn may be associated with a reduced risk of METS.3 The relationship between serum Pb concentration and the diagnosis of obesity is unclear. Studies show different results, eg a positive correlation4,5 and a negative correlation,6 with the relationship between type 2 diabetes diagnosis and Pb concentration frequently described as positive.7,8
Although literature describes a link between macronutrient concentrations and metabolic disorders, the data are often inconclusive,9–11 which may be related to the multiplicity of indices used to assess fat accumulation and metabolism. Among the anthropometric parameters used to assess body fat, the most common is body mass index (BMI). However, BMI is not the most objective index for assessing adipose tissue function as it does not take into account factors that affect visceral fat mass and its function.12 That is why the visceral adiposity index (VAI) is used as a marker of visceral adipose tissue dysfunction. The mathematical model for calculating VAI covers both anthropometric and biochemical parameters.13 VAI has been shown to be associated with both tissue insulin sensitivity and visceral adipose tissue.14 Another useful tool is the lipid accumulation product (LAP) which adds waist circumference and triglyceride levels and has been recognized as an effective marker of metabolic syndrome in adult populations.15,16
The relationship between the indicators of metabolic disorders and concentrations of bioelements in tissues is poorly described, and the available data are often discrepant. Earlier studies have shown that there may be a correlation between serum Zn and BMI and serum Fe in older adults.17 A study on an animal model has shown that chronic supplementation with high doses of Zn induces visceral adipose tissue hypertrophy and impairs protein kinase B signaling.18 A study analyzing the relationship between Cu concentrations and lipid parameters indicates that deficiencies of this element can result in increased lipid levels in the peripheral circulation; this concerns glycolipids, cholesterol, triglyceride, and phospholipids.19 High serum Cu concentrations are associated with obesity; it has been shown that Cu positively correlates with body mass index (BMI) and leptin and insulin levels.20 Although metabolic syndrome may be aggravated by heavy metals, also abnormal serum concentrations of bioelements can coexist with METS. It has also been shown that patients with diabetes have higher Ca and Mg levels in serum, and Cr and Mn are higher in obese men.21 Finally, there is very little data on the concentrations of bioelements in bone tissue compared to the indicators of metabolic disorders. Studies widely report the relationship between body mass indexes and bone mineral density22 but they rarely consider bone mineral composition.
Comparisons of element concentrations in bone and serum can provide valuable information on the relationship between these tissues in the human body. The wide variety of diagnostic methods for detecting metabolic disorders makes it difficult to compare test results and analyze the relationship between metabolic disorders and element concentrations. It is worth noting that bone is a compartment in which the dynamics of changes in element concentrations is slower than in other tissues of the body.
The aim of this study was to investigate the relationship between serum and bone concentrations of selected bioelements (Zn, Cu, Fe, Cr, Mg, and Se) and Pb and the VAI, LAP, and BMI.
Materials and Methods
Study Participants
The study comprised 151 men aged 60 to 75 years who were scheduled for hip replacement surgery due to osteoarthritis at the Department of Orthopaedics, Traumatology, and Musculoskeletal Oncology at the Pomeranian Medical University. Exclusion criteria were a history of cancer, alcohol abuse, liver or kidney failure, New York Heart Association (NYHA) class III or IV heart failure, and the use of neuroleptics, chemotherapeutic agents, immunosuppressive drugs, corticosteroids or antidepressants, and testosterone-treated patients. This study was performed according to the guidelines of the Bioethics Committee at the Pomeranian Medical University in Szczecin (KB-0012/159/12), which abides by the Helsinki Declaration on ethical principles for medical research involving human subjects. All the participants were informed about the purpose and course of the research, and all gave written, voluntary and informed consent for the study.
Collection of Test Material
All patients were operated on by the same experienced orthopedic surgeon via a standard anterolateral approach. After the longitudinal incision of the capsule, the hip was dislocated anteriorly. Capsular attachments and surrounding soft tissues were sharply removed. The osteotomy of the femoral neck allowed to collect femoral head with the proximal part of femoral neck for further examination. Approximately 1 cm3 of bone tissue from each patient during the hip replacement surgery was collected from surgical waste and immediately frozen in a freezer at −80°C. In the laboratory, the material was dried at 105°C for 3 weeks in a forced circulation air dryer (Binder GmbH, Germany) so that the water content could be determined (gravimetric method) before assays were performed, then the bone was separated into fractions and the material ground in a mortar. Tests on bone tissues were performed using spongy bone samples.
All venous blood samples were collected following overnight fasting and were stored at −80°C until processed. Determinations were performed by enzyme-linked immunosorbent assay (ELISA, DRG Medtek, Warsaw, Poland). The participants underwent anthropometric measurements: body mass (scale), body height (growth meter), and abdominal circumference (tape measure). Body mass index (BMI) was calculated.
Determination of Biochemical Parameters
Fasting plasma glucose (FPG), high-density cholesterol (HDL-Ch), and triacylglycerols (TAG) were determined in the serum using a spectrophotometric method employing ready-made reagent kits (Biolabo, Aqua-Med, Łódź, Poland). Lipid accumulation product (LAP) was calculated using the formula: LAP = [WC (cm) - 65] × TAG (mmol/L).23 Visceral adiposity index (VAI) was calculated according to the formula: VAI = WC (cm)/[39.68 + (1.88 × BMI)] × [(TAG/1.03) × (1.31/HDL-Ch)].14 Metabolic syndrome was evaluated using the 2009 IDF (International Diabetes Federation) classification. The criteria to be met to recognize metabolic syndrome included mandatory waist circumference greater than 94 cm in men, and two of the following: triglyceride (TG) levels greater than 150 mg/dL or treatment for hypertriglyceridemia, HDL levels<40 mg/dL or treatment for this lipid disorder, systolic blood pressure ≥130 mm Hg or diastolic blood pressure ≥85 mm Hg or treatment for hypertension, fasting plasma glucose levels greater than or equal to 100 mg/dL, or diagnosed type 2 diabetes.
Determination of Bioelements and Pb in Serum and Bone Tissue
The concentrations of Mg, Zn, Cu, Cr, Fe, and Pb in the serum and bone tissue were measured using inductively coupled plasma optical emission spectrometry (ICP-OES; polypropylene cyclonic spray chamber; Thermo Fisher Scientific, Waltham, MA, USA). ICP-OES is a well-established and powerful technique commonly used for the quantification of elements in liquid and solid samples.
All venous serum samples were collected following overnight fasting and were stored at −80°C until processed. Bone samples were dried to constant weight and 0.1 g was taken from each same to analysis. Serum samples were thawed to room temperature and 1 mL of each sample was collected. Both bone and serum were digested using a CEM MARS 5 microwave digestion system. Samples were transferred to polypropylene tubes, 4 mL of high-purity 65% HNO3 reagent (Suprapur, Merck, Darmstadt, Germany) and 1mL of non-stabilized 30% H2O2 solution (Suprapur, Merck, Darmstadt, Germany) were added. After completion of the pre-reaction time, the samples were placed in special Teflon vessels and heated in a microwave digestion system for 35 min at 180°C (15 min ramp up to 180°C, then at 180°C for 20 min). In a clean hood, samples were transferred to acid-washed 15-mL polypropylene sample tubes. Further fivefold (serum) and 20-fold and 50-fold (bone) dilutions were performed prior to ICP-OES measurement. The samples were then spiked with an internal standard to provide a final concentration of 0.5 mg/L Yttrium and 1 mL of 1% Triton (Triton X-100, Sigma) and diluted to a final volume of 10 mL with 0.075% nitric acid (Suprapur, Merck, Germany). Blank samples were prepared by adding concentrated nitric acid to the tubes without a sample and subsequently diluted in the same manner as described above. The calibration standards (ICP multi-element standard solution IV; Merck; Phosphorus ICP Standard, AccuStandard Inc., New Haven, CT, USA) and the reference materials (National Institute of Standards and Technology (NIST) SRM 8414 Bovine Muscle, NIST SRM 1486 Bone Meal, Gaithersburg, MD, USA) were prepared in the same manner as the patient samples and blanks. The analysis of the sample was performed only if the correlation linearity of the standard curve (R2) was above 0.998. The limits of detection (µg/L) were as follows: Zn 0.19, Cu 0.39, Fe 0.25, Pb 1.06, and Mg 0.01. Y recovery during analysis was between 89% and 100% for samples and between 93% and 97% for standards.
Analyses were performed in both radial and axial modes, depending on the element and matrix. Multiple wavelengths were generally monitored for each element to provide confirmation of quantitative results. Ongoing calibration check samples were analyzed at most after every tenth sample and consisted of a blank measurement to monitor carryover and mid-range calibration standards from both the low- and high-concentration calibration curves. The wavelengths (nm) were as follows: Zn 206.200, Cu 224.700, Fe 238.204, Pb 220.353, and Mg 280.270. Instrumental operating parameters for ICP OES, ICAP 7400, and Thermo are presented in Table 1.
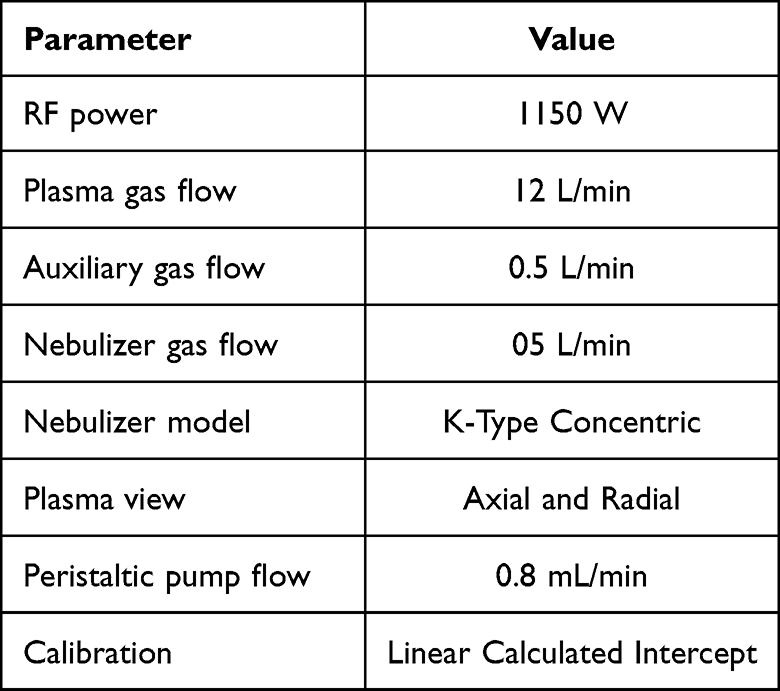 |
Table 1 Instrumental Operating Parameters for ICP OES, ICAP 7400, Thermo Scientific |
Analysis of Selenium Concentration in Bones
Selenium concentrations in bones were determined using the spectrofluorometric method. The samples (0.5–1.5 g) were digested in HNO3 at 230°C for 180 min and in HClO4 at 310°C for 20 min. Then samples were hydrolyzed with 9% HCl. Selenium was derivatized with 2,3-diaminonaphthalene (Sigma-Aldrich) under controlled pH (pH 1–2) with the formation of the selenodiazole complex. This complex was extracted into cyclohexane. EDTA and hydroxylamine hydrochloride were used as masking agents. Se concentration was determined fluorometrically using a Shimadzu RF-5001 PC spectrofluorophotometer. The excitation wavelength was 376 nm, and the fluorescence emission wavelength was 518 nm. The calibration curve was calculated using a series of standard solutions containing Se at concentrations from 0.001 to 1.200 µg/mL). The accuracy of the method was verified using certified reference material BCR-185R (bovine liver) (European Commission Joint Research Centre Institute for Reference Materials and Measurements). A recovery of 90% was obtained.24,25 The limit of detection was 0.3 µg/L.
Statistical Analysis
Statistical analyses were performed using Statistica (version 13.0, StatSoft Poland, Cracow, Poland). Quantitative variables were presented as median and quartile range. Data were checked for normality using the Shapiro–Wilk test. In the case of a normal distribution, means were compared using Student’s t-test; otherwise, the nonparametric Mann–Whitney U-test was used. The accuracy was measured using the area under the curve (AUC) with a 95% confidence interval (CI). To determine the specific cutoff point the score with the highest combination of sensitivity and specificity (Youden’s index) was considered optimal. Multivariate logistic regression analysis with age adjustment was performed. The significance level was set at p≤0.05.
In this study, the men were divided into groups according to cut-off points obtained in the ROC curve analysis. For BMI the cut-off point was 28.63 kg/m2, for VAI the cut-off point was 2.27, and for LAP the cut-off point was 67.09.
Results
Population Characteristics
A total of 151 men aged between 60 and 75 years (Me=66.0) participated in the study (Table 2). For the analyses with body mass index and body fat accumulation in the first step of the analysis, a ROC plot was used to distinguish the study groups (Table 3, Figure 1). In the analysis, the state variable was the presence of MetS. In the analysis, the cut-off point for BMI was 28.63 kg/m2 (p<0.007), for VAI 2.27 (p<0.001), and for LAP 67.09 (p<0.001).
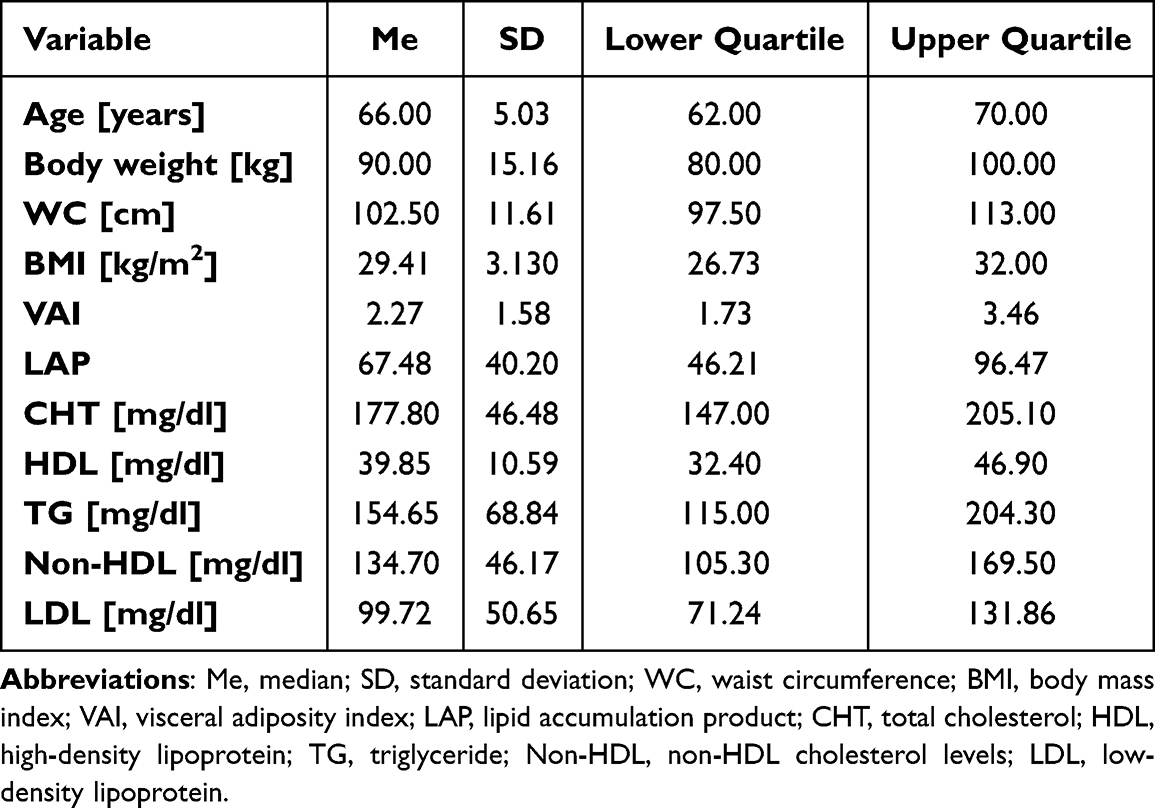 |
Table 2 Descriptive Characteristics of the Study Group (n=151) |
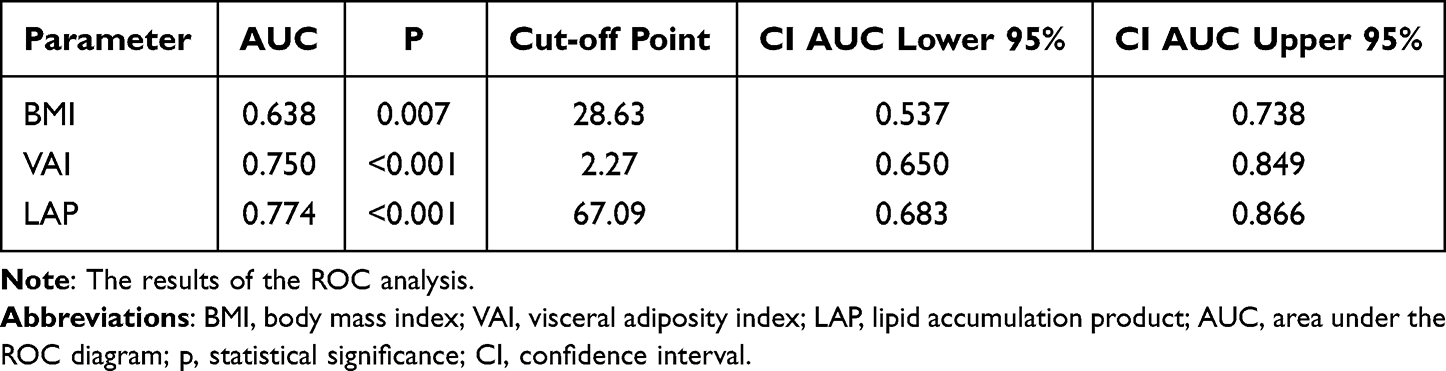 |
Table 3 ROC Curve Parameters |
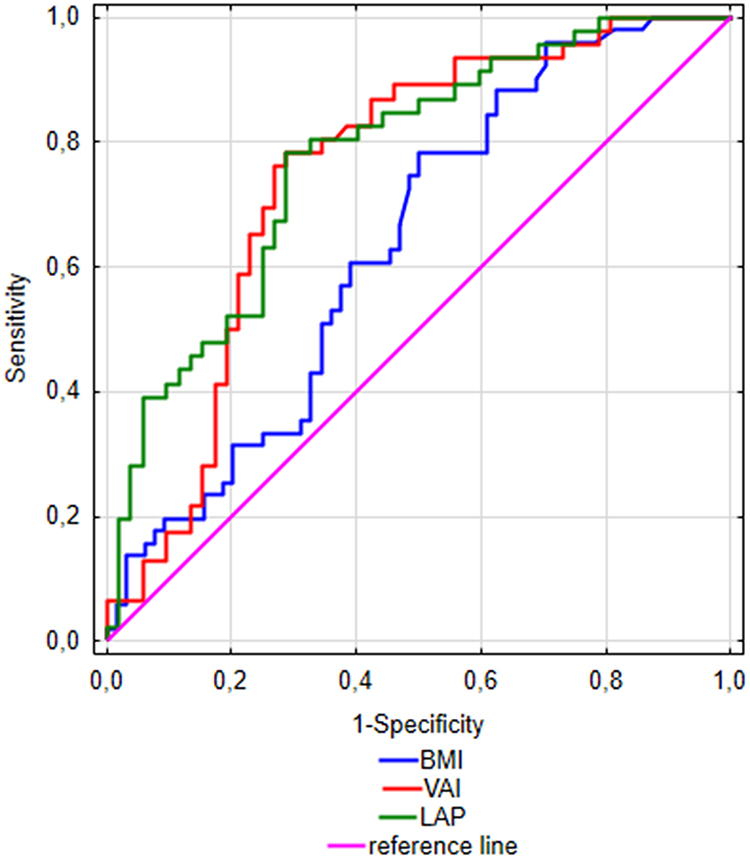 |
Figure 1 ROC plot against METS and fat accumulation indices. |
The Levels of Biometals and Pb vs BMI, VAI, and LAP
The bioelements and metal concentrations between the groups were compared to the indices of adipose tissue accumulation and function (Table 4). There was no relationship between serum and bone concentrations for the BMI index. The analysis of VAI showed that Mg concentration in bone tissue was significantly higher in men with higher values of VAI (p=0.050), but no relation was observed for the serum concentration. Similarly, when analyzing the relationship between bone tissue concentration and LAP index, it was shown that both Mg and Zn concentrations were higher in patients with higher LAP values (p=0.003 for Mg; p=0.012 for Zn), but it was not observed in the serum.
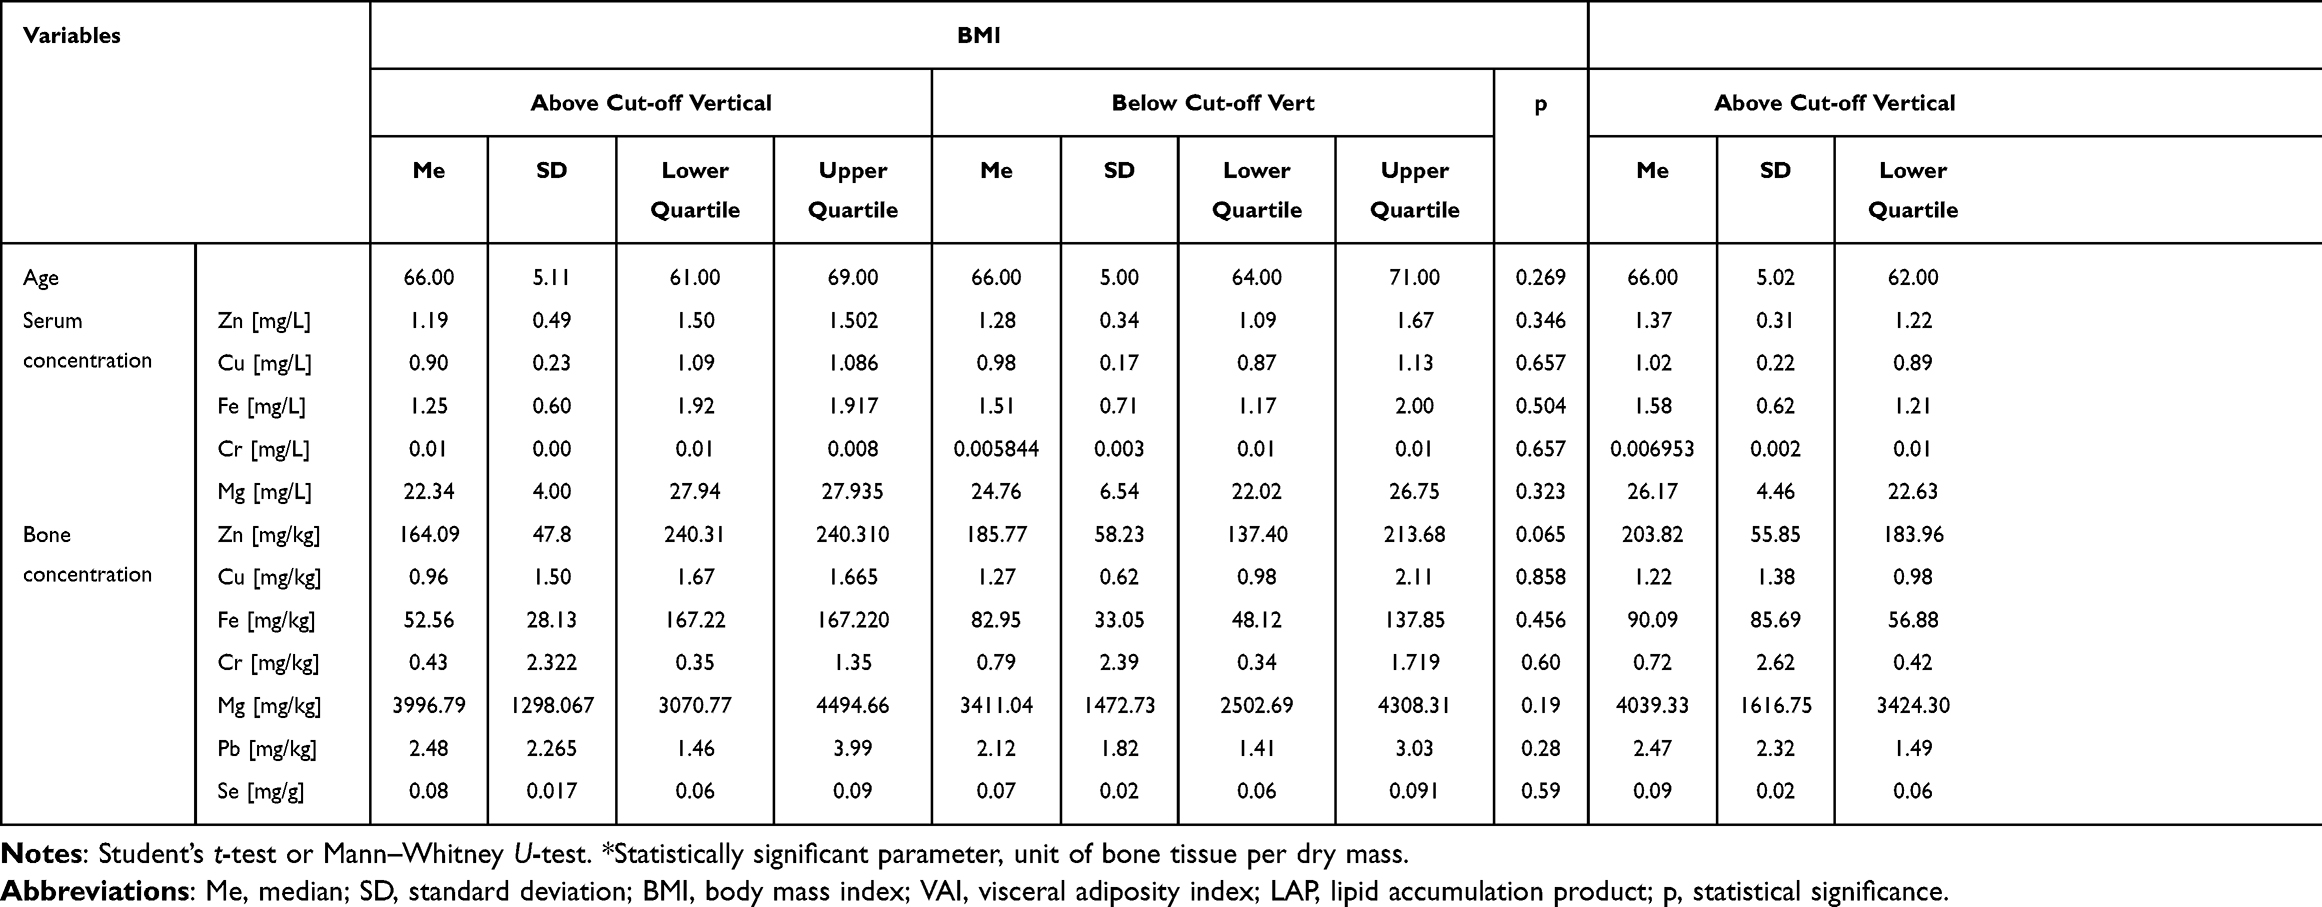 |
Table 4 Differences in the Concentrations of Bioelements and Pb Between Groups, n=151 |
Multiple Logistic Regression Analysis
Multiple logistic regression analysis with adjustment for age was performed (Table 5). There was a correlation between serum Zn concentration and cut-off point VAI (OR=4.774, p=0.024). The cut-off point LAP value was related to the bone tissue concentrations of Mg (p=0.031, OR=1.015), Zn (p=0.038, OR=1.010), and Cu (p=0.041, OR=2.311).
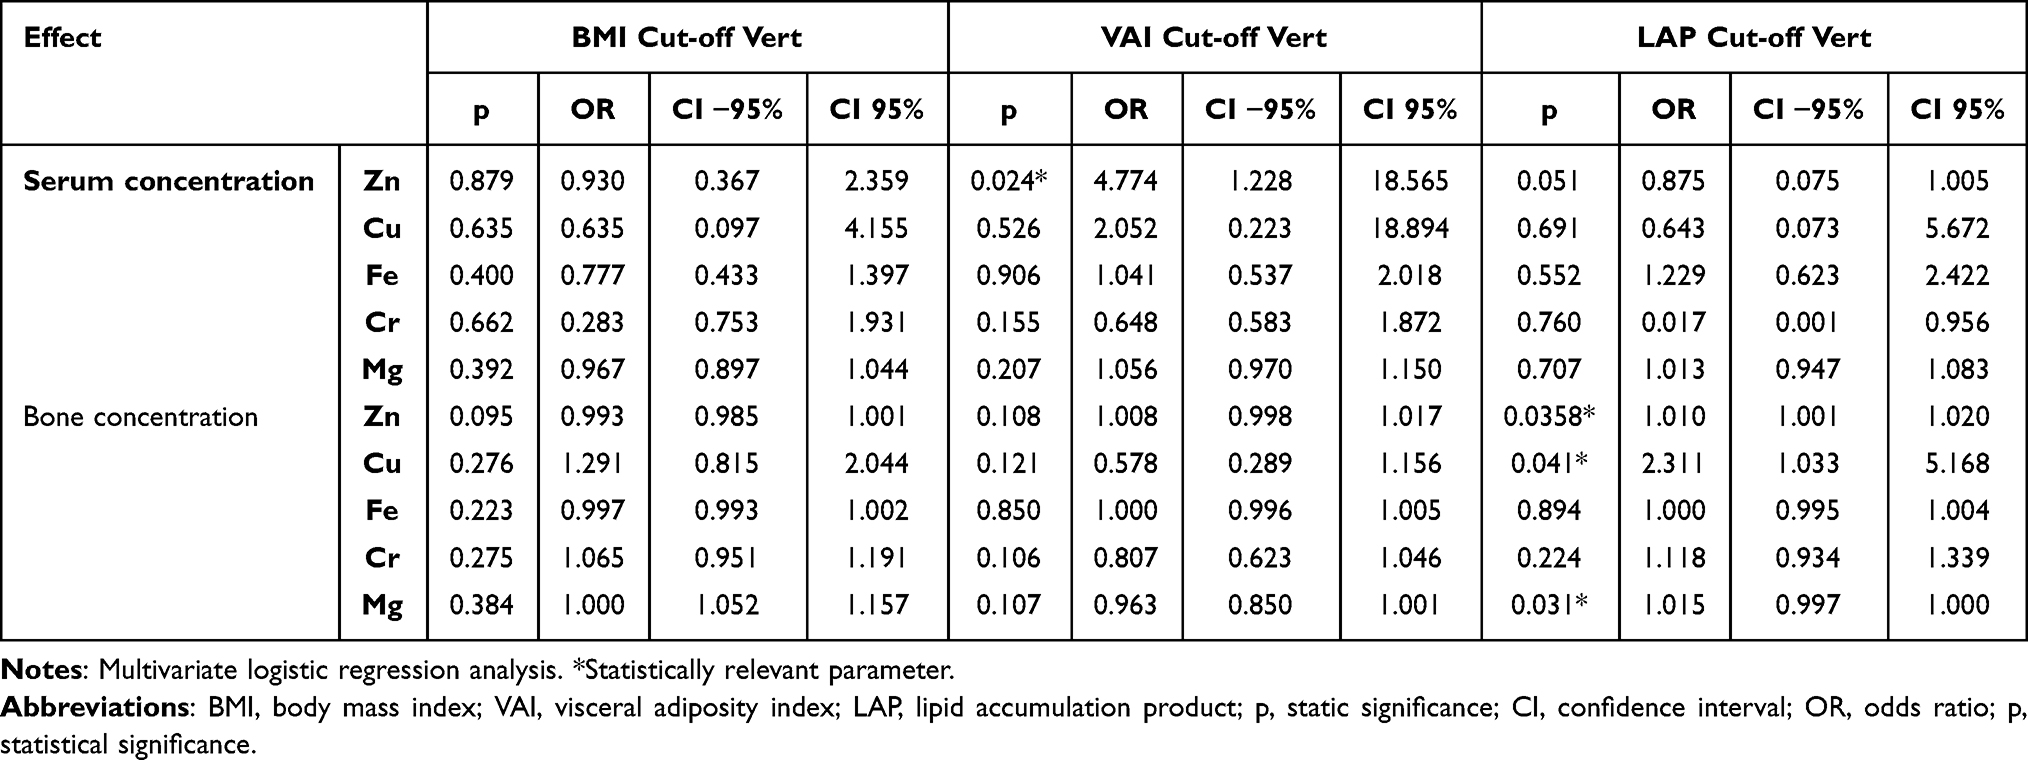 |
Table 5 Multiple Logistic Regression Analysis with Adjustment for Age (n=151) |
Discussion
Bone is a structure that is subject to continuous modification through resorption and accretion processes that are regulated by factors such as mechanical and hormonal stimuli and the concentration of elements in the bone tissue. Both deficiencies and excesses of trace element concentrations in bone tissue can be factors that affect metabolism and bone density.26 The relationship between body weight and bone mineral density is most commonly described as a positive correlation.27 However, the study of this relationship in relation to bone mineral composition and various indices describing visceral fat accumulation still remains to be clarified. The identification of simple and modifiable indices reflecting bone tissue quality and structure presents a major diagnostic challenge.
About 50% of accumulated Cu is found in the bone and muscle tissue.28 Cu participates in collagen synthesis in bones and connective tissue.29 In our study, LAP was related to Cu concentration in bone tissue but not in the serum of the men. It has previously been shown that there is a relationship between blood Cu concentration and the frequency of diagnosis of obesity.30 Copper-zinc superoxide dismutase protects cells from damage caused by superoxide ions. Cu concentration in blood is important to avoid oxidative damage and also reduce the risk of obesity.31 Cu deficiency has also been shown in severely obese men qualified for bariatric surgery.32 However, the relationship between Cu and bone fat accumulation remains unclear.
In a previous study, we showed that the Zn/Cu ratio in bone was positively associated with bone density and bone mineral content in the whole body.33 Bone in humans contains up to 30% of the Zn accumulated in the body. Zn deficiencies may cause delayed bone growth.34,35 In our study, we demonstrated that LAP may be a factor reflecting changes in Zn concentration in bone tissue. In the available literature, indices such as BMI are factors used as an adjustment for studies on the relationships between elemental concentrations and bone tissue quality. Dietary Zn intake and plasma Zn concentration have been shown to be positively correlated with BMD in men.36 A meta-analysis has shown that Zn supplementation can improve lipid metabolism and glucose homeostasis in patients with type 2 diabetes.37 In bone, Zn is an essential component for protein synthesis in the skeletal structure. Deficiencies of this element can lead to decreased collagen synthesis and turnover. In addition, adequately high Zn concentration has been shown to stimulate osteoblastic cells.38 The relationship between Zn concentration in bone and lipid concentration is poorly described and the biological mechanism of this relationship is unclear. It is worth emphasizing that studies in animal models show that dietary Zn deficiency can induce oxidative stress due to Fe accumulation and reduced antioxidant levels in bone tissue. In addition, Zn deficiency can stimulate the expression of osteoclastogenesis-related genes.39
Mg is the second most abundant intracellular cation in the human body. The main reservoir of this element is bone tissue.40 Many studies show a correlation between low Mg concentrations in food intake and the incidence of MetS, regardless of gender, age, physical activity, and other factors.41–43 It is worth noting that Mg2+ ions are natural antagonists of calcium ions - the main component of bone tissue. A metanalysis by Han et al44 showed that high dietary Ca2+ intake reduces the risk of MetS. Mg2+ and Ca2+ ions regulate the metabolic response in overweight patients, and disruption of this homeostasis maximizes the effect of their single deficiency.45 In our study, we showed that the LAP index can be a good indicator to describe the changes in the concentration of Mg in bone tissue. However, we did not observe this relationship in the serum. Most of the studies on Mg concentration concern its serum concentration in relation to the occurrence of osteoporosis in postmenopausal women. These studies report that women with osteoporosis show significantly lower serum Mg concentrations compared to control.46–48 Finally, a study by Hayhoe et al 2015 indicated a relationship between the risk of spinal fractures and Mg concentration in men.49
In our study, there was no correlation between serum and bone tissue Pb concentrations and parameters describing accumulation and metabolism in adipose tissue. It has previously been shown that environmental Pb exposure can be associated with an increase in obesity expressed as BMI.50
In our study, we found no relationship between LAP, VAI, and BMI and the levels of Cr, Se, and Fe in serum and bone. The available literature on the relationship between the concentration of these elements in bone tissue and metabolic parameters is scarce. Se is a trace element present in bone that affects its metabolism.51 It is essential for the synthesis of selenoproteins and is crucial for normal skeletal growth and development.52 Studies on the relationship between Fe and bone mineral composition have shown that Fe deficiency can cause a decrease in osteoclast activity, which may have a positive effect on improving bone density. The biological mechanism of this relationship depends on the action of lactoferrin, an iron-binding glycoprotein which inhibits osteoclastogenic differentiation of monocytes and improves bone density by reducing the receptor activator for nuclear factor κB ligand/osteoprotegerin ratio.53
Studying the concentration of bioelements and heavy metals in various tissues of the body is important in terms of finding modern solutions to contribute to the treatment of patients and to the improvement of metabolic functions. Examples supporting this thesis include the use of vanadium core-shell nanorods in the treatment of diabetic retinopathy54 or the rapid diagnosis of Coronary Heart Disease using Deep Stabilizer. These are advanced molecular tools for the metabolic characterization of diseases that may guide decisions for personalized medicine in the future.55
Our study also had some limitations. The study concerned correlations between the levels of bioelements and lead and indices describing the composition and distribution of adipose tissue. These relations may be but do not have to be causal, as our analysis did not include other parameters influencing the levels of bioelements and heavy metals, such as smoking and patients’ lifestyles. Another limitation was the selection of patients for the study; all subjects were diagnosed with hip osteoarthritis so caution should be exercised in generalizing the results to other populations.
Conclusions
In our study, we showed that the relationships between the concentration of selected bioelements and heavy metals in serum and bone and the values of VAI, LAP, and BMI differed depending on the analyzed tissue. VAI positively correlated with the bone Mg, while LAP positively correlated with bone Cu, Zn, and Mg.
The concentrations of bioelements and heavy metals in bone tissue reflect the long-term dynamics of changes in elemental concentrations in this tissue, which may also be affected by metabolic disorders associated with increased body weight. Searching for simple and easy-to-diagnose indicators of the influence of metabolic disorders on the structure and function of bone tissue is an important factor from the point of view of public health and the effectiveness of bone tissue disease prevention.
The study shows that LAP may be a good predictor of changes in the concentration of elements in bone tissue in men. This metabolic index is easy to determine on the basis of basic blood tests and therefore it deserves attention as the most reliable of the analyzed indices.
Institutional Review Board Statement
The study was conducted according to the guidelines of the Declaration of Helsinki. The research protocol was approved by the Bioethical Committee of the Pomeranian Medical University in Szczecin (approval no. KB-0012/155/16).
Informed Consent Statement
Informed consent was obtained from all subjects involved in the study.
Funding
This research project was supported by the MINIATURA 2 grant funded by the National Science Centre of Poland (grant no. 2018/02/X/NZ4/00128) and the statutory research grant from the Pomeranian Medical University in Szczecin, Poland.
Disclosure
The authors declare no conflicts of interest.
References
1. Rayssiguier Y, Libako P, Nowacki W, Rock E. Magnesium deficiency and metabolic syndrome: stress and inflammation may reflect calcium activation. Magnes Res. 2010;23(2):73–80. doi:10.1684/mrh.2010.0208
2. Fernández-Cao JC, Warthon-Medina M, Moran VH, et al. Zinc intake and status and risk of type 2 diabetes mellitus: a systematic review and meta-analysis. Nutrients. 2019;11(5):1027.
3. Qu R, Jia Y, Liu J, Jin S, Han T, Na L. Dietary flavonoids, copper intake, and risk of metabolic syndrome in Chinese adults. Nutrients. 2018;10(8):991. doi:10.3390/nu10080991
4. Filippini T, Michalke B, Malagoli C, et al. Determinants of serum cadmium levels in a Northern Italy community: a cross-sectional study. Environ Res. 2016;150:219–226. doi:10.1016/j.envres.2016.06.002
5. Shao W, Liu Q, He X, Liu H, Gu A, Jiang Z. Association between level of urinary trace heavy metals and obesity among children aged 6–19 years: NHANES 1999–2011. Environ Sci Pollut Res Int. 2017;24(12):11573–11581. doi:10.1007/s11356-017-8803-1
6. Padilla MA, Elobeid M, Ruden DM, Allison DB. An examination of the association of selected toxic metals with total and central obesity indices: NHANES 99-02. Int J Environ Res Public Health. 2010;7(9):3332–3347. doi:10.3390/ijerph7093332
7. Leff T, Stemmer P, Tyrrell J, Jog R Diabetes and exposure to environmental lead (Pb). Toxics. 2018;6(3). Available from: https://pubmed.ncbi.nlm.nih.gov/30200608/. Accessed November 30, 2022.
8. Tsaih SW, Korrick S, Schwartz J, et al. Lead, diabetes, hypertension, and renal function: the normative aging study. Environ Health Perspect. 2004;112(11):1178–1182. doi:10.1289/ehp.7024
9. Guerrero-Romero F, Jaquez-Chairez FO, Rodríguez-Morán M. Magnesium in metabolic syndrome: a review based on randomized, double-blind clinical trials. Magnes Res. 2016;29(4):146–153. doi:10.1684/mrh.2016.0404
10. He K, Song Y, Belin RJ, Chen Y. Magnesium intake and the metabolic syndrome: epidemiologic evidence to date. J Cardiometab Syndr. 2006;1(5):351–355. doi:10.1111/j.1559-4564.2006.05702.x
11. Lu CW, Lee YC, Kuo CS, Chiang CH, Chang HH, Huang KC. Association of serum levels of zinc, copper, and iron with risk of metabolic syndrome. Nutrients. 2021;13(2):548.
12. Agrawal H, Aggarwal K, Jain A. Visceral adiposity index: simple tool for assessing cardiometabolic risk in women with polycystic ovary syndrome. Indian J Endocrinol Metab. 2019;23(2):232. doi:10.4103/ijem.IJEM_559_18
13. Lee I, Cooney LG, Saini S, et al. Increased risk of disordered eating in polycystic ovary syndrome. Fertil Steril. 2017;107(3):796–802. doi:10.1016/j.fertnstert.2016.12.014
14. Amato MC, Giordano C, Galia M, et al. Visceral adiposity index: a reliable indicator of visceral fat function associated with cardiometabolic risk. Diabetes Care. 2010;33(4):920–922. doi:10.2337/dc09-1825
15. Mendes SL. Produto de Acumulação Lipídica: Acurácia Para Identificação de Portadores da Síndrome Metabólica Em Adultos. Universidade Federal de Minas Gerais; 2016.
16. Taverna MJ, Martínez-Larrad MT, Frechtel GD, Serrano-Ríos M. Lipid accumulation product: a powerful marker of metabolic syndrome in healthy population. Eur J Endocrinol. 2011;164(4):559–567. doi:10.1530/EJE-10-1039
17. Kosaka K, Yamashita S, Ando C, Endo Y, Taniguchi K, Kikunaga S. Relationships among body mass index, activities of daily living and zinc nutritional status in disabled elderly patients in nursing facilities. J Nutr Sci Vitaminol. 2013;59(5):420–430. PMID: 24418876. doi:10.3177/jnsv.59.420
18. Huang X, Jiang D, Zhu Y, et al. Chronic high dose zinc supplementation induces visceral adipose tissue hypertrophy without altering body weight in mice. Nutrients. 2017;9(10):1138. PMID: 29057818; PMCID: PMC5691754. doi:10.3390/nu9101138
19. Kao YC, Ho PC, Tu YK, Jou IM, Tsai KJ. Lipids and Alzheimer’s disease. Int J Mol Sci. 2020;21(4). doi:10.3390/ijms21041505
20. Yang H, Liu CN, Wolf RM, et al. Obesity is associated with copper elevation in serum and tissues. Metallomics. 2019;11(8):1363–1371. doi:10.1039/C9MT00148D
21. Rotter I, Kosik-Bogacka D, Dołęgowska B, Safranow K, Lubkowska A, Laszczyńska M. Relationship between the concentrations of heavy metals and bioelements in aging men with metabolic syndrome. Int J Environ Res Public Health. 2015;12(4):3944–3961. PMID: 25867198; PMCID: PMC4410226. doi:10.3390/ijerph120403944
22. Bierhals IO, Dos Santos Vaz J, Bielemann RM, et al. Associations between body mass index, body composition and bone density in young adults: findings from a southern Brazilian cohort. BMC Musculoskelet Disord. 2019;20(1):322. PMID: 31288773; PMCID: PMC6617655. doi:10.1186/s12891-019-2656-3
23. Kahn HS. The “lipid accumulation product” performs better than the body mass index for recognizing cardiovascular risk: a population-based comparison. BMC Cardiovasc Disord. 2005;8(5):1.
24. Pilarczyk B, Pilarczyk R, Tomza-Marciniak A, Hendzel D, Bakowska M, Stankiewicz T. Evaluation of selenium status and its distribution in organs of free living foxes (Vulpes vulpes) from an Se deficient area. Pol J Vet Sci. 2011;14(3):453–457. doi:10.2478/v10181-011-0067-y
25. Pilarczyk B, Tomza-Marciniak A, Mituniewicz-Małek A, et al. Selenium content in selected products of animal origin and estimation of the degree of cover daily Se requirement in Poland. Int J Food Sci Technol. 2010;45(1):186–191. doi:10.1111/j.1365-2621.2009.02120.x
26. Wang L, Yu H, Yang G, et al. Correlation between bone mineral density and serum trace element contents of elderly males in Beijing urban area. Int J Clin Exp Med. 2015;8(10):19250.
27. Rexhepi S, Bahtiri E, Rexhepi M, SahatciuMeka V, Rexhepi B. Association of body weight and body mass index with bone mineral density in women and men from Kosovo. Mater Sociomed. 2015;27(4):259. doi:10.5455/msm.2015.27.259-262
28. Gibson RS. Nutritional assessment systems. Princ Nutr Assess. 2005;2005:2–7.
29. Angelova M, Asenova S, Nedkova V, Koleva-Kolarova R. Mini-review copper in the human organism. Trakia J Sci. 2011;9(1):88–98.
30. Gu K, Li X, Xiang W, Jiang X. The relationship between serum copper and overweight/obesity: a meta-analysis. Biol Trace Elem Res. 2020;194(2):336–347. doi:10.1007/s12011-019-01803-6
31. Habib SA, Saad EA, Elsharkawy AA, Attia ZR. Pro-inflammatory adipocytokines, oxidative stress, insulin, Zn and Cu: interrelations with obesity in Egyptian non-diabetic obese children and adolescents. Adv Med Sci. 2015;60(2):179–185. doi:10.1016/j.advms.2015.02.002
32. Boullata J, Muthukumaran G, Piarulli A, Labarre J, Compher C. Oral copper absorption in men with morbid obesity. J Trace Elem Med Biol. 2017;44:146–150. doi:10.1016/j.jtemb.2017.07.005
33. Rył A, Miazgowski T, Szylińska A, et al. Bone health in aging men: does zinc and cuprum level matter? Biomolecules. 2021;11(2):1–12. doi:10.3390/biom11020237
34. Kambe T, Tsuji T, Hashimoto A, Itsumura N. The physiological, biochemical, and molecular roles of zinc transporters in zinc homeostasis and metabolism. Physiol Rev. 2015;95(3):749–784. doi:10.1152/physrev.00035.2014
35. Yamaguchi M. Role of nutritional zinc in the prevention of osteoporosis. Mol Cell Biochem. 2009;338(1):241–254. doi:10.1007/s11010-009-0358-0
36. Hyun TH, Barrett-Connor E, Milne DB. Zinc intakes and plasma concentrations in men with osteoporosis: the Rancho Bernardo Study. Am J Clin Nutr. 2004;80(3):715–721. doi:10.1093/ajcn/80.3.715
37. Jafarnejad S, Mahboobi S, McFarland LV, Taghizadeh M, Rahimi F. Meta-analysis: effects of zinc supplementation alone or with multi-nutrients, on glucose control and lipid levels in patients with type 2 diabetes. Prev Nutr Food Sci. 2019;24(1):8. doi:10.3746/pnf.2019.24.1.8
38. Amin N, Clark CCT, Taghizadeh M, Djafarnejad S. Zinc supplements and bone health: the role of the RANKL-RANK axis as a therapeutic target. J Trace Elem Med Biol. 2020;57:126417. doi:10.1016/j.jtemb.2019.126417
39. Suzuki T, Katsumata SI, Matsuzaki H, Suzuki K. Dietary zinc deficiency induces oxidative stress and promotes tumor necrosis factor-α- and interleukin-1β-induced RANKL expression in rat bone. J Clin Biochem Nutr. 2016;58(2):122–129. doi:10.3164/jcbn.15-87
40. Agostoni C, Berni Canani R, Fairweather-Tait S, et al. Scientific opinion on dietary reference values for magnesium. EFSA J. 2015;13(7):4186.
41. Mirmiran P, Shab-Bidar S, Hosseini-Esfahani F, Asghari G, Hosseinpour-Niazi S, Azizi F. Magnesium intake and prevalence of metabolic syndrome in adults: Tehran lipid and glucose study. Public Health Nutr. 2012;15(4):693–701. doi:10.1017/S1368980011002941
42. Choi MK, Bae YJ. Relationship between dietary magnesium, manganese, and copper and metabolic syndrome risk in Korean adults: the Korea national health and nutrition examination survey (2007–2008). Biol Trace Elem Res. 2013;156(1–3):56–66. doi:10.1007/s12011-013-9852-z
43. Dibaba DT, Xun P, Fly AD, Yokota K, He K. Dietary magnesium intake and risk of metabolic syndrome: a meta-analysis. Diabet Med. 2014;31(11):1301–1309. doi:10.1111/dme.12537
44. Han D, Fang X, Su D, et al. Dietary calcium intake and the risk of metabolic syndrome: a systematic review and meta-analysis. Sci Rep. 2019;9(1):1–7. doi:10.1038/s41598-019-55507-x
45. Dai Q, Shu XO, Deng X, et al. Modifying effect of calcium/magnesium intake ratio and mortality: a population based cohort study. BMJ Open. 2013;3(2):e002111. doi:10.1136/bmjopen-2012-002111
46. Mederle OA, Balas M, Ioanoviciu SD, Gurban CV, Tudor A, Borza C. Correlations between bone turnover markers, serum magnesium and bone mass density in postmenopausal osteoporosis. Clin Interv Aging. 2018;13:1383. doi:10.2147/CIA.S170111
47. Okyay E, Ertugrul C, Acar B, Sisman AR, Onvural B, Ozaksoy D. Comparative evaluation of serum levels of main minerals and postmenopausal osteoporosis. Maturitas. 2013;76(4):320–325. doi:10.1016/j.maturitas.2013.07.015
48. Sharma R, Sharma P, Kumar P, Gupta G. Role of magnesium in postmenopausal women with osteoporosis and osteopenia. Asian J Pharm Clin Res. 2016;9:198–199.
49. Hayhoe RPG, Lentjes MAH, Luben RN, Khaw KT, Welch AA. Dietary magnesium and potassium intakes and circulating magnesium are associated with heel bone ultrasound attenuation and osteoporotic fracture risk in the EPIC-Norfolk cohort study. Am J Clin Nutr. 2015;102(2):376–384. doi:10.3945/ajcn.114.102723
50. Hernández-Mendoza H, Rios-Lugo MJ, Álvarez-Loredo HE, et al. Serum lead levels and its association with overweight and obesity. J Trace Elem Med Biol. 2022;72:126984. doi:10.1016/j.jtemb.2022.126984
51. Gaffney-Stomberg E. The impact of trace minerals on bone metabolism. Biol Trace Elem Res. 2019;188(1):26–34. doi:10.1007/s12011-018-1583-8
52. Yang T, Lee SY, Park KC, Park SH, Chung J, Lee S. The effects of selenium on bone health: from element to therapeutics. Molecules. 2022;27(2):392. doi:10.3390/molecules27020392
53. Hou JM, Xue Y, Lin QM. Bovine lactoferrin improves bone mass and microstructure in ovariectomized rats via OPG/RANKL/RANK pathway. Acta Pharmacol Sin. 2012;33(10):1277–1284. doi:10.1038/aps.2012.83
54. Vedarethinam V, Huang L, Zhang M, et al. Vanadium core–shell nanorods inspect metabolic changes of diabetic retinopathy. Adv Funct Mater. 2020;30(35):2002791. doi:10.1002/adfm.202002791
55. Zhang M, Huang L, Yang J, et al. Ultra-fast label-free serum metabolic diagnosis of coronary heart disease via a deep stabilizer. Adv Sci. 2021;8(18):2101333. doi:10.1002/advs.202101333
 © 2022 The Author(s). This work is published and licensed by Dove Medical Press Limited. The
full terms of this license are available at https://www.dovepress.com/terms
and incorporate the Creative Commons Attribution
- Non Commercial (unported, 3.0) License.
By accessing the work you hereby accept the Terms. Non-commercial uses of the work are permitted
without any further permission from Dove Medical Press Limited, provided the work is properly
attributed. For permission for commercial use of this work, please see paragraphs 4.2 and 5 of our Terms.
© 2022 The Author(s). This work is published and licensed by Dove Medical Press Limited. The
full terms of this license are available at https://www.dovepress.com/terms
and incorporate the Creative Commons Attribution
- Non Commercial (unported, 3.0) License.
By accessing the work you hereby accept the Terms. Non-commercial uses of the work are permitted
without any further permission from Dove Medical Press Limited, provided the work is properly
attributed. For permission for commercial use of this work, please see paragraphs 4.2 and 5 of our Terms.