")
Back to Journals » International Journal of General Medicine » Volume 14
Relationship of Noninvasive Assessment of Arterial Stiffness with 10-Year Atherosclerotic Cardiovascular Disease (ASCVD) Risk in a General Middle-Age and Elderly Population
Authors Wang H , Wu X, Gu Y, Zhou J, Wu J
Received 28 July 2021
Accepted for publication 16 September 2021
Published 5 October 2021 Volume 2021:14 Pages 6379—6387
DOI https://doi.org/10.2147/IJGM.S330142
Checked for plagiarism Yes
Review by Single anonymous peer review
Peer reviewer comments 2
Editor who approved publication: Dr Scott Fraser
Hao Wang, 1,* Xubo Wu, 2,* Yefan Gu, 1 Jie Zhou, 1 Jing Wu 1, 2
1School of Nursing, Shanghai University of Traditional Chinese Medicine, Shanghai, People’s Republic of China; 2Department of Rehabilitation, Shanghai Seventh People’s Hospital, Shanghai University of Traditional Chinese Medicine, Shanghai, People’s Republic of China
*These authors contributed equally to this work
Correspondence: Jing Wu
School of Nursing, Shanghai University of Traditional Chinese Medicine, 1200 Cai Lun Road, Shanghai, 201203, People’s Republic of China
Tel/Fax +86-21-51322233
Email [email protected]
Purpose: As a powerful indicator of arterial stiffening, the brachial-ankle pulse wave velocity (baPWV) has been extensively validated for predicting cardiovascular events. However, whether and how the brachial-ankle pulse wave velocity (baPWV) is correlated with the 10-year atherosclerotic cardiovascular disease (ASCVD) risk is unclear. This study aimed to investigate the association between baPWV and 10-year ASCVD risk in Chinese population.
Methods: A total of 1768 subjects were enrolled from Shanghai, China. They were divided into two groups according to the Pooled Cohorts Equations model made by ACC/AHA as follows: low ASCVD risk (n = 992, 10-year ASCVD risk < 7.5%) and high ASCVD risk (n = 776, 10-year ASCVD risk ≥ 7.5%). The baseline characteristics were obtained via the use of a questionnaire. Measurement of baPWV, laboratory tests, and echocardiography were conducted by trained physicians. The relationship between baPWV and 10-year ASCVD risk was evaluated using multiple logistic regression model and generalized additive model.
Results: The mean age of the subjects was 58.89± 8.60 years, 32.69% of which were male. Non-linear relationship analysis revealed threshold effects between baPWV and 10-year ASCVD risk in which a baPWV of approximately 16 m/s might be the threshold effect of 10-year ASCVD risk. After multivariable adjustment, logistic-regression analysis demonstrated that ankle-brachial index (ABI) (OR 5.28, 95% CI 1.20– 12.23) and baPWV (OR 9.09, 95% CI 6.84– 12.07) were independently correlated with 10-year ASCVD risk. The AUC for baPWV for predicting 10-year ASCVD risk was 0.80 (95% CI 0.78– 0.82).
Conclusion: Increased baPWV as an indicator of arterial stiffness correlates strongly with 10-year ASCVD risk in general middle-aged and elderly populations. The association between baPWV and 10-year ASCVD risk is not purely linear but non-linear. Subjects with baPWV above 16 m/s are more likely to encounter a higher 10-year ASCVD risk.
Keywords: arterial stiffness, atherosclerotic cardiovascular disease, brachial-ankle pulse wave velocity, non-linear, cross-sectional study
Introduction
Atherosclerotic cardiovascular disease (ASCVD) is considered the leading cause of mortality worldwide, which mainly involves ischemic heart disease and ischemic stroke.1 The prevalence of ASCVD increases with age in both men and women.2 In China, almost 50% of elderly adults have at least one type of ASCVD.3 Established ASCVD risk factors include hyperlipidemia, hypertension, diabetes mellitus and smoking, which are potentially modifiable by lifestyle changes or medication therapy.1 Due to the multifactorial etiology of ASCVD, the primary prevention of ASCVD emphasized the importance of risk assessment as a first step to improve health outcomes.4 The Pooled Cohort equation was recommended by the 2013 American College of Cardiology/American Heart Association (ACC/AHA) Cardiovascular Risk Guideline.4 This equation is one of the most widely used ASCVD risk assessment tools and has also been validated in Chinese population.5,6 However, the vast majority of existing data in China were related to Coronary Heart Disease. The current reported ASCVD risks or events are generally derived from the context of hospital. Therefore, the community-based 10-year risk data for ASCVD are lacking.
Arterial stiffening is one of the earliest functional changes in the vascular aging process underlying ASCVD and reflects a variety of pathologies, including atherosclerosis, arteriosclerosis and inflammation.7 As an important determinant of cardiovascular health, arterial stiffness can contribute to increased blood pressure and results in a reduced capacity of vessels to buffer the pulsatile flow when the heart contracts,8 which are significant risk factors for predicting ASCVD.9 Several indicators are used to visualize arterial stiffness, such as pulse wave velocity (PWV), augmentation index, and beta stiffness index.10 Importantly, brachial-ankle pulse wave velocity (baPWV) is a noninvasive indicator of arterial stiffness, and thus can be widely used in population-based practice because of its simplicity and ease of operation.11 Even though the increased baPWV was closely related to adverse prognosis in patients with ASCVD, links between baPWV and ASCVD risk among general middle-aged and elderly population are still unclear. Uncertainty remained regarding the additional contribution of baPWV to estimate 10-year risk of ASCVD. Moreover, few studies have investigated the association between baPWV and 10-year ASCVD risk, which contain deeper relationships, such as non-linear relationships, and whether a special population exists among different subgroups. Therefore, this study aimed to further explore and analyze the association between baPWV and 10-year ASCVD risk using a general middle-aged and elderly population.
Methods
Study Population
A total of 1768 participants free of prevalent ASCVD participated in this community-based, cross-sectional study within a general middle-aged and elderly population in the Zhangjiang community in Shanghai, China. All subjects have provided written informed consent forms. Each participant received a physical examination and a structured interview. The basic characteristics were collected via a questionnaire. Body mass index (BMI), central blood pressure (CBP), diastolic blood pressure (DBP) and systolic blood pressure (SBP) were obtained by physical examination. Specifically, CBP was recorded noninvasively using an automated tonometric method (HEM-9000AI; Omron Healthcare Co. Ltd.), which recorded the reasonable value of CBP from radial pressure waveforms. Patients with either DBP ≥ 90 mmHg, SBP ≥ 140 mmHg, or use of antihypertensive drugs were regarded as hypertensive. Patients with fasting blood sugar levels ≥7.0 mmol l –1 or diagnosis of diabetes were considered as diabetic. Patients with total cholesterol (TC) ≥5.7 mmol l −1 or low-density lipoprotein cholesterol (LDL-C) >3.6 mmol l –1 were classified as dyslipidemia.12 Exclusion criteria were as follows: patients with a history of encompassing acute coronary syndrome (ACS), myocardial infarction (MI), coronary heart disease (CHD), cerebrovascular diseases or other arterial revascularization.13 Finally, 1768 participants (58.89±8.60 years; 32.69% male) remained eligible for our study.
Echocardiography
Two-dimensional echocardiography was performed using a color Doppler ultrasonic apparatus equipped with a 1.0–5.0 MHz transducer (GE Vivid 7; General Motors Corporation, New York, NY, USA). Measurements recorded included: left ventricular ejection fraction (LVEF), left atrium diameter (LAD), left ventricular internal diameter at end-diastole (LVIDd), interventricular sepal thickness (IVST) and posterior left ventricular wall thickness (PVWT).
Noninvasive Assessment of Arterial Stiffness
BaPWV and ABI were measured using a volume-plethysmographic device (PWV/ABI, Omron Corp., Tokyo, Japan). Participants were examined in a supine position after resting in a silent environment for 5 minutes or longer. Waveforms of the brachial and posterior tibial arteries were simultaneously recorded via an automated oscillometric method. Electrocardiographic electrodes were placed on both wrists, and cuffs were wrapped around the bilateral brachial and ankles of the participants. The mean value of left and right baPWV was adopted if there was a difference between the individual values. The ABI values of both legs were the maximum systolic blood pressure of left and right ankles divided by the higher systolic blood pressure of both arms.
Laboratory Measurements
Laboratory tests were immediately performed on fasted patient serum. High-density lipoprotein cholesterol (HDL-C), low-density lipoprotein cholesterol (LDL-C), total cholesterol (TC) and fasting blood sugar (FBS) were assessed using standard enzyme methods. B-type natriuretic peptide (BNP) was assayed via electrochemiluminescence immunoassay (ECLIA Roche Diagnostics, GMBH Mannheim, Germany). Homocysteine (HCY) was analyzed by fluorescence polarization immunoassay (Abbott IMx System, Chicago, Illinois, USA). In accordance with the guidelines, 100 pg/mL was regarded as the cutoff point of BNP.14 Glycated hemoglobin (HbA1c) was determined via ion-exchange high-performance liquid chromatography from Roche Corporation (Basel, Switzerland).
Assessment of ASCVD Risk
10-year ASCVD risk was evaluated using the Pooled Cohorts Equations model from the 2013 American College of Cardiology/American Heart Association (ACC/AHA) guidelines.4 This model predicts the risk of a first-time hard ASCVD event based on demographics, blood cholesterol and blood pressure, and elements of medical history such as smoking and diabetes. In our study, a 7.5% cut-off was used in evaluating diagnostic performance.
Statistical Analysis
All statistical analyses were conducted using SPSS 22.0 statistical software (Chicago, IL, USA) and R (R Foundation for Statistical Computing, Vienna, Austria). Categorical variables were presented as a number (percentage) and compared using the χ2 test. Continuous variables were reported as mean±SD. Data on skewed distribution for baPWV, high sensitivity C-reactive protein (hsCRP), B-type natriuretic peptide (BNP), HCY and left ventricular mass index (LVMI) were described as median (inter-quartile range) and performed using Mann–Whitney U-test. We compared the high risk of ASCVD (10-year risk ≥7.5%) with the low risk (10-year risk <7.5%) via a 2-tailed unpaired t-test. We used generalized additive model (GAM) to identify the non-linear relationship. We use smooth curve fitting to examine whether the independent variable is partitioned into intervals. We apply piece-wise regression that uses a separate line segment to fit each interval. Log-likelihood ratio test comparing one-line (non-segmented) model to segmented regression model was used to determine whether a threshold exists. Multiple logistic regression analysis was performed to identify whether baPWV or other parameters were associated with 10-year ASCVD risk. The receiver operating characteristic (ROC) curve was analyzed to calculate the diagnostic accuracy of predictors. Compared with any single variable, the resulting Area Under Curve (AUC) for predicted combined variables was tested via logistic regression analysis. P<0.05 was considered statistically significant.
Results
Baseline Characteristics
The baseline characteristics of 1768 subjects are shown in Table 1. According to the Pooled Cohorts Equations model made by ACC/AHA,4 10-year ASCVD risk was divided into two groups, with 7.5% as the cut-off value. The mean age of the subjects was 58.89±8.60 years, and 32.69% of which were male. 33.94% of the subjects had hypertension, and 21.55% of the subjects had a history of smoking. Laboratory tests and echocardiography parameters of the two groups are shown in Table 2. The average BMI of subjects was 24.03±3.29 kg/m2, and the level of baPWV was markedly higher in the group with a high risk of ASCVD [13.96 (12.71,15.42) vs 17.07 (15.02,19.55), P=0.00].
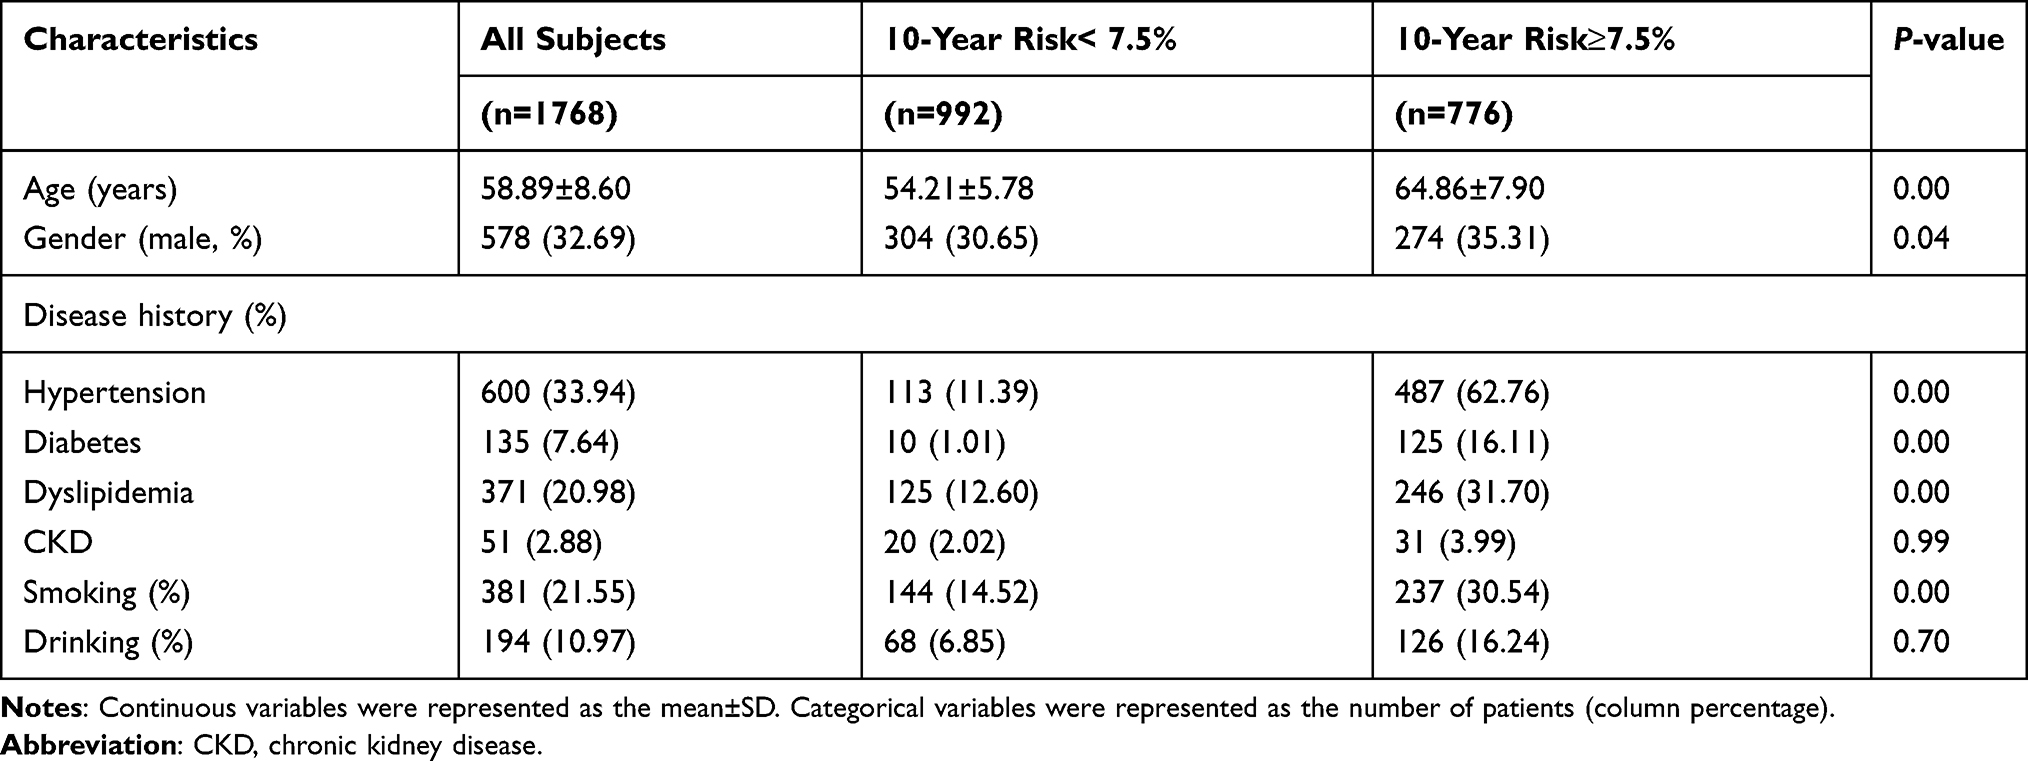 |
Table 1 Baseline Characteristics of Subjects |
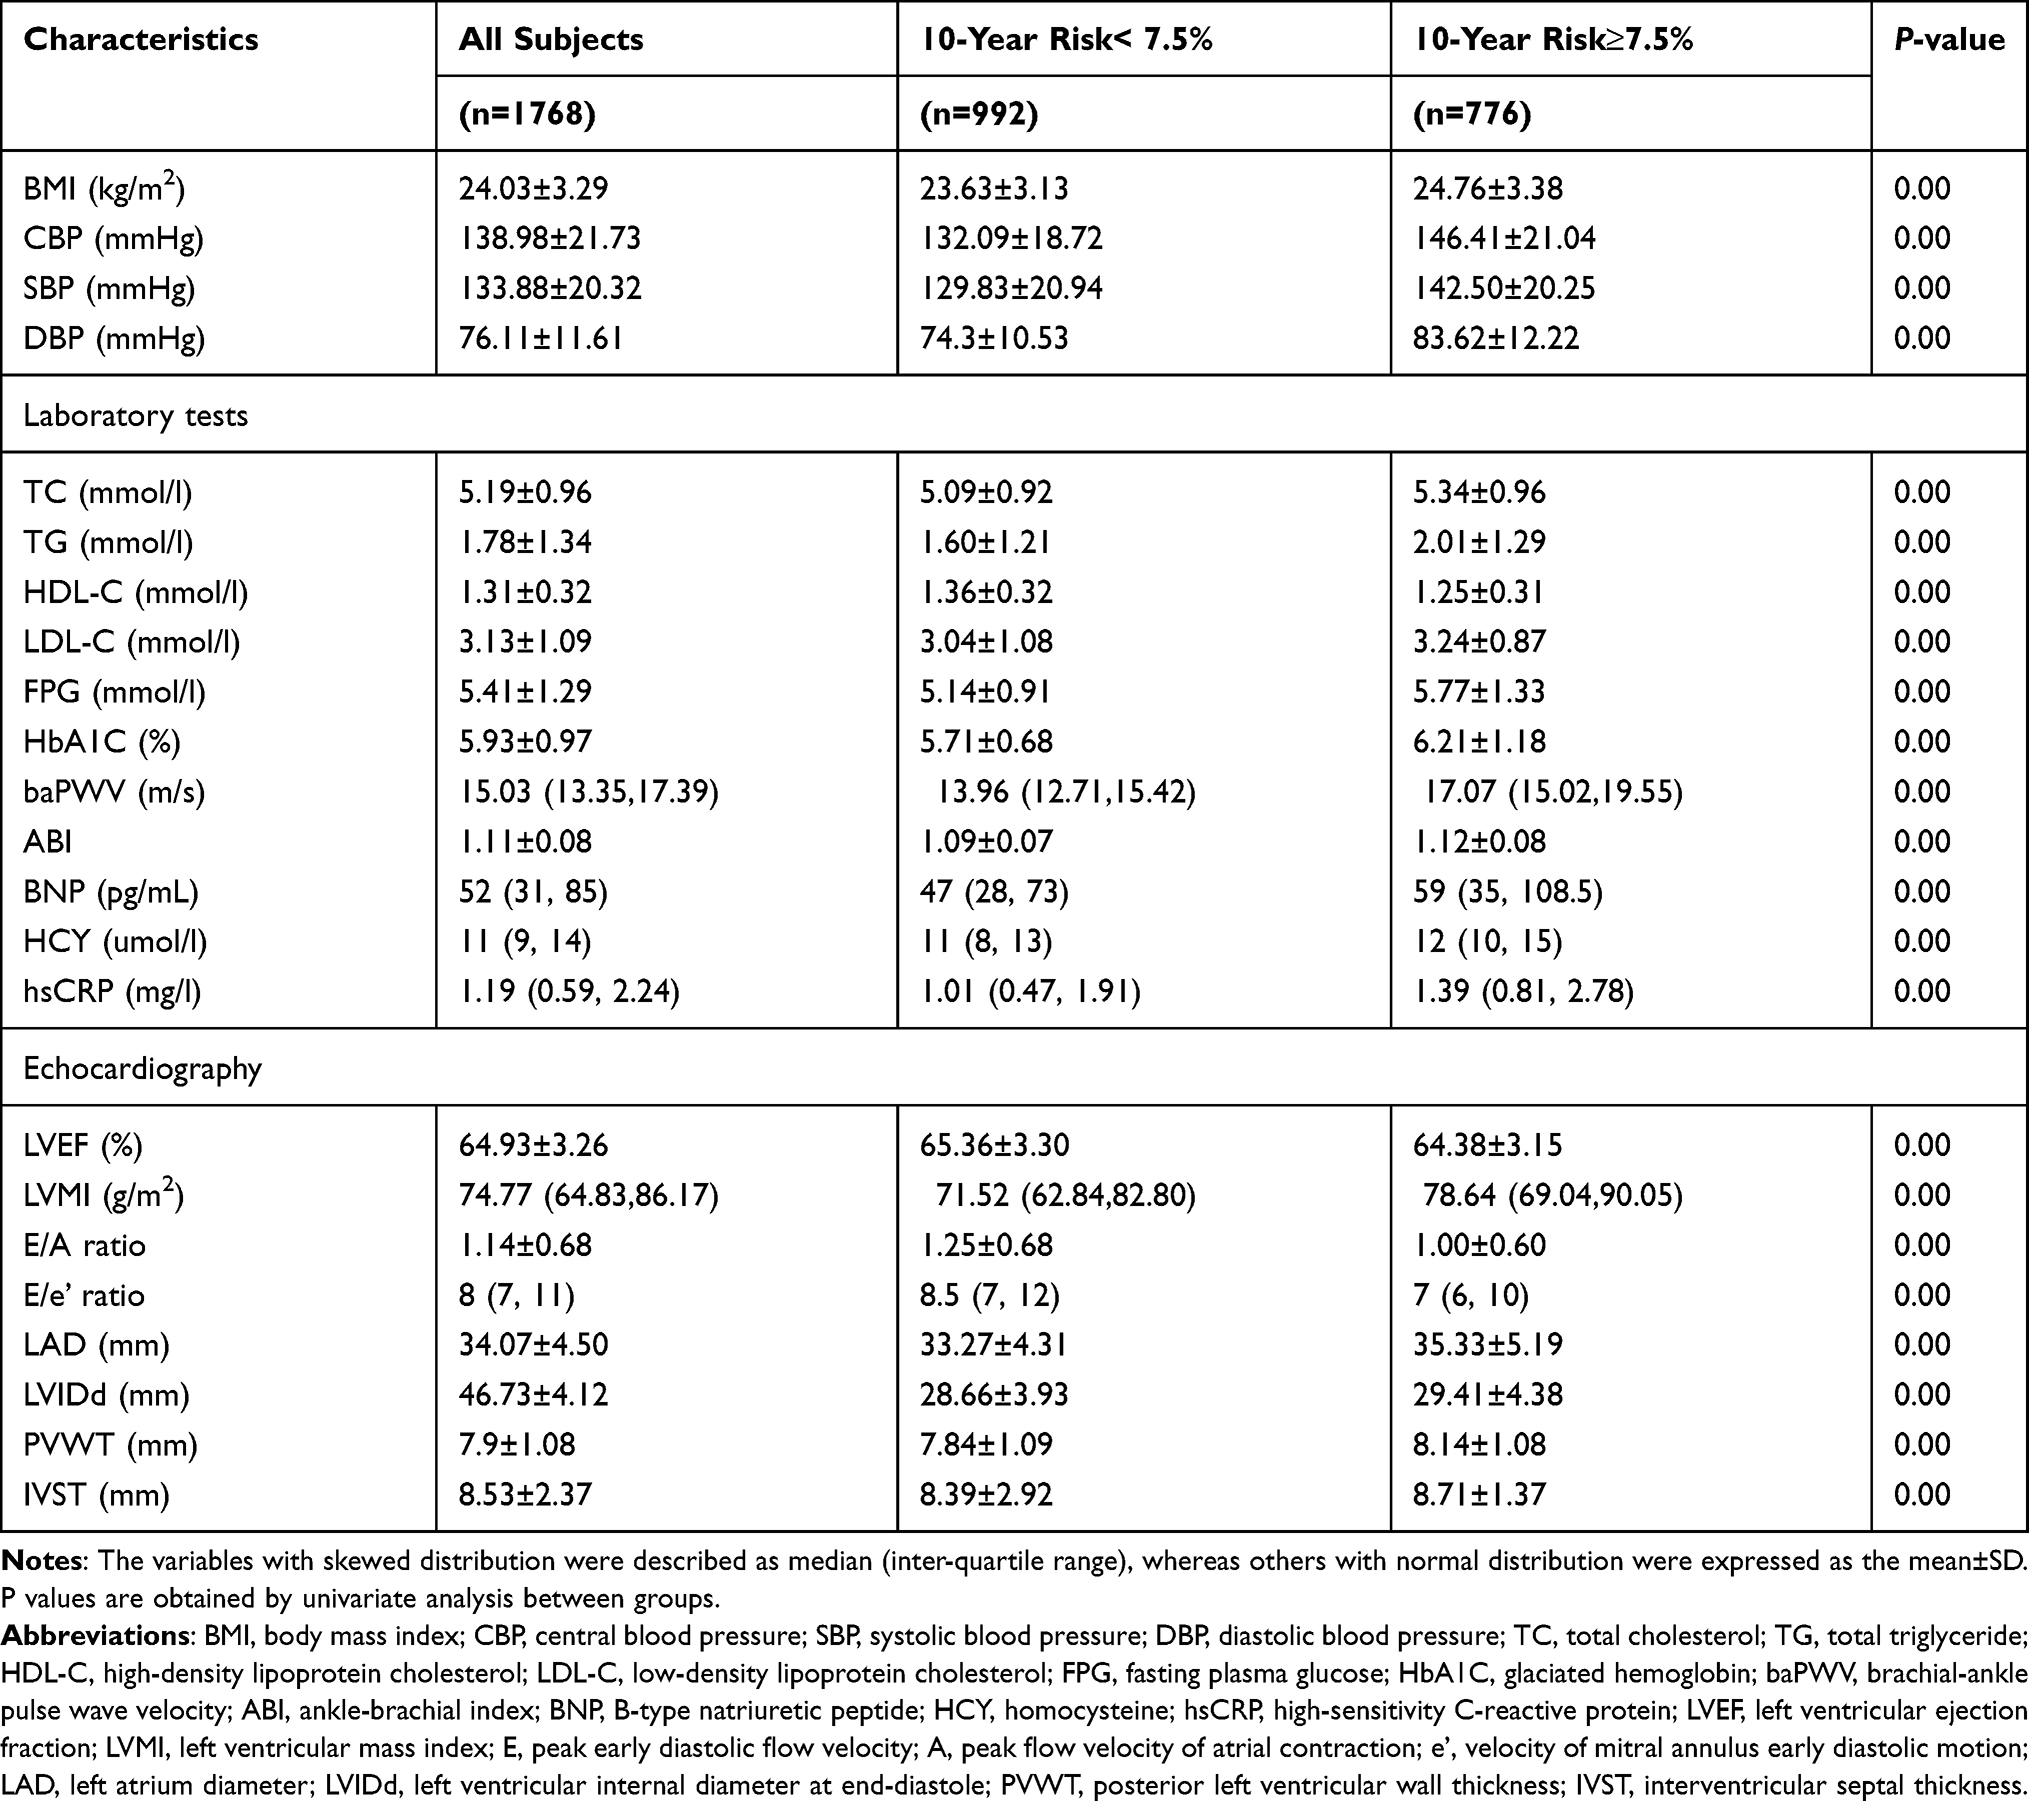 |
Table 2 Baseline Characteristics of Laboratory Tests and Echocardiography |
In order to examine the relationships between 10-year ASCVD risk and baPWV, they were split into four groups based on 10-year ASCVD risk and baPWV. There are 281 cases (15.89%) in the ASCVD low risk and high baPWV and 181 cases (10.24%) in the ASCVD high risk and low baPWV. In addition to CBP, chronic kidney disease (CKD) and drinking, the rest of the results indicated a significant difference for the four groups (Table S1).
Association Between baPWV and 10-Year ASCVD Risk
We used GAM to explore the association between baPWV and 10-year ASCVD risk. The regression spline curve indicated that the relationship between baPWV and 10-year ASCVD risk was non-linear, in which a baPWV of approximately 14 m/s might have a cut-off value of 10-year ASCVD risk (Figure 1A). However, further analysis was done by adjusting age, gender, diabetes mellitus, smoking, TC, HDL-C, SBP, anti-hypertensive medicine, and the cut-off value was approximately 16 m/s (Figure 1B). We conducted a threshold effect analysis using the cut-off value of 14 m/s and 16 m/s, respectively, and found that a baPWV of approximately 16 m/s might be the threshold effect of the 10-year ASCVD risk. The threshold effect of 14 m/s as the cut-off point is not obvious (Table 3). In subjects with a baPWV < 16 m/s, the 10-year ASCVD risk decreased with increasing baseline baPWV (β −0.08, 95% CI −0.18–0.02). In subjects with a baPWV ≥ 16 m/s, the 10-year ASCVD risk increased with increasing baseline baPWV (β 0.28, 95% CI: 0.21–0.34). A log-likelihood ratio test indicated significant differences between the two slopes below and above 16 m/s (P < 0.001) (Table 4).
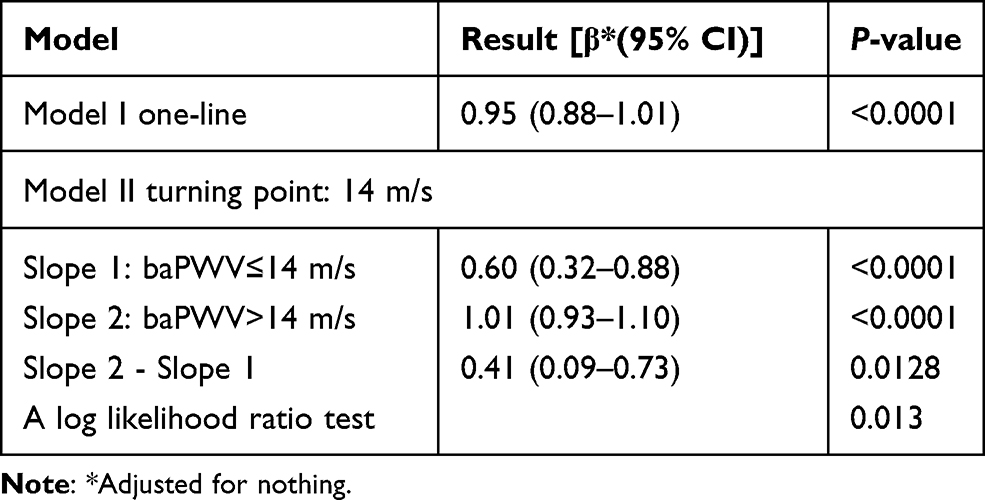 |
Table 3 Threshold Effect Analysis of Baseline baPWV on the Risk of 10-Year ASCVD Risk Using Piecewise Linear Regression Model (Unadjusted) |
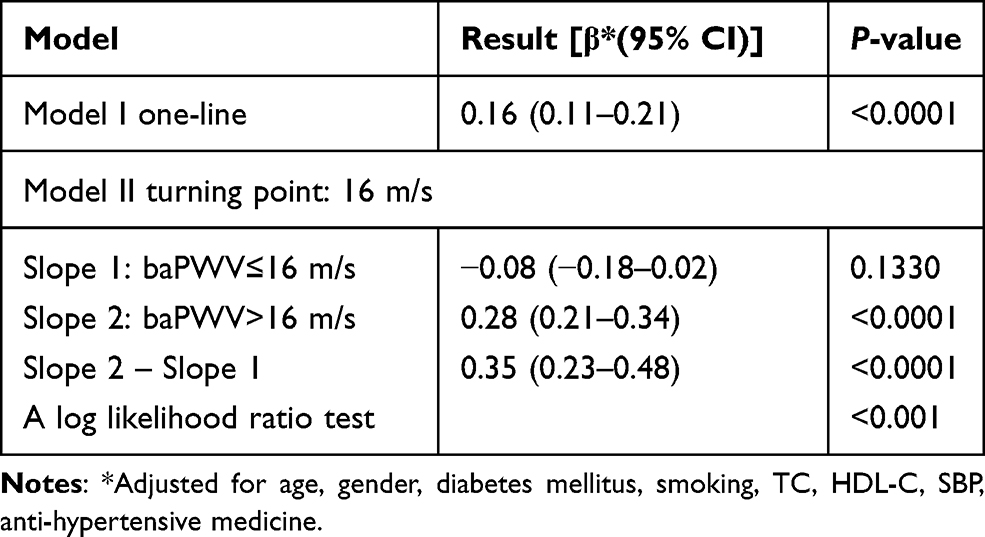 |
Table 4 Threshold Effect Analysis of Baseline baPWV on the Risk of 10-Year ASCVD Risk Using Piecewise Linear Regression Model (Adjusted) |
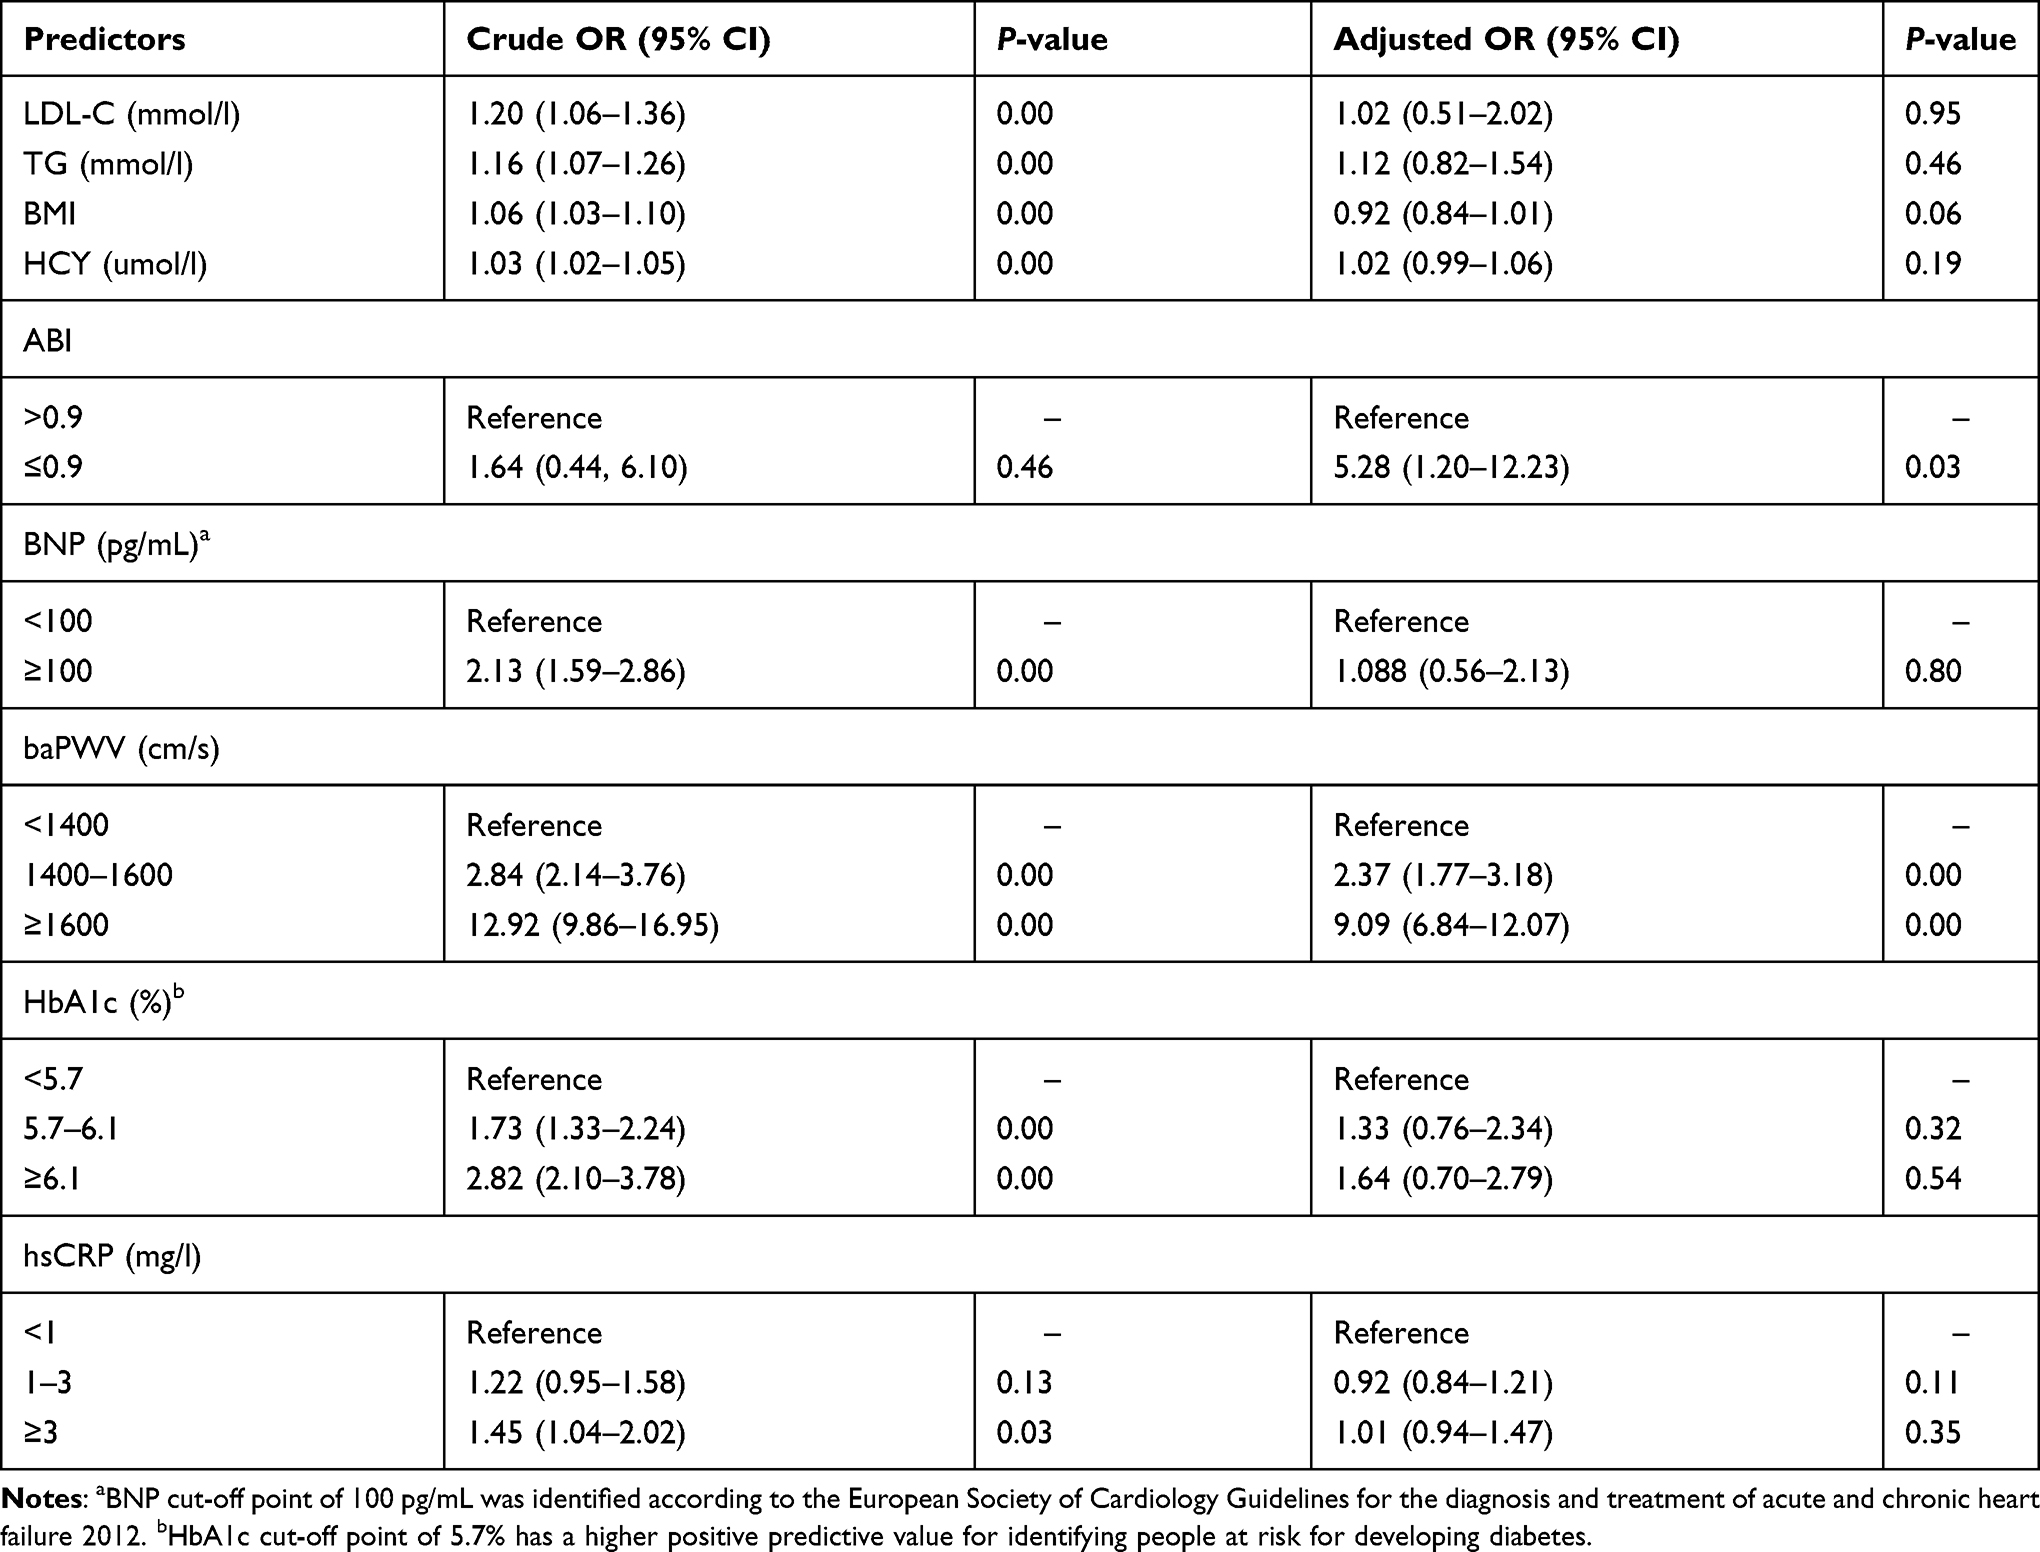 |
Table 5 Logistic-Regression Analysis of Relevant Factors |
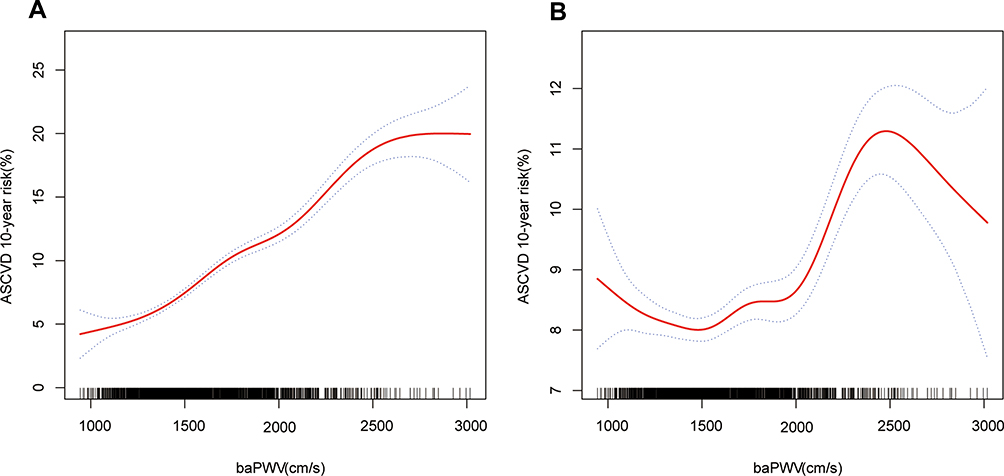 |
Figure 1 Smooth curve of the trend of the relationship between baPWV and 10-year ASCVD risk. (A) Adjusted for nothing. (B) Adjusted for age, gender, diabetes mellitus, smoking, TC, HDL-C, SBP, anti-hypertensive medicine. |
Logistic-Regression Analysis
Moreover, we analyzed LDL-C, TG, BMI, HCY, ABI, BNP, baPWV, HbA1c and hsCRP using logistic regression model to assess the independent correlation with 10-year ASCVD risk. After adjusting for gender, history of diabetes, smoking, TC, HDL-C and medical treatment of hypertension, logistic-regression analysis demonstrated that ankle-brachial index (ABI) [OR 5.28, 95% CI 1.20–12.23] and baPWV (>16 m/s) [OR 9.09, 95% CI 6.84–12.07] were independently correlated with 10-year ASCVD risk (Table 3). The area under the ROC curve for baPWV in predicting 10-year ASCVD risk was 0.80 (95% CI 0.78–0.82), as shown in Figure 2.
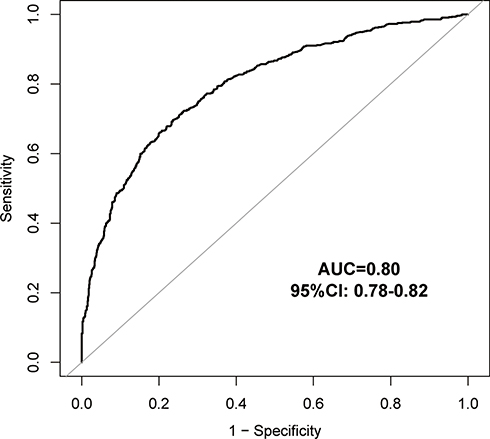 |
Figure 2 The Receiver operating characteristic curve for baPWV for predicting 10-year ASCVD risk. |
Discussion
This cross-sectional study, based on the general middle-aged and elderly population, examined the association between the baPWV and 10-year ASCVD risk. We demonstrate that baPWV is strongly associated with 10-year ASCVD risk regardless of sex, age group, or disease history. Additionally, our results confirm that the association between baPWV and 10-year ASCVD risk is non-linear and provides a reference range of baPWV associated with 10-year ASCVD risk.
The most widely used ASCVD risk assessment tools are the Framingham Risk score (FRS) and Pooled Cohort Equation Risk Calculator (PCE).15 PCE had made improvements against FRS by expanding the population and broadening the outcomes of interest to include fatal or nonfatal stroke, which have been included in 2013 ACC/AHA Guideline.16 The recently released Guideline on the Assessment and Management of Cardiovascular Risk in China recommended the estimation ASCVD risks by using the newly developed Prediction for ASCVD Risk in China risk equation (China-PAR).17 Although China-PAR is created based on Chinese population, the evidence regarding its external validation is still limited. By analyzing a rural Northern Chinese cohort with 11,169 sample size, Tang et al indicated that China-PAR did not improve the accuracy of discrimination and reclassification at individual risk level compared to PCE.5 By applying the decision curve analyses, Jiang et al18 demonstrated that PCE was the most clinically useful when compared to China-PAR and FRS. Thus, in this study, we calculated 10-year ASCVD risk via PCE. Our results showed that nearly half of the subjects were in the high ASCVD risk group. In addition to traditional cardiovascular risks, ABI and baPWV are independently associated with 10-year ASCVD risk. Therefore, more attention should be paid to the impact of ASCVD risk caused by arterial stiffness.
Arterial stiffness represents a promising therapeutic target to counteract vascular aging.19 The carotid-femoral pulse wave velocity (cfPWV) has traditionally been used as a standard method for determination of arterial stiffness, but it is critically dependent upon the accurate placement of transducers over the arteries and is both time-consuming and complex.20 For quantification of arterial stiffness, we assessed the baPWV, a valuable alternative to the cfPWV, applicable to large-scale epidemiological studies.21 In the current study, we demonstrated that baPWV was independently associated with 10-year ASCVD risk. Moreover, we clarified the nonlinear relationship by using the GAM. Using a two-piecewise linear regression model, we calculated that the inflection point was 14 m/s (Table 3). Yamashina et al conducted a study on 10,828 subjects and also recommended a baPWV of 14 m/s as a diagnostic cut-off value for atherosclerosis.22 However, after adjusting for age, gender, diabetes mellitus, smoking, TC, HDL-C, SBP, and anti-hypertensive medicine, we demonstrated that the inflection point was 16 m/s (Table 4). This is most likely due to different analytical methods. The analysis of ROC curves may not be applicable to possible nonlinear relationship. GAM has obvious advantages in dealing with nonlinear relations, and it can handle the non-parametric smoothing and will fit a regression spline to the data.23
In order to further explore and analyze the association between baPWV and 10-year ASCVD risk, we divided our population into four subgroups based on the threshold of baPWV and 10-year ASCVD risk. Research to date has found a low-cardiovascular event rate among those with relatively lower level of baPWV.24 Approximately 10% of our sample had baPWV under 16 m/s and were in the high ASCVD risk group. Since the PCE has been suggested to over-estimate the 10-year ASCVD risk,25 a lower baPWV value can be reassuring as to the true low risk of the patient. It is worth noting that that there were a number of subjects with low ASCVD risk but displayed a high baPWV measurement. More examinations and health care plans are warranted for people in this subgroup, even if the calculated 10-year risk does not reach the threshold. Previous studies supported the broad applicability of baPWV for risk stratification in a general clinical setting, regardless of cardiovascular risk.26 Based on our findings, we speculate that baPWV would be a promising marker for the prediction and reclassification of ASCVD risk. Further study is needed to evaluate the contribution of baPWV using the population-based cohort with four ASCVD events.
Our study showed that the risk of ASCVD increases when ABI ≤ 0.9, which is in agreement with previous studies.27 We further found that the association between BMI and 10-year ASCVD was statistically nonsignificant, which was not consistent with a previous study.28 This may be due to the fact that obesity paradox or the presence of several other cardiovascular risk factors.29,30 At present, numerous studies have investigated the influencing factors associated with 10-year ASCVD risk, including waist-to-hip ratio, waist-to-height ratio and remnant cholesterol.31,32 A recent study on the risk of coronary heart disease suggested that differences between people of different ethnicities may not be as pronounced as previously thought.33 Moreover, echocardiographic indicators have also been shown to be important in determining ASCVD risk during patient screening.34 Finally, the high-sensitivity C reactive protein, a marker of low-grade inflammation, was previously reported as a sensitive predictor of arterial stiffness, which may help to determine ASCVD risk.35
There are a few limitations in our current study. First, although baPWV has become a reliable standard measure of arterial stiffness, the measurement of baPWV can still be affected by blood pressure.36 Secondly, although we listed almost all factors that may be correlated to the 10-year ASCVD risk, there may be several other biomarkers associated with atherosclerotic cardiovascular disease were not included in the present study.37 Thirdly, our current study is a single-center study where the basic incidence of CVD in the local area is relatively low, which means that if the survey population is extended to other regions, there may be several differences in the overall study results.17,38 Finally, our current study is a cross-sectional study, and therefore we cannot draw any conclusions regarding causality.
Conclusion
In conclusion, we demonstrated that increased baPWV as the marker of arterial stiffness is independently and strongly associated with 10-year ASCVD risk in general middle-aged and elderly population. The relationship between the baPWV and 10-year ASCVD risk is non-linear with a significant threshold. Subjects with baPWV above 16 m/s are more likely to encounter a higher 10-year ASCVD risk. Attention should be paid to the individuals with baPWV above 16 m/s and the 10-year risk of ASCVD lower than 7.5%. Further studies are warranted to investigate the ASCVD risk stratification among this subset.
Acknowledgments
The study was funded by the Nature Science Foundation of China (No. 71904127). The authors express their sincere gratitude to all the staff in this survey for their important contribution. Hao Wang and Xubo Wu are co-first authors for this study.
Disclosure
The findings and conclusions in this paper are those of the authors, and there are no conflicts of interest.
References
1. Volgman AS, Palaniappan LS, Aggarwal NT, et al. Atherosclerotic cardiovascular disease in South Asians in the United States: epidemiology, risk factors, and treatments: a scientific statement from the American Heart Association. Circulation. 2018;138(1):e1–e34. doi:10.1161/CIR.0000000000000580
2. Benjamin EJ, Blaha MJ, Chiuve SE, et al. Heart disease and stroke statistics-2017 update: a report from the American Heart Association. Circulation. 2017;135:e146–e603.
3. Zhao D, Liu J, Wang M, Zhang X, Zhou M. Epidemiology of cardiovascular disease in China: current features and implications. Nat Rev Cardiol. 2019;16(4):203–212. doi:10.1038/s41569-018-0119-4
4. Goff DC, Lloyd-Jones DM, Bennett G, et al. 2013 ACC/AHA guideline on the assessment of cardiovascular risk: a report of the American College of Cardiology/American Heart Association task force on practice guidelines. J Am Coll Cardiol. 2014;63(25):2935–2959. doi:10.1016/j.jacc.2013.11.005
5. Tang X, Zhang D, He L, et al. Performance of atherosclerotic cardiovascular risk prediction models in a rural Northern Chinese population: results from the Fangshan Cohort Study. Am Heart J. 2019;211:34–44. doi:10.1016/j.ahj.2019.01.009
6. Lee CH, Woo YC, Lam JKY, et al. Validation of the pooled cohort equations in a long-term cohort study of Hong Kong Chinese. J Clin Lipidol. 2015;9(5):640–646.e2. doi:10.1016/j.jacl.2015.06.005
7. Chowienczyk PJ. Aortic stiffness and disease: location is key. Circulation. 2015;131(20):1745–1747. doi:10.1161/CIRCULATIONAHA.115.016377
8. Iulita MF, Noriega de la Colina A, Girouard H. Arterial stiffness, cognitive impairment and dementia: confounding factor or real risk? J Neurochem. 2018;144(5):527–548. doi:10.1111/jnc.14235
9. Vanderschuren MM, Uiterwaal CS, van der Ent CK, Eising JB. Feasibility and characteristics of arterial stiffness measurement in preschool children. Eur J Prev Cardiol. 2017;24(17):1895–1902. doi:10.1177/2047487317721979
10. Kim J, Choi S-Y, Park B, et al. Arterial stiffness measured by cardio-ankle vascular index in Korean women with polycystic ovary syndrome. J Obstet Gynaecol. 2019;39(5):681–686. doi:10.1080/01443615.2018.1561654
11. Miyata M. Noninvasive assessment of arterial stiffness using oscillometric methods: baPWV, CAVI, API, and AVI. J Atheroscler Thromb. 2018;25(9):790–791. doi:10.5551/jat.ED098
12. Wu J, Yu SY, Wo D, et al. Risks and predictors of mild diastolic dysfunction among middle-aged and aged women: a population-based cohort study. J Hum Hypertens. 2016;30(5):335–340. doi:10.1038/jhh.2015.85
13. Jia X, Al Rifai M, Birnbaum Y, Smith SC, Virani SS. The 2018 cholesterol management guidelines: topics in secondary ASCVD prevention clinicians need to know. Curr Atheroscler Rep. 2019;21(6):20. doi:10.1007/s11883-019-0784-8
14. McMurray JJV, Adamopoulos S, Anker SD, et al. ESC guidelines for the diagnosis and treatment of acute and chronic heart failure 2012: the task force for the diagnosis and treatment of acute and chronic heart failure 2012 of the European Society of Cardiology. developed in collaboration with the Heart Failure Association (HFA) of the ESC. Eur Heart J. 2012;33:1787–1847.
15. Guerra-Silva NMM, Santucci FS, Moreira RC, et al. Coronary disease risk assessment in men: comparison between ASCVD risk versus Framingham. Int J Cardiol. 2017;228:481–487. doi:10.1016/j.ijcard.2016.11.102
16. Preiss D, Kristensen SL. The new pooled cohort equations risk calculator. Can J Cardiol. 2015;31(5):613–619. doi:10.1016/j.cjca.2015.02.001
17. Yang X, Li J, Hu D, et al. Predicting the 10-year risks of atherosclerotic cardiovascular disease in Chinese population: the China-PAR project (Prediction for ASCVD risk in China). Circulation. 2016;134(19):1430–1440. doi:10.1161/CIRCULATIONAHA.116.022367
18. Jiang Y, Ma R, Guo H, et al. External validation of three atherosclerotic cardiovascular disease risk equations in rural areas of Xinjiang, China. BMC Public Health. 2020;20(1):1471. doi:10.1186/s12889-020-09579-4
19. Safar ME. Arterial stiffness as a risk factor for clinical hypertension. Nat Rev Cardiol. 2018;15(2):97–105. doi:10.1038/nrcardio.2017.155
20. Tanaka H, Munakata M, Kawano Y, et al. Comparison between carotid-femoral and brachial-ankle pulse wave velocity as measures of arterial stiffness. J Hypertens. 2009;27(10):2022–2027. doi:10.1097/HJH.0b013e32832e94e7
21. Wu S, Jin C, Li S, et al. Aging, arterial stiffness, and blood pressure association in Chinese adults. Hypertension. 2019;73(4):893–899. doi:10.1161/HYPERTENSIONAHA.118.12396
22. Yamashina A, Tomiyama H, Arai T, et al. Brachial-ankle pulse wave velocity as a marker of atherosclerotic vascular damage and cardiovascular risk. Hypertens Res. 2003;26(8):615–622. doi:10.1291/hypres.26.615
23. Hastie T, Tibshirani R. Generalized additive models: some applications. J Am Stat Assoc. 1987;82(398):371–386. doi:10.1080/01621459.1987.10478440
24. Ohkuma T, Ninomiya T, Tomiyama H, et al. Brachial-ankle pulse wave velocity and the risk prediction of cardiovascular disease: an individual participant data meta-analysis. Hypertension. 2017;69(6):1045–1052. doi:10.1161/HYPERTENSIONAHA.117.09097
25. Nguyen QD, Odden MC, Peralta CA, Kim DH. Predicting risk of atherosclerotic cardiovascular disease using pooled cohort equations in older adults with frailty, multimorbidity, and competing risks. J Am Heart Assoc. 2020;9(18):e016003. doi:10.1161/JAHA.119.016003
26. Sang T, Lv N, Dang A, Cheng N, Zhang W. Brachial-ankle pulse wave velocity and prognosis in patients with atherosclerotic cardiovascular disease: a systematic review and meta-analysis. Hypertens Res. 2021;44(9):1175–1185. doi:10.1038/s41440-021-00678-2
27. Arnett DK, Blumenthal RS, Albert MA, et al. 2019 ACC/AHA guideline on the primary prevention of cardiovascular disease: executive summary: a report of the American College of Cardiology/American Heart Association task force on clinical practice guidelines. J Am Coll Cardiol. 2019;74(10):1376–1414. doi:10.1016/j.jacc.2019.03.009
28. Han K, Chun H, Kim M-J, et al. Low levels of sex hormone-binding globulin constitute an independent risk factor for arterial stiffness in Korean women. Int J Endocrinol. 2017;2017:6956495. doi:10.1155/2017/6956495
29. Kudo U, Takahashi I, Matsuzaka M, et al. Influence of obesity on blood pressure and arterial stiffness in the early teens. Obes Res Clin Pract. 2013;7(3):e211–e217. doi:10.1016/j.orcp.2011.12.005
30. Mozos I. Body mass index, blood pressure and arteriography variables in a middle and aged population. Healthmed. 2014;8:442–450.
31. Li HH, Huang S, Liu XZ, Zou DJ. Applying the China-PAR risk algorithm to assess 10-year atherosclerotic cardiovascular disease risk in populations receiving routine physical examinations in Eastern China. Biomed Environ Sci. 2019;32:87–95.
32. Varbo A, Benn M, Tybjærg-Hansen A, et al. Remnant cholesterol as a causal risk factor for ischemic heart disease. J Am Coll Cardiol. 2013;61(4):427–436. doi:10.1016/j.jacc.2012.08.1026
33. McClelland RL, Jorgensen NW, Budoff M, et al. 10-year coronary heart disease risk prediction using coronary artery calcium and traditional risk factors: derivation in the Mesa (Multi-Ethnic Study of Atherosclerosis) with validation in the HNR (Heinz Nixdorf Recall) Study and the DHS (Dallas Heart Study). J Am Coll Cardiol. 2015;66:1643–1653.
34. Cauwenberghs N, Hedman K, Kobayashi Y, et al. The 2013 ACC/AHA risk score and subclinical cardiac remodeling and dysfunction: complementary in cardiovascular disease prediction. Int J Cardiol. 2019;297:67–74. doi:10.1016/j.ijcard.2019.09.061
35. Mozos I, Jianu D, Gug C, Stoian D. Links between high-sensitivity C-reactive protein and pulse wave analysis in middle-aged patients with hypertension and high normal blood pressure. Dis Markers. 2019;2019:2568069. doi:10.1155/2019/2568069
36. Shirai K, Utino J, Otsuka K, Takata M. A novel blood pressure-independent arterial wall stiffness parameter; cardio-ankle vascular index (CAVI). J Atheroscler Thromb. 2006;13(2):101–107. doi:10.5551/jat.13.101
37. Tibaut M, Caprnda M, Kubatka P, et al. Markers of atherosclerosis: part 1 - serological markers. Heart Lung Circ. 2019;28(5):667–677. doi:10.1016/j.hlc.2018.06.1057
38. Madhu B, Prathyusha K, Prakruthi P, Srinath KM. Comparison of prevalence of life style risk factors and 10 year risk of CVD event among rural and tribal population of Kollegal Taluk, Chamarajanagar district, South India. Diabetes Metab Syndr. 2019;13(5):2961–2966. doi:10.1016/j.dsx.2019.07.056
 © 2021 The Author(s). This work is published and licensed by Dove Medical Press Limited. The full terms of this license are available at https://www.dovepress.com/terms.php and incorporate the Creative Commons Attribution - Non Commercial (unported, v3.0) License.
By accessing the work you hereby accept the Terms. Non-commercial uses of the work are permitted without any further permission from Dove Medical Press Limited, provided the work is properly attributed. For permission for commercial use of this work, please see paragraphs 4.2 and 5 of our Terms.
© 2021 The Author(s). This work is published and licensed by Dove Medical Press Limited. The full terms of this license are available at https://www.dovepress.com/terms.php and incorporate the Creative Commons Attribution - Non Commercial (unported, v3.0) License.
By accessing the work you hereby accept the Terms. Non-commercial uses of the work are permitted without any further permission from Dove Medical Press Limited, provided the work is properly attributed. For permission for commercial use of this work, please see paragraphs 4.2 and 5 of our Terms.