Back to Journals » Diabetes, Metabolic Syndrome and Obesity » Volume 15
Relationship of Bone Turnover Markers with Serum Uric Acid-to-Creatinine Ratio in Men and Postmenopausal Women with Type 2 Diabetes
Authors Xing Y, Liu J, Liu H, Ma H
Received 2 August 2022
Accepted for publication 5 October 2022
Published 19 October 2022 Volume 2022:15 Pages 3205—3217
DOI https://doi.org/10.2147/DMSO.S384694
Checked for plagiarism Yes
Review by Single anonymous peer review
Peer reviewer comments 2
Editor who approved publication: Professor Gian Paolo Fadini
Yuling Xing,1,2 Jing Liu,1 Huanxin Liu,3 Huijuan Ma1,4,5
1Department of Endocrinology, Hebei General Hospital, Shijiazhuang, People’s Republic of China; 2Graduate School of Hebei Medical University, Shijiazhuang, People’s Republic of China; 3Health Examination Center, Hebei General Hospital, Shijiazhuang, People’s Republic of China; 4Hebei Key Laboratory of Metabolic Diseases, Hebei General Hospital, Shijiazhuang, People’s Republic of China; 5Department of Internal Medicine, Hebei Medical University, Shijiazhuang, People’s Republic of China
Correspondence: Huijuan Ma, Department of Endocrinology, Hebei General Hospital, Shijiazhuang, People’s Republic of China, Tel +86 18032838686, Email [email protected]
Purpose: Accumulating evidence has shown that serum uric acid (UA) is associated with some chronic diseases owing to its antioxidant capacity; however, previous research has discrepant results regarding the relationship between UA and bone health. UA normalized by renal function can reflect endogenous UA levels more precisely than SUA levels. This study assessed the relationship between serum UA-to-creatinine (SUA/Cr) ratio and bone turnover markers (BTMs) in men and postmenopausal women with type 2 diabetes mellitus (T2DM).
Patients and Methods: Overall, 1691 patients (1028 males and 663 postmenopausal females) with T2DM admitted to Hebei General Hospital between January and December 2020 were selected and divided into two groups according to their SUA/Cr ratio. One-way analysis of variance was used to compare groups. The relationship between the SUA/Cr ratio and BTMs (including osteocalcin [OC], procollagen I N-terminal peptide [PINP], and β-isomerized type I collagen C-telopeptide breakdown products [β-CTX]) was analyzed using multiple linear regression. Furthermore, subgroup analyses were performed to explore the differences between men and women in the relationship between SUA/Cr and BTMs. Mediation analysis was used to explore whether insulin resistance mediated the association between SUA/Cr and BTMs.
Results: β-CTX and PNIP levels of patients with T2DM in the low SUA/Cr group were significantly higher than those in the high SUA/Cr group, and the difference between the two groups was statistically significant (P < 0.05). Correlation analysis showed that SUA/Cr was negatively correlated with β-CTX and PNIP. After adjusting for confounding factors, multivariate linear regression analysis revealed that the SUA/Cr level was negatively correlated with PINP and β-CTX in male patients and postmenopausal women with T2DM. Stronger correlations were found in patients with 25(OH)D3 < 20ng/mL, course ≥ 5 years, HbA1c > 7%, or BMI < 28 kg/m2.
Conclusion: SUA/Cr ratio was an independent influencing factor of BTMs in patients with T2DM.
Keywords: type 2 diabetes, bone turnover markers, serum uric acid to creatinine ratio
Introduction
Globally, 463 million people are affected by diabetes, and this number is predicted to increase to 700 million by 2045.1 Osteoporosis (OP), one of the most common metabolic bone diseases, is characterized by low bone mass and damage to bone microarchitecture, leading to increased bone brittleness and susceptibility to fractures.2 Currently, OP is a primary public health concern in many countries because of its potential for serious fractures as well as its increasing prevalence due to our aging population.3,4 Furthermore, it has been noted that a relationship could exist between diabetes (primarily type 2 diabetes mellitus [T2DM]) and OP. In China, Si et al found that the pooled prevalence of osteoporosis among patients with T2DM was 37.8%.5 The Rotterdam Study (RS) revealed that compared with the general population, patients with T2DM have increased bone mineral density (BMD) of the femoral neck and lumbar spine, yet a 69% greater susceptibility to fracture.6 This disparity can be attributed to decreased bone strength.7 The lack of association between higher BMD and lower incidence of fractures indicates that in T2DM, bone biomechanical properties are compromised.
Uric acid (UA) is the final product of human purine metabolism. As UA excretion is influenced by kidney function, we hypothesized that UA normalized by renal function (serum UA-to-creatinine ratio [SUA/Cr]) could accurately reflect endogenous UA levels more precisely than SUA. Studies investigating the relationship between UA levels and bone health have produced mixed results. Some studies have reported associations between UA levels and higher BMD.8–10 However, multiple studies have reported the absence of a significant association between UA, bone turnover markers (BTMs), and BMD, even among patients with T2DM.11 The pathophysiology of bone fragility in patients with T2DM was therefore regarded as substantially different from OP because patients with T2DM have an increased risk of bone fractures despite a normal to high BMD compared with participants without diabetes.12 Thus, further investigations should be conducted on the role of UA in bone metabolism in patients with T2DM. Bone remodeling is a dynamic process that occurs throughout life, replacing old and damaged bones with new ones. Bone loss occurs during bone remodeling and has been shown to reflect this process.13 Accumulating evidence suggests that osteoporosis is associated with increased inflammatory burden.14 In contrast, serum UA is associated with inflammatory conditions such as T2DM15 and diabetic kidney disease.16 Not only uric acid but also UA-derived metabolic markers have been associated with various diseases, including hypertension,17 hepatic steatosis,18 thyroiditis,19 metabolic syndrome,20 and T2DM.21 Therefore, studying the correlation between uric acid-derived markers and bone turnover markers is important. Evaluation of the relationship between SUA/Cr and BTMs, including osteocalcin (OC), procollagen I N-terminal peptide (PINP), and β-isomerized type I collagen C-telopeptide breakdown products (β-CTX), would provide significant clues to UA’s role in bone metabolism. This study aimed to evaluate the associations between SUA/Cr and BTMs and explore the mediation effect of SUA/Cr on the relationship between BTMs.
Patients and Methods
Study Participants
This study was performed in accordance with the Helsinki Declaration and approved by the Ethics Committee of Hebei General Hospital. This study included patients admitted to Hebei General Hospital from January 1, 2020, to December 31, 2019. All participants provided written informed consent for participation in the study.
The inclusion criteria were as follows: patients who met the diagnostic criteria for T2DM of the American Diabetes Association: FPG ≥ 7.0 mmol/L, 2-hour plasma glucose ≥ 11.1 mmol/L, or random blood glucose measurement ≥ 11.1 mmol/L in the presence of classic symptoms such as polydipsia and polyuria.
The exclusion criteria were as follows: (1) other types of diabetes, such as type 1 diabetes, gestational diabetes, and other specific types of diabetes; (2) recent acute complications of diabetes such as diabetic ketoacidosis, diabetic hyperosmolar coma, and hypoglycemia; (3) perimenopausal and premenopausal women; (4) pregnant or nursing (lactating) women; (5) patients with a history of myocardial infarction, cerebral hemorrhage, severe hepatorenal dysfunction, infection, recent surgery, stress condition, and another severe chronic disease in the past 3 months; (6) presence of a malignant tumor; (7) recent bone fracture (<1 year); (8) patients suffering from diseases that affect bone metabolism and UA (such as gout, hyperthyroidism, hyperparathyroidism, rheumatoid arthritis, kidney disease, multiple myeloma, uricases, uricosuric agents, xanthine oxidase inhibitors, etc.) or being treated with drugs that affect bone metabolism and UA (such as vitamin D, calcium, abisphosphonate, aglucocorticoid, estrogen, warfarin, or other drugs) were excluded.
Methods
The Laboratory and Demographic Data
Upon study enrollment, detailed history and demographics were recorded, including name, sex, date of birth, course of T2DM, past history, weight, and height. Venous blood was collected from patients on an empty stomach for at least 8 hours in the early morning of the day after admission. All laboratory tests were performed in the Clinical Detection Department of Hebei General Hospital, using the same instruments and unified reagents: UA, hemoglobin A1c (HbA1c), creatinine (Cr), triglyceride (TG), high-density lipoprotein cholesterol (HDL-C), calcium ion (Ca2+), 25-hydroxy vitamin D (25(OH)D3), fasting plasma glucose (FPG), parathyroid hormone (PTH), OC, PINP, and β-CTX were measured. To ensure data extraction accuracy, the information was entered into a spreadsheet by one assessor and cross-checked by a second independent assessor.
SUA/Cr Was Defined as SUA/Cr = UA (mmol/l)/Cr (umol/l)
Statistical Analysis
Statistical analysis was performed using SPSS statistical software (Version 25.0). Data were tested for homogeneity of variance and normality. Normally distributed data are shown as the mean ± standard deviation, and an independent samples t-test was used to compare the groups. On‐normally distributed data are presented as medians (quartiles), and nonparametric tests were used. The enumeration data were expressed as numbers (percentage) and were compared with the χ2 test, and Spearman (’s) correlation analysis was used to assess the correlation between SUA/Cr and BTMs. To evaluate whether SUA/Cr was an independent risk factor for BTMs, multiple linear regression analysis was used. We used a false discovery rate (FDR) correction according to the Benjamini–Hochberg method to control for Type I error and conducted a subgroup analysis to assess the robustness of our results.
Results
Basic Clinical Characteristics of the Study Subjects
A total of 1691 patients with T2DM were included in this study (Figure 1). There were 1028 men and 663 postmenopausal women with a median age of 60 years, median T2DM duration of 10 years, median OC level of 12.74 ng/mL, median β-CTX level of 0.38 ng/mL, median PINP level of 38.68 ng/mL, and median SUA/Cr level of 4.19 (Table 1). Compared with the male group, the postmenopausal female group presented higher levels of age, course, HDL-C PINP, β-CTX, and OC, and lower levels of BMI, 25(OH)D3. The two groups showed no statistical difference in SUA/Cr (Table 1).
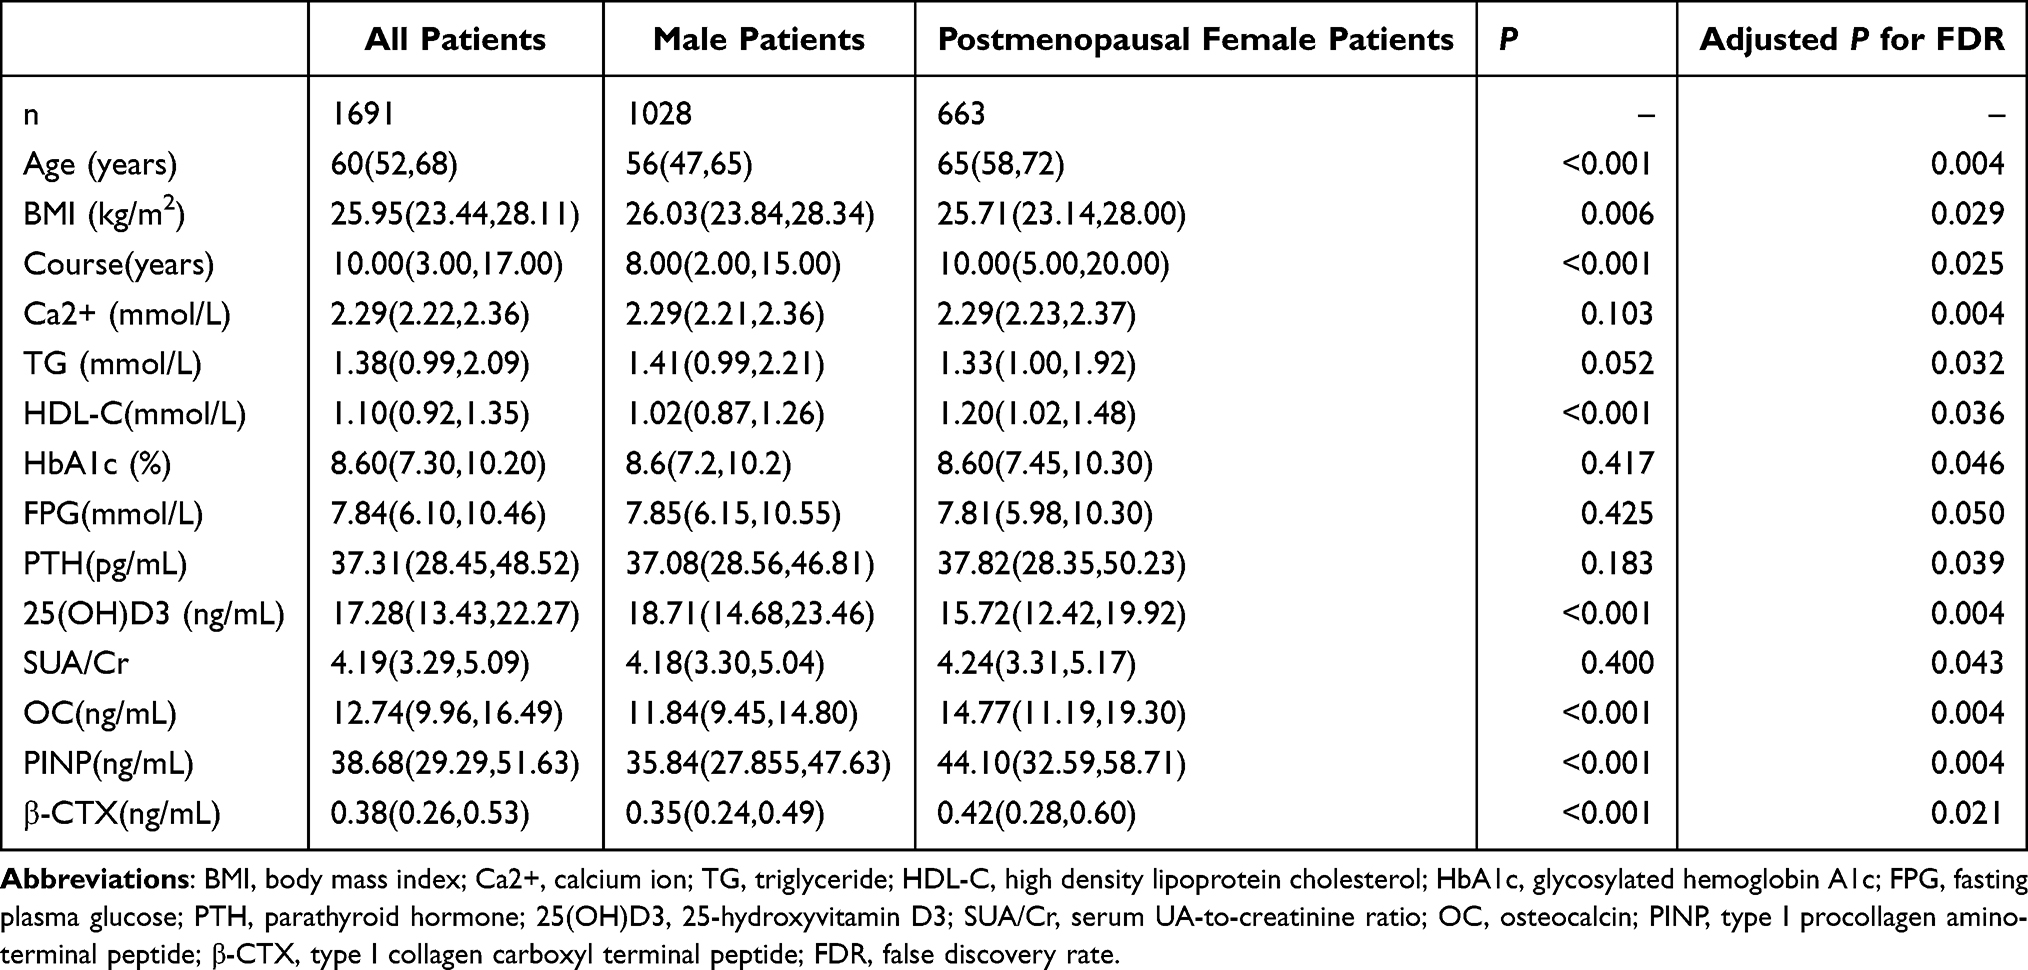 |
Table 1 Comparison of Indicators Between the Male and Postmenopausal Female Groups |
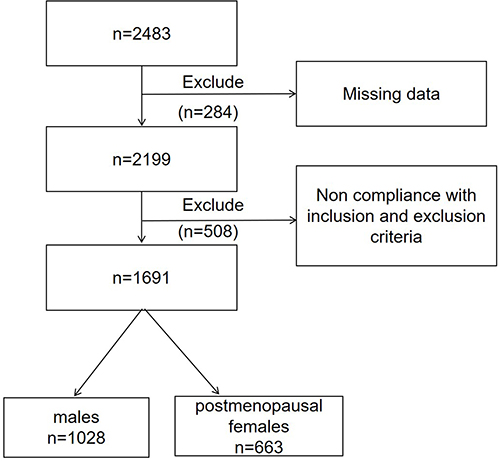 |
Figure 1 Flow chart. |
Clinical Characteristics of the Subjects Categorized According to Their SUA/Cr Levels
The patients were divided into high and low groups based on the median SUA/Cr value. Among patients with T2DM, BMI, Ca2+, TG, and FPG levels were significantly higher, and age, course, HDL-C, PINP, and β-CTX in the high SUA/Cr group than in the low SUA/Cr group. However, there was no significant difference in OC between the two groups (Table 2).
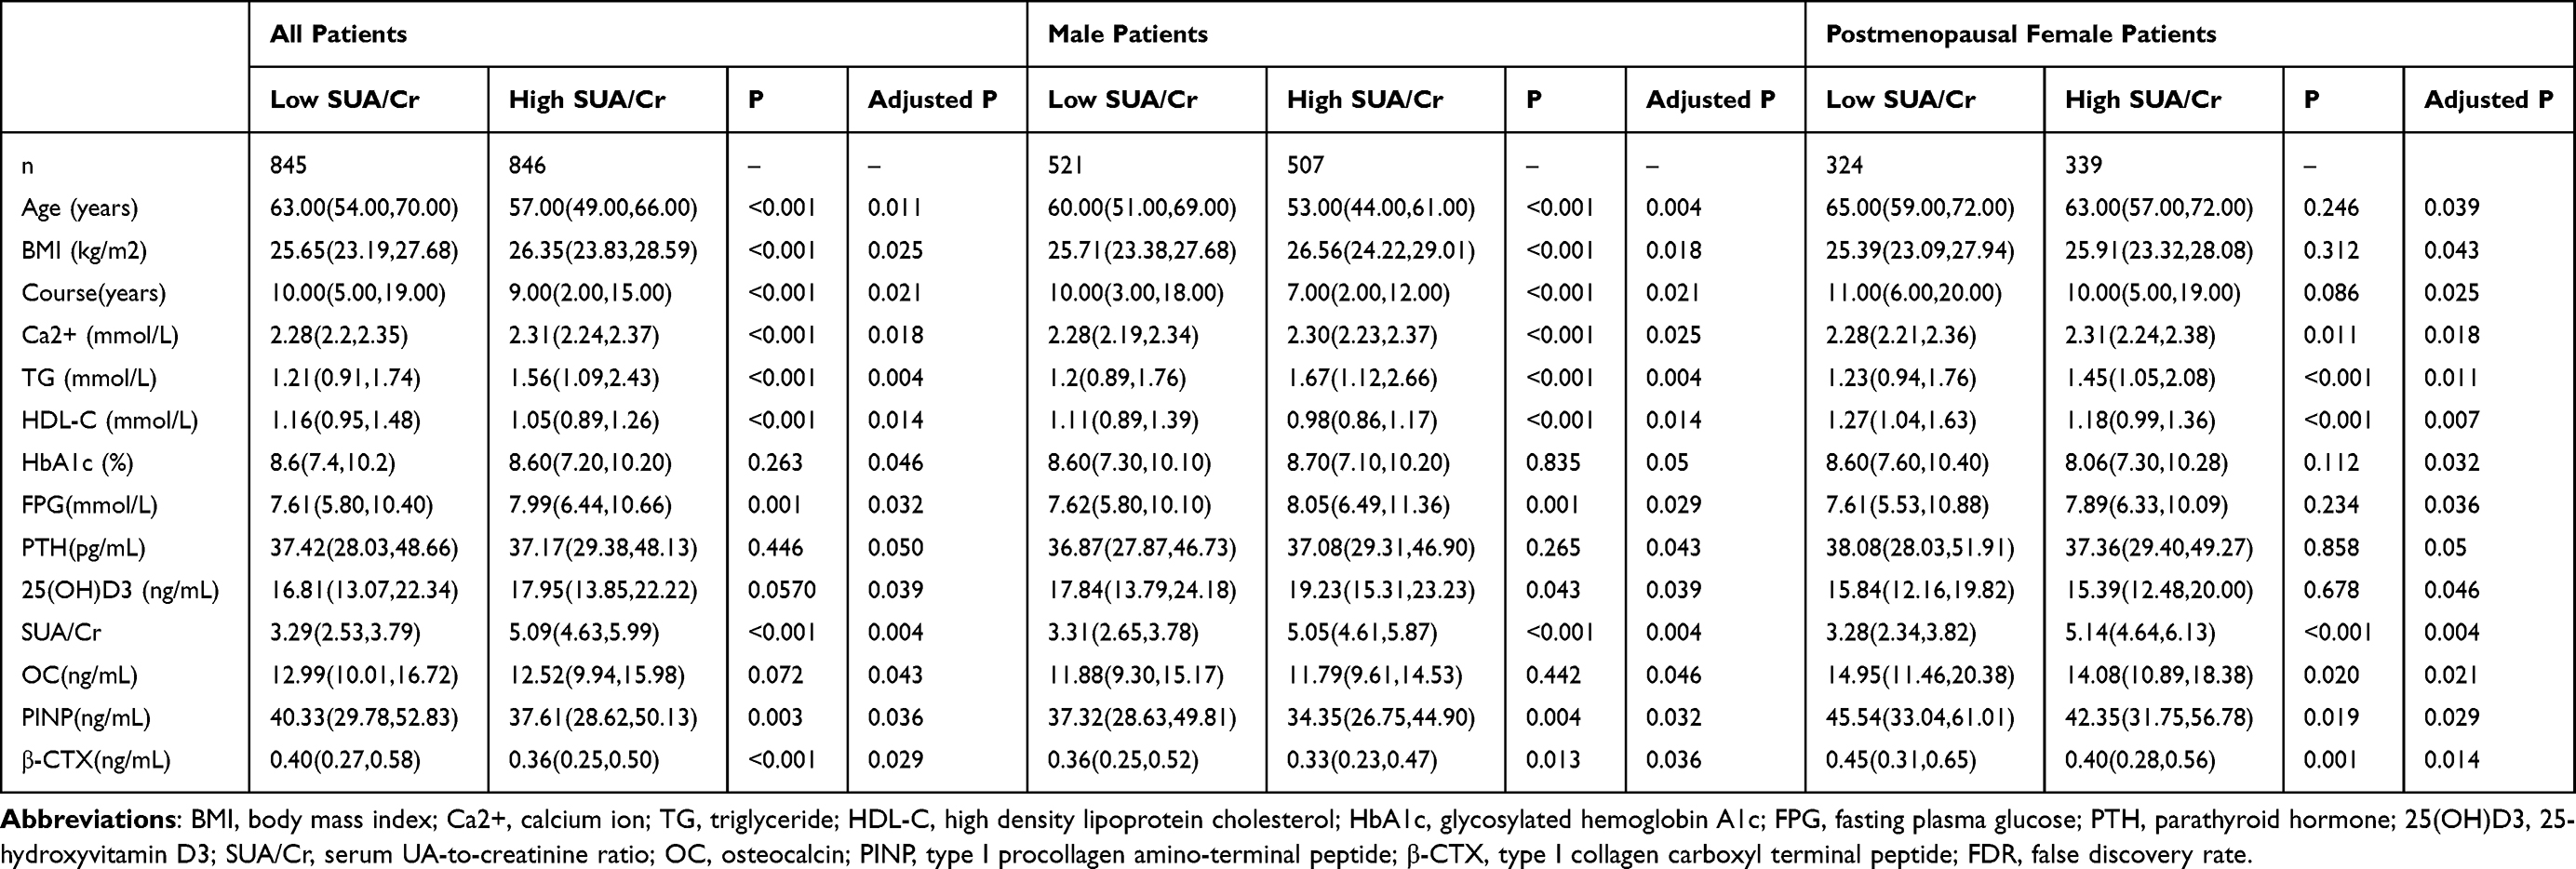 |
Table 2 Comparison of Indicators Between the Low SUA/Cr and High SUA/Cr Groups |
Male patients in the higher SUA/Cr level group had higher BMI, Ca2+, TG, and FPG levels and lower age, cholesterol, HDL-C, PINP, and β-CTX levels compared with those in the lower SUA/Cr level group, with statistically significant differences (Table 2). Postmenopausal female patients with higher SUA/Cr levels had higher Ca2+ and TG levels and lower HDL-C, OC, PINP, and β-CTX levels than those in the lower SUA/Cr level group, with statistically significant differences (Table 2).
Correlation Analysis Results
The correlation results are shown in Figures 2 and 3. SUA/Cr was positively correlated with BMI, Ca2+, TG, and FPG and negatively correlated with age, course, HDL-C, OC, and β-CTX in all patients. SUA/Cr was positively correlated with Ca, TG, and FPG and negatively correlated with age, course, HDL-C, OC, and β-CTX in postmenopausal female patients. SUA/Cr was positively correlated with BMI, Ca2+, TG, 25(OH)D3, and FPG, and negatively correlated with age, course, HDL-C, PINP, and β-CTX in male patients.
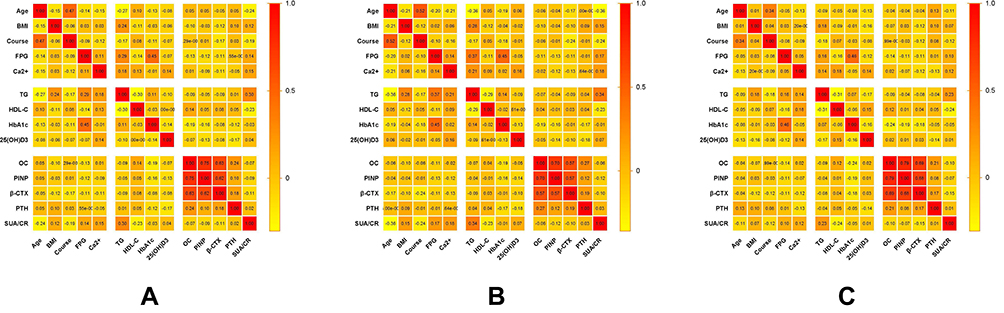 |
Figure 2 Spearman's correlation coefficient matrix illustrating the association between SUA/Cr and baseline patient characteristics in T2DM patients (A) all patients; (B) male patients; (C) postmenopausal female patients. |
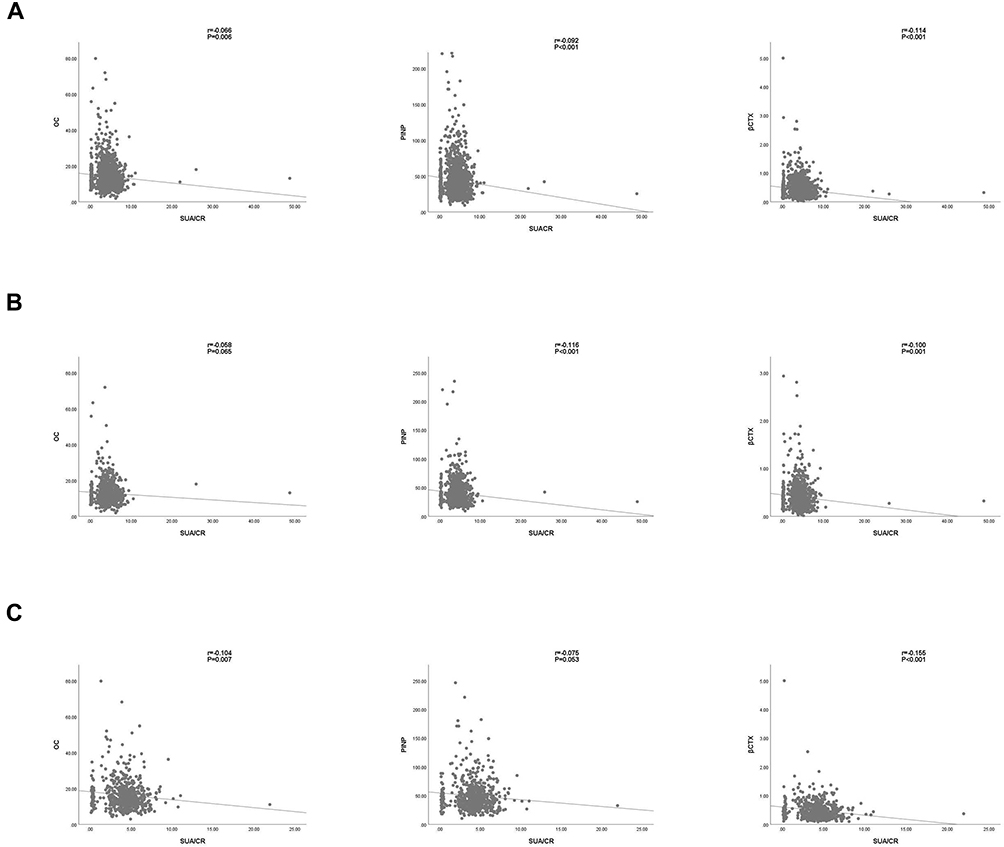 |
Figure 3 The correlation between SUA/Cr and BTMs levels in T2DM participants (A) all patients; (B) male patients; (C) postmenopausal female patients. |
Multivariate Linear Regression Analysis of SUA/Cr and BTMs
Male Patients with T2DM
After adjusting for age, BMI, course, Ca2+, TG, HDL-C, HbA1c, 25(OH)D3, PTH, and FPG (Model III), SUA/Cr was negatively associated with PINP (β = −0.829, P = 0.027) and β-CTX (β = −0.015, P = 0.001). The SUA/Cr ratio was not significantly correlated with OC (β = −0.135, P = 0.193) (Table 3).
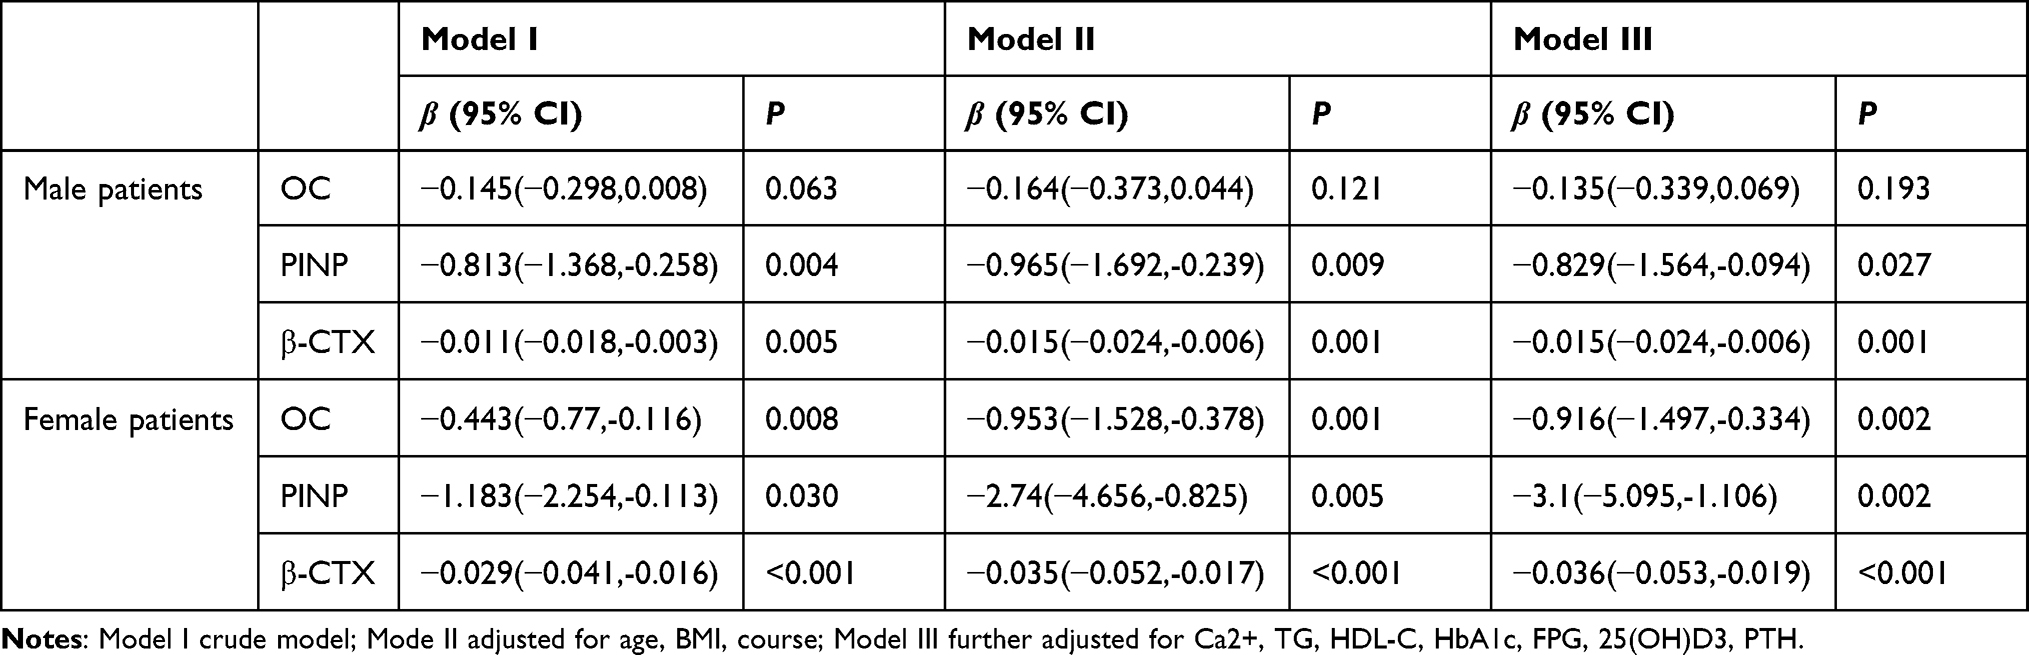 |
Table 3 Correlation of SUA/Cr with BTMs in T2DM Patients |
Postmenopausal Female Patients with T2DM
In the unadjusted model, multiple linear regression analysis demonstrated that SUA/Cr was significantly and inversely correlated with OC, PINP, and β-CTX. After adjusting for potential confounders (Model III), SUA/Cr was only inversely associated with β-CTX (β = −0.036, P < 0.001), OC (β = −0.916, P=0.002), and PINP (β = −3.1, P = 0.002) (Table 3).
Subgroup Analysis
We performed subgroup analyses to determine whether the association between SUA/Cr and BTMs differed according to the presence or absence of non-alcoholic fatty liver disease (NAFLD), 25(OH)D3, course of T2DM, HbA1c, BMI, and TG (Table 4).
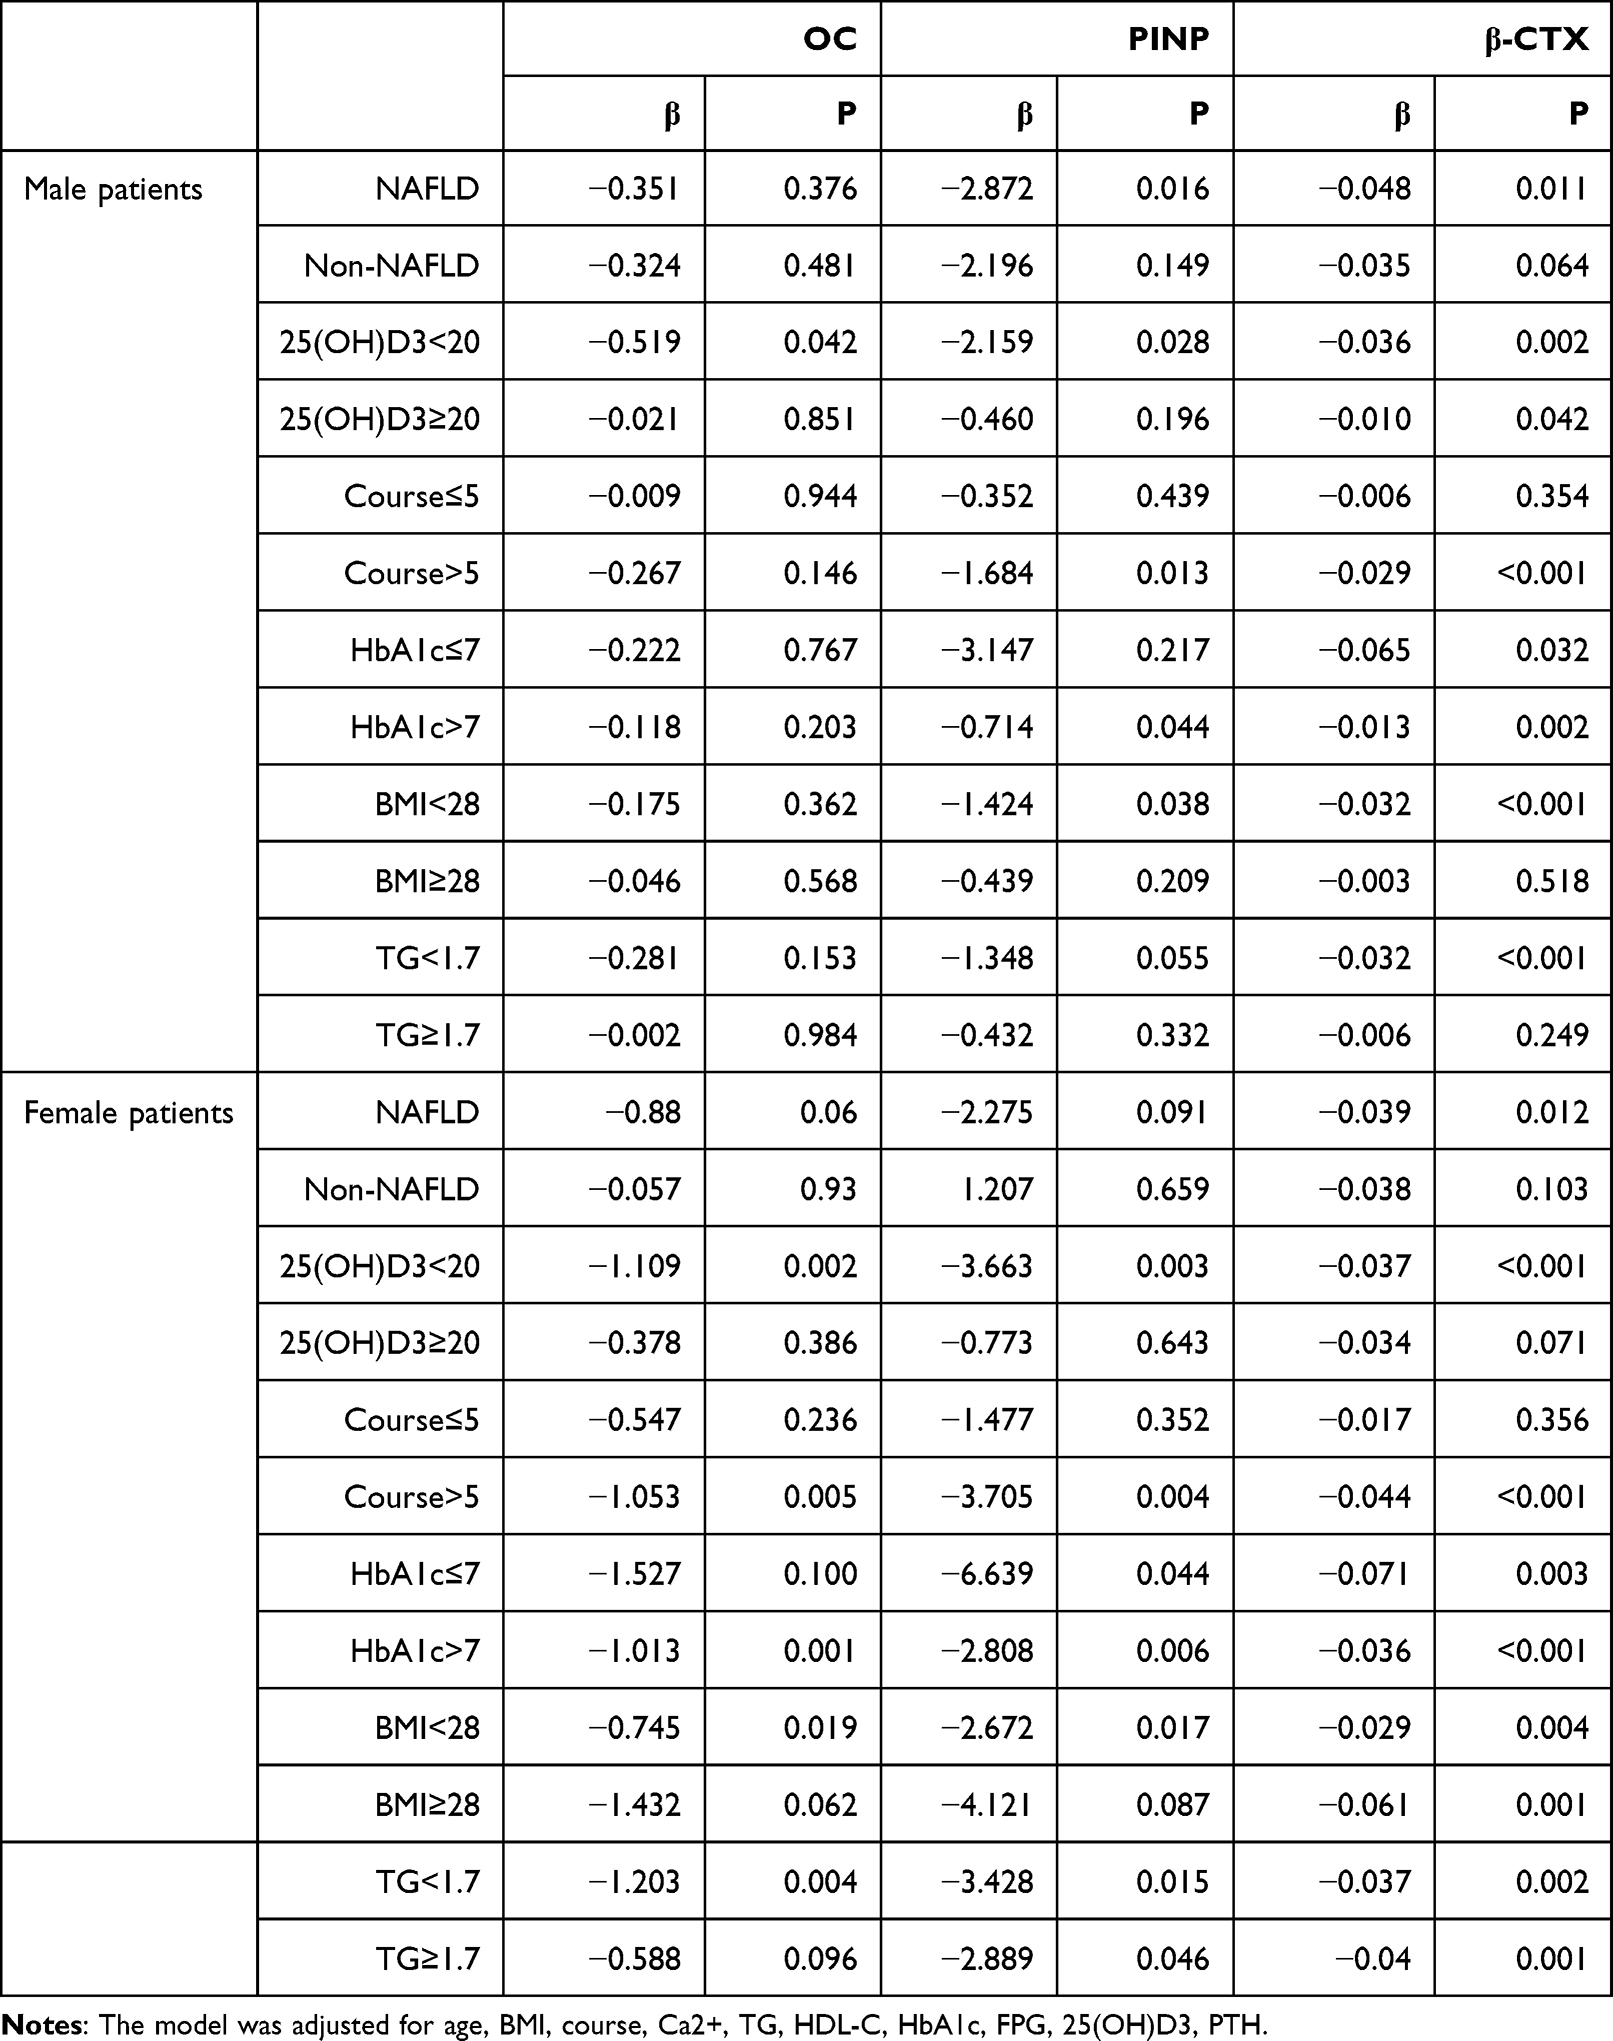 |
Table 4 Subgroup Correlation Analysis of SUA/Cr and BTMs |
Multivariate regression analysis revealed that the SUA/Cr level was significantly negatively associated with BTMs in postmenopausal females with 25(OH)D3 < 20ng/mL, course ≥ 5 years, HbA1c > 7%, or BMI < 28 kg/m2.
Multivariable linear regression analysis showed that, after adjusting for potential confounders, SUA/Cr had a stronger negative relationship with β-CTX and PINP in male patients with NAFLD, 25(OH)D3 < 20ng/mL, course ≥ 5 years, HbA1c > 7%, or BMI < 28 kg/m2.
Mediation Effect of SUA on PINP and β-CTX
Since SUA/Cr was inversely associated with PINP and β-CTX in both genders, we treated triglyceride glucose (TyG) as a mediator and further conducted the mediation analysis to explore the intermediate role of SUA/Cr in BTM association. Both SUA/Cr and TyG were negatively associated with PINP and β-CTX. Simultaneously, SUA/Cr was positively correlated with TyG, suggesting a mechanistic link between SUA/Cr and PINP (β = −0.6662, 95% CI: −1.2497 to 0.0827), possibly explained by TyG (β = −0.1850, 95% CI: −0.3855 to 0.0412). A mediated percentage of 21.84% was observed in this model (Figure 4). There were significant direct (β = −0.012, 95% CI: −0.0194 to 0.051) and indirect effects (β = −0.0031, 95% CI: −0.058 to 0.0014) between SUA/Cr and β-CTX, and TyG mediated 20.26% of this association (Figure 4).
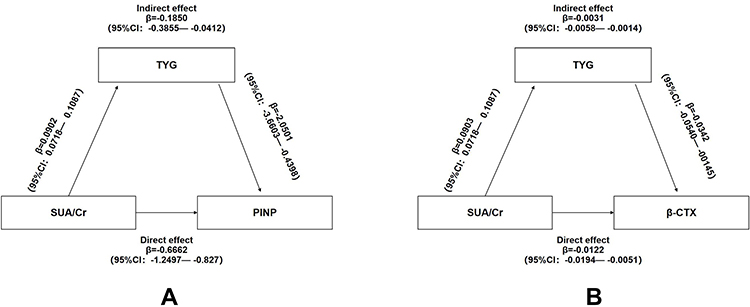 |
Figure 4 Mediation of TYG on the association between SUA/Cr and BTMs (A) PINP; (B) β-CTX. |
Discussion
Bone metabolism is regulated by a balance between the formation of new bone by osteoblasts and the resorption of old bone by osteoclasts, which are enzymes released from osteoclasts or osteoblasts during the bone remodeling process or proteins released from the bone matrix.22,23 Recently, the importance of BTMs that indirectly reflect the process of bone remodeling has been increasing.24 As a result, BTMs have been recognized as a promising tool for assessing bone quality and metabolism by the National Osteoporosis Foundation.25 Specifically, PINP is secreted by osteoblasts during the formation of bone collagen. While OC was a protein marker of osteogenesis secreted by osteoblasts, and β-CTX was a breakdown product during the degradation of mature type I collagen secreted by osteoclasts. Therefore, β-CTX is a marker of bone resorption, whereas OC and PINP indicate bone formation.26,27
Prior studies found that patients with T2DM have a lower rate of bone turnover.28 T2DM could disrupt normal osteocyte function and may affect bone formation and bone resorption to varying degrees.29 Moreover, T2DM and bone disease share many common pathophysiology and epidemiology.30 In the current meta-analysis, both bone formation and resorption markers were decreased in patients with T2DM, suggesting that T2DM was the impaired state of bone metabolism.31 Patients with T2DM have increased fragility fracture risk despite having similar or even higher BMD than that in nondiabetic patients, and that risk is likely increased due to impaired bone quality and strength.32,33 BTMs provide useful information for clinical research on bone health and osteoporosis. Sodium-glucose transport protein 2 (SGLT2) inhibitors improve blood glucose levels by promoting urinary glucose excretion, which may affect urinary calcium excretion and bone metabolism.34 As a metabolic disease, T2DM treatment is complex and requires additional clinical studies to evaluate the influence of these therapies on bone metabolism. None of the patients with diabetes included in the study were taking SGLT-2 inhibitors.
Our findings indicated that BTM levels were diminished in the high SUA/Cr group compared to the low SUA/Cr group. Our data showed that SUA/Cr was negatively associated with PINP and β-CTX in both male patients with T2DM and postmenopausal female patients after adjusting for confounding factors. This study showed that SUA/Cr ratio could reduce bone turnover. Consistent with our findings, Nabipour et al reported that SUA levels were inversely associated with bone absorption markers in old males.35 A cross-sectional study, including 7502 healthy postmenopausal women, found that the higher the level of SUA/Cr, the lower the bone turnover.36 SUA was inversely associated with OC and β-CTX in males, while SUA was only inversely associated with β-CTX in postmenopausal females.37 A meta-analysis showed that PINP, OC, and β-CTX levels were lower among patients with T2DM.31
Previous studies suggested that elevated SUA levels are significantly associated with insulin resistance (IR).38 SUA directly inhibits insulin receptor substrate 1 (IRS1) and insulin/AKT signaling, resulting in IR.39 Huang et al found that IR leads to restrained bone turnover in mice.40 Guo et al found that PINP and β-CTX levels were negatively correlated with the homeostasis model assessment of insulin resistance (HOMA-IR).41 Hyperinsulinemia can itself trigger IR, leading to a vicious cycle of hyperinsulinemia-IR, affecting osteoclasts and osteoblasts via dysfunction of the insulin-signaling cascade.42,43 High insulin levels may increase osteoclast activity, which may affect the balance of bone metabolism and thus increase the risk of fracture in patients with T2DM.44 Furthermore, hyperglycemia may lead to changes in bone structure because of the accumulation of advanced glycosylation end products (AGEs) through translational modification. The occurrence of these reactions in the bone matrix may cause damage to bone structure, affecting bone strength.45–48 Moreover, all these reactions might have led to reduced bone strength, increased bone fragility, and fractures.49 Our finding showed that TyG partly mediated the association between SUA/Cr and PINP and β-CTX.
PINP and β-CTX levels have been reported to be influenced by BMI.50 This study found that among patients with T2DM with a BMI ≥ 28 kg/m2, SUA/Cr was negatively associated with PINP and β-CTX in males and inversely related to OC, PINP, and β-CTX in postmenopausal females. A study in postmenopausal Chinese women showed that bone metabolism differed in patients with T2DM with different BMI levels.51 Some studies have shown that T2DM duration may lead to increased bone fragility and promote the development of T2DM combined with OP.52 The United Kingdom Prospective Diabetes Study (UKPDS) results also showed that longer diabetes duration is associated with a worse prevalence of diabetes complications,53 which would be true for bone health. Furthermore, previous studies have demonstrated that T2DM duration was associated with fracture risk.54 Therefore, we performed subgroup analyses according to T2DM duration. The results showed no correlation between SUA/Cr and BTMs in patients with T2DM with a disease duration of ≤5 years. This was true for both sexes. However, among patients with longer T2DM duration, we observed that SUA/Cr was negatively associated with β-CTX and PINP in males and negatively associated with OC, PINP, and β-CTX in postmenopausal females. Du et al55 showed that the NAFLD group had higher femoral neck and total hip BMD than the non-NAFLD group, suggesting that NAFLD in postmenopausal women with T2DM may reduce the risk of osteoporosis. The analysis was further conducted on subgroups based on the presence or absence of NAFLD. SUA/Cr levels were significantly associated with β-CTX levels in patients with NAFLD. Studies have reported that the correlation coefficients of TyG and HOMA-IR with the euglycemic-glucose clamp were similar, supporting TyG as an accessible and reliable tool for clearly reflecting IR.56,57 Thus, the TyG index has shown a direct correlation with IR and has been proposed as a reliable and simple surrogate marker of IR in clinical practice.58–60 The current findings highlight the mediating role of TyG in the SUA/Cr–BTM relationship. In addition, controlling TyG levels among patients with T2DM may help improve their bone turnover.
Ahn et al36 also suggested that SUA was able to inhibit osteoclastogenesis in a dose-dependent manner and decrease reactive oxygen species (ROS) production of osteoclast precursors, revealing that SUA may directly contribute to the pathogenesis of osteoporosis as a consequence of its antioxidant properties. In experimental studies, oxidative stress has recently been identified as a potential mechanism for the inhibition of osteoblastic cells, resulting in the suppression of bone formation.61,62 Previous studies suggested a possible association between oxidative stress and diabetes-related bone fragility.63 UA stimulates inflammation through the production of p38 mitogen-activated protein kinases (MAPK), cyclooxygenase-2 (COX-2), and chemokine monocyte chemoattractant protein-1. SUA is positively associated with interleukin-18 (IL-18), interleukin-6 (IL-6), and tumor necrosis factor-α (TNF-α).64,65 UA was known to induce systemic inflammation.66,67 It has been reported that hyperglycemia would alter the release and function of IL (especially interleukin-1 and IL-6).68,69 The levels of proinflammatory cytokines associated with increased fracture risk, such as C-reactive protein (CRP) and TNF-α, are high in patients with T2DM.70,71 The downstream target of these cytokines is nuclear factor κ-light-chain-enhancer of activated B cells (NFκB), which mediates certain aspects of bone physiology.72
Higher UA levels were associated with a significant decrease in tartrate-resistant acid phosphatase-5b (TRACP-5b), a new marker of bone resorption,73 and urinary NTX-1, a marker of osteoclast activation.36 Moreover, UA can promote osteogenic differentiation and inhibit the differentiation of human bone marrow mesenchymal stem cells into adipocytes.74
In the present study, we found a significant negative relationship between SUA/Cr and BTMs among men and postmenopausal women with T2DM, which perhaps indicates that physicians should pay greater attention to the bone health of these T2DM patients with high levels of SUA/Cr, for early detection of osteoporosis in clinical practice. The strength of our study is the large patient sample and the application of mediation analysis to explore whether IR mediated the association between SUA/Cr and BTMs. Our study has some limitations. First, the change in BTMs and the occurrence of osteoporotic fractures over time could not be evaluated without long-term follow-up. Therefore, we could not infer a causal relationship. Our cross-sectional findings need to be confirmed prospectively. Moreover, patients were only tested once with SUA/Cr and BTMs. Third, although we tried our best to control the confounding factors, the lack of drinking, smoking, fruit and vegetable consumption, physical activity and other potential confounding factors may affect the bone health. Therefore, further investigation is certainly necessary to characterize these factors. Although the limitations further influence the accuracy of the present study, it can still be considered that the bone turnover of T2DM patients with high SUA/Cr level is impaired, which means it leads to a higher risk of osteoporosis.
Conclusions
SUA/Cr was negatively correlated with PINP and β-CTX in male and postmenopausal female patients with T2DM, and IR partly mediated this association.
Data Sharing Statement
The original data can be available by email at any time (Yuling Xing: [email protected]).
Disclosure
The authors report no conflicts of interest in this work.
References
1. Saeedi P, Petersohn I, Salpea P., et al. Global and regional diabetes prevalence estimates for 2019 and projections for 2030 and 2045: results from the International Diabetes Federation Diabetes Atlas, 9(th) edition. Diabetes Res Clin Pract. 2019;157:107843. doi:10.1016/j.diabres.2019.107843
2. Kim B, Lee SH, Song SJ, et al. Protective effects of melon extracts on bone strength, mineralization, and metabolism in rats with ovariectomy-induced osteoporosis. Antioxidants. 2019;8(8):306. doi:10.3390/antiox8080306
3. Das S, Crockett JC. Osteoporosis - a current view of pharmacological prevention and treatment. Drug Des Devel Ther. 2013;7:435–448. doi:10.2147/DDDT.S31504
4. Qu B, Ma Y, Yan M, et al. The economic burden of fracture patients with osteoporosis in western China. Osteoporos Int. 2014;25(7):1853–1860. doi:10.1007/s00198-014-2699-0
5. Si Y, Wang C, Guo Y, Xu G, Ma Y. Prevalence of osteoporosis in patients with type 2 diabetes mellitus in the Chinese Mainland: a systematic review and meta-analysis. Iran J Public Health. 2019;48(7):1203–1214.
6. Oei L, Rivadeneira F, Zillikens MC, Oei EH. Diabetes, diabetic complications, and fracture risk. Curr Osteoporos Rep. 2015;13(2):106–115. doi:10.1007/s11914-015-0260-5
7. Hu F, Jiang C, Shen J, Tang P, Wang Y. Preoperative predictors for mortality following Hip fracture surgery: a systematic review and meta-analysis. Injury. 2012;43(6):676–685. doi:10.1016/j.injury.2011.05.017
8. Dong XW, Tian HY, He J, Wang C, Qiu R, Chen YM. Elevated serum uric acid is associated with greater bone mineral density and skeletal muscle mass in middle-aged and older adults. PLoS One. 2016;11(5):e0154692. doi:10.1371/journal.pone.0154692
9. Yan DD, Wang J, Hou XH, et al. Association of serum uric acid levels with osteoporosis and bone turnover markers in a Chinese population. Acta Pharmacol Sin. 2018;39(4):626–632. doi:10.1038/aps.2017.165
10. Zhao DD, Jiao PL, Yu JJ, et al. Higher serum uric acid is associated with higher bone mineral density in Chinese men with type 2 diabetes mellitus. Int J Endocrinol. 2016;2016:2528956. doi:10.1155/2016/2528956
11. Tanaka KI, Kanazawa I, Notsu M, Sugimoto T. Higher serum uric acid is a risk factor of vertebral fractures in postmenopausal women with type 2 diabetes mellitus. Exp Clin Endocrinol Diabetes. 2020;128(1):66–71. doi:10.1055/a-0815-4954
12. Vestergaard P. Discrepancies in bone mineral density and fracture risk in patients with type 1 and type 2 diabetes--a meta-analysis. Osteoporos Int. 2007;18(4):427–444. doi:10.1007/s00198-006-0253-4
13. Cabral HW, Andolphi BF, Ferreira BV, et al. The use of biomarkers in clinical osteoporosis. Rev Assoc Med Bras. 2016;62(4):368–376. doi:10.1590/1806-9282.62.04.368
14. Wu D, Cline-Smith A, Shashkova E, Perla A, Katyal A, Aurora R. T-cell mediated inflammation in postmenopausal osteoporosis. Front Immunol. 2021;12:687551. doi:10.3389/fimmu.2021.687551
15. Taslamacioglu Duman T, Zahid Kocak M, Meryem Atak B, et al. Serum Uric acid is correlated with HbA1c levels in type 2 diabetes mellitus. Exp Biomed Res. 2018;1(1):6–9. doi:10.30714/j-ebr.2018136918
16. Kocak MZ, Aktas G, Duman TT, Atak BM, Savli H. Is uric acid elevation a random finding or a causative agent of diabetic nephropathy? Rev Assoc Med Bras. 2019;65(9):1155–1160. doi:10.1590/1806-9282.65.9.1156
17. Aktas G, Khalid A, Kurtkulagi O, et al. Poorly controlled hypertension is associated with elevated serum uric acid to HDL-cholesterol ratio: a cross-sectional cohort study. Postgrad Med. 2022;134(3):297–302. doi:10.1080/00325481.2022.2039007
18. Kosekli MA, Kurtkulagii O, Kahveci G, et al. The association between serum uric acid to high density lipoprotein-cholesterol ratio and non-alcoholic fatty liver disease: the abund study. Rev Assoc Med Bras. 2021;67(4):549–554. doi:10.1590/1806-9282.20201005
19. Kurtkulagi O, Tel BMA, Kahveci G, et al. Hashimoto’s thyroiditis is associated with elevated serum uric acid to high density lipoprotein-cholesterol ratio. Rom J Intern Med. 2021;59(4):403–408. doi:10.2478/rjim-2021-0023
20. Kocak MZ, Aktas G, Erkus E, Sincer I, Atak B, Duman T. Serum uric acid to HDL-cholesterol ratio is a strong predictor of metabolic syndrome in type 2 diabetes mellitus. Rev Assoc Med Bras. 2019;65(1):9–15. doi:10.1590/1806-9282.65.1.9
21. Aktas G, Kocak MZ, Bilgin S, Atak BM, Duman TT, Kurtkulagi O. Uric acid to HDL cholesterol ratio is a strong predictor of diabetic control in men with type 2 diabetes mellitus. Aging Male. 2020;23(5):1098–1102. doi:10.1080/13685538.2019.1678126
22. Eastell R, Szulc P. Use of bone turnover markers in postmenopausal osteoporosis. Lancet Diabetes Endocrinol. 2017;5(11):908–923. doi:10.1016/S2213-8587(17)30184-5
23. Fontalis A, Eastell R. The challenge of long-term adherence: the role of bone turnover markers in monitoring bisphosphonate treatment of osteoporosis. Bone. 2020;136:115336. doi:10.1016/j.bone.2020.115336
24. Bauer D, Krege J, Lane N, et al. National bone health alliance bone turnover marker project: current practices and the need for US harmonization, standardization, and common reference ranges. Osteoporos Int. 2012;23(10):2425–2433. doi:10.1007/s00198-012-2049-z
25. Cosman F, de Beur SJ, LeBoff MS, et al. Clinician’s guide to prevention and treatment of osteoporosis. Osteoporos Int. 2014;25(10):2359–2381. doi:10.1007/s00198-014-2794-2
26. Greenblatt MB, Tsai JN, Wein MN. Bone turnover markers in the diagnosis and monitoring of metabolic bone disease. Clin Chem. 2017;63(2):464–474. doi:10.1373/clinchem.2016.259085
27. Halleen JM, Tiitinen SL, Ylipahkala H, Fagerlund KM, Väänänen HK. Tartrate-resistant acid phosphatase 5b (TRACP 5b) as a marker of bone resorption. Clin Lab. 2006;52(9–10):499–509.
28. Kunutsor SK, Apekey TA, Laukkanen JA. Association of serum total osteocalcin with type 2 diabetes and intermediate metabolic phenotypes: systematic review and meta-analysis of observational evidence. Eur J Epidemiol. 2015;30(8):599–614. doi:10.1007/s10654-015-0058-x
29. Picke AK, Campbell G, Napoli N, Hofbauer LC, Rauner M. Update on the impact of type 2 diabetes mellitus on bone metabolism and material properties. Endocr Connect. 2019;8(3):R55–r70. doi:10.1530/EC-18-0456
30. Kasperk C, Georgescu C, Nawroth P. Diabetes mellitus and bone metabolism. Exp Clin Endocrinol Diabetes. 2017;125(4):213–217. doi:10.1055/s-0042-123036
31. Hygum K, Starup-Linde J, Harsløf T, Vestergaard P, Langdahl BL. Mechanisms in endocrinology: diabetes mellitus, a state of low bone turnover - a systematic review and meta-analysis. Eur J Endocrinol. 2017;176(3):R137–r157. doi:10.1530/EJE-16-0652
32. Compston J. Type 2 diabetes mellitus and bone. J Intern Med. 2018;283(2):140–153. doi:10.1111/joim.12725
33. Oei L, Zillikens MC, Dehghan A, et al. High bone mineral density and fracture risk in type 2 diabetes as skeletal complications of inadequate glucose control: the Rotterdam Study. Diabetes Care. 2013;36(6):1619–1628. doi:10.2337/dc12-1188
34. Watts NB, Bilezikian JP, Usiskin K, et al. Effects of canagliflozin on fracture risk in patients with type 2 diabetes mellitus. J Clin Endocrinol Metab. 2016;101(1):157–166. doi:10.1210/jc.2015-3167
35. Nabipour I, Sambrook PN, Blyth FM, et al. Serum uric acid is associated with bone health in older men: a cross-sectional population-based study. J Bone Miner Res. 2011;26(5):955–964. doi:10.1002/jbmr.286
36. Ahn SH, Lee SH, Kim BJ, et al. Higher serum uric acid is associated with higher bone mass, lower bone turnover, and lower prevalence of vertebral fracture in healthy postmenopausal women. Osteoporos Int. 2013;24(12):2961–2970. doi:10.1007/s00198-013-2377-7
37. Xu M, Su J, Hao J, et al. Positive association between serum uric acid and bone mineral density in Chinese type 2 diabetes mellitus stratified by gender and BMI. J Bone Miner Metab. 2018;36(5):609–619. doi:10.1007/s00774-017-0877-9
38. Hwang IC, Suh SY, Suh AR, Ahn HY. The relationship between normal serum uric acid and nonalcoholic fatty liver disease. J Korean Med Sci. 2011;26(3):386–391. doi:10.3346/jkms.2011.26.3.386
39. Zhu Y, Hu Y, Huang T, et al. High uric acid directly inhibits insulin signalling and induces insulin resistance. Biochem Biophys Res Commun. 2014;447(4):707–714. doi:10.1016/j.bbrc.2014.04.080
40. Huang S, Kaw M, Harris MT, et al. Decreased osteoclastogenesis and high bone mass in mice with impaired insulin clearance due to liver-specific inactivation to CEACAM1. Bone. 2010;46(4):1138–1145. doi:10.1016/j.bone.2009.12.020
41. Guo H, Wang C, Jiang B, et al. Association of insulin resistance and β-cell function with bone turnover biomarkers in dysglycemia patients. Front Endocrinol. 2021;12:554604. doi:10.3389/fendo.2021.554604
42. Liu JM, Rosen CJ, Ducy P, Kousteni S, Karsenty G. Regulation of glucose handling by the skeleton: insights from mouse and human studies. Diabetes. 2016;65(11):3225–3232. doi:10.2337/db16-0053
43. Salsali A, Nathan M. A review of types 1 and 2 diabetes mellitus and their treatment with insulin. Am J Ther. 2006;13(4):349–361. doi:10.1097/00045391-200607000-00012
44. Zhang W, Shen X, Wan C, et al. Effects of insulin and insulin-like growth factor 1 on osteoblast proliferation and differentiation: differential signalling via Akt and ERK. Cell Biochem Funct. 2012;30(4):297–302. doi:10.1002/cbf.2801
45. Strollo R, Rizzo P, Spoletini M, et al. HLA-dependent autoantibodies against post-translationally modified collagen type II in type 1 diabetes mellitus. Diabetologia. 2013;56(3):563–572. doi:10.1007/s00125-012-2780-1
46. Wongdee K, Charoenphandhu N. Update on type 2 diabetes-related osteoporosis. World J Diabetes. 2015;6(5):673–678. doi:10.4239/wjd.v6.i5.673
47. Moayeri A, Mohamadpour M, Mousavi SF, Shirzadpour E, Mohamadpour S, Amraei M. Fracture risk in patients with type 2 diabetes mellitus and possible risk factors: a systematic review and meta-analysis. Ther Clin Risk Manag. 2017;13:455–468. doi:10.2147/TCRM.S131945
48. Epstein S, Defeudis G, Manfrini S, Napoli N, Pozzilli P. Diabetes and disordered bone metabolism (diabetic osteodystrophy): time for recognition. Osteoporos Int. 2016;27(6):1931–1951. doi:10.1007/s00198-015-3454-x
49. Huebschmann AG, Regensteiner JG, Vlassara H, Reusch JE. Diabetes and advanced glycoxidation end products. Diabetes Care. 2006;29(6):1420–1432. doi:10.2337/dc05-2096
50. Weinbrenner T, Zittermann A, Gouni-Berthold I, Stehle P, Berthold HK. Body mass index and disease duration are predictors of disturbed bone turnover in anorexia nervosa. A case-control study. Eur J Clin Nutr. 2003;57(10):1262–1267. doi:10.1038/sj.ejcn.1601683
51. Zhou Y, Li Y, Zhang D, Wang J, Yang H. Prevalence and predictors of osteopenia and osteoporosis in postmenopausal Chinese women with type 2 diabetes. Diabetes Res Clin Pract. 2010;90(3):261–269. doi:10.1016/j.diabres.2010.09.013
52. de Liefde II, van der Klift M, de Laet CE, van Daele PL, Hofman A, Pols HA. Bone mineral density and fracture risk in type-2 diabetes mellitus: the Rotterdam Study. Osteoporos Int. 2005;16(12):1713–1720. doi:10.1007/s00198-005-1909-1
53. UK Prospective Diabetes Study (UKPDS) Group. Effect of intensive blood-glucose control with metformin on complications in overweight patients with type 2 diabetes (UKPDS 34). Lancet. 1998;352(9131):854–865. doi:10.1016/S0140-6736(98)07037-8
54. Majumdar SR, Leslie WD, Lix LM, et al. Longer duration of diabetes strongly impacts fracture risk assessment: the Manitoba BMD cohort. J Clin Endocrinol Metab. 2016;101(11):4489–4496. doi:10.1210/jc.2016-2569
55. Du YJ, Liu NN, Zhong X, Pan TR. Risk factors for nonalcoholic fatty liver disease in postmenopausal women with type 2 diabetes mellitus and the correlation with bone mineral density at different locations. Diabetes Metab Syndr Obes. 2022;15:1925–1934. doi:10.2147/DMSO.S364804
56. Bonora E, Targher G, Alberiche M, et al. Homeostasis model assessment closely mirrors the glucose clamp technique in the assessment of insulin sensitivity: studies in subjects with various degrees of glucose tolerance and insulin sensitivity. Diabetes Care. 2000;23(1):57–63. doi:10.2337/diacare.23.1.57
57. Vasques AC, Novaes FS, de Oliveira Mda S, et al. TyG index performs better than HOMA in a Brazilian population: a hyperglycemic clamp validated study. Diabetes Res Clin Pract. 2011;93(3):e98–e100. doi:10.1016/j.diabres.2011.05.030
58. Bloomgarden ZT. Diabetic nephropathy. Diabetes Care. 2005;28(3):745–751. doi:10.2337/diacare.28.3.745
59. Gross JL, de Azevedo MJ, Silveiro SP, Canani LH, Caramori ML, Zelmanovitz T. Diabetic nephropathy: diagnosis, prevention, and treatment. Diabetes Care. 2005;28(1):164–176. doi:10.2337/diacare.28.1.164
60. Luo P, Cao Y, Li P, et al. TyG index performs better than HOMA-IR in Chinese type 2 diabetes mellitus with a BMI < 35 kg/m(2): a hyperglycemic clamp validated study. Medicina. 2022;58(7). doi:10.3390/medicina58070876
61. Almeida M, Han L, Martin-Millan M, O’Brien CA, Manolagas SC. Oxidative stress antagonizes Wnt signaling in osteoblast precursors by diverting beta-catenin from T cell factor- to forkhead box O-mediated transcription. J Biol Chem. 2007;282(37):27298–27305. doi:10.1074/jbc.M702811200
62. Dalbeth N, Smith T, Nicolson B, et al. Enhanced osteoclastogenesis in patients with tophaceous gout: urate crystals promote osteoclast development through interactions with stromal cells. Arthritis Rheum. 2008;58(6):1854–1865. doi:10.1002/art.23488
63. Napoli N, Chandran M, Pierroz DD, Abrahamsen B, Schwartz AV, Ferrari SL. Mechanisms of diabetes mellitus-induced bone fragility. Nat Rev Endocrinol. 2017;13(4):208–219. doi:10.1038/nrendo.2016.153
64. Yamada T, Suzuki S, Fukatsu M, Wada T, Yoshida T, Joh T. Elevated serum uric acid is an independent risk factor for nonalcoholic fatty liver disease in Japanese undergoing a health checkup. Acta Gastroenterol Belg. 2010;73(1):12–17.
65. Lanaspa MA, Sanchez-Lozada LG, Cicerchi C, et al. Uric acid stimulates fructokinase and accelerates fructose metabolism in the development of fatty liver. PLoS One. 2012;7(10):e47948. doi:10.1371/journal.pone.0047948
66. Sautin YY, Nakagawa T, Zharikov S, Johnson RJ. Adverse effects of the classic antioxidant uric acid in adipocytes: NADPH oxidase-mediated oxidative/nitrosative stress. Am J Physiol Cell Physiol. 2007;293(2):C584–596. doi:10.1152/ajpcell.00600.2006
67. Ghaemi-Oskouie F, Shi Y. The role of uric acid as an endogenous danger signal in immunity and inflammation. Curr Rheumatol Rep. 2011;13(2):160–166. doi:10.1007/s11926-011-0162-1
68. Hill JR, Kwon G, Marshall CA, McDaniel ML. Hyperglycemic levels of glucose inhibit interleukin 1 release from RAW 264.7 murine macrophages by activation of protein kinase C. J Biol Chem. 1998;273(6):3308–3313. doi:10.1074/jbc.273.6.3308
69. Spindler MP, Ho AM, Tridgell D, et al. Acute hyperglycemia impairs IL-6 expression in humans. Immun Inflamm Dis. 2016;4(1):91–97. doi:10.1002/iid3.97
70. Gonzalez Y, Herrera MT, Soldevila G, et al. High glucose concentrations induce TNF-α production through the down-regulation of CD33 in primary human monocytes. BMC Immunol. 2012;13:19. doi:10.1186/1471-2172-13-19
71. Nesto R. C-reactive protein, its role in inflammation, Type 2 diabetes and cardiovascular disease, and the effects of insulin-sensitizing treatment with thiazolidinediones. Diabet Med. 2004;21(8):810–817. doi:10.1111/j.1464-5491.2004.01296.x
72. Boyce BF, Yao Z, Xing L. Functions of nuclear factor kappaB in bone. Ann N Y Acad Sci. 2010;1192:367–375. doi:10.1111/j.1749-6632.2009.05315.x
73. Wu ZQ, Zhang Y, Xie E, et al. High uric acid (UA) negatively affects serum tartrate-resistant acid phosphatase 5b (TRACP 5b) Immunoassay. PLoS One. 2016;11(1):e0147554. doi:10.1371/journal.pone.0147554
74. Li HZ, Chen Z, Hou CL, Tang YX, Wang F, Fu QG. Uric acid promotes osteogenic differentiation and inhibits adipogenic differentiation of human bone mesenchymal stem cells. J Biochem Mol Toxicol. 2015;29(8):382–387. doi:10.1002/jbt.21707
 © 2022 The Author(s). This work is published and licensed by Dove Medical Press Limited. The
full terms of this license are available at https://www.dovepress.com/terms
and incorporate the Creative Commons Attribution
- Non Commercial (unported, 3.0) License.
By accessing the work you hereby accept the Terms. Non-commercial uses of the work are permitted
without any further permission from Dove Medical Press Limited, provided the work is properly
attributed. For permission for commercial use of this work, please see paragraphs 4.2 and 5 of our Terms.
© 2022 The Author(s). This work is published and licensed by Dove Medical Press Limited. The
full terms of this license are available at https://www.dovepress.com/terms
and incorporate the Creative Commons Attribution
- Non Commercial (unported, 3.0) License.
By accessing the work you hereby accept the Terms. Non-commercial uses of the work are permitted
without any further permission from Dove Medical Press Limited, provided the work is properly
attributed. For permission for commercial use of this work, please see paragraphs 4.2 and 5 of our Terms.
Recommended articles
Novel Associations of Dyslipidaemia with Vitamin D and Bone Metabolism in Elderly Patients with Diabetes: A Cross-Sectional Study
Zha K, Wang N, Zhou Y, Ying R, Gu T, Zhao Y, Guo H, An Z, Lu Y
Diabetes, Metabolic Syndrome and Obesity 2023, 16:2939-2950
Published Date: 22 September 2023