")
Back to Journals » Diabetes, Metabolic Syndrome and Obesity » Volume 16
Relationship Between Six Insulin Resistance Surrogates and Nonalcoholic Fatty Liver Disease Among Older Adults: A Cross-Sectional Study
Authors Li H, Shi Z, Chen X, Wang J, Ding J, Geng S, Sheng X, Shi S
Received 24 February 2023
Accepted for publication 31 May 2023
Published 7 June 2023 Volume 2023:16 Pages 1685—1696
DOI https://doi.org/10.2147/DMSO.S409983
Checked for plagiarism Yes
Review by Single anonymous peer review
Peer reviewer comments 2
Editor who approved publication: Professor Gian Paolo Fadini
Haojie Li,1 Zhan Shi,2 Xuejiao Chen,1 Junjie Wang,1 Jiacheng Ding,1 Shuoji Geng,1 Xinyuan Sheng,1 Songhe Shi1
1Department of Epidemiology and Health Statistics, College of Public Health, Zhengzhou University, Zhengzhou, Henan, People’s Republic of China; 2Department of Pharmacy, Zhengzhou People’s Hospital, Zhengzhou, Henan, People’s Republic of China
Correspondence: Songhe Shi, Department of Epidemiology and Health Statistics, College of Public Health, Zhengzhou University, No. 100 Science Avenue, Zhengzhou, Henan, People’s Republic of China, Email [email protected]
Background: Non-alcoholic fatty liver disease (NAFLD) represents a large and growing public health problem. Insulin resistance (IR) plays a crucial role in the pathogenesis of NAFLD. The aim of this study was to determine the association of triglyceride-glucose (TyG) index, TyG index with body mass index (TyG-BMI), lipid accumulation product (LAP), visceral adiposity index (VAI), triglycerides/high-density lipoprotein cholesterol ratio (TG/HDL-c) and metabolic score for IR (METS-IR) with NAFLD in older adults and to compare the discriminatory abilities of these six IR surrogates for NAFLD.
Methods: This cross-sectional study included 72,225 subjects aged ≥ 60 years living in Xinzheng, Henan Province, from January 2021 to December 2021. The data were collected from the annual health examination dataset. Logistic regression models were used to examine the relationships between the six indicators and NAFLD risk. The area under the receiver operating characteristic curve (AUC) was used to compare the discriminatory ability of different IR surrogates for NAFLD under the influence of potential risk factors.
Results: After adjusting for multiple covariates, compared with the first quintile, the odds ratios (ORs) and 95% confidence intervals (CIs) of the highest quintiles of TyG-BMI were the most obvious (OR:43.02, 95% CI:38.89– 47.72), followed by the METS-IR (OR:34.49, 95% CI:31.41– 37.95). Restricted cubic spline analysis reported that there were non-linear positive association and dose-response relationship between 6 IR surrogates and NAFLD risk. Compared with other IR-related indicators (LAP, TyG, TG/HDL-c and VAI), TyG-BMI showed the highest AUC (AUC:0.8059;95% CI:0.8025– 0.8094). Additionally, METS-IR also had a high predictive performance for NAFLD, and the AUC was greater than 0.75 (AUC:0.7959;95% CI:0.7923– 0.7994).
Conclusion: TyG-BMI and METS-IR had pronounced discrimination ability to NAFLD, which are recommended as complementary markers for the assessment of NAFLD risk both in clinic and in future epidemiological studies.
Keywords: non-alcoholic fatty liver disease, insulin resistance surrogates, triglyceride-glucose index with body mass index, metabolic score for insulin resistance
Introduction
Non-alcoholic fatty liver disease (NAFLD) represents the predominant hepatopathy, a potentially progressive liver disease that can lead to cirrhosis, hepatocellular carcinoma, liver transplantation, and death.1 Currently, the global prevalence of NAFLD in the general population has been estimated at 25%, and there is currently no effective treatment of NAFLD.2–4 NAFLD represents a large and growing public health problem and increasing cases of advanced liver disease and liver-related mortality in the coming years.5 With the highest growth in China as a result of urbanization over the last 20 years, NAFLD has become the most prevalent liver disorder in China but has not received sufficient attention. A large number of patients remain undiagnosed and untreated because of the inadequacy of diagnostic tools and the absence of effective pharmacologic therapies.6–8 In this context, early identification of specific populations at potential risk of developing NAFLD is essential for lowering disability and mortality associated with NAFLD.
Substantial evidence suggests that a crucial role in the pathogenetic mechanisms of NAFLD is played by insulin resistance (IR) through reductions in whole-body, hepatic, and adipose tissue insulin sensitivity.2,4 Many studies invariably demonstrated that NAFLD is closely associated with IR, and IR is the alteration to be detected when screening for NAFLD.9,10 Modulation of IR represents is a potential therapeutic strategy to treat NAFLD,3,11 suggesting that IR may serve as an adjunctive tool to identify individuals at risk for NAFLD. The hyperinsulinemic-euglycemic clamp test (HEC) is considered to be the “gold standard” measure of evaluating insulin sensitivity.12 However, HEC is costly, complex, time consuming and invasive, and requires trained staff. The HEC is currently not ideal for routine clinical monitoring, so simpler and more practical surrogate measures of insulin sensitivity are necessary in large-scale studies. Previously, several studies have explored methods that can easily predict IR and they proposed various non-insulin-based fasting IR indicators, namely, IR surrogates, including the triglyceride-glucose (TyG) index,13,14 TyG index with body mass index (TyG-BMI),15 lipid accumulation product (LAP),16,17 visceral adiposity index (VAI),18 triglycerides/high-density lipoprotein cholesterol ratio (TG/HDL-c),19,20 and metabolic score for IR (METS-IR).21 IR surrogates are calculated from lipid parameters and related indexes. To some extent, their discoveries have addressed the difficulties in identifying IR patients.
Recently, several studies among different populations have investigated the association of IR surrogates and the risk of NAFLD, and they have consistently revealed that higher IR surrogates were strongly associated with the risk of NAFLD.22–26 However, few studies explored the precise dose-response relationship and the differences between different IR surrogates and NAFLD risk in older adults. Therefore, this study with a large sample in central China among older adults that involved six IR surrogates (TyG, TyG-BMI, LAP, VAI, TG/HDL-c and METS-IR) was conducted, aiming to further identify the association of these six IR surrogates with the prevalence of NAFLD, which would provide a great convenience for rapid screening of NAFLD.
Methods
Study Population
The present study was a population-based, cross-sectional study. Data originated from the residents’ electronic health records in the Xinzheng Hospital Information System from January to December 2021. The electronic health records of residents mainly include included three components: questionnaire surveys and anthropometric and laboratory measurements. At the start of the study, 82,466 adults aged ≥60 were eligible for the study. From the 82,466 participants, we initially excluded 8649 participants who had incomplete baseline data on smoking, drinking, exercise, marriage, resting heart rate (RHR), body mass index (BMI), Waist Circumference (WC), fasting plasma glucose (FPG), systolic blood pressure (SBP), diastolic blood pressure (DBP), total cholesterol (TC), triglyceride (TG), high-density lipoprotein cholesterol (HDL-c), low-density lipoprotein cholesterol (LDL-C), alanine transaminase (ALT) and aspartate aminotransferase (AST). Afterwards, we excluded the values of the variables were illogical (n = 1592). Finally, we had 72,225 participants who were used to assess the risk of NAFLD with six insulin resistance surrogates. The data screening flow chart is presented in Supplementary Figure 1. This study was approved by the Ethics Committee of Zhengzhou University (Reference Number: ZZUIRB2019-019), and written informed consent was obtained from all of the participants.
Data Collection
All of the participants completed a standardized questionnaire that included their sociodemographic characteristics (age, gender and marital status), medical history (hypertension, diabetes, coronary heart disease and stroke), smoking, drinking and physical activity. Based on marital status, smoking and drinking statuses, participants were classified as follows: living with a partner or without a partner; nonsmokers or previous/current smokers; and never, occasional, frequent, or daily drinkers. Physical activity was classified as occurring never, occasionally, more than once a week or daily. Physical examinations were conducted by uniformly trained investigators via a standard protocol. Height and weight measurement required the participants maintain a standing position while wearing light clothes without shoes and were measured twice. Subsequently, the average value was recorded. BMI was calculated as weight (kg) divided by height squared (m). Waist circumference was measured midway between the lower edge of the costal arch and the upper edge of the iliac crest to the nearest 0.1 cm under standardized conditions. RHR and blood pressure were measured twice after subjects had rested for at least 5 minutes in a seated position by using an automatic sphygmomanometer (Omron HEM-7125, Kyoto, Japan). After fasting for 8 hours, the blood samples of participants were collected to determine the level of FPG, TC, TG, HDL-c, LDL-C, ALT and AST. All biochemical parameters were determined by standard experimental method.
Definition and Calculation
The study population underwent liver ultrasonography (SIUI CZXL-38G, Shantou, China) to diagnose NAFLD. The results of ultrasound prompted the existence of steatohepatitis: vascular blurring, deep attenuation, hepatorenal echo contrast and liver brightness, and after excluding the steatohepatitis caused by alcohol, viruses and drugs according previous drinking and medication history, was defined as NAFLD.27 All ultrasound examinations were performed by trained technicians.
The exposure of interests were six IR surrogates, namely, TyG, TyG-BMI, LAP, VAI, TG/HDL-c, and METS-IR and a non-invasive indice that are currently mainly accepted for NAFLD, namely, hepatic steatosis index (HSI).28,29 They were calculated by the following formula:
TyG =ln [TG (mg/dl) *FPG (mg/dl)/2];15
TyG-BMI=TyG*BMI;15
TG/HDL-c=TG (mmol/l)/HDL-c (mmol/l);20
LAP= (WC-65) *TG (men), LAP= (WC-58) *TG (women);17
VAI= (WC/ (39.68+ (1.88×BMI))) * (TG/1.03) * (1.31/HDL-C) (men),
VAI= (WC/ (36.58+ (1.89×BMI))) * (TG/0.81) * (1.31/HDL-C) (women);18
METS-IR= ln [(2*FPG (mg/dl)) + TG (mg/dl)] *BMI)/(Ln [HDL-c (mg/dl)]);21
HSI= 8 × ALT/AST ratio +BMI (+2, if DM; +2, if female).29
Statistical Analysis
Continuous variables were described as the means and standard deviations (SDs). Categorical variables are presented as numbers and proportions. The chi-square test for categorical variables and the Kruskal–Wallis test for continuous variables were used to compare the mean levels of variables between subjects with and without NAFLD. The relationships among six IR-related indexes and the risk of NAFLD were assessed, respectively, by constructing multivariate logistic regression models with indexes as categorical variables (divided into five groups according to quintiles), and odds ratios (ORs) with 95% confidence intervals (CIs) of IR-related indexes were also calculated. The following three models were created: model 1 was the crude model, with no adjustments; model 2 with adjustments for age and sex; model 3, with adjustments for model 2 plus marital status, smoking, physical exercise, SBP, RHR. We used restricted cubic splines with four knots in the logistic regression models with adjustments for model 3 to characterize the dose-response association and to test whether there was a nonlinear association of the six IR-related indicators with NAFLD risk.
Finally, the receiver operating characteristic (ROC) curve and related area under the ROC curve (AUC) were used to compare the capability of IR-related indicators, including TyG, TyG-BMI, LAP, VAI, TG/HDL-c, and METS-IR, to screen for NAFLD, and the logistic regression model was used to estimate the related ORs and 95% CIs of TyG, TyG-BMI, LAP, VAI, TG/HDL-c, and METS-IR for NAFLD after adjusting for age, sex, marital status, smoking, physical exercise, SBP, RHR. After excluding participants with diabetes, CVDs, diabetes and CVDs among total study participants, respectively, we conducted three sensitivity analyses to assess the robustness of the results. Statistical analyses were performed by using R software (version 4.2.2). P < 0.05 with two-sided tests was considered to indicate statistical significance.
Results
Characteristics of the Study Participants
The sociodemographic characteristics, smoking, drinking, physical activity, physical examinations and laboratory examination data of participants are summarized in Table 1. The observational study involved 72,225 participants. The mean and SD of age of the study population was 69.93 (6.72), and 37,937 (52.5%) were women. According to the results of abdominal ultrasound, 18,347 (25.4%) participants were diagnosed with NAFLD. Compared with the non-NAFLD group, the proportion of men in the NAFLD group was higher. Participants with NAFLD were younger had higher SBP, DBP, RHR, BMI, FPG, ALT, AST, TC, TG, LDL-C, TyG, TyG-BMI, LAP, VAI, TG/HDL-c, METS-IR and HSI values and lower HDL-C (P < 0.01). Additionally, the prevalence of hypertension, diabetes and CVDs were higher in participants with NAFLD. Additionally, there were also significant differences in living habits between NAFLD patients and non-NAFLD, as NAFLD patients tended to exercise more frequently, live with partner and never smoke. Supplementary Tables 1–6 described the sociodemographic, physical and biochemical characteristics of the study population according to the quintiles of six IR-related indicators, including TyG, TyG-BMI, LAP, VAI, TG/HDL-c, and METS-IR, respectively. Supplementary Table 7 describes the characteristics of the included participants according to different levels of HSI. We noted significant differences in almost all characteristics across quintiles groups of IR-related indicators.
 |
Table 1 Characteristics of the Participants with and without NAFLD |
Association Between Insulin Resistance Surrogates and NAFLD
Table 2 presents the association between NAFLD and IR-related indices when they were analyzed as categorical variables. As shown in Table 2, 6 IR-related indices were all significantly positively correlated with NAFLD before and after model adjustment, and the risk of NAFLD significantly rose with increasing TyG, TyG-BMI, LAP, VAI, TG/HDL-c, and METS-IR quintiles. It is worth noting that NAFLD was strongly correlated with IR-related parameters and TyG-BMI was the most strongly correlated with NAFLD. By comparing ORs of the factors, we found that the positive effects of the highest quintiles of TyG-BMI were the most obvious after adjustment in model 2 (OR:43.02, 95% CI:38.89–47.72), followed by the METS-IR (OR:34.49, 95% CI:31.41–37.95), HIS (OR:30.23, 95% CI:27.53–33.28), LAP (OR:12.1, 95% CI:11.25–13.02), VAI (OR:5.71, 95% CI:5.35–6.09), TyG (OR:5.48, 95% CI:5.16–5.83) and TG/HDL-c (OR:5.06, 95% CI:4.77–5.38).
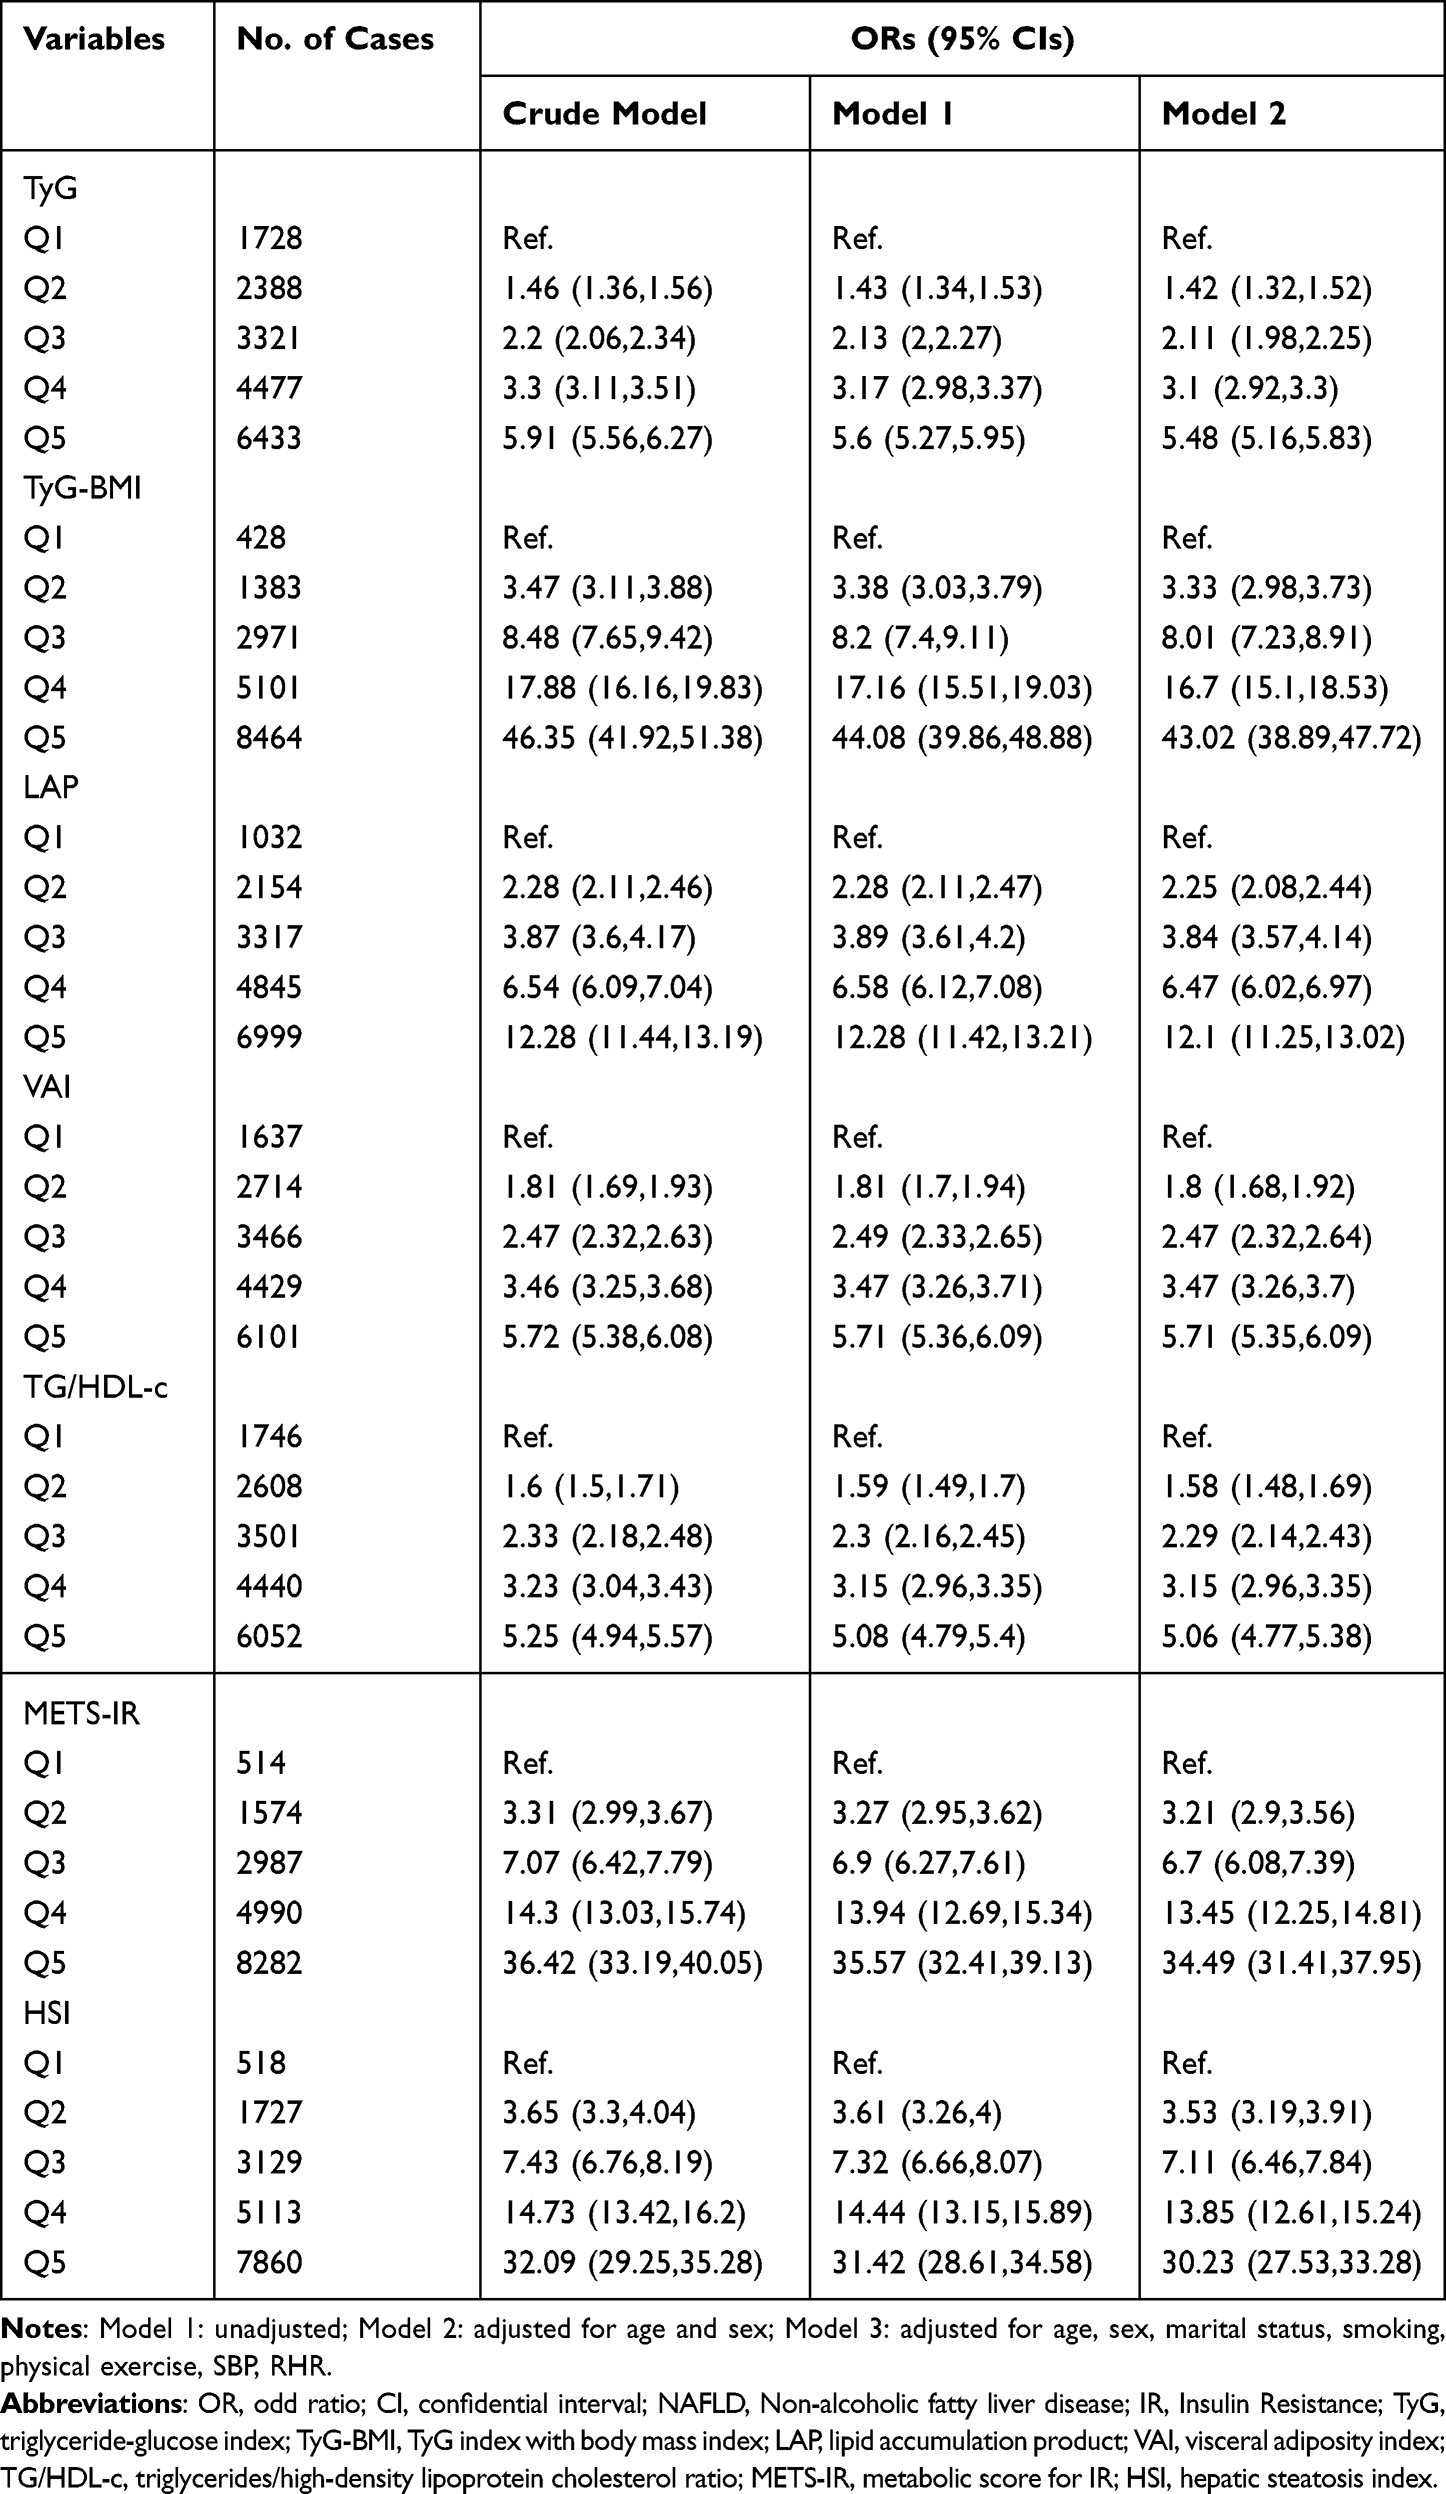 |
Table 2 Logistic Regression Analyses for the Association Between Six IR Surrogates and NAFLD |
Restricted Cubic Spline Curves for Insulin Resistance Surrogates and NAFLD Risk
Figure 1 shows the dose-response relationships between the above factors and NAFLD risk by multivariable adjusted restricted cubic spline analysis after adjusting age, sex, marital status, smoking, physical exercise, SBP, RHR. Consistent with the above analysis by categorical values, a non-linear positive correlation was identified between NAFLD risk and TyG, TyG-BMI, LAP, VAI, TG/HDL-c, and METS-IR (all p total <0.001), among which TyG-BMI also showed the largest effects, followed by METS-IR. Supplementary Figure 2 shows the dose-response relationships between HSI and NAFLD risk.
 |
Figure 1 Relationship of TyG, TyG-BMI, LAP, VAI, TG/HDL-C and METS-IR with the risk of NAFLD for all participants. ORs are adjusted for age, sex, marital status, smoking, physical exercise, SBP, RHR. Abbreviations: NAFLD, Non-alcoholic fatty liver disease; IR, Insulin Resistance; OR, odd ratio; TyG, triglyceride-glucose index; TyG-BMI, TyG index with body mass index; LAP, lipid accumulation product; VAI, visceral adiposity index; TG/HDL-c, triglycerides/high-density lipoprotein cholesterol ratio; METS-IR, metabolic score for IR; RHR, resting heart rate; SBP, systolic blood pressure. |
Accuracy of Insulin Resistance Surrogates in Identifying NAFLD
Figure 2 and Table 3 show the results of ROC analysis and the AUCs of 6 IR-related indices and HSI used to predict NAFLD after adjusting for age, sex, marital status, smoking, physical exercise, SBP, RHR. The AUCs of all 6 IR-related indices and HSI were greater than 0.5, indicating that all have certain predictive values for NAFLD. TyG-BMI was the best marker for predicting NAFLD. Among study participants, the AUC of TyG-BMI parameters was the largest, which was more than 0.80 (AUC:0.8059;95% CI:0.8025–0.8094). Additionally, METS-IR also had a high predictive performance for NAFLD, and the AUC was greater than 0.75 (AUC: 0.7959;95% CI:0.7923–0.7994). The AUC of HSI was 0.7763 (95% CI 0.7726–0.78). The AUCs of LAP, TyG, TG/HDL-c and VAI were 0.7313 (95% CI 0.7272–0.7354), 0.6901 (95% CI 0.6857–0.6944), 0.6781 (95% CI 0.6737–0.6825) and 0.6742 (95% CI 0.6697–0.6786), respectively. The above results suggested that these indexes may be effective in the early screening of NAFLD risk, and it is worth noting that the ability of TyG-BMI and METS-IR to detect NAFLD was significantly better than that of the other indexes mentioned above.
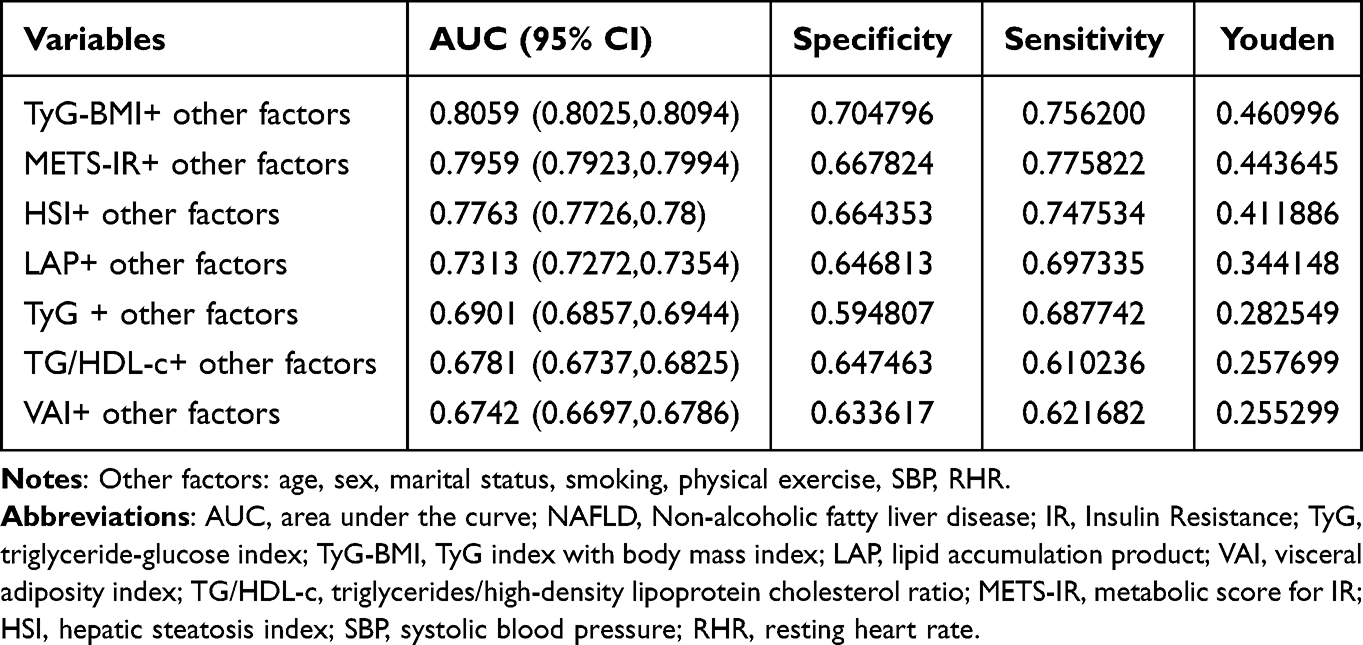 |
Table 3 AUCs for Insulin Resistance Surrogates in Relation to NAFLD |
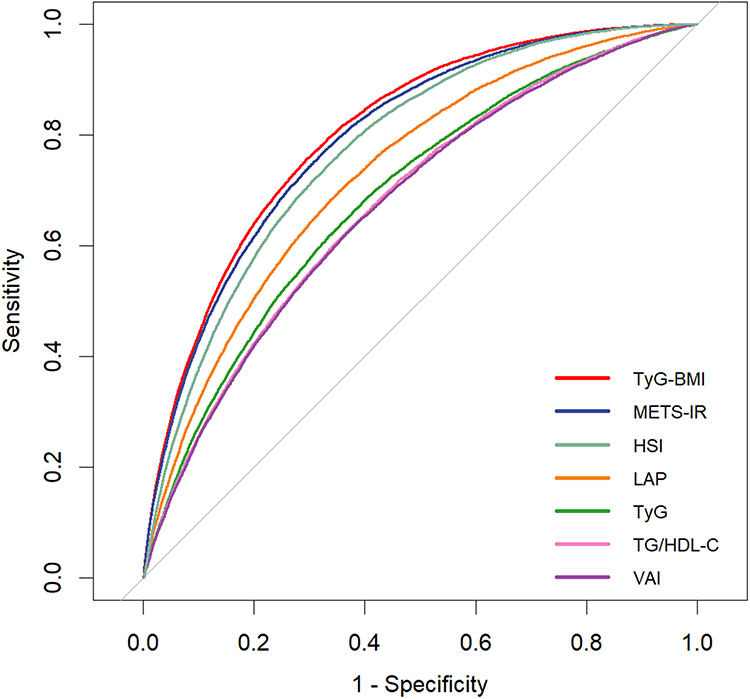 |
Figure 2 The receiver operating characteristic curve of insulin resistance surrogates and HSI after adjusting for age, sex, marital status, smoking, physical exercise, SBP, RHR. Abbreviations: HIS, hepatic steatosis index; TyG, triglyceride-glucose index; TyG-BMI, TyG index with body mass index; LAP, lipid accumulation product; VAI, visceral adiposity index; TG/HDL-c, triglycerides/high-density lipoprotein cholesterol ratio; METS-IR, metabolic score for IR; RHR, resting heart rate; SBP, systolic blood pressure. |
Sensitivity Analysis
In the sensitivity analysis (Supplementary Tables 8–10), the results were observed to be robust after excluding participants with diabetes, cardiovascular diseases (CVDs), diabetes and CVDs, respectively.
Discussion
In our study, the multivariate logistic regression was used to examine the relationship between IR surrogates and NAFLD in older individuals, and increased TyG, TyG-BMI, LAP, VAI, TG/HDL-c, and METS-IR were found to be associated with an increased risk of NAFLD. The dose-response relationship that was analyzed by using restricted cubic splines demonstrated a nonlinear relationship between 6 IR surrogates and NAFLD among all of the participants. The main findings were summarized as follows: (1) TyG, TyG-BMI, LAP, VAI, TG/HDL-c, and METS-IR were significantly increased in the NAFLD compared to the non-NAFLD group. (2) 6 IR surrogates were independently associated with the prevalence of NAFLD, with TyG-BMI and METS-IR having the strongest association with NAFLD. There were non-linear positive association and dose-response relationship between 6 IR surrogates and NAFLD risk. (3) All 6 IR surrogates had good predictive value for the prevalence of NAFLD. TyG-BMI and METS-IR had the highest AUCs, which were superior to HSI and other 4 surrogates.
The IR surrogates have been shown to be directly or indirectly associated with NAFLD in previous studies. In the current study, the researchers found that TyG-BMI and METS-IR may be the most valuable IR-related indicators for NAFLD screening. These findings further validated the previous findings and provided a reliable reference for the use of IR-related indicators in NAFLD screening and treatment. Several previous studies have investigated the relationship between IR surrogates and NAFLD, while their results have not been fully consistent due to differences in study populations. Cai et al pointed out that METS-IR was independently associated with the risk of NAFLD and a dose-response relationship existed in the study based on 10,730 nonobese Chinese adults (average age: 43.65).30 Ismaiel et al held that VAI has a predictive value in diagnosing NAFLD based on a systematic review and meta-analysis including 24 studies, and Xu et al suggest that there is a dose-response relationship between VAI level and NAFLD risk based on a health check-up cohort including 4809 subjects, which is similar to our findings.31,32 Wang et al and Hu et al found that elevated TyG-BMI showed an independent positive correlation with high risk of NAFLD in the general population.33,34 A cross-sectional study from the NAGALA at Murakami Memorial Hospital (including 6870 men and 7411 women) reported that TyG index-related parameters and LAP appear to be good predictors of NAFLD, and VAI and TG/HDL-c showed the weaker predictive potential compared with TyG index-related parameters.26 A cross-sectional study including 2483 subjects from 10 primary care centers suggested that IR is predictive of NAFLD irrespective of BMI.35 Although the results of these studies differ, they all consistently show a strong correlation between IR substitutes and NAFLD. There are several reasons for the discrepancy in the results. Firstly, involved population of the study were aged 60 or older. Age, as a very important factor influencing the prevalence of NAFLD, may change the effect of IR surrogates on NAFLD.36 Secondly, our study was based on residents’ electronic health records with a total of over 70,000 participants, and compared with previous single-center studies, the results of this study are more robust and can be generalized more widely. IR surrogates are calculated from lipid parameters. Thus, the association between IR surrogates and NAFLD can be partially explained by lipid parameters.37,38 Dyslipidemia, a traditional NAFLD risk factor, is closely related to the onset of NAFLD.
Our study showed that TyG-BMI and METS-IR were the best discriminator for NAFLD than all other IR-related parameters, including TyG, LAP, VAI and TG/HDL-c. The potential mechanism linking TyG-BMI and METS-IR to NALFD remains elusive. The calculations of TyG-BMI and METS-IR combined both body obesity indicator and glucose and lipid indexes including BMI, FPG, TG and HDL-c. There may be several reasons for the effect of IR on NAFLD. On one hand, IR has a direct effect on metabolism of glucose and lipid, and thus participates in the incidence and development of NAFLD. Insulin resistance reduces glucose uptake in the adipose tissues and muscles, and reduces the hydrolysis of TGs in adipose tissue.39 Meanwhile, obesity increases the accumulation of triglycerides. TG accumulation is strongly associated with adipose tissue insulin resistance. Once TG accumulation reaches a certain level, insulin resistance, hypertriglyceridemia, and low HDL-C, become fully established, which could initiate steatosis and then lead to the occurrence of NAFLD.40,41
There were several advantages of our study. First, to the best of our knowledge, the present study is the first large-scale research samples to examine the association between these six IR surrogates and NAFLD, which increased the statistical strength and confirmed the reliability of reported results. It is of practical significance to improve upon the relevant research. Second, standardized measurements were used in this study, and an annual health examination dataset was used to avoid discrepancies between participants’ self-reports and the actual situation. Third, we described the dose-response relationship between the six markers and NAFLD using restricted cube graphs. Finally, we also conducted three sensitivity analysis to assess the robustness of the association between the six indicators and the prevalence of NAFLD.
However, some limitations of this study should be noted. First, the subjects of this study were primarily older people and solely from China, so the external applicability of the study results needs to be confirmed by further studies, and therefore the results of this study are only for reference to other ethnic groups. Second, in this study, abdominal ultrasound was used to confirm the diagnosis of NAFLD, which may have been missed in some patients in contrast to liver biopsy. Third, we adjusted for major confounders in the analysis, but some potential factors may exist that we did not adjust for, including unmeasured factors such as genetic factors and diet.
Conclusions
In this study, it was found that the risk of NAFLD was positively associated with the elevation of TyG, TyG-BMI, TG/HDL-C and METS-IR in a large-scale population. Among the six IR surrogates, TyG-BMI and METS-IR had pronounced discrimination ability to NAFLD. To sum up, TyG-BMI and METS-IR are recommended as complementary markers for the assessment of NAFLD risk both in clinic and in future epidemiological studies.
Abbreviations
NAFLD, Non-alcoholic fatty liver disease; IR, Insulin Resistance; HEC, hyperinsulinemic-euglycemic clamp test; TyG, triglyceride-glucose index; TyG-BMI, TyG index with body mass index; LAP, lipid accumulation product; VAI, visceral adiposity index; TG/HDL-c, triglycerides/high-density lipoprotein cholesterol ratio; METS-IR, metabolic score for IR; RHR, resting heart rate; BMI, body mass index; WC, Waist Circumference; FPG, fasting plasma glucose; SBP, systolic blood pressure; DBP, diastolic blood pressure; TC, total cholesterol; TG, triglyceride; HDL-c, high-density lipoprotein cholesterol; LDL-C, low-density lipoprotein cholesterol; ALT, alanine transaminase; AST, aspartate aminotransferase; ROC, receiver operating characteristic; AUC, area under the ROC curve; CVD, cardiovascular disease; OR, odds ratio; CI, Confidence Interval; SD, Standard Deviation; HIS, hepatic steatosis index.
Data Sharing Statement
The datasets generated and/or analyzed during the current study are not publicly available due to confidentiality requirements of third parties, but are available from the corresponding author on request.
Ethics Approval and Consent to Participate
The study was approved by the Ethics Committee of Zhengzhou University, and written informed consent was obtained from all participants (Reference Number: ZZUIRB2019-019).
Declarations
All methods were performed in accordance with the relevant guidelines and regulations.
Study procedures were performed in accordance with the Declaration of Helsinki ethical principles for medical research involving human subjects.
Acknowledgments
The investigators are grateful to the dedicated participants and all research staff of the study. This study was supported by National Key Research and Development Program “Research on prevention and control of major chronic non-communicable diseases” of China (Grant NO: 2017YFC1307705).
Author Contributions
H.L and Z.S designed the study. H.L, X.C conceived this article and drafted the manuscript. H.L analyzed the data. S.S was responsible for study concept. J.W, J.D, S.G and X.S made substantial contributions to the acquisition of data. All authors made a significant contribution to the work reported, whether that is in the conception, study design, execution, acquisition of data, analysis and interpretation, or in all these areas; took part in drafting, revising or critically reviewing the article; gave final approval of the version to be published; have agreed on the journal to which the article has been submitted; and agree to be accountable for all aspects of the work.
Disclosure
The authors declare that they have no competing interests in this work.
References
1. Younossi ZM. Non-alcoholic fatty liver disease - a global public health perspective. J Hepatol. 2019;70(3):531–544. doi:10.1016/j.jhep.2018.10.033
2. Palma R, Pronio A, Romeo M, et al. The role of insulin resistance in fueling NAFLD pathogenesis: from molecular mechanisms to clinical implications. J Clin Med. 2022;11(13):3649. doi:10.3390/jcm11133649
3. Zhang C-H, Zhou B-G, Sheng J-Q, Chen Y, Cao Y-Q, Chen C. Molecular mechanisms of hepatic insulin resistance in nonalcoholic fatty liver disease and potential treatment strategies. Pharmacol Res. 2020;159. doi:10.1016/j.phrs.2020.104984
4. Muzurovic E, Mikhailidis DP, Mantzoros C. Non-alcoholic fatty liver disease, insulin resistance, metabolic syndrome and their association with vascular risk. Metabolism. 2021;119:154770. doi:10.1016/j.metabol.2021.154770
5. Estes C, Anstee QM, Arias-Loste MT, et al. Modeling NAFLD disease burden in China, France, Germany, Italy, Japan, Spain, United Kingdom, and United States for the period 2016–2030. J Hepatol. 2018;69(4):896–904. doi:10.1016/j.jhep.2018.05.036
6. Zhou J, Zhou F, Wang W, et al. Epidemiological Features of NAFLD From 1999 to 2018 in China. Hepatology. 2020;71(5):1851–1864. doi:10.1002/hep.31150
7. Zhou F, Zhou J, Wang W, et al. Unexpected rapid increase in the burden of NAFLD in China from 2008 to 2018: a systematic review and meta-analysis. Hepatology. 2019;70(4):1119–1133. doi:10.1002/hep.30702
8. Lee HW, Wong VW. Changing NAFLD epidemiology in China. Hepatology. 2019;70(4):1095–1098. doi:10.1002/hep.30848
9. Firneisz G. Non-alcoholic fatty liver disease and type 2 diabetes mellitus: the liver disease of our age? World J Gastroenterol. 2014;20(27):9072–9089. doi:10.3748/wjg.v20.i27.9072
10. Nascimbeni F, Pais R, Bellentani S, et al. From NAFLD in clinical practice to answers from guidelines. J Hepatol. 2013;59(4):859–871. doi:10.1016/j.jhep.2013.05.044
11. Khan RS, Bril F, Cusi K, Newsome PN. Modulation of insulin resistance in nonalcoholic fatty liver disease. Hepatology. 2019;70(2):711–724. doi:10.1002/hep.30429
12. Otten J, Ahren B, Olsson T. Surrogate measures of insulin sensitivity vs the hyperinsulinaemic-euglycaemic clamp: a meta-analysis. Diabetologia. 2014;57(9):1781–1788. doi:10.1007/s00125-014-3285-x
13. Mirr M, Skrypnik D, Bogdanski P, Owecki M. Newly proposed insulin resistance indexes called TyG-NC and TyG-NHtR show efficacy in diagnosing the metabolic syndrome. J Endocrinol Invest. 2021;44(12):2831–2843. doi:10.1007/s40618-021-01608-2
14. Guerrero-Romero F, Simental-Mendia LE, Gonzalez-Ortiz M, et al. The product of triglycerides and glucose, a simple measure of insulin sensitivity. Comparison with the euglycemic-hyperinsulinemic clamp. J Clin Endocrinol Metab. 2010;95(7):3347–3351. doi:10.1210/jc.2010-0288
15. Lim J, Kim J, Koo SH, Kwon GC. Comparison of triglyceride glucose index, and related parameters to predict insulin resistance in Korean adults: an analysis of the 2007–2010 Korean National Health and Nutrition Examination Survey. PLoS One. 2019;14(3):e0212963. doi:10.1371/journal.pone.0212963
16. Anoop SS, Dasgupta R, Rebekah G, et al. Lipid accumulation product (LAP) as a potential index to predict risk of insulin resistance in young, non-obese Asian Indian males from Southern India: observations from hyperinsulinemic-euglycemic clamp studies. BMJ Open Diabetes Res Care. 2021;9(1):e002414. doi:10.1136/bmjdrc-2021-002414
17. Xia C, Li R, Zhang S, et al. Lipid accumulation product is a powerful index for recognizing insulin resistance in non-diabetic individuals. Eur J Clin Nutr. 2012;66(9):1035–1038. doi:10.1038/ejcn.2012.83
18. Jiang K, Luan H, Pu X, Wang M, Yin J, Gong R. Association between visceral adiposity index and insulin resistance: a cross-sectional study based on US adults. Front Endocrinol. 2022;13:921067. doi:10.3389/fendo.2022.921067
19. Liu Z, He H, Dai Y, et al. Comparison of the diagnostic value between triglyceride-glucose index and triglyceride to high-density lipoprotein cholesterol ratio in metabolic-associated fatty liver disease patients: a retrospective cross-sectional study. Lipids Health Dis. 2022;21(1):55. doi:10.1186/s12944-022-01661-7
20. Lee YC, Lee JW, Kwon YJ. Comparison of the triglyceride glucose (TyG) index, triglyceride to high-density lipoprotein cholesterol (TG/HDL-C) ratio, and metabolic score for insulin resistance (METS-IR) associated with periodontitis in Korean adults. Ther Adv Chronic Dis. 2022;13:20406223221122671. doi:10.1177/20406223221122671
21. Bello-Chavolla OY, Almeda-Valdes P, Gomez-Velasco D, et al. METS-IR, a novel score to evaluate insulin sensitivity, is predictive of visceral adiposity and incident type 2 diabetes. Eur J Endocrinol. 2018;178(5):533–544. doi:10.1530/EJE-17-0883
22. Song S, Son DH, Baik SJ, Cho WJ, Lee YJ. Triglyceride glucose-waist circumference (TyG-WC) is a reliable marker to predict non-alcoholic fatty liver disease. Biomedicines. 2022;10(9):2251. doi:10.3390/biomedicines10092251
23. Lu S, Kuang M, Yue J, Hu C, Sheng G, Zou Y. Utility of traditional and non-traditional lipid indicators in the diagnosis of nonalcoholic fatty liver disease in a Japanese population. Lipids Health Dis. 2022;21(1):95. doi:10.1186/s12944-022-01712-z
24. Li Q, Wang L, Wu J, Wang J, Wang Y, Zeng X. Role of age, gender and ethnicity in the association between visceral adiposity index and non-alcoholic fatty liver disease among US adults (NHANES 2003–2018): cross-sectional study. BMJ Open. 2022;12(3):e058517. doi:10.1136/bmjopen-2021-058517
25. Lee JH, Park K, Lee HS, Park HK, Han JH, Ahn SB. The usefulness of metabolic score for insulin resistance for the prediction of incident non-alcoholic fatty liver disease in Korean adults. Clin Mol Hepatol. 2022;28(4):814–826. doi:10.3350/cmh.2022.0099
26. Sheng G, Lu S, Xie Q, Peng N, Kuang M, Zou Y. The usefulness of obesity and lipid-related indices to predict the presence of Non-alcoholic fatty liver disease. Lipids Health Dis. 2021;20(1):134. doi:10.1186/s12944-021-01561-2
27. Jennison E, Patel J, Scorletti E, Byrne CD. Diagnosis and management of non-alcoholic fatty liver disease. Postgrad Med J. 2019;95(1124):314–322. doi:10.1136/postgradmedj-2018-136316
28. Kahl S, Strassburger K, Nowotny B, et al. Comparison of liver fat indices for the diagnosis of hepatic steatosis and insulin resistance. PLoS One. 2014;9(4):e94059. doi:10.1371/journal.pone.0094059
29. Lee JH, Kim D, Kim HJ, et al. Hepatic steatosis index: a simple screening tool reflecting nonalcoholic fatty liver disease. Dig Liver Dis. 2010;42(7):503–508. doi:10.1016/j.dld.2009.08.002
30. Cai X, Gao J, Hu J, et al. Dose-response associations of metabolic score for insulin resistance index with nonalcoholic fatty liver disease among a nonobese Chinese population: retrospective evidence from a population-based cohort study. Dis Markers. 2022;2022:4930355. doi:10.1155/2022/4930355
31. Ismaiel A, Jaaouani A, Leucuta D-C, Popa S-L, Dumitrascu DL. The visceral adiposity index in non-alcoholic fatty liver disease and liver fibrosis—systematic review and meta-analysis. Biomedicines. 2021;9(12):1890. doi:10.3390/biomedicines9121890
32. Xu C, Ma Z, Wang Y, et al. Visceral adiposity index as a predictor of NAFLD: a prospective study with 4-year follow-up. Liver Int. 2018;38(12):2294–2300. doi:10.1111/liv.13941
33. Wang R, Dai L, Zhong Y, Xie G. Usefulness of the triglyceride glucose-body mass index in evaluating nonalcoholic fatty liver disease: insights from a general population. Lipids Health Dis. 2021;20(1). doi:10.1186/s12944-021-01506-9
34. Hu H, Han Y, Cao C, He Y. The triglyceride glucose-body mass index: a non-invasive index that identifies non-alcoholic fatty liver disease in the general Japanese population. J Transl Med. 2022;20(1). doi:10.1186/s12967-022-03611-4
35. Huang J-F, Tsai P-C, Yeh M-L, et al. Risk stratification of non-alcoholic fatty liver disease across body mass index in a community basis. J Formos Med Assoc. 2020;119(1):89–96. doi:10.1016/j.jfma.2019.03.014
36. Sookoian S, Pirola CJ. Systematic review with meta-analysis: risk factors for non-alcoholic fatty liver disease suggest a shared altered metabolic and cardiovascular profile between lean and obese patients. Aliment Pharmacol Ther. 2017;46(2):85–95. doi:10.1111/apt.14112
37. Wang J, Su Z, Feng Y, Xi R, Liu J, Wang P. Comparison of several blood lipid-related indexes in the screening of non-alcoholic fatty liver disease in women: a cross-sectional study in the Pearl River Delta region of southern China. BMC Gastroenterol. 2021;21(1):482. doi:10.1186/s12876-021-02072-1
38. Yang S, Zhong J, Ye M, et al. Association between the non-HDL-cholesterol to HDL-cholesterol ratio and non-alcoholic fatty liver disease in Chinese children and adolescents: a large single-center cross-sectional study. Lipids Health Dis. 2020;19(1):242. doi:10.1186/s12944-020-01421-5
39. Heeren J, Scheja L. Metabolic-associated fatty liver disease and lipoprotein metabolism. Mol Metab. 2021;50:101238. doi:10.1016/j.molmet.2021.101238
40. Bril F, Barb D, Portillo‐Sanchez P, et al. Metabolic and histological implications of intrahepatic triglyceride content in nonalcoholic fatty liver disease. Hepatology. 2017;65(4):1132–1144. doi:10.1002/hep.28985
41. Engin A. Non-Alcoholic Fatty Liver Disease. Adv Exp Med Biol. 2017;960:443–467. doi:10.1007/978-3-319-48382-5_19
 © 2023 The Author(s). This work is published and licensed by Dove Medical Press Limited. The full terms of this license are available at https://www.dovepress.com/terms.php and incorporate the Creative Commons Attribution - Non Commercial (unported, v3.0) License.
By accessing the work you hereby accept the Terms. Non-commercial uses of the work are permitted without any further permission from Dove Medical Press Limited, provided the work is properly attributed. For permission for commercial use of this work, please see paragraphs 4.2 and 5 of our Terms.
© 2023 The Author(s). This work is published and licensed by Dove Medical Press Limited. The full terms of this license are available at https://www.dovepress.com/terms.php and incorporate the Creative Commons Attribution - Non Commercial (unported, v3.0) License.
By accessing the work you hereby accept the Terms. Non-commercial uses of the work are permitted without any further permission from Dove Medical Press Limited, provided the work is properly attributed. For permission for commercial use of this work, please see paragraphs 4.2 and 5 of our Terms.