Back to Journals » Diabetes, Metabolic Syndrome and Obesity » Volume 15
Relationship Between Serum Uric Acid-to-Creatinine Ratio and the Risk of Metabolic-Associated Fatty Liver Disease in Patients with Type 2 Diabetes Mellitus
Authors Xing Y, Chen J ![]() , Liu J, Song G, Ma H
, Liu J, Song G, Ma H
Received 20 November 2021
Accepted for publication 19 January 2022
Published 2 February 2022 Volume 2022:15 Pages 257—267
DOI https://doi.org/10.2147/DMSO.S350468
Checked for plagiarism Yes
Review by Single anonymous peer review
Peer reviewer comments 3
Editor who approved publication: Professor Ming-Hui Zou
Yuling Xing,1,2 Jinhu Chen,1,2 Jing Liu,1,2 Guangyao Song,1,3 Huijuan Ma1,3
1Department of Endocrinology, Hebei General Hospital, Shijiazhuang, 050017, People’s Republic of China; 2Graduate School of Hebei Medical University, Shijiazhuang, 050017, People’s Republic of China; 3Department of Internal Medicine, Hebei Medical University, Shijiazhuang, Hebei, 050017, People’s Republic of China
Correspondence: Huijuan Ma
Department of Endocrinology, Hebei General Hospital, Shijiazhuang, 050017, People’s Republic of China
, Tel +86 18032838686
, Email [email protected]
Purpose: To investigate the association between serum uric acid-to-creatinine ratio (SUA/Cr) and the risk of developing metabolic-associated fatty liver disease (MAFLD) in patients with type 2 diabetes mellitus (T2DM).
Patients and Methods: Overall, 1434 patients with T2DM who were admitted to Hebei General Hospital from January 2019 to December 2019 were selected as the study subjects. According to abdominal ultrasound findings, patients were divided into two groups: MAFLD group and non-MAFLD group. A total of 734 patients were diagnosed with MAFLD. Participants were divided into three study groups according to the SUA/Cr ratio. Chi-square test and one-way analysis of variance were used to perform a comparison between groups. The relationship between SUA/Cr ratio and MAFLD risk was analyzed using correlation analysis and regression analysis. Furthermore, subgroup analyses were performed to verify the robustness of the results.
Results: The detection rate of MAFLD in patients with T2DM was 51.2%, and the detection rate of progressive liver fibrosis in T2DM patients with MAFLD was 36.6%. A significantly higher SUA/Cr ratio was seen in the MAFLD group than in the non-MAFLD group. After adjusting for confounding factors, multivariate logistic regression analysis revealed that the SUA/Cr ratio was an independent risk factor for MAFLD development. Stronger correlations were found in participants with a body mass index ranging between 23 and 28 kg/m2, HbA1C > 7%, or female sex.
Conclusion: An elevated SUA/Cr index is independently correlated with an increased risk of MAFLD in Chinese adults with T2DM.
Keywords: metabolic-associated fatty liver disease, type 2 diabetes, SUA/Cr
Introduction
Metabolic-associated fatty liver disease (MAFLD), formerly known as non-alcoholic fatty liver disease (NAFLD), is a new concept proposed by international consensus in 2020.1 MAFLD encompasses a spectrum of liver lesions, including simple steatosis, steatohepatitis, and fibrosis.2 Approximately one-quarter of the world’s adult population is affected by MAFLD. The MAFLD epidemic has imposed a major health and economic burden on patients, families, and the society.3 Patients with type 2 diabetes mellitus (T2DM) were more likely to develop MAFLD and were more likely to progress to liver cirrhosis, hepatic failure, or even hepatocellular carcinoma.4 A previous study have demonstrated a strong link between MAFLD and T2DM. More than 70% of patients with T2DM have developed MAFLD.5 Timely recognition of MAFLD is therefore of notable clinical importance, especially for patients with T2DM. Uric acid (UA) is an end product of purine nucleotide catabolism arising from endogenous and exogenous sources.The serum uric acid (SUA) level is maintained by the balance between UA production and excretion, and excess production of UA or reduced excretion can lead to elevated SUA.6 UA is the end product of human purine metabolism and is excreted by the kidney. SUA level will increase due to its impaired clearance in individuals with impaired renal function.7 SUA is the end oxidation product of purine metabolism in the liver, and some studies have reported that elevated levels of SUA are associated with an increased risk of incident MAFLD.8 Furthermore, a recent meta-analysis demonstrated an association between SUA levels and NAFLD development.9 Because UA excretion is influenced by kidney function, we hypothesized that UA normalized by renal function (ie, serum UA-to-creatinine ratio [SUA/Cr]) can reflect endogenous UA levels more precisely than SUA levels. Moreover, elevated SUA levels are correlated with islet β-cell function, metabolic syndrome (MetS), and chronic kidney disease.10,11 However, only few relevant studies and analyses on the association of SUA levels with MAFLD have been reported, and studies in patients with T2DM are still scarce. Therefore, in this study, we conducted a cross-sectional survey to investigate the relationship between SUA/Cr and NAFLD in Chinese T2DM patients. Subgroup analyses were conducted to further verify the robustness of the results. In another recent study entitled “Associations between GGT/HDL and MAFLD: a cross-sectional study,” we highlighted the association among GGT/HDL, TYG-BMI, and MAFLD and the role of GGT/HDL played by TYG-BMI in MAFLD in the same study participants.
Materials and Methods
Study Population
This research was carried out in accordance with the Declaration of Helsinki and the approval of the ethics board of Hebei General Hospital in China. Patients hospitalized in Hebei General Hospital in Shijiazhuang-China from January 1, 2019, to December 31, 2019, were included. All the participants signed informed consent to participate in the study. Patients were evaluated for inclusion by the research team against the listed inclusion and exclusion criteria. The inclusion criteria were as follows: (1) T2DM was diagnosed according to the 1999 World Health Organization criteria12 and (2) the diagnosis of MAFLD was based on hepatic steatosis according to ultrasonographic findings and the presence of T2DM.2 The exclusion criteria were as follows: (1) Age <18 years; (2) other types of diabetes (eg, type 1 diabetes mellitus, gestational diabetes mellitus, and other specific types); (3) patients who had a previous history of myocardial infarction, cerebral hemorrhage, severe hepatorenal dysfunction, acute infection, and stress conditions in the past 3 months; (4) pregnant and lactating women; (5) patients with a malignant tumor, a history of liver surgery, a serious and uncontrollable medical condition, or mental illness that limited their ability to comply with the study requirements; (6) patients receiving UA-lowering drugs.
Study Methods
Laboratory and Demographic Data
At the time of enrollment, a detailed clinical history was recorded, which included data of age, sex, body mass index (BMI), diabetes course, smoking, alcohol consumption, and hypertension. Venous blood was collected from patients on an empty stomach in the early morning of the next day after admission. All laboratory tests were completed in the Clinical Detection Department, using the same instruments and unified reagents. Blood samples were analyzed for white blood cell (WBC) count, neutrophil count (N), lymphocyte count (L), creatinine, UA, bile acid (BA), total cholesterol (TC), triglyceride (TG), high-density lipoprotein cholesterol (HDL-C), low-density lipoprotein cholesterol (LDL-C), alanine aminotransferase (ALT), aspartate aminotransferase (AST), γ-glutamyl transpeptidase (GGT), glycosylated hemoglobin (HbA1C), and fasting blood glucose (FBG). To ensure the accuracy of data extraction, information was entered into a spreadsheet by one assessor and cross-checked by a second independent assessor.
Definition of MAFLD and Progressive Liver Fibrosis
The diagnosis of MAFLD was based on evidence of hepatic steatosis (ultrasonographic findings of fatty liver), in addition to one of the following three criteria: overweight/obesity (BMI ≥ 23 kg/m2), presence of T2DM, or evidence of metabolic dysregulation.2 MAFLD with advanced fibrosis was ascertained using the NAFLD Fibrosis Score (NFS).3 NFS = −1.675 + 0.037 * age (years) + 0.094 * BMI (kg/m2) + 1.13 * impaired fasting glucose (IFG) or diabetes (yes=1, no=0)+0.99*AST/ALT ratio–0.013*platelet(109/L)–0.66*albumin (g/dL).NFS > 0.676 was defined as the progressive liver fibrosis group, and NFS ≤ 0.676 was defined as the non-progressive liver fibrosis group.
Calculation of SUA/Cr
SUA/Cr was calculated using the following formula: SUA/Cr = UA (mmol/l)/Cr (µmol/l). Participants were divided into tertiles according to SUA/Cr ratio as tertile 1 (T1):≤3.6289, tertile 2 (T2): 3.6289–4.5515, and tertile 3 (T3):>4.5515.
Statistical Analysis
Statistical analyses were performed using SPSS statistical software, version 25.0. Continuous data were tested for normality and homogeneity of variance; normally distributed data are expressed as mean ± standard deviation, and one-way analysis of variance was used for comparison among groups. Non-normally distributed data are expressed as median (interquartile range), and non-parametric tests were performed. Enumeration data are expressed as number (percentage) and were compared with the χ2 test. Spearman correlation analysis was used to evaluate the correlation between the SUA/Cr ratio and the potential risk factors for MAFLD. The clinical variables that were significant in the univariate logistic regression analysis were included in a multivariate logistic regression analysis, and multiple logistic regression analyses were performed to investigate the association between the SUA/Cr ratio and risk of MAFLD; differences were considered statistically significant at P values of <0.05. The SUA/Cr ratio was classified into three groups (T1 (lowest), T2, and T3 (highest)) by tertiles. Subgroup analyses were performed to verify the robustness of the results.
Results
Basic Characteristics of Participants in the Three SUA/Cr Groups
In total, 1434 patients, including 855 males and 579 females, with a mean age of 58.65±15.06 years, were included in this study (Figure 1). The proportion of patients with T2DM and MAFLD was 51.2%, while the proportion of patients with progressive liver fibrosis, T2DM, and MAFLD was 36.6%. The average BMI and SUA/Cr ratio in the population with T2DM were 25.85 kg/m2 and 4.20, respectively. Compared with the non-MAFLD group, the SUA/Cr ratio significantly increased in the MAFLD group, and the difference was significant (4.28 vs 3.84, P<0.05; Figure 2). The baseline characteristics of subjects according to SUA/Cr tertiles are shown in Table 1. Of note, the proportion of males, proportion of smokers; WBC count; and BA, FBG, HDL, and HbA1C levels did not differ significantly across the SUA tertiles. Participants with higher SUA/Cr ratios showed higher BMI, ALT, AST, GGT, glomerular filtration rate (GFR), TC, TG, LDL, very low-density lipoprotein (VLDL), and higher proportion of drinkers. Conversely, there were lower levels of age, DM course, N, and fewer patients with a history of hypertension in the tertiles with higher SUA/Cr levels. A positive trend was observed, and with increased SUA tertiles, the prevalence of MAFLD also significantly increased (192 [40.3%] vs 251 [52.6%] vs 300 [62.5%]; P<0.001; Figure 3).
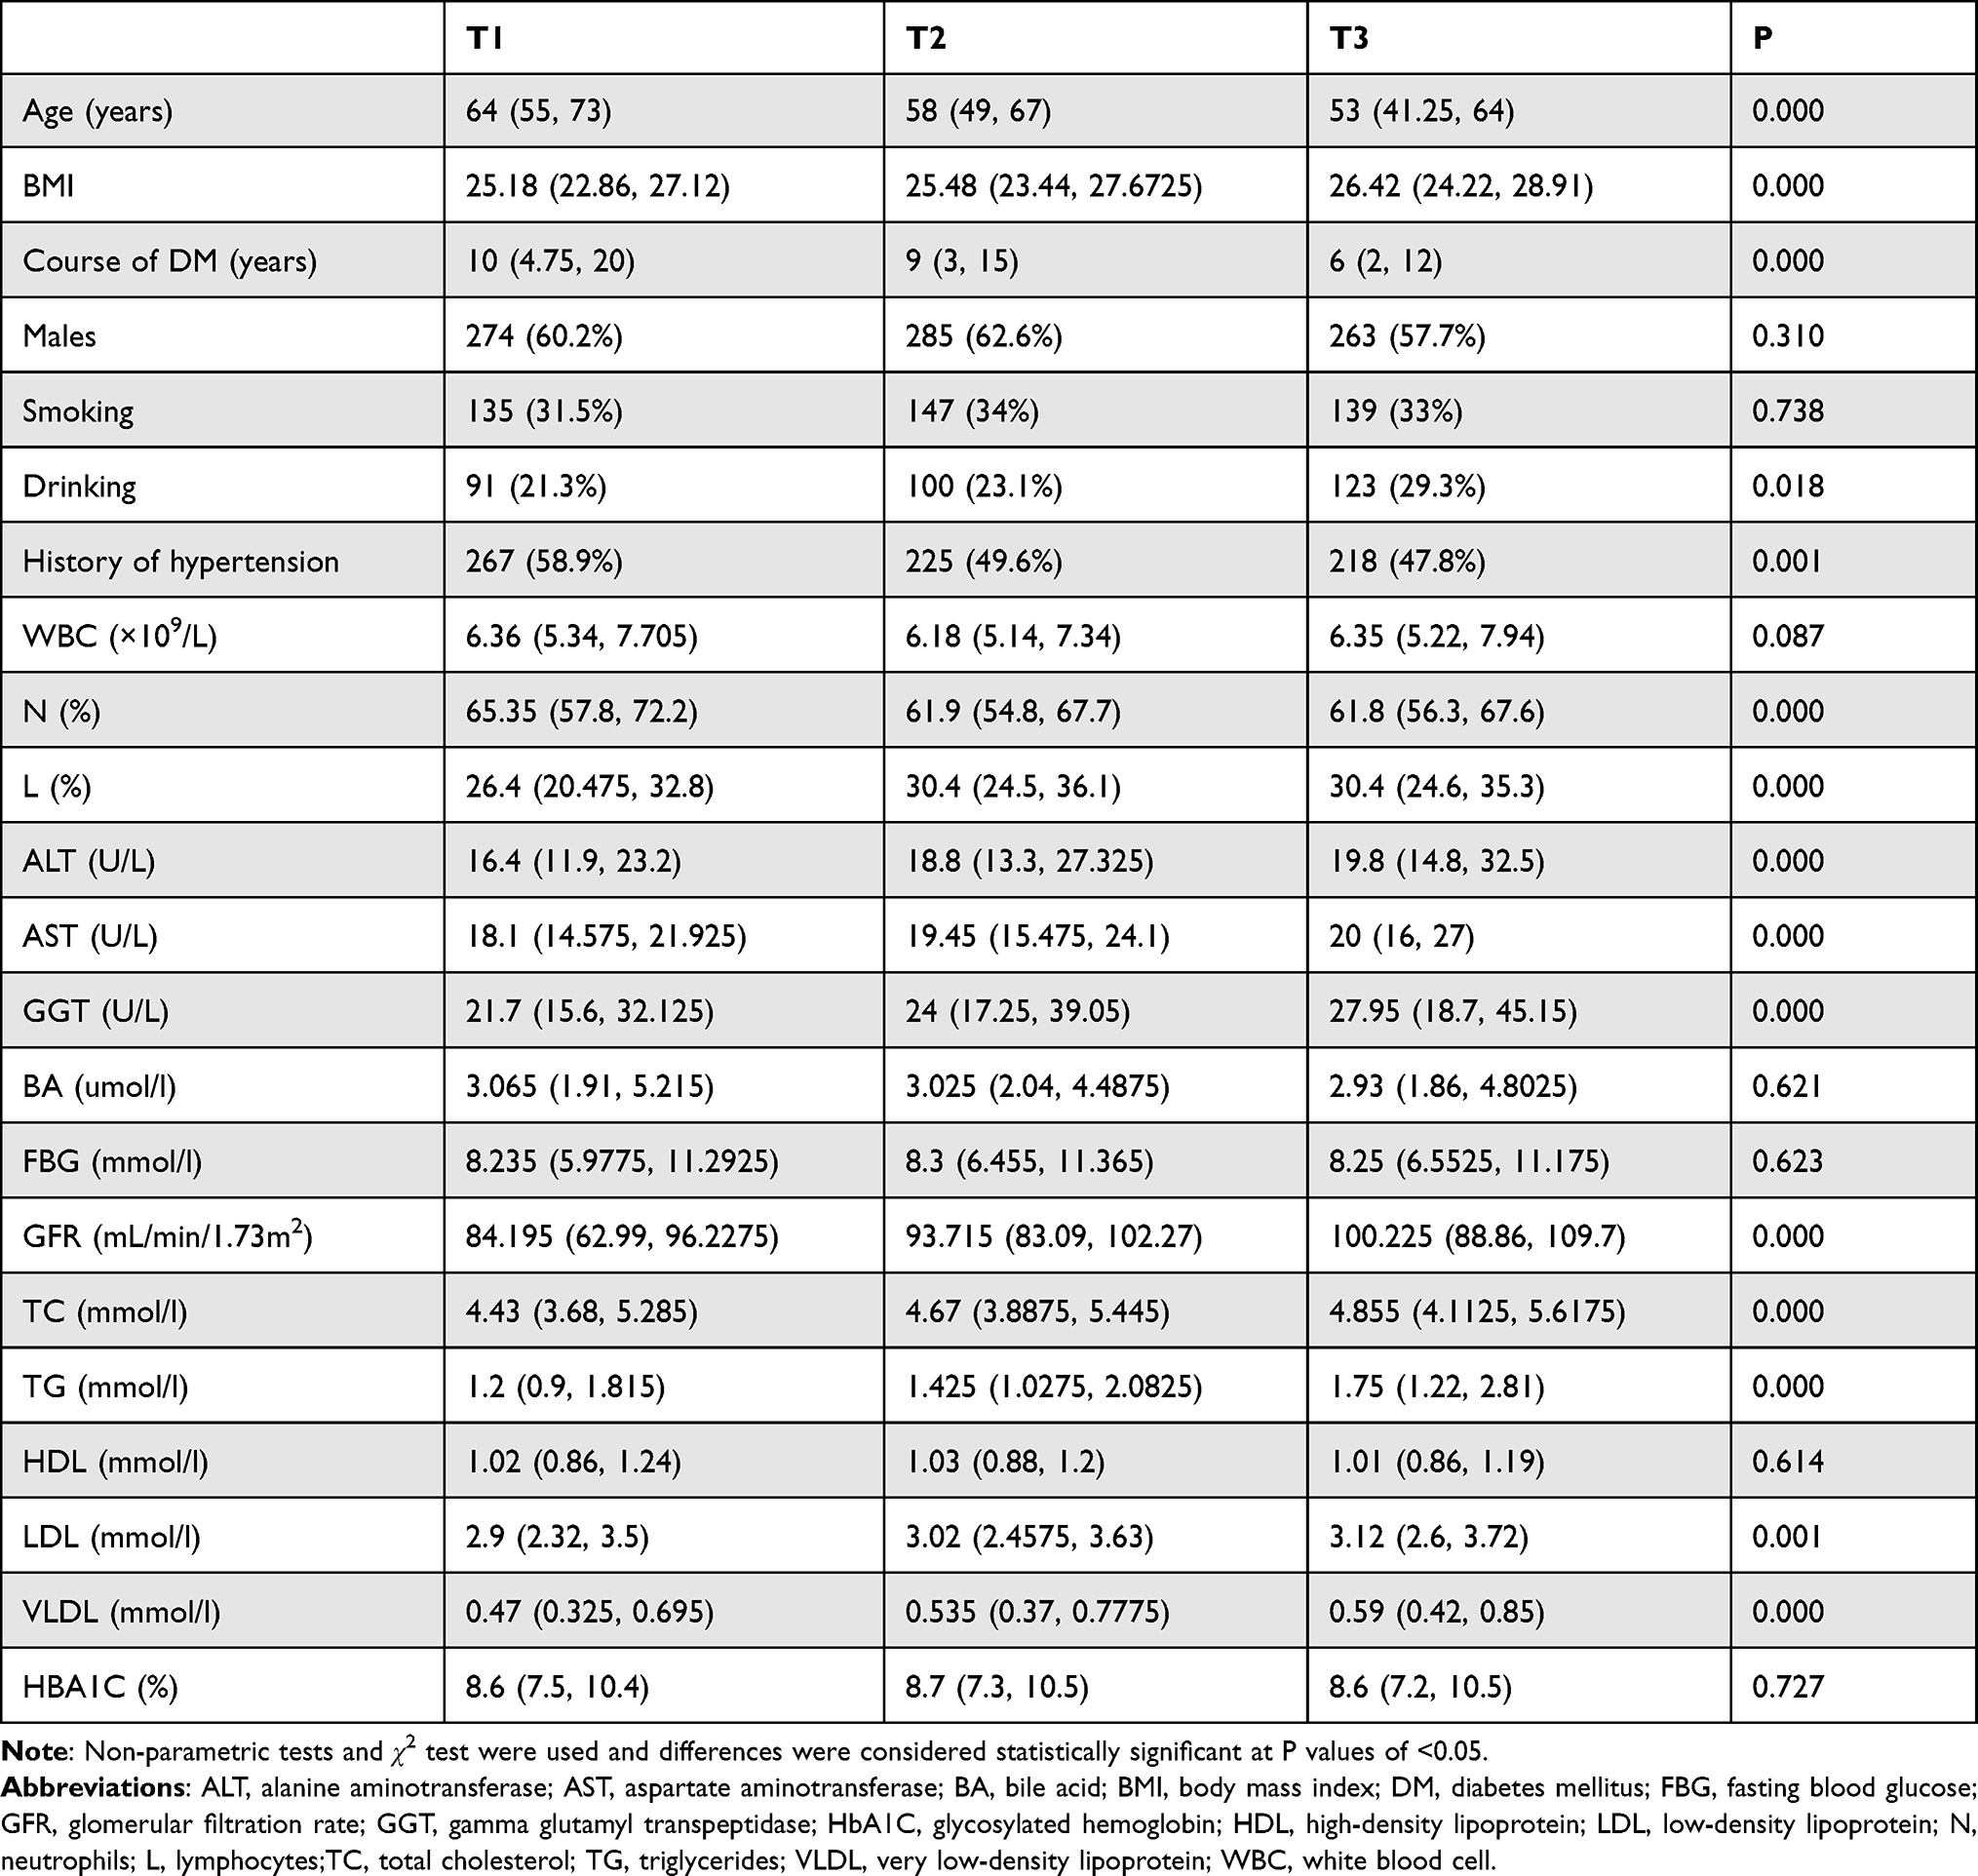 |
Table 1 The Demographic Data and Biochemical Parameters of the Examined Patients |
 |
Figure 1 Flowchart of the patient selection process. |
 |
Figure 2 Comparison of serum uric acid-to-creatinine ratio (SUA/Cr) between the metabolic-associated fatty liver disease (MAFLD) group and the non-MAFLD group in participants with type 2 diabetes mellitus (T2DM). |
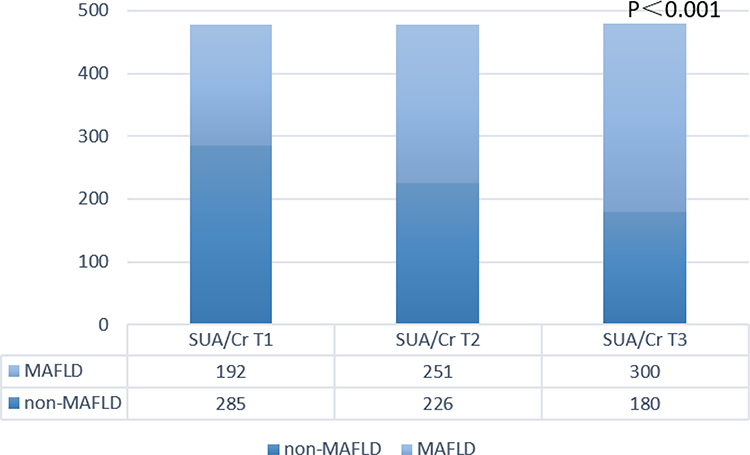 |
Figure 3 Comparison of the prevalence of metabolic-associated fatty liver disease (MAFLD) in patients with type 2 diabetes mellitus (T2DM) who have different serum uric acid-to-creatinine ratios (SUA/Cr). |
Spearman Correlation of SUA/Cr Ratio with Potential MAFLD Risk Factors
Correlation analysis demonstrated that the SUA/Cr ratio was positively correlated with BMI (r=0.179, P<0.001), AST (r=0.198, P<0.001), TC (r=0.148, P<0.001), and LDL (r=0.085, P=0.023) in the MAFLD group, whereas no such correlations were found in the non-MAFLD group. Figure 4 shows the results of Spearman correlation analysis.
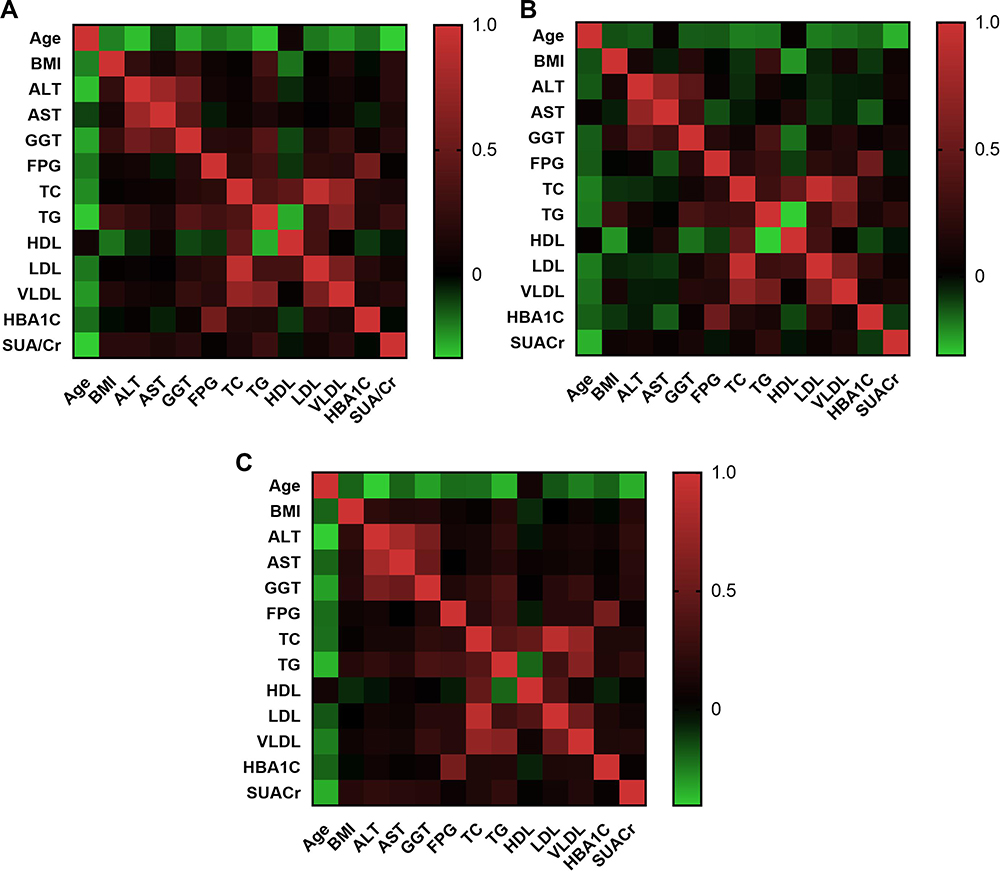 |
Figure 4 Spearman correlation analysis of serum uric acid-to-creatinine ratio (SUA/Cr) with potential risk factors for metabolic-associated fatty liver disease (MAFLD). (A) All patients with type 2 diabetes mellitus (T2DM), (B) patients with T2DM but without MAFLD, (C) patients with T2DM and MAFLD. |
Association Between SUA/Cr Ratio and MAFLD Prevalence
A logistic regression model was used to evaluate the relationship between SUA/Cr ratio and MAFLD risk (Models 1–3, Table 2).
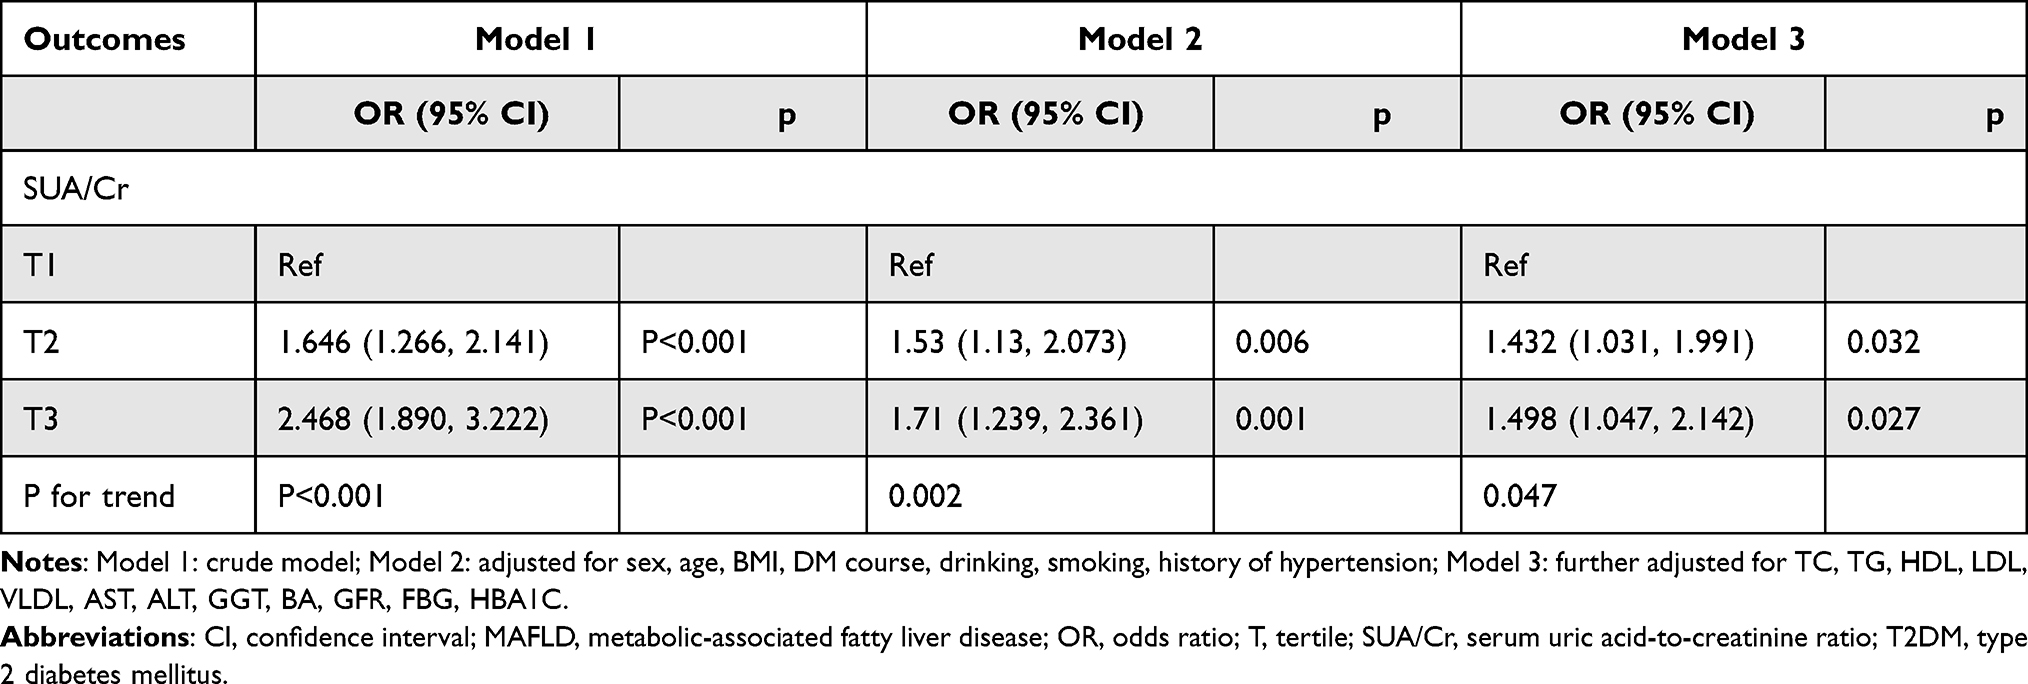 |
Table 2 Logistic Regression Analysis of SUA/Cr for MAFLD in Patients with T2DM |
In the crude model, the SUA/Cr ratio demonstrated a strong positive association with MAFLD risk (odds ratio [OR] 2.468; 95% confidence interval [CI] 1.890–3.222; P<0.001). In Model 2 (adjusted for sex, age, BMI, DM course, drinking, smoking, and history of hypertension), the positive correlation became relatively weaker (OR, 1.71; 95% CI, 1.239–2.361; P<0.001). In Model 3 (further adjusted for TC, TG, HDL, LDL, VLDL, AST, ALT, GGT, BA, GFR, FBG, and HbA1C), the correlation did not change significantly compared with the minor adjustment model (OR, 1.498; 95% CI, 1.047–2.142; P=0.027). In summary, multivariate logistic regression analysis showed that a high SUA/Cr ratio was an independent risk factor for comorbid MAFLD among patients with T2DM. The prevalence of MAFLD was 1.498 times greater in the T3 group than in the T1 group (Table 2).
Subgroup Analysis
To further investigate the impact of other risk factors on the correlation between SUA/Cr ratio and MAFLD risk, subgroup analyses were carried out according to sex, age, BMI, smoking, alcohol consumption, DM course, HbA1C, and history of hypertension. Table 3 summarizes the results of the subgroup analysis and the interaction results. There were significant additive interactions between SUA/Cr ratio and MAFLD risk in sex, BMI, and HbA1C (P-value for interaction < 0.05). Stronger correlations were found in participants with a BMI of 23–28 kg/m2, HbA1C >7%, or female sex. However, significant interactions were not found in age, DM course, smoking, alcohol consumption, or history of hypertension.
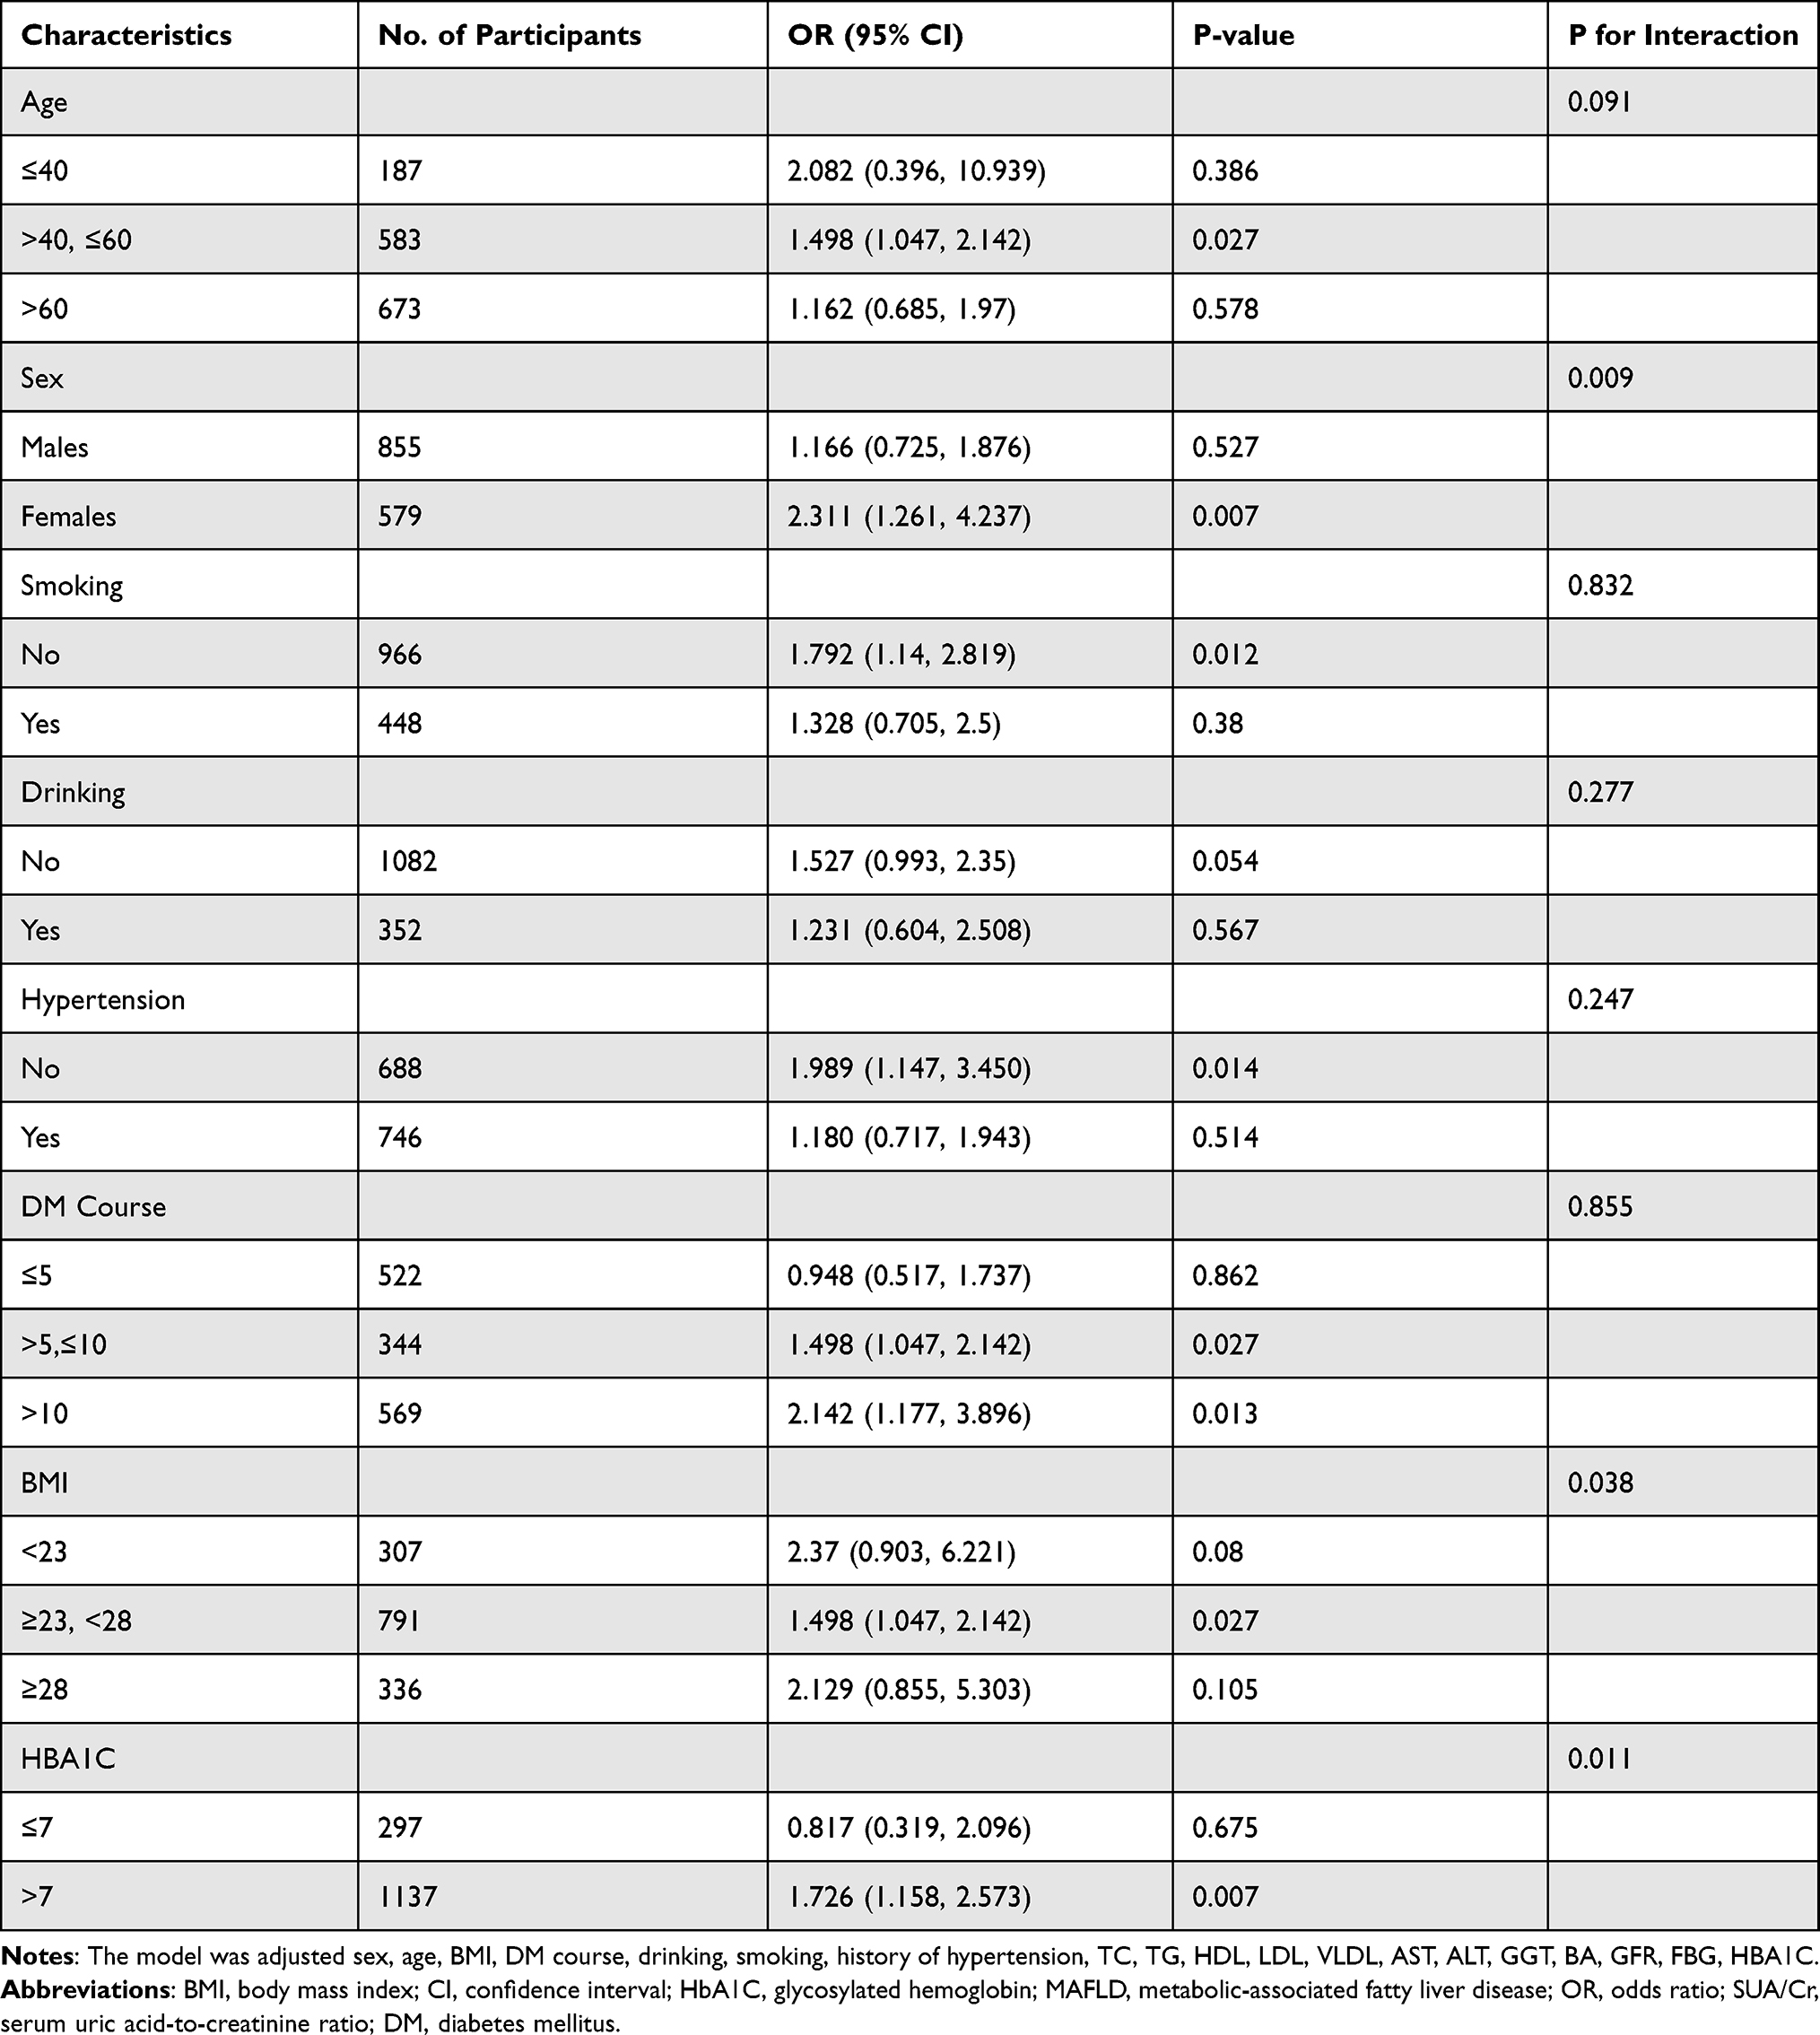 |
Table 3 Effect of Magnitude of SUA/Cr on MAFLD Risk Stratified by Subgroups |
Discussion
One study included Chinese patients with T2DM and showed that the SUA/Cr ratio was significantly correlated with islet β-cell function.11 Al-Daghri et al proposed a correlation between SUA/Cr ratio and the development of MetS in patients with T2DM. According to those authors, impaired kidney function was the main confounding factor in this relationship. Renal function-normalized serum UA (SUA/Cr), reflecting the net production of UA, may thus be a useful marker in the pathogenesis of MetS and related diseases.10 However, considering the role of SUA/Cr in MetS, the role of SUA/Cr in the pathogenesis of MAFLD seems plausible, and synthesis of the results of this study seems justified.
A meta-analysis provided the global prevalence rates for NAFLD, NASH, and advanced fibrosis in patients with T2DM.13 It showed that the prevalence of NAFLD in patients with type 2 diabetes mellitus was more than 2-fold higher than in the general population.The overall prevalence of NAFLD among patients with T2DM was 55.5%.The global prevalence of non-alcoholic steatohepatitis among patients with T2DM was 37.3%. Of the patients with NAFLD and T2DM who underwent liver biopsy, 17% have advanced fibrosis.In the present study, the detection rates were 51.2% and 36.6% for MAFLD and progressive liver fibrosis, respectively, which indicated that the incidences of MAFLD and progressive liver fibrosis were significantly higher in patients with T2DM. It is well known that IR (insulin resistance) is the strongest pathophysiological link between NAFLD and Metabolic Syndrome. Recent studies have shown that the reduction of IR through the pharmacological eradication of HCV by direct-acting antivirals leads to both a reduction in the onset of type 2 diabetes14 and clinical expressions of atherosclerosis.15,16 NAFLD and IR are bidirectionally correlated and, consequently, the development of pre-diabetes and diabetes is the most direct consequence at the extrahepatic level.17,18 Recently, it was observed by liver biopsy that steatohepatitis represents the sole feature of liver damage in type 2 diabetes.In other words, NAFLD generally presents as NASH in type 2 diabetic patients.19 This study explored the risk factors for MAFLD and, at the same time, compared differences in sex, age, BMI, DM course, alcohol consumption, smoking, history of hypertension, and HbA1C. In this study, we investigated the utility of SUA/Cr ratio as a biomarker for MAFLD. We found that SUA/Cr ratio was significantly higher in MAFLD subjects, and with an increase in the SUA/Cr ratio, the preference for MAFLD also increased. In our study, the SUA/Cr ratio was independently associated with the risk of MAFLD development. This relationship persisted even after full adjustment for potential confounders. Stronger correlations between SUA/Cr ratio and MAFLD risk were found in the present study in participants with BMI between 23 and 28 kg/m2, HbA1C >7%, or female sex. Previous studies have reported that the relationship between SUA/Cr ratio and MAFLD development could be sex-specific and that the mechanism underlying these sex differences remains unclear20–22 Although the exact mechanism is unknown, the effects of sex hormones, sex-specific effects of UA production, and lifestyle are believed to be the underlying mechanism of sex differences.23,24
In addition, a study conducted by Zelber-Sagi et al reported that the SUA level was independently associated with elevated ALT levels.25 This finding was in agreement with that of our reports, which indicated a positive correlation between SUA/Cr risk and ALT or AST levels. A significant correlation between SUA/Cr ratio and AST levels was found only in the MAFLD group but not in the non-MAFLD group.
Several potential mechanisms may be helpful in explaining the relationship between SUA/Cr ratio and MAFLD risk.26 IR has been shown to be critical for the occurrence and development of MAFLD.27
UA levels also have direct pro-inflammatory and pro-oxidative effects on adipocytes,28 which play critical roles in the development of IR.29 By reducing the nitric oxide bioavailability, UA stimulates intracellular oxidative stress and impairs endothelial function. Lanaspa et al30 found that UA directly stimulated hepatic fat accumulation, which was a good supplement to the pathogenesis of MAFLD caused by SUA/Cr. It is known that hepatic IR and intracellular damage in the process of hepatic fat accumulation further aggravate fibrosis.31. The development of pathogenic characteristics, such as mitochondrial dysfunction, lipid peroxidation, oxidative stress, and endoplasmic reticulum stress, has been shown to orchestrate a complicated network to initiate and develop MAFLD.32,33 SUA has an antioxidative effect,34 and elevated SUA levels may promote the generation of reactive oxygen species (ROS) and the degree of oxidative stress, which may cause IR and abnormal blood glucose metabolism in the body and, consequently, the occurrence of NAFLD.35 Intracellular and mitochondrial oxidative stress caused by UA induces disturbances in the Krebs cycle, leading to increased fat synthesis and impaired fatty acid oxidation.36 Also, UA stimulates production of proinflammatory mediators, which results in chronic inflammatory processes. The putative mechanisms already mentioned, including IR, oxidative stress, and systemic inflammation, are known risk factors for the development and progression of hepatic steatosis and MetS.37 Basic studies have shown that SUA also causes hepatic steatosis and liver fat accumulation through endoplasmic reticulum stress38 and mitochondrial oxidative stress.30 Accumulating evidence indicates that oxidative stress plays a key role in steatosis.39–41 A previous study revealed that SUA levels within the normal range were positively associated with inflammation-related markers, an important mediator in MAFLD development.42 A common factor in the pathophysiology of MAFLD is the presence of chronic systemic inflammation,43 which, in turn, promotes the development and progression of liver fibrosis. This suggests that UA induces liver fat accumulation through the ROS/JNK/AP-1 pathway. This evidence suggests a new mechanism of MAFLD pathogenesis.44 In addition, UA may originate from fructose metabolism.39 It is well known that fructose is directly metabolized to TGs in the liver, showing a more prominent competence in inducing liver steatosis. Overall, an increased SUA/Cr ratio induced endothelial dysfunction,45 oxidative stress,30,46,47 IR,48 and inflammation.49,50 All these factors contribute to the initiation, progression, and development of MAFLD.
There are several potential limitations to the current study. First, as this was a cross-sectional study, causal inferences about the findings cannot be made. Second, the diagnosis of MAFLD was based on ultrasonography findings and was not confirmed by liver biopsy to determine hepatic steatosis. Third, our sample was limited to Chinese adults, and it was not clear whether the findings apply to other populations. Therefore, in future experiments, we need to expand the sample size, enrich the study population, and aid causality; therefore, prospective studies or randomized controlled trials should be conducted and continue to verify the findings.
Conclusion
In summary, the present study showed a high detection rate of MAFLD and progressive liver fibrosis in patients with T2DM. This study showed that a high SUA/Cr ratio was independently correlated with an increased risk of MAFLD development in Chinese adults with T2DM. In addition, the SUA/Cr ratio seems to be more sensitive to MAFLD detection in women and individuals with 23 kg/m2 ≤ BMI <28 kg/m2 or HbA1C>7%.
Acknowledgments
The original data can be available by email request at any time (Yuling Xing: [email protected]).
Disclosure
The authors report no conflicts of interest in this work.
References
1. Eslam M, Sanyal AJ, George J. MAFLD: a consensus-driven proposed nomenclature for metabolic associated fatty liver disease. Gastroenterology. 2020;158(7):1999–2014.e1991. doi:10.1053/j.gastro.2019.11.312
2. Eslam M, Newsome PN, Sarin SK, et al. A new definition for metabolic dysfunction-associated fatty liver disease: an international expert consensus statement. J Hepatol. 2020;73(1):202–209. doi:10.1016/j.jhep.2020.03.039
3. Chalasani N, Younossi Z, Lavine JE, et al. The diagnosis and management of nonalcoholic fatty liver disease: practice guidance from the American Association for the Study of Liver Diseases. Hepatology. 2018;67(1):328–357. doi:10.1002/hep.29367
4. Hazlehurst JM, Woods C, Marjot T, Cobbold JF, Tomlinson JW. Non-alcoholic fatty liver disease and diabetes. Metabolism. 2016;65(8):1096–1108. doi:10.1016/j.metabol.2016.01.001
5. Arrese M, Barrera F, Triantafilo N, Arab JP. Concurrent nonalcoholic fatty liver disease and type 2 diabetes: diagnostic and therapeutic considerations. Expert Rev Gastroenterol Hepatol. 2019;13(9):849–866. doi:10.1080/17474124.2019.1649981
6. Hediger MA, Johnson RJ, Miyazaki H, Endou H. Molecular physiology of urate transport. Physiology. 2005;20:125–133. doi:10.1152/physiol.00039.2004
7. Johnson RJ, Kang DH, Feig D, et al. Is there a pathogenetic role for uric acid in hypertension and cardiovascular and renal disease? Hypertension. 2003;41(6):1183–1190. doi:10.1161/01.HYP.0000069700.62727.C5
8. Chen YL, Li H, Li S, et al. Prevalence of and risk factors for metabolic associated fatty liver disease in an urban population in China: a cross-sectional comparative study. BMC Gastroenterol. 2021;21(1):212. doi:10.1186/s12876-021-01782-w
9. Darmawan G, Hamijoyo L, Hasan I. Association between serum uric acid and non-alcoholic fatty liver disease: a meta-analysis. Acta Med Indones. 2017;49(2):136–147.
10. Al-Daghri NM, Al-Attas OS, Wani K, Sabico S, Alokail MS. Serum uric acid to creatinine ratio and risk of metabolic syndrome in Saudi type 2 diabetic patients. Sci Rep. 2017;7(1):12104. doi:10.1038/s41598-017-12085-0
11. Li M, Gu L, Yang J, Lou Q. Serum uric acid to creatinine ratio correlates with β-cell function in type 2 diabetes. Diabetes Metab Res Rev. 2018;34(5):e3001. doi:10.1002/dmrr.3001
12. Alberti KG, Zimmet PZ. Definition, diagnosis and classification of diabetes mellitus and its complications. Part 1: diagnosis and classification of diabetes mellitus provisional report of a WHO consultation. Diabet Med. 1998;15(7):539–553. doi:10.1002/(SICI)1096-9136(199807)15:7<539::AID-DIA668>3.0.CO;2-S
13. Younossi ZM, Golabi P, de Avila L, et al. The global epidemiology of NAFLD and NASH in patients with type 2 diabetes: a systematic review and meta-analysis. J Hepatol. 2019;71(4):793–801. doi:10.1016/j.jhep.2019.06.021
14. Adinolfi LE, Petta S, Fracanzani AL, et al. Reduced incidence of type 2 diabetes in patients with chronic hepatitis C virus infection cleared by direct-acting antiviral therapy: a prospective study. Diabetes Obes Metab. 2020;22(12):2408–2416. doi:10.1111/dom.14168
15. Adinolfi LE, Petta S, Fracanzani AL, et al. Impact of hepatitis C virus clearance by direct-acting antiviral treatment on the incidence of major cardiovascular events: a prospective multicentre study. Atherosclerosis. 2020;296:40–47. doi:10.1016/j.atherosclerosis.2020.01.010
16. Sasso FC, Pafundi PC, Caturano A, et al. Impact of direct acting antivirals (DAAs) on cardiovascular events in HCV cohort with pre-diabetes. Nutr Metab Cardiovasc Dis. 2021;31(8):2345–2353. doi:10.1016/j.numecd.2021.04.016
17. Rinaldi L, Pafundi PC, Galiero R, et al. Mechanisms of non-alcoholic fatty liver disease in the metabolic syndrome. A narrative review. Antioxidants. 2021;10(2):270.
18. Caturano A, Acierno C, Nevola R, et al. Non-alcoholic fatty liver disease: from pathogenesis to clinical impact. Processes. 2021;9(1):135. doi:10.3390/pr9010135
19. Masarone M, Rosato V, Aglitti A, et al. Liver biopsy in type 2 diabetes mellitus: steatohepatitis represents the sole feature of liver damage. PLoS One. 2017;12(6):e0178473. doi:10.1371/journal.pone.0178473
20. Wijarnpreecha K, Panjawatanan P, Lekuthai N, Thongprayoon C, Cheungpasitporn W, Ungprasert P. Hyperuricaemia and risk of nonalcoholic fatty liver disease: a meta-analysis. Liver Int. 2017;37(6):906–918. doi:10.1111/liv.13329
21. Zheng X, Gong L, Luo R, et al. Serum uric acid and non-alcoholic fatty liver disease in non-obesity Chinese adults. Lipids Health Dis. 2017;16(1):202. doi:10.1186/s12944-017-0531-5
22. Liu J, Xu C, Ying L, et al. Relationship of serum uric acid level with non-alcoholic fatty liver disease and its inflammation progression in non-obese adults. Hepatol Res. 2017;47(3):E104–E112. doi:10.1111/hepr.12734
23. Wu SJ, Zhu GQ, Ye BZ, et al. Association between sex-specific serum uric acid and non-alcoholic fatty liver disease in Chinese adults: a large population-based study. Medicine. 2015;94(17):e802. doi:10.1097/MD.0000000000000802
24. Kawamoto R, Tabara Y, Kohara K, Kusunoki T, Abe M, Miki T. Serum uric acid is more strongly associated with impaired fasting glucose in women than in men from a community-dwelling population. PLoS One. 2013;8(6):e65886. doi:10.1371/journal.pone.0065886
25. Zelber-Sagi S, Ben-Assuli O, Rabinowich L, et al. The association between the serum levels of uric acid and alanine aminotransferase in a population-based cohort. Liver Int. 2015;35(11):2408–2415. doi:10.1111/liv.12842
26. Hwang IC, Suh SY, Suh AR, Ahn HY. The relationship between normal serum uric acid and nonalcoholic fatty liver disease. J Korean Med Sci. 2011;26(3):386–391. doi:10.3346/jkms.2011.26.3.386
27. Lim S, Kim JW, Targher G. Links between metabolic syndrome and metabolic dysfunction-associated fatty liver disease. Trends Endocrinol Metab. 2021;32(7):500–514. doi:10.1016/j.tem.2021.04.008
28. Sautin YY, Nakagawa T, Zharikov S, Johnson RJ. Adverse effects of the classic antioxidant uric acid in adipocytes: NADPH oxidase-mediated oxidative/nitrosative stress. Am J Physiol Cell Physiol. 2007;293(2):C584–596. doi:10.1152/ajpcell.00600.2006
29. Li C, Hsieh MC, Chang SJ. Metabolic syndrome, diabetes, and hyperuricemia. Curr Opin Rheumatol. 2013;25(2):210–216. doi:10.1097/BOR.0b013e32835d951e
30. Lanaspa MA, Sanchez-Lozada LG, Choi YJ, et al. Uric acid induces hepatic steatosis by generation of mitochondrial oxidative stress: potential role in fructose-dependent and -independent fatty liver. J Biol Chem. 2012;287(48):40732–40744. doi:10.1074/jbc.M112.399899
31. Sakurai Y, Kubota N, Yamauchi T, Kadowaki T. Role of insulin resistance in MAFLD. Int J Mol Sci. 2021;22(8):4156. doi:10.3390/ijms22084156
32. Tilg H, Moschen AR. Evolution of inflammation in nonalcoholic fatty liver disease: the multiple parallel hits hypothesis. Hepatology. 2010;52(5):1836–1846. doi:10.1002/hep.24001
33. Buzzetti E, Pinzani M, Tsochatzis EA. The multiple-hit pathogenesis of non-alcoholic fatty liver disease (NAFLD). Metabolism. 2016;65(8):1038–1048. doi:10.1016/j.metabol.2015.12.012
34. Park SH, Kim BI, Yun JW, et al. Insulin resistance and C-reactive protein as independent risk factors for non-alcoholic fatty liver disease in non-obese Asian men. J Gastroenterol Hepatol. 2004;19(6):694–698. doi:10.1111/j.1440-1746.2004.03362.x
35. Zhu Y, Hu Y, Huang T, et al. High uric acid directly inhibits insulin signalling and induces insulin resistance. Biochem Biophys Res Commun. 2014;447(4):707–714. doi:10.1016/j.bbrc.2014.04.080
36. Baldwin W, McRae S, Marek G, et al. Hyperuricemia as a mediator of the proinflammatory endocrine imbalance in the adipose tissue in a murine model of the metabolic syndrome. Diabetes. 2011;60(4):1258–1269. doi:10.2337/db10-0916
37. Afzali A, Weiss NS, Boyko EJ, Ioannou GN. Association between serum uric acid level and chronic liver disease in the United States. Hepatology. 2010;52(2):578–589. doi:10.1002/hep.23717
38. Choi YJ, Shin HS, Choi HS, et al. Uric acid induces fat accumulation via generation of endoplasmic reticulum stress and SREBP-1c activation in hepatocytes. Lab Invest. 2014;94(10):1114–1125. doi:10.1038/labinvest.2014.98
39. Ackerman Z, Oron-Herman M, Grozovski M, et al. Fructose-induced fatty liver disease: hepatic effects of blood pressure and plasma triglyceride reduction. Hypertension. 2005;45(5):1012–1018. doi:10.1161/01.HYP.0000164570.20420.67
40. Wan X, Xu C, Lin Y, et al. Uric acid regulates hepatic steatosis and insulin resistance through the NLRP3 inflammasome-dependent mechanism. J Hepatol. 2016;64(4):925–932. doi:10.1016/j.jhep.2015.11.022
41. Lanaspa MA, Sanchez-Lozada LG, Cicerchi C, et al. Uric acid stimulates fructokinase and accelerates fructose metabolism in the development of fatty liver. PLoS One. 2012;7(10):e47948. doi:10.1371/journal.pone.0047948
42. Stojsavljević S, Gomerčić Palčić M, Virović Jukić L, Smirčić Duvnjak L, Duvnjak M. Adipokines and proinflammatory cytokines, the key mediators in the pathogenesis of nonalcoholic fatty liver disease. World J Gastroenterol. 2014;20(48):18070–18091. doi:10.3748/wjg.v20.i48.18070
43. Furman D, Campisi J, Verdin E, et al. Chronic inflammation in the etiology of disease across the life span. Nat Med. 2019;25(12):1822–1832. doi:10.1038/s41591-019-0675-0
44. Xie D, Zhao H, Lu J, et al. High uric acid induces liver fat accumulation via ROS/JNK/AP-1 signaling. Am J Physiol Endocrinol Metab. 2021;320(6):E1032–e1043. doi:10.1152/ajpendo.00518.2020
45. Khosla UM, Zharikov S, Finch JL, et al. Hyperuricemia induces endothelial dysfunction. Kidney Int. 2005;67(5):1739–1742. doi:10.1111/j.1523-1755.2005.00273.x
46. Ucar F, Sezer S, Erdogan S, Akyol S, Armutcu F, Akyol O. The relationship between oxidative stress and nonalcoholic fatty liver disease: its effects on the development of nonalcoholic steatohepatitis. Redox Rep. 2013;18(4):127–133. doi:10.1179/1351000213Y.0000000050
47. Tariq Z, Green CJ, Hodson L. Are oxidative stress mechanisms the common denominator in the progression from hepatic steatosis towards non-alcoholic steatohepatitis (NASH)? Liver Int. 2014;34(7):e180–e190. doi:10.1111/liv.12523
48. Wang M, Zhao D, Li GW, et al. [Correlation between serum uric acid and insulin resistance]. Zhonghua Yi xue Za Zhi. 2007;87(46):3260–3263. Chinese.
49. Ghaemi-Oskouie F, Shi Y. The role of uric acid as an endogenous danger signal in immunity and inflammation. Curr Rheumatol Rep. 2011;13(2):160–166. doi:10.1007/s11926-011-0162-1
50. Ruggiero C, Cherubini A, Ble A, et al. Uric acid and inflammatory markers. Eur Heart J. 2006;27(10):1174–1181. doi:10.1093/eurheartj/ehi879
 © 2022 The Author(s). This work is published and licensed by Dove Medical Press Limited. The
full terms of this license are available at https://www.dovepress.com/terms
and incorporate the Creative Commons Attribution
- Non Commercial (unported, 3.0) License.
By accessing the work you hereby accept the Terms. Non-commercial uses of the work are permitted
without any further permission from Dove Medical Press Limited, provided the work is properly
attributed. For permission for commercial use of this work, please see paragraphs 4.2 and 5 of our Terms.
© 2022 The Author(s). This work is published and licensed by Dove Medical Press Limited. The
full terms of this license are available at https://www.dovepress.com/terms
and incorporate the Creative Commons Attribution
- Non Commercial (unported, 3.0) License.
By accessing the work you hereby accept the Terms. Non-commercial uses of the work are permitted
without any further permission from Dove Medical Press Limited, provided the work is properly
attributed. For permission for commercial use of this work, please see paragraphs 4.2 and 5 of our Terms.