Back to Journals » Journal of Multidisciplinary Healthcare » Volume 13
Relationship Between Nonconveyed Cases and On-Scene Time Intervals for Emergency Medical Services
Authors Alrazeeni DM ![]()
Received 21 September 2020
Accepted for publication 15 November 2020
Published 8 December 2020 Volume 2020:13 Pages 1895—1904
DOI https://doi.org/10.2147/JMDH.S279693
Checked for plagiarism Yes
Review by Single anonymous peer review
Peer reviewer comments 3
Editor who approved publication: Dr Scott Fraser
Daifallah M Alrazeeni
Academic Affairs, Prince Sultan Bin Abdulaziz College for EMS, King Saud University, Riyadh, Saudi Arabia
Correspondence: Daifallah M Alrazeeni
Academic Affairs, Prince Sultan Bin Abdulaziz College for EMS, King Saud University, Riyadh, Saudi Arabia
Tel +966-55-507-0033
Fax +009668059229
Email [email protected]
Purpose: Emergency medical service (EMS) consumption is increasing worldwide. Some EMS cases in Saudi Arabia result in nonconveyance of patients. The aim of the present study was to determine the relationship between nonconveyed EMS cases and on-scene time intervals in Riyadh EMS centers.
Methods: Nonrandomized retrospective data obtained from EMS providers of nonconveyed emergency cases were gathered and analyzed. Data were taken from the ten busiest EMS centers in Riyadh, Saudi Arabia from January 1 to April 30, 2019. Analyses of means ± SD, bivariate comparisons, multivariate analysis, CI correlations, and regressionwere performed.
Results: Categories of nonconveyed cases were “Treatment given at the scene” V1 = 66, “Refused by patient/relative” (V2 = 876), “Patient not found” (V3 = 67), “Dead patient” (V4 = 80”, “Other (police, etc)” (V5 = 34), and NA (96). We found highly significant differences (p< 0.001) among several categories of nonconveyed cases and on-scene time intervals among EMS centers.
Conclusion: This study found that there were highly significant differences among several categories of nonconveyed cases in relation to on-scene time intervals for different EMS centers. Results indicated that the probability of nonconveyance decisions was more likely to increase in the categories “Refused by patient/relative,” “Patient not found,” and “Dead patient.” The results did not reveal details of what happened on scene during or after the nonconveyance decision had been made, which needs to be investigated.
Keywords: nonconveyed cases, on-scene time interval, emergency medical service paramedics
Introduction
The Saudi Red Crescent Authority is the system provider of emergency medical services (EMSs) in Saudi Arabia. It has a presence in all 13 provinces, running >1,290 ambulances, employing nearly 6,000 EMS providers, and operating more than 400 stand-alone EMS centers.1 The Saudi EMS is operated based on
Article 5 of the regulations of the Saudi Red Crescent Authority, which stipulates that in order to achieve its objectives, the authority shall undertake the task of providing EMSs as the main provider of these services in Saudi Arabia, and this includes ambulance transportation and prehospital health services for patients and those injured in accidents and disasters.2
Saudi EMS operations result in a wide range of conveyance and nonconveyance cases for patients. A summary report of the Saudi EMS showed that nearly 480,000 calls were received in 2019 and 20% (97,832) of patients nonconveyed.3 Specifically, in Riyadh >58,000 calls were received in the same year, and 11,252 patients nonconveyed.4 Nonconveyance of EMS cases in Saudi Arabia is notable in both ground- and air-ambulance operations.5
Generally, EMS consumption is increasing steadily worldwide. A couple of reasons for this are increased aging populations and changes in social support and accessibility. EMS systems are expected to maintain quality of care and level of accessibility to the services.6 Commonly, 10% of EMS cases are characterized as critical emergencies.7 Moreover, increased EMS-response volume is associated with a spontaneous increase in the proportion of nonconveyed cases.8,9
EMS providers attending the scene may decide not to convey all patients to hospital.10 For decades, nonconveyance after dispatching EMS units has been perceived as a hindrance to the quality and efficiency of EMS operations the may jeopardize operational cost-effectiveness, leading to resource wastage.7 However, Paulin et al and Höglund et al posited that trends of EMS might be changing, as EMS providers are increasingly assessing and treating patients without conveyance to hospital. Nonetheless, they also asserted that this strategy should be planned and implemented carefully to ensure patient safety.11,12
In a systematic review using Medline, PubMed, CINAHL, and Embase, 67 studies found that nonconveyance rates were 3.7%–93.7%. Data released in 2017 stated that only 38% of all calls received and attended by ambulances in England were conveyed to an ED. For nonconveyed cases, 85% were patients treated and discharged at the scene (43,108 of 50,894).8 A recent report indicated that 17.7% of cases were not conveyed by ambulance.13 Moreover, Breeman et al reported that nearly 26.2% of ambulance runs resulted in nonconveyance.14
Phillips et al described reasons for nonconveyance of probable patients. Using correlations between call types and response time, thyey found that most calls were medical (54%) and (19%) nonconveyed.15 Nonconveyed patients have a variety of common initial complaints related to trauma and neurology, in addition to vulnerable patient groups, such as children and the elderly.8 Younger patients, those from rural areas, and those with mental and behavioral disorders were more likely to be nonconveyedy.14 Another investigation found that 58.6% of nonconveyed patients had at least one abnormal vital function/observation-scale measure.16
Outcomes for patients who contact EMSs and are not conveyed to an ED might change.10 Therefore, what happens to patients after nonconveyance is an interesting area to explore. A retrospective investigation reported that within 3 days of call, 9% had recontacted the ambulance service, 12.6% attended an ED, 6.3% had been admitted to hospital, and 0.3% had died. Rates increased within 7 days: 12% recontacted the ambulance service, 16.1% attended an ED, 9.3% were admitted to hospital, and 0.5% died.10 Other evidence showed that within 24–hours after nonconveyance, 2.5%–6.1% of patients had had recontacted EMSs and 4.6%–19.0% had presented themselves at an ED. Mortality rates vary from 0.2%–3.5% after 24 hours to 0.3%–6.1% after 72 hours.8 A prospective observation by Breeman et a, conducted to cross-check whether decisions made by EMS nurses not to convey patients to a hospital were correct or not. The study found that of the 1,095 participating patients, 271 (24.7%) requested secondary medical attention for the same complaint. A total of 873 (79.7%) patients were satisfied with the nonconveyance, and 44 (4.0%) thought that the EMS nurse’s nonconveyance decision was incorrect, as the patient needed help afterward.14
However, patients may refuse conveyance, and in certain circumstances EMS providers refuse patient conveyance. In cases where conveyance is refused by EMS providers, there is evidence that most of these clients did not require urgent medical care.8,14,17 Nonetheless, nonconveyance occurs in all types of EMS systems and general patient populations.
For those patients who refuse to be conveyed, alternative methods, such as community services, alternative transport, and specific interventions, including community fall-prevention programs, have been suggested.2019)8,18,19 Other suggested alternatives include treatment and release on scene or referral to a primary health–care facility.
On another note, prior assessment of patients by EMS personnel is a factor required to identify nonurgent cases that are less likely to need emergency care.20 Other factors that may motivate the nonconveyance decisions have been identified, including patients with low-acuity conditions and EMS-triage competence of dispatchers and paramedics.8,18 Ebben et al suggested that factors influencing nonconveyance decisions are related to the professional (competence, experience, intuition), the patient (health status, refusal, wishes, and best interests), the health-care system (access to general practitioner/other health-care facilities/patient information), and supportive tools (online medical control, high-risk card).8 However, insufficient triage ability of dispatchers and EMS providers is a factor that presumably affects triage accuracy and assessment of severity of the patient’s condition.14
“On-scene time interval” is defined as the time EMS providers stay on scene by the patient’s side until conveyance.21,22 Several studies have measured on-scene time interval and its status when EMS procedures were applied. The regular on-scene time interval is 11 minutes, which is prolonged by performing advanced life support (ALS) and basic life support (BLS) procedures. Others have found that the average on-scene time interval was 15–24 minutes.
Death or suspicion of death is time-consuming for EMS providers. A recently report found that deaths at the scene accounted for 9% of cases.23,24 In addition, minor trauma was the most frequent condition among nonconveyed cases: 27% were treated and released at the scene, 24% refused treatment, 39% were left with their relatives, 36% were left alone, and 18% were left with the police.
Little information is available on what really happens to patients at the scene while the ambulance crew is there after making a nonconveyance decision. In addition, the literature reviewed did not address the relationship between nonconveyed cases and the time interval that the ambulance crew spend on scene. Moreover, in an attempt to benefit from information obtained from reports of such cases, the aim was to examine the data obtained from EMS operations to find out more iabout nonconveyed cases. As such, the present study aimed to determine the relationship between nonconveyed EMS cases and on-scene time interval in Riyadh EMS centers.
Since these nonconveyances had already occurred, several questions were chosen for investigation. After the nonconveying decision was made, does the EMS system set a time limit interval on providers staying at the scene? How long do EMS providers stay at the scene? And why? Do EMS providers stay at the scene longer for certain categories of nonconveyance? Are there any other differences regarding on-scene time interval among various categories of nonconveyed cases? Dose consultation with various parties prolong on-scene time interval? What are the formalities and paperwork that have to be done? Do EMS providers spend less or longer at the scene for official places (eg, police departments)? What are the alternatives of nonconveyance provided to the patients? Such assumptions will be linked, if there is any linkage, to the results and discussed.
Methods
Design
Nonrandomized retrospective data of nonconveyed emergency cases were obtained from the EMS-service agency and analyzed. Data were collected from the ten busiest EMS centers in Riyadh from January 1 to April 30, 2019. Nonconveyed cases and on-scene time intervals of EMS providers with patients for each EMS center were analyzed. Data regarding canceled calls were excluded.
Data Analysis
Data are expressed as means ± SD. Bivariate comparisons were performed using χ2 tests for continuous and discrete variables. Multivariate analysis was performed using logistic regression, and results are expressed as ORs and 95% CIs, in accordance with Schwabe et al.25 Finally, correlational and regression analysis were fitted throughout (Proc Corr and Reg; SAS Institute)26 (Kleinman & Horton, 2010).27
Ethical Considerations
The present study was approved by the Institutional Review Board at King Saud University (E-20-5244). Data collected were from official documents of the EMS agency. As these data encompass confidential information, measures were applied to protect the confidentiality of information. Data were kept by the primary researcher. Only necessary data were extracted, and separately and carefully handled.
Results
Total emergency calls made to the dispatcher and assigned to the ten EMS centers in Riyadh within the 3-month period numbered 7,179. Of those, 5,387 (75.05%) cases were conveyed to hospitals, but this was not the focus of the present study. The remaining 1,792 (24.95%) were considered nonconveyed. Of these, 402 (22.38%) had been canceled by the dispatcher, and were excluded from the analysis. Additionally, 171 (8.8%) cases had insufficient information and were excluded. Two data sets were extracted and cross-tabulated as center number vs number of cases in each category for nonconveyed cases and number of cases vs on-scene time interval. Figure 1 shows cases that were included in the study, which was 68% (1,220) of all nonconveyed cases.
 |
Figure 1 Nonconveyed cases included in the study. |
Nonconveyed Cases
Table 1 and Figure 2 summarizes the six categories of nonconveyed cases. “Refused by patient/relatives” represented 876 (71.86%) of all nonconveyed cases, and had the highest values in two centers: 146 (15%) and 131 (13.5%) cases. The mean for this category in all centers was 87.6±34.06, indicating a higher score than the rest. Nonetheless, EMS Centers 22 and 24 were found to record the highest in nonconveyed cases, presenting 232 and 189 cases (19% and 15.5%), respectively.
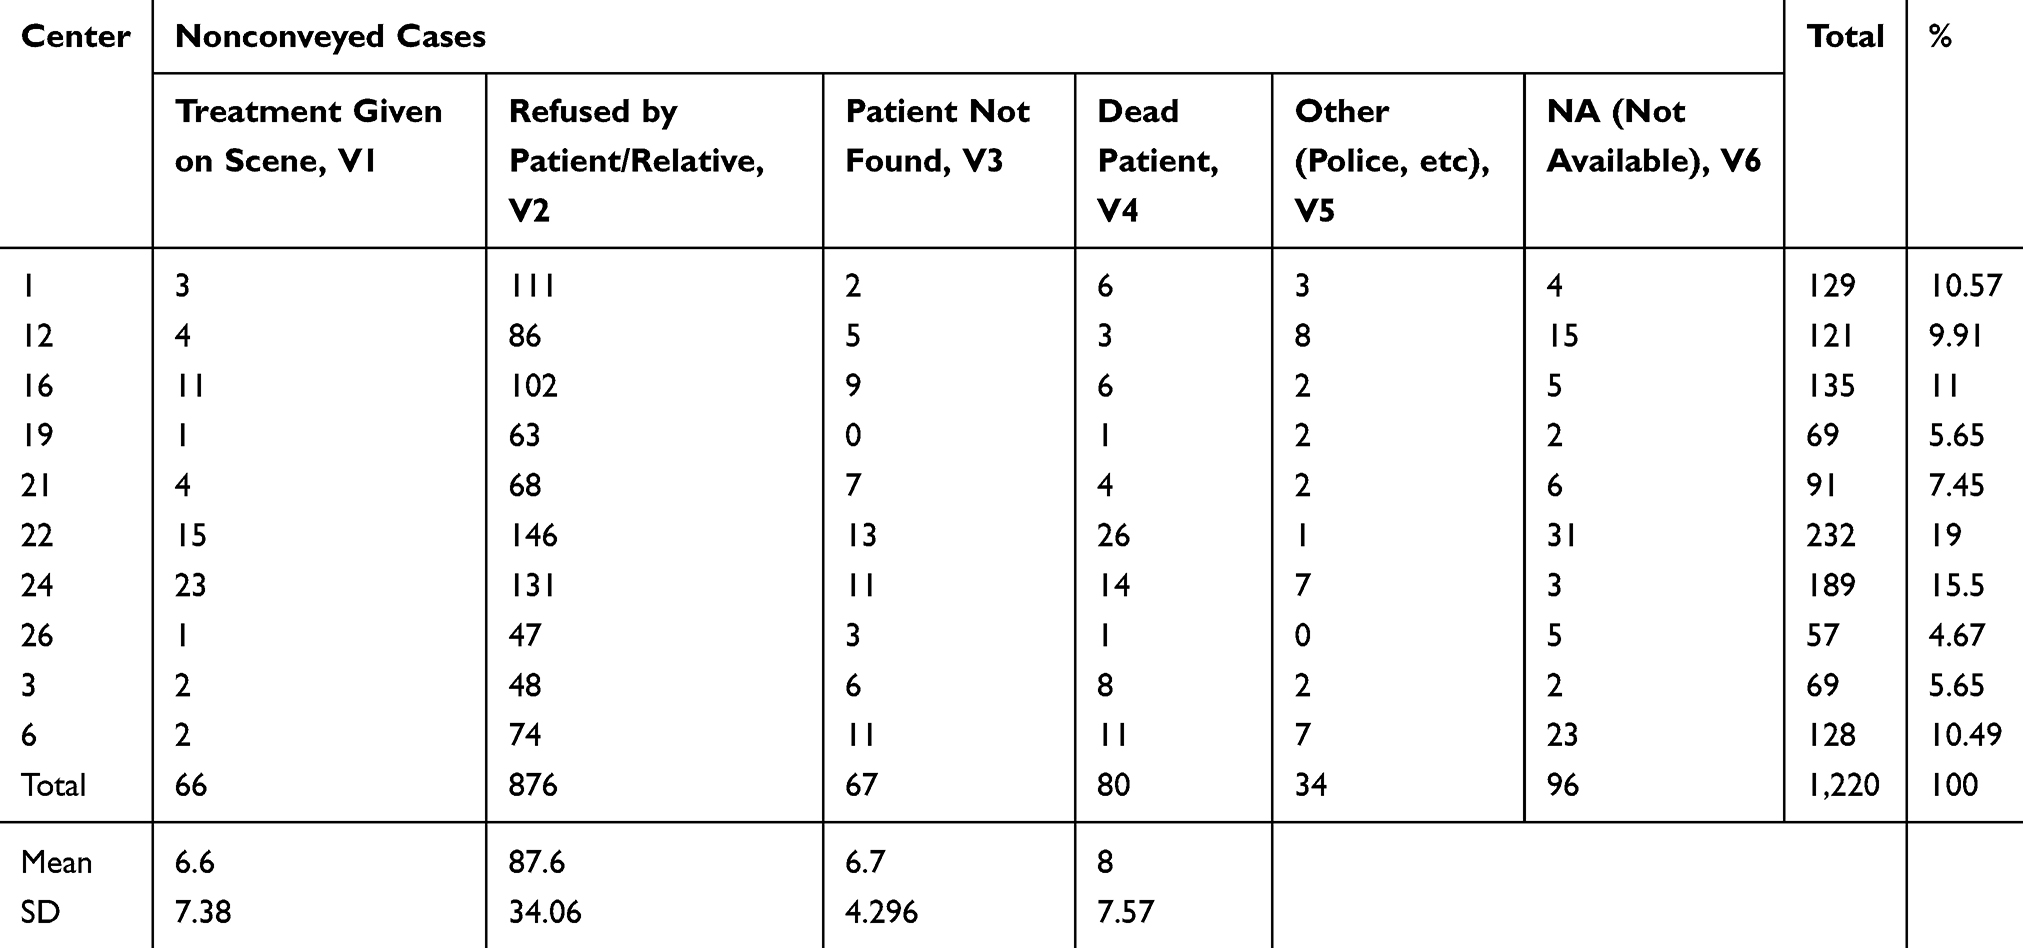 |
Table 1 Center vs Categories of Nonconveyed Cases |
 |
Figure 2 Station vs category for nonconveyed cases. |
On-Scene Time Interval
On-scene time-interval data were evaluated and divided into five time-categories (1–10, 11–20, 21–30, and >30 minutes), as shown in Table 2 and Figure 3. In the 11- to 20-minute category, all centers had a total of 323 (26.4%) cases and above average for the rest of the time intervals, whereas Center 24 had the highest value in nonconveyed cases, amounting to 64 cases (19.8%). The mean this category in all centers was 32.3±18.12.
 |
Table 2 Centers vs On-Scene Time Intervals |
 |
Figure 3 EMS center vs on-scene time interval of nonconveyed cases. |
Statistical Analysis
As presented in Table 3, the results indicated that the “Refused by patient/relative,” “Patient not found,” “Dead patient,” and “NA not available” categories were more likely to increase the probability of nonconveyed cases by about 44.608-, 1.016-, 1.226-, and 1.493-fold, respectively, compared with the “Treatment given on-scene” category. Moreover, the “Other (police, etc)” category was more likely to decrease the probability of nonconveyed cases for different centers by approximately 0.501-fold, with pronounced significant effects for the “Refused by patient/relative,” “Other (police, etc),” and “NA (not available)” categories (p<0.05).
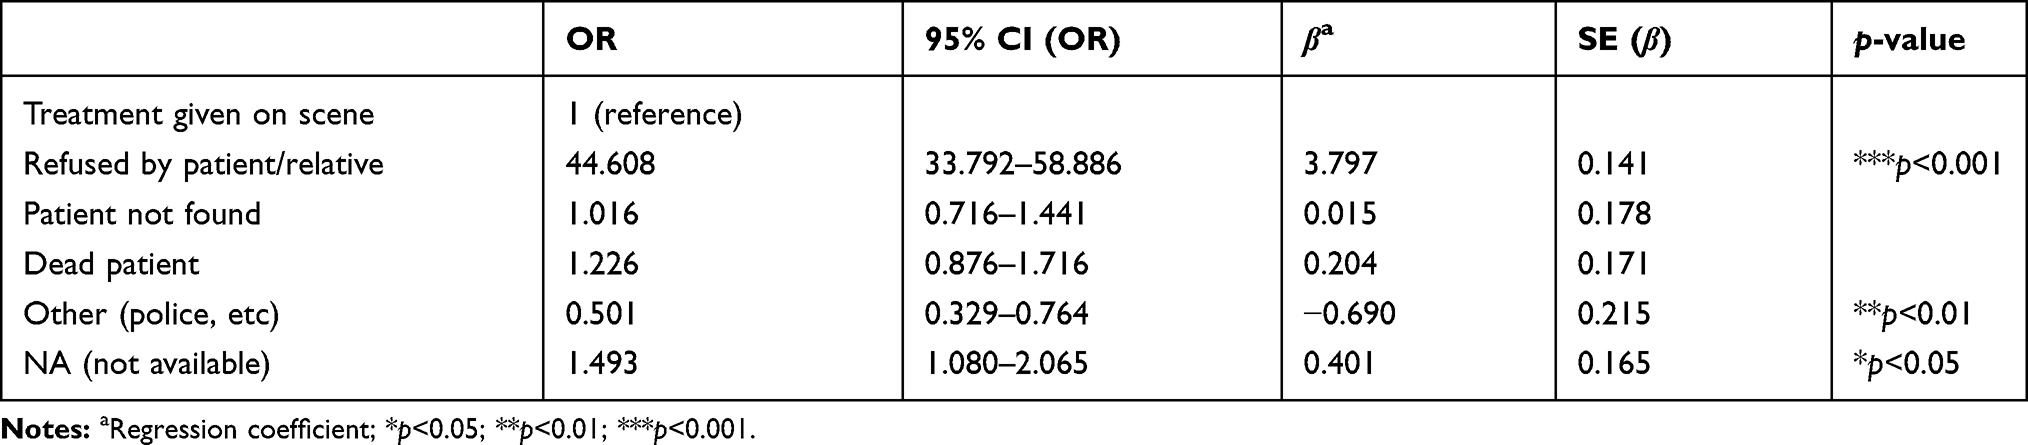 |
Table 3 Final Logistic Regression Model of Categories Associated with Nonconveyed Cases |
There were highly significant differences (p<0.001) among categories of nonconveyed cases for different centers, varying from 146 cases for the “Refused by patient/relative” category at center 24 to none for the “Patient not found” and “Other (police, etc)” categories at centers 19 and 26, respectively. Additionally, there were highly significant differences (p<0.001) among centers for categories of nonconveyed cases, which are shown in Table 4.
 |
Table 4 Distribution of Categories of Nonconveyed Cases Among Centers |
As shown in Table 5, there were highly significant differences (p<0.001) among categories of on-scene time interval for centers, varying from 111 cases for the NA category in center 22 to three cases for the >30 category in center 2. Additionally, there were highly significant differences (p<0.001) among centers for categories of on-scene time interval.
 |
Table 5 Distribution of Categories of On-Scene Time Interval Among Centers |
Table 6 demonstrates that there were pronounced significant differences (p<0.05) among all categories for nonconveyed cases for different centers, except for the “Other (police, etc)” category, compared with the categories “Treatment given on-scene,” “Refused by patient/relative,” “Patient not found,” and “Dead patient.” Also, the categories “Refused by patient/relative” and “Patient not found,” and “NA (not available)” showed nonsignificant associations with the categories “Treatment given on-scene,” “Refused by patient/relative,” and “Other (police, etc,” p>0.05).
 |
Table 6 Correlation Coefficients Among Categories of Nonconveyed Cases |
Table 7 indicates significant differences (p>0.05) among all categories of on-scene time interval for centers, except for those in the 1–10, 11–20, and 21–30 categories. Also, the 11–20 and 21–30 categories showed significant relationships (p<0.05) with the NA and >30 categories.
 |
Table 7 Correlation Coefficients Among Categories of On-Scene Time Interval |
Among several types of polynomial regression analysis, quadratic regression was considered best to describe associations between number of cases and on-scene time-interval categories — y=437.20−252.32 (x) + 51.07 (x2 — where y is the number of cases and x the value of the on-scene time-interval categories shown in Table 8.
 |
Table 8 Polynomial Regression Analysis o Number of Cases and On-Scene Time–Interval Categories |
Discussion
The present study focused on determining the relationship between nonconveyed EMS cases and on-scene time interval for Riyadh EMS services. No such study in a similar setting has been reported. Several studies on nonconveyed cases have been conducted by the authors of the present study.28 As such, no previous studies can be compared with this study’s outcome in terms of the setting. Moreover, the present study was limited to analyzing specific data related to nonconveyed cases, which makes it difficult to compare exact outcomes with reviewed literature.
In the present study, the total emergency cases recorded within the aforementioned period were 7,178, of which 5,387 conveyed cases were excluded. The remaining 1,792 (25%) nonconveyed cases were included and classified into categories according to the report of the EMS providers: “Treatment given at the scene” (V1 = 66), “Refused bypatient/relative” (V2 = 876), “Patient not found” (V3 = 67), “Dead patient” (V4 = 80), “Other (police, etc)” (V5 = 34), and “NA (not available)” = 96. The results suggest a main factor in nonconveyance was refusal by patients and relatives, which also was one of the factors reported by Ebben et al, 2017.(health status, refusal, wishes, and best interests).8
We found that nonconveyed cases accounted for approximately 25% of all received EMS calls. This falls within the range stated by Ebben et al in systematic review8 and is similar to the finding of Breeman et al, where 26.2% of ambulance runs resulted in nonconveyance.14 This study’s result is lower than that found for the London metropolitan area, where 38%, were not in need of emergency assistance and not conveyed.8 However, it was higher than that reported by Eastwood et al,13 where 17.7% of cases were not conveyed by ambulance emergency and were inappropriate. Furthermore, our results showed a high percentage (71.86%) of patient/relative-initiated decisions for all nonconveyed cases.
Coster et al, 201910 and Funder et al23 reported that cases where the patient was found dead represented 9%, while we found that these cases accounted for 6.5% of nonconveyed cases. Characteristics of nonconveyed cases classified as minor trauma, found by Snooks et al, 200420 were greatly similar to the results of the present study. They found that 27% of nonconveyed cases were treated and released at the scene, whereas this was only 5.5% in the present study, and of the 39% that refused treatment, we found that 71.86% of these refusals were initiated by the patients or relatives.
EMS operations tend to face obstacles in setting clear for criteria of patient conveyance, as well as to what medical center the patients should be conveyed, due to many factors associated with patients and their health conditions, which may conflict with system-operation regulations and requirements. These may affect the EMS provider’s decision on whether to convey patients or not. Moreover, it can highly affect the patient’s decision to be conveyed or not. From the patient’s perspective, this may be affected by level of suffering, psychological status, responsibilities at home or outside the home, or even the influence of relatives. From the EMS providers’ end, their judgment may be affected by assessment competence, busyness of the services, or previousshouldon-time commands given them by directors. This study acknowledges that refusal or nonconveyance of a patient with a critical medical condition is not a simple concept. Consequences for the patient can be devastating. Other long-term effects on system credibility and trustworthiness in the community are predictable. Moreover, focused investigation is required to clarify alternative medical procedures given to patients instead of ambulance conveyance.
In agreement with Eckstein et al and Carr et al,21,22 the average on-scene time interval for nonconveyed cases was 10–20 minutes in 323 cases (26.4%). On-scene time intervals in critical cases were longer and varied between BLS crews and ALS crews.21,22 Although the aforementioned duration sits within this study’s result range, we were unfortunately unable to predict whether or not EMS providers and procedures rendered were following ALS or BLS protocols or how these processes influenced on-scene time interval. This study revealed average on-scene time interval for nonconveyed medical cases and on-scene time interval for trauma patients close to Carr et al,:22 15–24 minutes.
Due to inadequate information and inability to obtain further details from patients, the present study cannot definitively confirm the outcomes of Ebben et al and Breeman et al to determine the extent of medical need of those patients or the appropriateness of response.8,14 Another study emphasized following up patients or relatives to explore whetherunconveyed patients required immediate/urgent medical care or not. Moreover, as the way it was written in the repots to be chosen and singed by patients and/or EMS provider, further emphasis needs to be placed upon determining who exactly made the decision to refuse : patient, relative(s), or EMS personnel.
This study found that there were highly significant differences (p<0.001) among several categories of nonconveyed cases and various categories of on-scene time interval for different EMS centers. The “Treatment given on-scene,” “Refused by patient/relative,” “Patient not found,” “Dead patient,” and “NA (not available)” categories increased the probability of nonconveyance of patients 44.608-, 1.016-, 1.226-, and 1.493-fold, respectively. However, the “Others (police etc)” category decreased the probability of nonconveyance 0.501-fold. This indicated that EMS units spent longer at unofficial locations and public and personally owned places. Shorter on-scene time intervals are markedly associated with high-discipline locations, such as police stations, where patients have no control and sound decision-making may be impaired. Nonetheless, EMS providers may need to take longer with the category “Dead patient” to provide social and emotional support to the family or provide information in cases of crime.
The results indicated that the probability of nonconveyance decisions increased for “Refused by patient/relative,” “Patient not found,” “Dead patient,” and “NA (not available),” which showed highly significant differences (p<0.001) among categories of nonconveyed cases and highly significant differences (p<0.001) among categories of on-scene time interval, as well as pronounced significant relationships (p<0.05) among all categories for nonconveyed cases. However, there were no significant associations (p>0.05) among categories of on-scene time interval, except for those between the 1–10 category and 11–20 and 21–30 categories.
Several assumptions related to nonconveyance of cases were emphasized based on the research aim, and we succeeded in obtain such data.. Unfortunately, the type of data obtained did not help in finding sufficient answers for all the assumptions. The reports located were specifically for nonconveyed patients. There was a great deal of missing and neglected information and insufficient evidence to clarify any perceptions regarding patients’ conditions.
In its objectives, the Saudi EMS assures that its services reach patients in a fast manner and provide timely follow-up to crew at the scene.2 However, thereports reviewed did not show any timing requirements regarding the duration of on-scene stay. Some of the details of what happened at the scene that led to the team staying longer may have been discussed with the dispatcher without being documented in the reports. Furthermore, it is difficult to draw any conclusion that those patients were in poormedical condition, as the majority of reports lacked vital-sing records. Nonetheless, these obvious limitations can be overcome by obtaining additional clarification from patients, EMS providers, and dispatchers about what happened at the scene. This ishould be an objective for future research investigation to reveal more information about the circumstances of each nonconveyed case.
Another side of the dilemma is the lack of utilization and effectiveness of information technology, regulation, and accountability that help in making conveyance decisions or even controlling the length of on-scene time intervals. Communication systems between the EMS providers and EMS directors and/or medical directors of the receiving hospital, as well as the capability of these systems to help in reducing on-scene time intervals, may not be as efficient as they should be. Moreover, the EMS agency does not seem to utilize strict measures for refusal decisions to protect patient rights and avoid any legal action against the system. The present study found a notable deficiency in applcation of thorough assessment schemes for nonconveyed cases. This can be a research topic in a separate paper. Incomplete documentation seems to have negative effects on all reviewed data. This points to the need to establish an electronic documentation platform to overcome such operational deficiency. Nonetheless, this remains an area for in-depth analysis and research.
Conclusion
This study found that there are highly significant differences among several categories of nonconveyed cases in relation to on-scene time interval for EMS centers. The results indicated that nonconveyance decisions were more likely to increase within the categories “Refused by patient/relative,” “Patient not found,” and “Dead patient.” This indicates that EMS units spent longer at unofficial locations than at the scene in official locations (eg, police stations). The results did not reveal details of what happened at the scene when the nonconveyance decision was made or after. Additional clarification from patients, EMS providers, and dispatchers in this regard is needed for further research.
Acknowledgments
This work was supported by PSCEMS, Deanship of Scientific Research, KSU, Riyadh, Saudi Arabia, to which we are grateful. The author also extends thanks to the PSCEMS students for their participation in this study, s the Saudi Red Crescent, and Hira Shams for her manipulation, interpretation, and analysis of the data.
Disclosure
The author confirms that there is no conflicts of interest.
References
1. The general authority for statistics. Annual report of Saudi EMS; 2020. Available from: https://www.stats.gov.sa/ar/1009.
2. Resolution C. Basic Law of the Saudi Red Crescent Authority. Council of Experts in the Council of Ministers. Basic Law of the Saudi Red Crescent Authority; 2011.
3. ALwatanNP. In 20% of the emergency calls patients refuse service:11. Alwatan Publishing Co; 2019. Available from: https://www.alwatan.com.sa/article/404314.
4. Aljalajel Y. SRCA transport 65000 emergency patients in Riyadh. Aljazeerh NP; 2019. Available from: https://www.al-jazirah.com/2019/20190201/lp3.htm.
5. Alrazeeni DM. Air vs. Ground Transport. Saudi Emergency Medicine Assembly (SEMA 2015). Riyadh, Saudi Arabia; 2015.
6. Lowthian JA, Cameron PA, Stoelwinder JU, et al. Increasing utilisation of emergency ambulances. Aust Health Rev. 2011;35(1):63–69. doi:10.1071/AH09866
7. Booker MJ, Purdy S, Barnes R, Shaw ARG. Ambulance use for “primary care” problems: an ethnographic study of seeking and providing help in a UK ambulance service. BMJ Open. 2019;9(10):e033037. doi:10.1136/bmjopen-2019-033037
8. Ebben RHA, Vloet LCM, Speijers RF, et al. A patient-safety and professional perspective on non-conveyance in ambulance care: a systematic review. Scand J Trauma Resusc Emerg Med. 2017;25(1):71. doi:10.1186/s13049-017-0409-6
9. Verhage V, Tuinstra J, Bakker R. Ambulanceritten zonder vervoer van de patiënt: Een verkennende studie naar het ontstaan van ‘Eerste Hulp Geen Vervoer’-ritten. Tijds Gezondheidswetenschappen. 2014;92(3):119–124. doi:10.1007/s12508-014-0046-7
10. Coster J, O’Cathain A, Jacques R, Crum A, Siriwardena AN, Turner J. Outcomes for patients who contact the emergency ambulance service and are not transported to the emergency department: a data linkage study. Prehosp Emerg Care. 2019;23(4):566–577. doi:10.1080/10903127.2018.1549628
11. Paulin J, Kurola J, Salanterä S, et al. Changing role of EMS -analyses of non-conveyed and conveyed patients in Finland. Scand J Trauma Resusc Emerg Med. 2020;28(1):1–14. doi:10.1186/s13049-020-00741-w
12. Höglund E, Schröder A, Möller M, Andersson-Hagiwara M, Ohlsson-Nevo E. The ambulance nurse experiences of non-conveying patients. J Clin Nurs. 2019;28(1–2):235–244. doi:10.1111/jocn.14626
13. Eastwood K, Morgans A, Stoelwinder J, Smith K, Kamolz L-P. The appropriateness of low-acuity cases referred for emergency ambulance dispatch following ambulance service secondary telephone triage: a retrospective cohort study. PLoS One. 2019;14(8):e0221158. doi:10.1371/journal.pone.0221158
14. Breeman W, Poublon NA, Verhofstad MHJ, Van Lieshout EMM. Safety of on-scene medical care by EMS nurses in non-transported patients: a prospective, observational study. Scand J Trauma Resusc Emerg Med. 2018;26(1):1–9. doi:10.1186/s13049-018-0540-z
15. Phillips SE, Gaskin PS, Byer D, et al. Outcomes for patients who contact the emergency ambulance service and are not transported to the emergency department: a data linkage study. Scand J Trauma Resusc Emerg Med. 2019;14(1):1–9. doi:10.1186/s12873-020-0302-x
16. Vloet LCM, de Kreek A, van der Linden EMC, et al. A retrospective comparison between non-conveyed and conveyed patients in ambulance care. Scand J Trauma Resusc Emerg Med. 2018;26(1):1–10. doi:10.1186/s13049-018-0557-3
17. Phillips SE, Gaskin PS, Byer D, Cadogan WL, Brathwaite A, Nielsen AL. The Barbados emergency ambulance service: high frequency of nontransported calls. Emerg Med Int. 2012;2012:659392. doi:10.1155/2012/659392
18. MacKichan F, Brangan E, Wye L, et al. Why do patients seek primary medical care in emergency departments? An ethnographic exploration of access to general practice. BMJ Open. 2017;7(4):e013816. doi:10.1136/bmjopen-2016-013816
19. Lederman J, Löfvenmark C, Djärv T, Lindström V, Elmqvist C. Assessing non-conveyed patients in the ambulance service: a phenomenological interview study with Swedish ambulance clinicians. BMJ Open. 2019;9(9):1–8. doi:10.1136/bmjopen-2019-030203
20. Tohira H, Williams TA, Jacobs I, Bremner A, Finn J. The impact of new prehospital practitioners on ambulance transportation to the emergency department: a systematic review and meta-analysis. Emerg Med J. 2014;31(e1):e88–e94. doi:10.1136/emermed-2013-202976
21. Eckstein M, Chan L, Schneir A, Palmer R. Effect of prehospital advanced life support on outcomes of major trauma patients. J Trauma. 2000;48(4):643–648. doi:10.1097/00005373-200004000-00010
22. Carr BG, Brachet T, David G, Duseja R, Branas CC. The time cost of prehospital intubation and intravenous access in trauma patients. Prehosp Emerg Care. 2008;12(3):327–332. doi:10.1080/10903120802096928
23. Funder KS, Petersen JA, Steinmetz J. On-scene time and outcome after penetrating trauma: an observational study. Emerg Med J. 2011;28(9):797–801. doi:10.1136/emj.2010.097535
24. Snooks HA, Dale J, Hartley-Sharpe C, Halter M. On-scene alternatives for emergency ambulance crews attending patients who do not need to travel to the accident and emergency department: a review of the literature. Emerg Med J. 2004. doi:10.1136/emj.2003.005199
25. Schwabe CW, Riemann HP, Franti CE. Epidemiology in Veterinary Practice. Philadelphia: Lea & Febiger; 1977.
26. SAS Institute. SAS User Guide. Statistics. Version 5.
27. Kleinman K, Horton N. Introduction to SAS. In: Using SAS for Data Management, Statistical Analysis, and Graphics. 2010. doi:10.1201/ebk1439827574-c1
28. Alrazeeni DM, Sheikh SA, Mobrad A, et al. Epidemiology of non-transported emergency medical services calls in Saudi Arabia. Saudi Med J. 2016;37(5):575–578. doi:10.15537/smj.2016.5.13872
 © 2020 The Author(s). This work is published and licensed by Dove Medical Press Limited. The
full terms of this license are available at https://www.dovepress.com/terms
and incorporate the Creative Commons Attribution
- Non Commercial (unported, 3.0) License.
By accessing the work you hereby accept the Terms. Non-commercial uses of the work are permitted
without any further permission from Dove Medical Press Limited, provided the work is properly
attributed. For permission for commercial use of this work, please see paragraphs 4.2 and 5 of our Terms.
© 2020 The Author(s). This work is published and licensed by Dove Medical Press Limited. The
full terms of this license are available at https://www.dovepress.com/terms
and incorporate the Creative Commons Attribution
- Non Commercial (unported, 3.0) License.
By accessing the work you hereby accept the Terms. Non-commercial uses of the work are permitted
without any further permission from Dove Medical Press Limited, provided the work is properly
attributed. For permission for commercial use of this work, please see paragraphs 4.2 and 5 of our Terms.