Back to Journals » Diabetes, Metabolic Syndrome and Obesity » Volume 16
Relation of Red Cell Distribution Width to Glucose Metabolism and Adverse Long-Term Prognosis in Patients with Acute Coronary Syndrome
Authors Xiong K, Xu C, Shou X, Dong M ![]()
Received 2 November 2022
Accepted for publication 31 December 2022
Published 11 January 2023 Volume 2023:16 Pages 61—70
DOI https://doi.org/10.2147/DMSO.S395923
Checked for plagiarism Yes
Review by Single anonymous peer review
Peer reviewer comments 2
Editor who approved publication: Professor Gian Paolo Fadini
Ke Xiong,1 Chenbo Xu,2 Xiling Shou,1 Mengya Dong1
1Department of Cardiovascular Medicine, Shaanxi Provincial People’s Hospital, Xi’an, 710068, People’s Republic of China; 2Department of Cardiovascular Medicine, First Affiliated Hospital of Medical College, Xi’an Jiaotong University, Xi’an, 710061, People’s Republic of China
Correspondence: Mengya Dong, Department of Cardiovascular Medicine, Shaanxi Provincial People’s Hospital, 256 West Youyi Road, Xi’an, Shaanxi, 710068, People’s Republic of China, Tel +86– 15802943974, Email [email protected]
Introduction: Red cell distribution width (RDW) reflects the heterogeneity of red blood cell size. However, few studies examined whether RDW is related to glucose metabolism indices, such as fasting blood glucose (FBG) and hemoglobin A1c (HbA1c), diabetic mellitus (DM) state or long-term outcomes of acute coronary syndrome (ACS) patients.
Methods and Results: A total of 448 consecutive patients with ACS were enrolled in this study. All patients were followed up for major cardiovascular adverse events (MACEs), and the mean follow-up was 952 days. Linear regression analysis showed that RDW inversely correlated with FBG but not HbA1c or DM. Kaplan-Meier survival curve analysis demonstrated that higher RDW levels were significantly positively associated with MACEs in the whole study population and the ACS patients with high FBG but not the low FBG group. Cox multivariate regression analysis revealed the independent function of RDW on MACEs in all ACS patients and ACS patients with high FBG. The receiver operating characteristic (ROC) curve demonstrated the optimal cutoff value of RDW for MACEs.
Conclusion: We first reported that higher RDW was associated with decreased FBG but not HbA1c or DM and an increased risk of MACEs in patients with ACS. This relationship was also found in ACS patients with higher FBG levels but not in ACS patients with lower FBG.
Keywords: red cell distribution width, HbA1c, fasting blood glucose, percutaneous coronary intervention, acute coronary syndromes, major adverse cardiovascular events
Introduction
Coronary artery disease (CAD) produces immense health and economic burdens globally.1 Acute coronary syndrome (ACS) is an acute manifestation of CAD, and it remains a leading cause of high morbidity and mortality despite great progress in prevention and treatment.2 Therefore, the identification of risk factors for ACS is of vital importance to improve prognosis. Diabetes mellitus (DM) is a well-established risk factor for ACS.3,4 The prognosis of ACS is worse in patients with DM than patients without DM.5–7 Therefore, additional attention should be given to patients with ACS and DM.
Red cell distribution width (RDW) is a part of a standard complete blood count and a measure of variation in the volume of red blood cells. RDW has been almost exclusively used for the differential diagnosis of anemia. However, recent evidence identified a relationship between RDW and various disorders, including CAD and DM, due to its association with several pathophysiological processes, such as inflammation and oxidative stress.8 Lippi et al published one of the first studies to investigate the role of RDW in ACS in 2009. They reported that the level of RDW was higher in ACS than non-ACS patients.9 Later research demonstrated that RDW was a predictive biomarker of adverse outcomes in ACS.10–12 Several studies reported the relationship between RDW and hemoglobin A1c (HbA1c) and prognosis in DM.13–16 However, few reports investigated the relationship between RDW, fasting blood glucose (FBG), and major adverse cardiovascular events (MACEs) in the ACS population after percutaneous coronary intervention (PCI).
The present study determined the relationship between baseline RDW levels and FBG and examined the prognostic role of RDW in ACS patients with different FBG levels.
Materials and Methods
Study Design and Participants
This study was a single-center, prospective, and observational cohort study. From January 2013 to February 2014, a total of 448 consecutive patients with ACS after PCI participated in this study at the Cardiology Department of Shaanxi Provincial People’s Hospital. ACS was defined as unstable angina (UA), non-ST-segment elevation myocardial infarction (NSTEMI), and ST-segment elevation myocardial infarction (STEMI), which were diagnosed according to the criteria of the American College of Cardiology/American Heart Association.17,18 Patients who suffered from active infection, hematological proliferative diseases, active or chronic inflammatory or autoimmune diseases, liver or renal dysfunction, malignancies, pregnancy, or unavailable complete blood count or medical records were excluded from the study. The study complied with the Declaration of Helsinki and was approved by the Ethics Committee of Shaanxi Provincial People’s Hospital, Xi’an, Shaanxi, China. Written informed consent was obtained from all study participants.
Demographic and Clinical Data
Main demographic data, cardiovascular risk factors, and clinical medications were obtained from medical records. The weight and height of each subject were acquired during the initial visit, and the body mass index (BMI) was calculated. Current smokers were defined as having smoked more than 100 cigarettes during their lifetime and smoking in the past 30 days. DM was defined as an elevated fasting plasma glucose concentration>126 mg/dl or receiving glucose-lowering treatment. Hypertension was defined as a systolic blood pressure (SBP) ≥140 mmHg and/or diastolic blood pressure (DBP)≥90 mmHg or taking anti-hypertension medications. BP was measured the morning after the admission day using the same type of electronic sphygmomanometer.
Blood Samples and Echocardiography
Peripheral blood was sampled from patients in a fasting state the morning after the admission day. Venous plasma concentrations of indices of complete blood count, liver and kidney function, blood fat, HbA1c and FBG, high-sensitive C-reactive protein (hs-CRP), and cardiac markers were determined in the clinical laboratory department using standard biochemical techniques. Left ventricular ejection fraction (LVEF) was measured using Doppler echocardiography within 3 days of admission.
Outcomes and Follow-Up
Composite outcomes included all-cause death, cardiac death, revascularization procedure, stroke, ACS, and heart failure, which were defined as MACEs. Patients were followed up by interview or telephone in our hospital, and the end of follow-up was the date of the first MACE occurrence. The mean follow-up was almost 3 years (952 days).
Statistical Analysis
Continuous variables are presented as the means±standard deviation (SD). The Kolmogorov–Smirnov test was used to test the normality of continuous variable distribution. Student’s t-test, one-way ANOVA, and the Mann–Whitney U-test were used for comparisons of continuous variables as appropriate. Categorical variables are shown as frequencies and percentages. The χ2 test was used to analyze differences between categorical variables. Univariate and multivariate linear regression analyses were performed to determine the relationship between RDW and FBG. Kaplan-Meier survival curve analysis was used to assess the proportional risk of MACEs for different RDW levels. Cox multivariate regression analysis was used to calculate the independent predictive ability of baseline RDW levels for MACEs. The area under the curve (AUC) value, optimal cutoff value, specificity, and sensitivity were determined using a receiver operating characteristic (ROC) curve. All computations were performed using SPSS software v22.0 (SPSS Inc., Chicago, IL, USA). A statistically significant difference was defined at p<0.05 using a two-tailed test.
Results
Clinical Characteristics of the Study Population
The 448 patients were divided into 3 groups according to the tertiles of baseline RDW level: low group: ≤12.80, medium group: 12.90–13.50, and high group: ≥13.55. The main baseline characteristics and medications of these 3 groups are shown in Table 1. Age and pro-B-type natriuretic peptide increased with RDW levels (both Ps<0.01). Baseline hemoglobin was significantly lower in the high RDW group than the low and medium RDW groups (P<0.01). Patients in the high RDW group had the highest levels of blood urea nitrogen and serum creatinine (both Ps<0.05). Specifically, the baseline FBG in the low RDW group was higher than the other two groups (P=0.02). However, intergroup comparison revealed no significant differences between the groups for other variables and medication use at discharge.
 |
Table 1 Baseline Characteristics of 448 Patients with ACS According to the RDW Content Tertiles |
Association Between FBG and RDW
As shown in Table 1, there was a significant difference in the level of FBG, but not the level of HbA1c or the proportion of diabetes, between the three RDW groups. Therefore, we further investigated the relationship between FBG and RDW. Linear regression analysis was performed, and the results are shown in Table 2. Univariate linear regression analysis revealed that RDW inversely correlated with FBG (Figure 1). After adjustment for other variables that were significantly different between the 3 RDW subgroups listed in Table 1, the negative correlation remained.
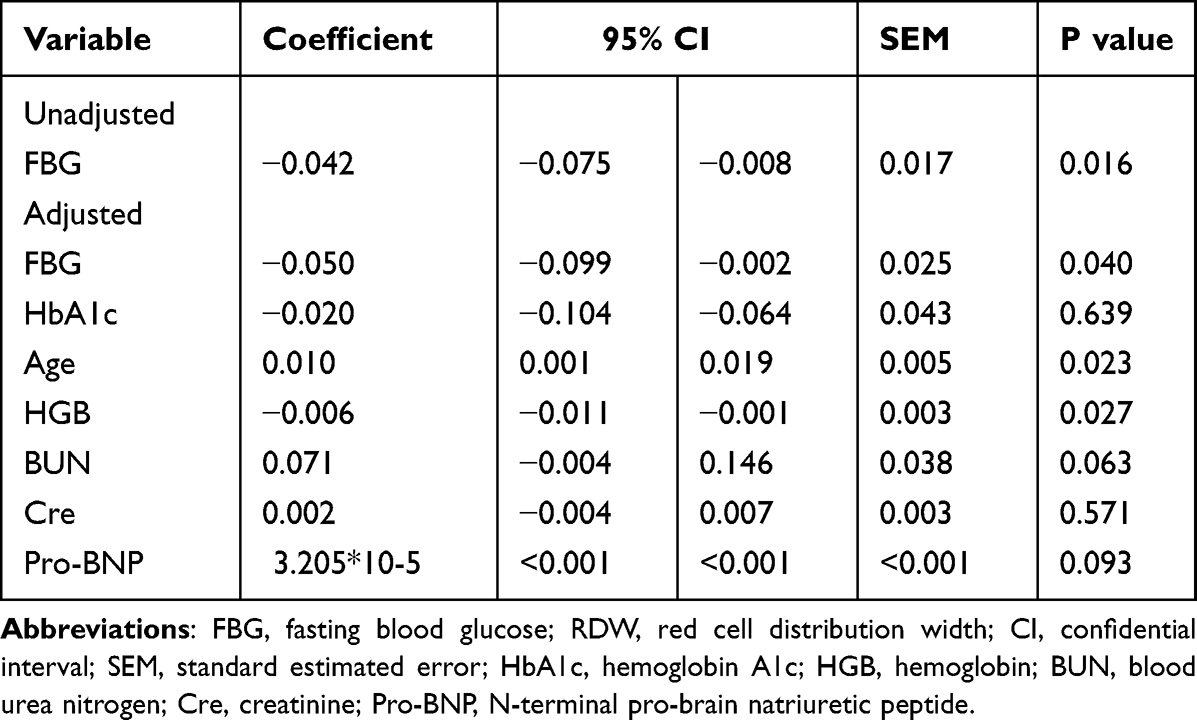 |
Table 2 Linear Regression Analysis Between FBG and RDW |
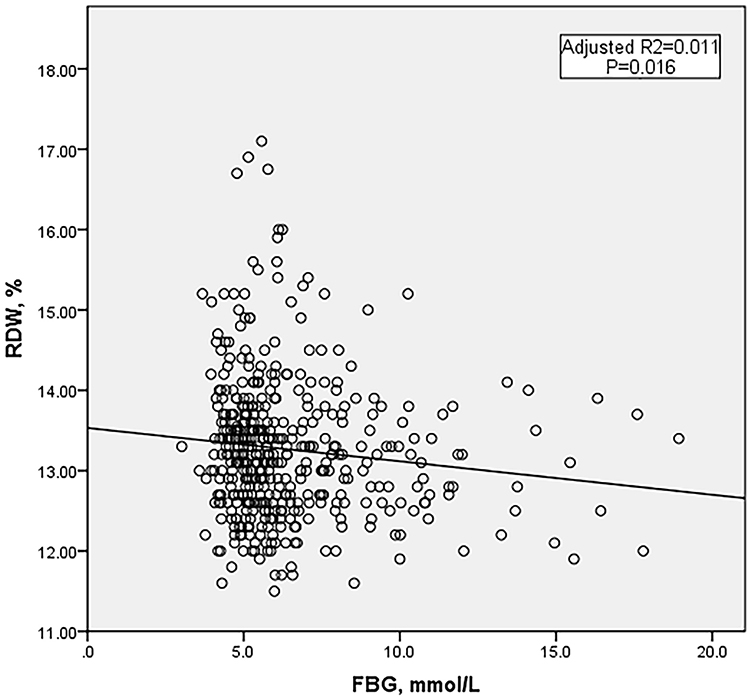 |
Figure 1 Linear regression analysis of the relationship between FBG and RDW in whole patients with ACS after PCI. Abbreviations: FBG, fasting blood glucose; RDW, red cell distribution width; ACS, acute coronary syndrome; PCI, percutaneous coronary intervention. |
Comparison of Baseline Data Between Groups with Different FBG Levels
All patients were divided into 2 groups according to the median baseline FBG level. The clinical data of the 2 groups are listed in Table 3.
 |
Table 3 Baseline Characteristics of 448 Patients with ACS According to the FBG Content Median |
Relationship Between RDW and MACEs in Patients with Low FBG, High FBG and Whole
The mean follow-up was 952 days (interquartile range: 824–1009 days). At the end of the follow-up, 168 (37.5%) patients had suffered a MACE. The incidence of MACEs in the medium RDW (43.9%) and high RDW (43.0%) groups was significantly higher than the low RDW (25.5%) group (P<0.01). The detailed data are provided in Supplementary Table 1.
Kaplan-Meier survival curve analysis was performed to determine whether there was a difference in the incidence of MACEs between different RDW levels in ACS patients with low FBG, high FBG and the whole study population. Figure 2 shows that higher RDW levels were significantly positively associated with MACEs in the whole study population and ACS patients with high FBG. However, this association was not found in the low FBG group.
 |
Figure 2 Kaplan–Meier survival curves for freedom from MACEs in the whole, low FBG and high FBG patient groups. Kaplan–Meier survival curves for freedom from MACEs in (A) The whole population by RDW level, (B) Low FBG by RDW level, and (C) High FBG by RDW level. Abbreviations: MACEs, major cardiovascular adverse events; FBG, fasting blood glucose; RDW, red cell distribution width. |
We performed Cox multivariate regression analysis to assess the independent function of RDW on MACEs in all ACS patients and ACS patients with high FBG. We used the forward likelihood ratio test to automatically select variables, and the medium and high RDW groups remained associated with an increase in MACEs compared to the low RDW group in all ACS patients and ACS patients with high FBG (Table 4).
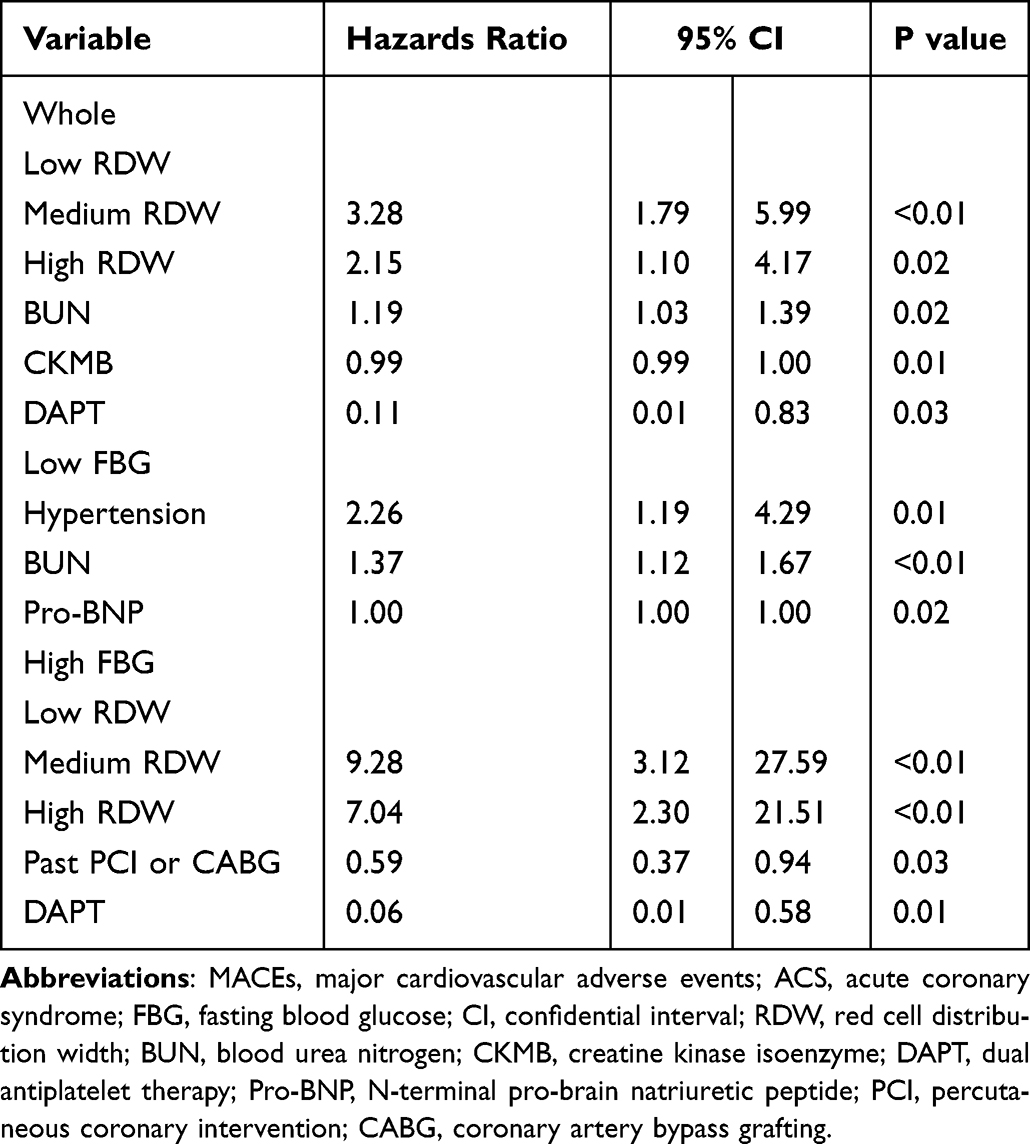 |
Table 4 Cox Multivariate Regression Analysis of MACEs in Whole Patients and ACS Patients with High FBG |
We used ROC curve to determine the optimal cutoff value of RDW for MACEs (Figure 3). The AUC for all ACS patients was 0.59, and the optimal cutoff value of RDW was 12.85, with a specificity of 60% and sensitivity of 77%. The AUC for ACS patients with high FBG was 0.64, with an optimal cutoff value of 12.85, a specificity of 52% and a sensitivity of 74%.
 |
Figure 3 Receiver operating characteristic curve analysis of predictive value of RDW in (A) The whole, (B) Low FBG, and (C) High FBG patient groups. Abbreviations: RDW, red cell distribution width; FBG, fasting blood glucose. |
Discussion
The present study reported that baseline RDW levels in Chinese ACS patients significantly negatively correlated with FBG but not HbA1c or DM after adjustment for other variables. Cox regression analysis demonstrated that higher RDW levels at admission were associated with a higher incidence of MACEs during follow-up in ACS patients after PCI. This relationship was also found in ACS patients with higher FBG levels but not ACS patients with lower FBG. This finding suggested that the relationship between RDW and MACEs was more reliable in ACS patients with higher FBG than patients with low FBG. To the best of our knowledge, our study is the first study to investigate the relationship between RDW, FBG, and long-term MACEs in patients with ACS after PCI in China.
RDW is a small part of routine blood examinations and reflects the degree of heterogeneity of erythrocyte volume. It is traditionally used in laboratory hematology for the differential diagnosis of anemia. However, increasing evidence suggests that anisocytosis is common in many human disorders, such as cardiovascular disease and DM.8 The observation of an RDW value below the reference range is infrequent and clinically meaningless, but an increased RDW indicates a profound deregulation of erythrocyte homeostasis that may be attributed to a variety of underlying metabolic abnormalities, including inflammation and oxidative stress.19 Proinflammatory cytokines make bone marrow erythroid hematopoietic stem cells insensitive to erythropoietin, which increases the number of immature erythrocytes in peripheral blood. This difference in red blood cell size ultimately increases RDW.20 Proinflammatory cytokines also inhibit the proliferation of erythroid progenitor cells, impair erythropoietin gene expression, and reduce the survival period of red blood cells, which is partially reflected by an increase in RDW.21 Hyperglycemia, insulin resistance, and hyperinsulinemia, which are the major clinical abnormalities in DM, increase inflammation, oxidative stress, and other pathophysiological abnormalities.22,23 Chronic inflammation is widely recognized as an important mechanism in CAD.24 Several studies reported a significant association between RDW and HbA1c in the non-DM population.13,14,25 However, Zhao et al showed that RDW did not correlate with FBG or HbA1c in patients with DM.26 Therefore, the relationship between RDW and HbA1c in ACS patients is not clear. Some studies showed that hyperglycemia reduced erythrocyte deformability and shortened lifespan, which seemed to cause changes in RDW levels.27,28 However, there are no studies on the relationship between RDW levels and FBG in patients with ACS. Therefore, we investigated the relationship between RDW and FBG or HbA1c in ACS patients but not find a correlation between RDW and HbA1c. Surprisingly, a significantly negative correlation between RDW and FBG was shown (Table 2 and Figure 1).
Because RDW reflects pathophysiological abnormalities, a number of articles investigated the relationship between RDW and human disorders. RDW has also been recently proposed as a predictive biomarker of adverse outcomes in patients with ACS. Pan et al found that RDW was an independent predictor for MACEs in ACS.24 Xiao et al reported that RDW demonstrated a good correlation with MACEs in STEMI.29 Zhao et al also demonstrated that combining RDW and GRACE scores created a more accurate predictive value for long-term prognosis in ACS. The present study found that higher RDW levels were associated with a higher incidence of MACEs in this population (Table 4 and Figure 2A), which is consistent with previous studies. RDW is also a prognostic marker of DM. Al-Kindi et al reported that RDW was a powerful and independent marker for the prediction of all-cause mortality and cardiovascular mortality in DM.15 Xiong et al showed that high levels of RDW indicated a higher risk and poor prognosis in DM.16 Mo et al also found that higher RDW was associated with increased all-cause death in DM with acute kidney injury.30 DM is a common complication of ACS, and ACS with DM has worse outcomes than ACS alone.5–7 However, few studies investigated the function of RDW in ACS combined with DM. Because of the relationship between RDW and FBG, all patients were divided into low FBG and high FBG groups to investigate whether FBG affected the prognostic implication of RDW in ACS. Our results indicated that RDW reserved its prognostic value in ACS patients with high FBG but no longer predicted the incidence of MACEs in ACS patients with low FBG (Table 4 and Figure 2B and C).
The present study has a number of advantages. First, we discussed the relationship between RDW and glucose metabolism in the entire population with ACS. However, there was no association between baseline RDW and DM or HbA1c, which contradicted the positive association found in previous studies in non-DM volunteers.14 This inconsistency may be due to the different study populations. We look forward to performing similar studies with larger samples to clarify the relationship between RDW and DM or HbA1c in ACS patients. We also found that baseline RDW levels inversely correlated with FBG levels, which may be related to reduced red blood cell deformability and shortened red blood cell lifespan resulting from hyperglycemia. Second, published reports indicated that RDW was associated with cardiovascular disease in patients with DM and/or CAD.31 Several studies focused on the relationship between RDW and long-term or short-term MACEs in ACS patients, and the results showed that ACS patients with higher RDW suffered from more all-cause mortality and cardiovascular mortality. Taiwanese scholars analyzed the RDW level and postoperative mortality of CAD patients undergoing PCI treatment in 2021, and they suggested that RDW may be used to predict the future mortality and prognosis of CAD patients.32 Although PCI significantly reduced the mortality of ACS, patients after revascularization remain at risk for developing MACEs, which is even more common in patients with DM. Therefore, it is meaningful to analyze the relationship between RDW and FBG and determine the relationship between RDW and MACEs in ACS patients with different FBG levels. A meta-analysis suggests that stents affect the incidence of MACE events. The patients in this study were all implanted with second-generation drug-eluting stents, which minimized the impact of cardiovascular events caused by different stent types. To the best of our knowledge, no study examined the relationship between RDW and long-term MACEs in ACS patients after PCI according to the level of FBG. FBG is an indicator of blood glucose metabolism, and hyperglycemia affects red blood cell deformability33,34 and lifespan.35 This decreased RBC deformability may impair microcirculation blood flow and result in hypoxia to increase the risk of poor prognosis.36 The present study found that RDW was an important and independent predictor of MACEs in ACS patients after PCI with overall and high fasting glucose. This study is the first study in China to investigate the relationship between RDW, glucose metabolism (HbA1c and FBG), and long-term MACEs in patients with ACS after PCI.
This study has some limitations. First, it was a single-center observational cohort study, and the extrapolation of the results and conclusions is limited. Second, only 448 patients with ACS were enrolled, and only 103 patients had T2 DM. More samples are needed to verify the relationship between RDW and glucose metabolism. Finally, this study only discussed the effect of RDW levels on MACEs at admission and did not include subsequent changes in RDW for analysis.
Conclusion
Baseline RDW levels in ACS patients significantly negatively correlated with FBG but not HbA1c or DM. Higher RDW levels at admission were associated with a higher incidence of MACEs during follow-up in ACS patients after PCI. This relationship was also found in ACS patients with higher FBG levels but not ACS patients with lower FBG.
Funding
There is no funding to report.
Disclosure
All authors report no conflicts of interest for this work.
References
1. Tsao CW, Aday AW, Almarzooq ZI, et al. Heart disease and stroke statistics-2022 update: a report from the American heart association. Circulation. 2022;145(8):e153–e639. doi:10.1161/CIR.0000000000001052
2. Switaj TL, Christensen SR, Brewer DM. Acute coronary syndrome: current treatment. Am Fam Physician. 2017;95(4):232–240.
3. Jamil S, Jamil G, Mesameh H, et al. Risk factor comparison in young patients presenting with acute coronary syndrome with atherosclerotic coronary artery disease vs. angiographically normal coronaries. Int J Med Sci. 2021;18(15):3526–3532. doi:10.7150/ijms.60869
4. Sethi SS, Akl EG, Farkouh ME. Diabetes mellitus and acute coronary syndrome: lessons from randomized clinical trials. Curr Diab Rep. 2012;12(3):294–304. doi:10.1007/s11892-012-0272-9
5. Okkonen M, Havulinna AS, Ukkola O, et al. Risk factors for major adverse cardiovascular events after the first acute coronary syndrome. Ann Med. 2021;53(1):817–823. doi:10.1080/07853890.2021.1924395
6. Shehab A, Bhagavathula AS, Al-Rasadi K, et al. Diabetes and mortality in acute coronary syndrome: findings from the gulf COAST registry. Curr Vasc Pharmacol. 2019;18(1):68–76. doi:10.2174/1570161116666181024094337
7. Cavallari I, Maddaloni E, Gragnano F, et al. Ischemic and bleeding risk by type 2 diabetes clusters in patients with acute coronary syndrome. Intern Emerg Med. 2021;16(6):1583–1591. doi:10.1007/s11739-021-02640-z
8. Salvagno GL, Sanchis-Gomar F, Picanza A, et al. Red blood cell distribution width: a simple parameter with multiple clinical applications. Crit Rev Clin Lab Sci. 2015;52(2):86–105. doi:10.3109/10408363.2014.992064
9. Lippi G, Filippozzi L, Montagnana M, et al. Clinical usefulness of measuring red blood cell distribution width on admission in patients with acute coronary syndromes. Clin Chem Lab Med. 2009;47(3):353–357. doi:10.1515/CCLM.2009.066
10. Adam AM, Ali MA, Shah AA, et al. Efficacy of hematological and coagulation parameters in the diagnosis and prognosis of patients with acute coronary syndrome. J Tehran Heart Cent. 2018;13(3):115–125.
11. Pan R. Relationship of red cell volume distribution width and N-terminal pro-brain natriuretic peptide with severity and prognosis of patients with acute coronary syndrome receiving percutaneous coronary intervention. Clin Lab. 2020;66:4. doi:10.7754/Clin.Lab.2019.190513
12. Abrahan LLT, Ramos JDA, Cunanan EL, et al. Red cell distribution width and mortality in patients with acute coronary syndrome: a meta-analysis on prognosis. Cardiol Res. 2018;9(3):144–152. doi:10.14740/cr732w
13. Veeranna V, Zalawadiya SK, Panaich SS, et al. The association of red cell distribution width with glycated hemoglobin among healthy adults without diabetes mellitus. Cardiology. 2012;122(2):129–132. doi:10.1159/000339225
14. Engstrom G, Smith JG, Persson M, et al. Red cell distribution width, haemoglobin A1c and incidence of diabetes mellitus. J Intern Med. 2014;276(2):174–183. doi:10.1111/joim.12188
15. Al-Kindi SG, Refaat M, Jayyousi A, et al. Red cell distribution width is associated with all-cause and cardiovascular mortality in patients with diabetes. Biomed Res Int. 2017;2017:5843702. doi:10.1155/2017/5843702
16. Xiong X-F, Yang Y, Chen X, et al. Red cell distribution width as a significant indicator of medication and prognosis in type 2 diabetic patients. Sci Rep. 2017;7(1):2709. doi:10.1038/s41598-017-02904-9
17. Amsterdam EA, Wenger NK, Brindis RG, et al. 2014 AHA/ACC guideline for the management of patients with non-ST-elevation acute coronary syndromes: a report of the American college of cardiology/American heart association task force on practice guidelines. J Am Coll Cardiol. 2014;64(24):e139–e228.
18. Antman EM, Anbe DT, Armstrong PW, et al. ACC/AHA guidelines for the management of patients with ST-elevation myocardial infarction--executive summary: a report of the American college of cardiology/American heart association task force on practice guidelines (writing committee to revise the 1999 guidelines for the management of patients with acute myocardial infarction). Circulation. 2004;110(5):588–636. doi:10.1161/01.CIR.0000134791.68010.FA
19. Montagnana M, Cervellin G, Meschi T, et al. The role of red blood cell distribution width in cardiovascular and thrombotic disorders. Clin Chem Lab Med. 2011;50(4):635–641. doi:10.1515/cclm.2011.831
20. Lippi G, Targher G, Montagnana M, et al. Relation between red blood cell distribution width and inflammatory biomarkers in a large cohort of unselected outpatients. Arch Pathol Lab Med. 2009;133(4):628–632. doi:10.5858/133.4.628
21. Vayá A, Alis R, Suescún M, et al. Association of erythrocyte deformability with red blood cell distribution width in metabolic diseases and thalassemia trait. Clin Hemorheol Microcirc. 2016;61(3):407–415. doi:10.3233/CH-141859
22. Jia G, Hill MA, Sowers JR. Diabetic cardiomyopathy: an update of mechanisms contributing to this clinical entity. Circ Res. 2018;122(4):624–638. doi:10.1161/CIRCRESAHA.117.311586
23. De Rosa S, Arcidiacono B, Chiefari E, et al. Type 2 diabetes mellitus and cardiovascular disease: genetic and epigenetic links. Front Endocrinol. 2018;9:2. doi:10.3389/fendo.2018.00002
24. Weber C, Noels H. Atherosclerosis: current pathogenesis and therapeutic options. Nat Med. 2011;17(11):1410–1422. doi:10.1038/nm.2538
25. Lippi G, Targher G, Salvagno GL, Guidi GC. Increased red blood cell distribution width (RDW) is associated with higher glycosylated hemoglobin (HbA1c) in the elderly. Clin Lab. 2014;60(12):2095–2098. doi:10.7754/clin.lab.2014.140621
26. Zhao N, Mi L, Liu X, et al. Combined value of red blood cell distribution width and global registry of acute coronary events risk score for predicting cardiovascular events in patients with acute coronary syndrome undergoing percutaneous coronary intervention. PLoS One. 2015;10(10):e0140532. doi:10.1371/journal.pone.0140532
27. Nada AM. Red cell distribution width in type 2 diabetic patients. Diabetes Metab Syndr Obes. 2015;8:525–533. doi:10.2147/DMSO.S85318
28. Arkew M, Asmerom H, Tesfa T, et al. Red blood cell parameters and their correlation with glycemic control among type 2 diabetic adult patients in Eastern Ethiopia: a comparative cross-sectional study. Diabetes Metab Syndr Obes. 2022;15:3499–3507. doi:10.2147/DMSO.S386093
29. Xiao LJ, Liu JL, Pan NN, et al. The predictive value of red cell distribution width and red cell distribution width to erythrocyte count ratio for adverse cardiovascular events during the hospitalization of patients of ST-segment elevation myocardial infarction. Clin Lab. 2020;66(7). doi:10.7754/Clin.Lab.2019.191123
30. Mo M, Huang Z, Huo D, et al. Influence of red blood cell distribution width on all-cause death in critical diabetic patients with acute kidney injury. Diabetes Metab Syndr Obes. 2022;15:2301–2309. doi:10.2147/DMSO.S377650
31. Wu -T-T, Zheng -Y-Y, Hou X-G, et al. Red blood cell distribution width as long-term prognostic markers in patients with coronary artery disease undergoing percutaneous coronary intervention. Lipids Health Dis. 2019;18(1):140. doi:10.1186/s12944-019-1082-8
32. Liao M-T, Lai C-L, Wang T-C, et al. Red cell distribution width and mortality in patients undergoing percutaneous coronary intervention. Biomedicines. 2021;10(1):1. doi:10.3390/biomedicines10010045
33. Singh DK, Winocour P, Farrington K. Erythropoietic stress and anemia in diabetes mellitus. Nat Rev Endocrinol. 2009;5(4):204–210. doi:10.1038/nrendo.2009.17
34. Singh M, Shin S. Changes in erythrocyte aggregation and deformability in diabetes mellitus: a brief review. Indian J Exp Biol. 2009;47(1):7–15.
35. Virtue MA, Furne JK, Nuttall FQ, et al. Relationship between GHb concentration and erythrocyte survival determined from breath carbon monoxide concentration. Diabetes Care. 2004;27(4):931–935. doi:10.2337/diacare.27.4.931
36. Patel KV, Mohanty JG, Kanapuru B, et al. Association of the red cell distribution width with red blood cell deformability. Adv Exp Med Biol. 2013;765:211–216.
 © 2023 The Author(s). This work is published and licensed by Dove Medical Press Limited. The
full terms of this license are available at https://www.dovepress.com/terms
and incorporate the Creative Commons Attribution
- Non Commercial (unported, 3.0) License.
By accessing the work you hereby accept the Terms. Non-commercial uses of the work are permitted
without any further permission from Dove Medical Press Limited, provided the work is properly
attributed. For permission for commercial use of this work, please see paragraphs 4.2 and 5 of our Terms.
© 2023 The Author(s). This work is published and licensed by Dove Medical Press Limited. The
full terms of this license are available at https://www.dovepress.com/terms
and incorporate the Creative Commons Attribution
- Non Commercial (unported, 3.0) License.
By accessing the work you hereby accept the Terms. Non-commercial uses of the work are permitted
without any further permission from Dove Medical Press Limited, provided the work is properly
attributed. For permission for commercial use of this work, please see paragraphs 4.2 and 5 of our Terms.
Recommended articles
Association of Systemic Inflammatory Response Index and Pan-Immune-Inflammation-Value with Long-Term Adverse Cardiovascular Events in ST-Segment Elevation Myocardial Infarction Patients After Primary Percutaneous Coronary Intervention
Liu Y, Liu J, Liu L, Cao S, Jin T, Chen L, Wu G, Zong G
Journal of Inflammation Research 2023, 16:3437-3454
Published Date: 14 August 2023
Nomogram to Predict Outcomes After Staged Revascularization in ST-Segment Elevation Myocardial Infarction and Multivessel Coronary Artery Disease
Wang H, Ma A, Wang T
International Journal of General Medicine 2024, 17:1713-1722
Published Date: 29 April 2024
The Predictive Value of the Systemic Immune-Inflammation Index for Cardiovascular Events in Chronic Total Occlusion Patients Who Prior Coronary Artery Bypass Grafting
Zhao Y, Zhao S, Shi Y, Ma Q, Zheng Z, Wang P, Liu J
Journal of Inflammation Research 2024, 17:8611-8623
Published Date: 9 November 2024
Impact of White Blood Cell Count After Percutaneous Coronary Intervention on Long-Term Prognosis in Patients with Unstable Angina Pectoris: A Single-Center Retrospective Observational Cohort Study
Zhang Z, Wang H, Wang R, She Z, Liang X, Liu H, Kou X, Wang S
Vascular Health and Risk Management 2025, 21:25-37
Published Date: 16 January 2025
Renal and Cardiovascular Outcomes of IABP-Assisted PCI in Renal Dysfunction: A Propensity-Matched Study and MACEs Prediction Model Development
Zeng Z, Luo R, Lan X
International Journal of General Medicine 2025, 18:4549-4562
Published Date: 18 August 2025