")
Back to Journals » Neuropsychiatric Disease and Treatment » Volume 13
Regional impairment of intrinsic functional connectivity strength in patients with chronic primary insomnia
Authors Huang S, Zhou F , Jiang J, Huang M, Zeng X , Ding S, Gong H
Received 17 March 2017
Accepted for publication 18 April 2017
Published 6 June 2017 Volume 2017:13 Pages 1449—1462
DOI https://doi.org/10.2147/NDT.S137292
Checked for plagiarism Yes
Review by Single anonymous peer review
Peer reviewer comments 2
Editor who approved publication: Professor Wai Kwong Tang
Suhua Huang,1 Fuqing Zhou,2,3 Jian Jiang,2,3 Muhua Huang,2,3 Xianjun Zeng,2,3 Shan Ding,1 Honghan Gong2,3
1Department of Radiology, Jiangxi Province Children’s Hospital, 2Department of Radiology, The First Affiliated Hospital, Nanchang University, 3Jiangxi Province Medical Imaging Research Institute, Nanchang, People’s Republic of China
Abstract: Several neuroimaging studies have suggested that brain impairment and plasticity occur in patients with chronic primary insomnia (CPI); however, the effects of insomnia on the intrinsic organization of the brain remain largely unknown. In this study, a voxel-based functional connectivity strength (FCS) assessment, a data-driven method based on a theoretical approach, was applied to investigate the effects of insomnia on the intrinsic organization of the whole brain in 27 treatment-naïve CPI patients and 26 well-matched healthy controls (HCs). Compared with HCs, CPI patients exhibited decreased FCS primarily in the right dorsolateral prefrontal cortex, the right medial prefrontal cortex (MPFC), the left basal ganglia/insula, and the right cerebellum anterior lobe (CAL) due to decreased functional connectivity patterns. These results suggest that poor sleep quality could impair FCS within the brain, including the MPFC and the CAL, which are important for cognitive control and modulating motor and limbic functions. Additionally, a receiver operator characteristic analysis revealed that altered FCS has moderate sensitivity (76.9%–88.5%) and specificity (59.3%–70.4%) as a reference indicator to discriminate CPI patients from HCs. Taken together, these findings provide evidence for abnormal intrinsic brain activity in CPI patients and might improve our understanding of the pathophysiological processes that occur in insomnia patients.
Keywords: functional connectivity strength, disconnection, chronic primary insomnia, sleep disorders, resting-state fMRI
Introduction
Insomnia is a disorder that is characterized by difficulties in initiating and/or maintaining sleep accompanied by impaired daytime functioning and includes symptoms such as non-restorative sleep, daytime fatigue, mood disruption, cognitive deficits, and declines in memory and concentration.1,2 Insomnia is usually a short-term condition, but ~50% of individuals with insomnia disorder experience a chronic course of >3 months (chronic primary insomnia, [CPI]),1 which has numerous health consequences, such as slower responses to challenging reaction time tasks.3 Chronic insomnia has been presumed to be the result of greater psychosocial stressors, losses, and medical illnesses, but the cerebral mechanisms underlying the pathogenesis of insomnia and the neural correlates of insomnia symptoms are unclear.
Structural and functional neuroimaging studies provide opportunities to understand the pathogenic development and maintenance of insomnia. Several structural neuroimaging studies4,5 have indicated variant anatomical areas in the hippocampus,6 anterior cingulate cortex,7 and orbitofrontal cortex (OFC) to be affected by insomnia.8,9 Single-photon emission computed tomography (SPECT)10 and positron emission tomography11 imaging have not only demonstrated hypoperfusion and abnormal metabolism in the above-mentioned altered regions but also provided evidence of a state of hyperarousal in sensory information-processing regions.12 Moreover, task-based functional magnetic resonance imaging (fMRI) has provided more evidence, including hypoactivation of the prefrontal13 and working memory areas,14 and lack of deactivation of the default mode network (DMN).9
In contrast to task-based fMRI, resting-state fMRI (rs-fMRI) requires no stimulation or response, and it can be employed to explore 95% of the energy consumption of intrinsic neuronal activity with spatial coherence and at a high resolution.15 Thus, rs-fMRI is an effective platform for exploring neuronal functional architecture via connectivity analyses and to further understand the pathophysiological mechanisms of intrinsic activity in insomnia,16–20 primarily including decreased connectivity in emotional circuits,17 increased intranetwork connectivity (sensory and motor regions),16 increased internetwork connectivity (the insula [Ins] and salience networks),18 and altered local activity in regional homogeneity (ReHo).19,20 However, the results of connectivity analyses are inconsistent. One reason is that these connectivity analyses (seed-based or independent-component analyses) provide the functional correlation of one voxel or region with other voxels or regions but ignore the connectivity strength represented by the number of direct connections to a voxel. A functional connectivity strength (FCS) analysis, a data-driven approach, measures the ratio of observed connections to the number of theoretical connections of each voxel to construct weighted functional network.21 Several neuroimaging studies have suggested brain reorganization in patients with cervical spondylotic myelopathy (CSM); however, the changes in spontaneous neuronal activity that are associated with connectedness remain largely unknown. In this study, FCS, a data-driven degree centrality method based on a theoretical approach, was applied for the first time to investigate changes in the sensory-motor network (SMN) at the voxel level. Comparatively, CSM not only showed significantly decreased FCS in the operculum-integrated regions, which exhibited reduced resting-state functional connectivity (rsFC) around the Rolandic sulcus, but also showed increased FCS in the premotor, primary somatosensory, and parietal-integrated areas, which primarily showed an enhanced rsFC pattern. Correlation analysis showed that altered FCS (in the left premotor-ventral/precentral-operculum, right operculum-parietal 4, and right S1) was associated with worsening Japanese Orthopaedic Association scores, and that the rsFC pattern was influenced by cervical cord microstructural damage at the C2 level. Together, these findings suggest that during myelopathy, the intrinsic functional plasticity of the SMN responds to the insufficient sensory and motor experience in CSM patients. This knowledge may improve our understanding of the comprehensive functional defects found in CSM patients and may inspire the development of new therapeutic strategies in the future.
In this study, we employed FCS to reveal potential differences in connectedness in a group of CPI patients compared with connectedness in a group of healthy controls (HCs). In addition, we used a seed-based intrinsic functional connectivity (iFC) analysis to reveal the iFC pattern in seed regions with altered FCS (the flowchart is presented in Figure 1). In this study, we hypothesize that alterations of the intrinsic FCS and its associated iFC network pattern could reveal abnormalities in connectedness across the whole brain of CPI patients, helping to reveal latent functional plasticity and reorganization.
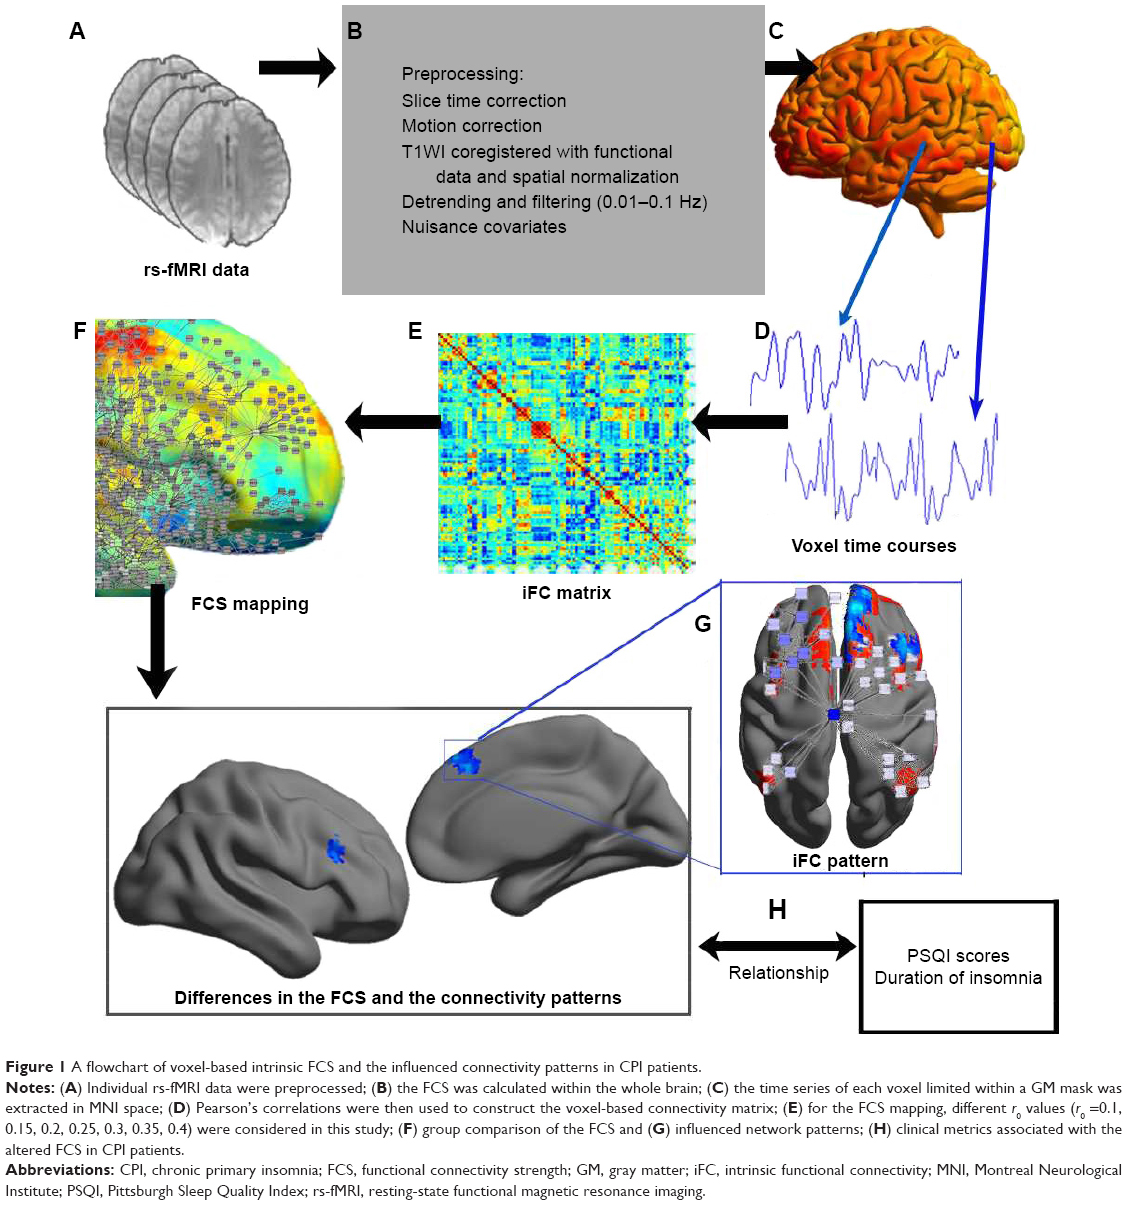 | Figure 1 A flowchart of voxel-based intrinsic FCS and the influenced connectivity patterns in CPI patients. |
Materials and methods
Subjects
A total of 62 right-handed subjects were recruited from the local hospital and the community, including 31 CPI patients and 31 gender-, age-, and education level-matched HCs. The inclusion criteria for the CPI group were as follows: 1) an age of 25–65 years; 2) an independent psychiatric syndrome (primary insomnia) as defined and diagnosed using the criteria of the Diagnostic and Statistical Manual of Mental Disorders, Fifth Edition;2 and 3) a duration of insomnia of ≥1 year with sleep difficulty occurring at least three nights per week. All patients had reported having difficulty initiating or maintaining sleep or having non-restorative sleep with resulting daytime dysfunction or distress that was not attributable to another medical or psychiatric disorder. The exclusion criteria for both the patients and HCs were as follows: 1) clinical evidence of any moderate-to-severe sleep disorder other than insomnia (eg, restless legs syndrome, obstructive sleep apnea); 2) abnormal sleep–wake rhythms; 3) diabetes, hypertension, heart diseases, or respiratory diseases; 4) a history of cerebrovascular disease; 5) other neurological (head injury, epilepsy, neurodegenerative) or psychiatric (psychosis, current depression) diseases; 6) illicit drug or alcohol abuse or current intake of psychoactive medications; 7) a cerebral structural lesion identified by MRI; or 8) MRI contraindications, such as metallic implants, claustrophobia, or devices in the body. All the participants were instructed not to consume alcohol, caffeine, or specific central nervous system (CNS) medications for 48 hours before MRI scanning. For quality control of the rs-fMRI data, all subjects were included if their head movement was <2 mm of translation along any axis and <2° of angular rotation along any axis during the rs-fMRI scan (explained in the “Functional data preprocessing” section).
Each participant was assessed via a detailed clinical interview, physical examination, and clinical follow-up, including the Pittsburgh Sleep Quality Index (PSQI) for sleep quality, the State Trait Anxiety Inventory-state (STAI-s) and State Trait Anxiety Inventory-trait (STAI-t) for anxiety, and the Beck Depression Inventory-II (BDI-II) for depression, which are common assessments used to identify emotional disorders.
This study was approved by and performed in accordance with the guidelines of the Medical Research Ethics Committee and the Institutional Review Board of the First Affiliated Hospital, Nanchang University, People’s Republic of China. All subjects provided written informed consent before beginning any study procedure. This study was conducted in compliance with the principles of the Declaration of Helsinki.
Image acquisition
All subjects were scanned on a 3.0-T MRI system (Trio; Siemens, Munich, Germany) at the First Affiliated Hospital, Nanchang University. The participants were instructed to avoid alcohol, caffeine, CNS-active agents, or any other psychoactive substances for 48 hours before the rs-fMRI study. Resting-state functional images were acquired using an echo planar imaging sequence with the following parameters: repetition time/echo time (TR/TE) =2,000/30 ms, field of view (FOV) =200×200 mm, matrix =64×64, 30 interleaved axial slices, and 4-mm slice thickness with 1.2-mm slice gap. All subjects were asked to lie quietly in the scanner with their eyes closed during data acquisition, and to not think systematically and not to fall asleep. At the end of the 480 seconds of resting-state scanning, an oral report was required for waking state. For registration purposes, high-resolution T1-weighted anatomic images were obtained using a three-dimensional magnetization-prepared rapid acquisition gradient echo sequence with the following parameters: TR/TE =1,900/2.26 ms, matrix =240×256, FOV =215×230 mm, 176 sagittal slices, and slice thickness =1.0 mm with no gap. Additional conventional T2-weighted and T2-fluid-attenuated inversion recovery images of the brain were acquired for a diagnosis in each subject. At the end of the scanning sessions, all participants reported that they had not fallen asleep during the scan using an Epworth sleepiness scale questionnaire.
Functional data preprocessing
rs-fMRI data preprocessing was conducted using Data Processing & Analysis of Brain Imaging version 2.1 (http://www.rfmri.org/dpabi) based on the Statistical Parametric Mapping software (SPM12, http://www.fil.ion.ucl.ac.uk/spm/software/spm12/) on the MATLAB platform (The MathWorks, Inc., Natick, MA, USA). Preprocessing was performed with standard processing steps22 as follows: The first 10 images from each subject were discarded to eliminate magnetic saturation effects, and the remaining 230 images were slice time and motion corrected. Each subject was limited to a maximum displacement in any cardinal direction (x, y, and z) of <2 mm and a maximum rotation (x, y, and z) of <2° during the rs-fMRI scan. We also evaluated group differences in head motion among CPI patients and HCs according to the criteria of Van Dijk et al (result reported in Table 1).23 To spatially normalize the fMRI data, the high-resolution individual T1-weighted images were registered to the mean functional data; the resulting aligned T1-weighted images were segmented and transformed into Montreal Neurological Institute space using the DARTEL toolbox, and a group template was generated. Then, the motion-corrected functional images were specifically normalized to the group template using the transfer parameter estimated via DARTEL segmentation and resampled to voxels of 3×3×3 mm. Temporal bandpass filtering (0.01–0.1 Hz) was applied to reduce low-frequency drift and high-frequency physiological noise. Finally, a nuisance linear regression was performed with the white matter, cerebrospinal fluid, global signal, six head motion parameters, six head motion parameters at one time point earlier, and the 12 corresponding squared items (Friston 24-parameter model) as covariates.
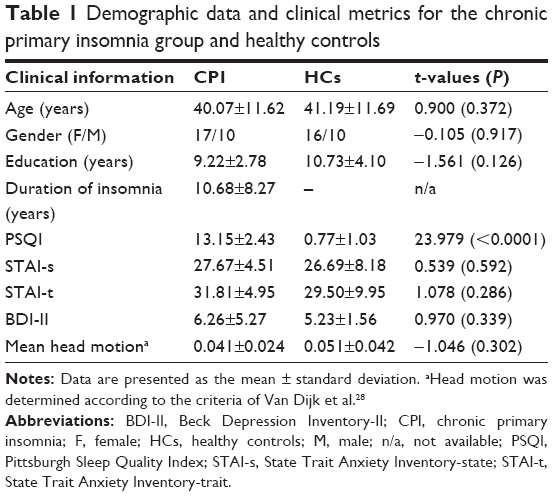 | Table 1 Demographic data and clinical metrics for the chronic primary insomnia group and healthy controls |
Whole-brain FCS mapping
To obtain the whole-brain FCS at the voxel level, Pearson’s correlations between the time courses of any pairs of voxels were first computed, resulting in a whole-brain connectivity matrix for each participant. This procedure was limited to a conjunct template of a gray matter (GM) mask, which was generated by thresholding (cutoff =0.25) the mean map of all GM maps involving all subjects. The FCS was the ratio of the sum of measured connections with a correlation coefficient (CC) above r0 and the sum of theoretical connections between a given voxel and all other voxels (in Eq (1), Nvoxels = 70,831 in the conjunct GM template).
|
|
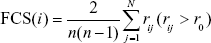
where rij is the CC between voxels i and j, and r0 represents the correlation threshold value, which was set to eliminate the weak correlations possibly arising from noise.21,22,24 The FCS maps were then standardized to z-scores as described in a previous study.25 Regions with a high FCS play important roles in brain networks (ie, they act as hubs).22,24,25 Finally, all z-score maps of FCS were smoothed with a 6-mm full-width-half-maximum Gaussian kernel for statistical analysis.
In this study, FCS computations in the main results were conservatively restricted to connections with a CC >0.25, which is a classical reference r0 value, and the statistical significance threshold for corresponding connections was set at P<0.001.22,24,25 To determine whether the FCS results depended on the selection of the r0 values, different correlation thresholds (ie, r0=0.1, 0.15, 0.2, 0.3, 0.35, and 0.4) were used to recompute the FCS maps. The resultant FCS maps were then used to perform the statistical analyses.
iFC networks were linked with the FCS regions influenced by CPI
To determine the detailed networks that were influenced by CPI, we performed a seed-based connectivity analysis using the clusters showing significant between-group differences in FCS as the seeds (ie, the right cerebellum anterior lobe [CAL], left basal ganglia [BG]/Ins, right dorsolateral prefrontal cortex [DLPFC], and right medial prefrontal cortex [MPFC]). Briefly, the temporal filtering maps from the functional data preprocessing were smoothed with an isotropic (6-mm full-width-half-maximum) Gaussian kernel, and a nuisance linear regression was performed with the white matter, cerebrospinal fluid, global signal, six head motion parameters, six head motion parameters at one time point earlier, and the 12 corresponding squared items (Friston 24-parameter model) as covariates. Subsequently, the mean time course within each seed was extracted by averaging the time courses of all voxels belonging to the seed in both the CPI and HC groups. Pearson’s CCs between the mean time series of each seed region and that of each voxel in the entire brain were computed and converted to z-values to improve normality. For the CPI and HC groups, we obtained four significant positive correlation maps indicative of the iFC patterns based on the previous results of the group differences in FCS using a random-effect one-sample t-test in SPM8 (voxel-wise P<0.001; cluster-wise false discovery rate [FDR]-corrected P<0.001 to reduce type I errors). Finally, a mask was generated by combining the regions with significant positive iFC in the iFC networks in the CPI and HC groups for group comparisons.
Statistical analyses
For the demographic and clinical metrics, statistical analyses were performed using SPSS software version 18.0 (SPSS Inc., Chicago, IL, USA), and Student’s t-tests were used to examine differences in age; education; scores of PSQI, BDI-II, STAI-s, and STAI-t; and mean head motion between the CPI and HC groups. Furthermore, a chi-square test was used for the comparison of categorical data (gender). A partial correlation analysis in SPSS was performed on the CPI group to assess the relationship between FCS (as a dependent variable) and the clinical metrics (duration of insomnia and PSQI scores as independent variables) with age and gender treated as covariates within the regions showing a group effect (P<0.05, without multiple comparisons).
For rs-fMRI data, statistical analyses were performed using standard statistical parametric mapping (SPM12). The FCS map comparison was performed at the voxel level using a general linear model (GLM) and a one-way analysis of covariance (ANCOVA), with age and gender as covariates, followed by post hoc two-sample t-tests, with the conjunct GM template/mask. The significance level of the group difference was thresholded based on the two-tailed Gaussian random field (GRF) theory, with a voxel level of P<0.01 and a cluster level of P<0.05. The iFC network comparison was performed using a GLM and a one-way ANCOVA, with age and gender as covariates, followed by post hoc two-sample t-tests, with the mask of the combined network. The significance level of the group difference was also thresholded based on the two-tailed GRF theory, with a voxel level of P<0.01 and a cluster level of P<0.05. It should be clarified that the GRF correction has a clear advantage because it uses a smoothness estimator prior to the analysis to reduce the number of independent voxels (or more precisely, resels, ie, resolution elements); this correction has been used extensively in the fMRI literature.26
Discriminant analysis
Receiver operator characteristic (ROC) measurements were used to evaluate the ability of FCS values from the regions of interest (ROIs) to distinguish CPI patients from HCs. Regions with significant between-group differences were selected as ROIs for the ROC analysis, and the threshold was set at a GRF-corrected voxel level of P<0.01 and a cluster level of P<0.05. A leave-one-out cross-validation (LOOCV) was used to assess the validity of the results.
Results
Demographics and clinical metric profiling
In total, 27 treatment-naïve CPI patients and 26 well-matched HCs were enrolled in this study; their clinical and demographic data are shown in Table 1. As expected, the CPI patients exhibited significantly higher PSQI scores than the HCs (t=23.979, P<0.001), whereas no significant differences were noted in the scores of BDI-II (t=0.970, P=0.339), STAI-s (t=0.539, P=0.592), or STAI-t (t=1.078, P=0.286).
Difference in FCS between the CPI patients and HCs
We determined the whole-brain FCS and further investigated the differences between the CPI and HC groups using rs-fMRI data. In the FCS map (r0=0.25), regions with a high FCS were mostly located in the DMN, anterior Ins, and sensorimotor and visual cortices (Figure 2A). Compared with the HC group, the CPI group had regions with a significantly decreased FCS located in the right CAL, the left BG/Ins, the right DLPFC, and the right MPFC (Table 2 and Figure 2B). There were no regions in the CPI group with significantly increased FCS relative to FCS in the HCs. The spatial FCS patterns in the different CC thresholds considered, including the FCS spatial distribution maps and the between-group differences, are reported in Figures S1 and S2, respectively.
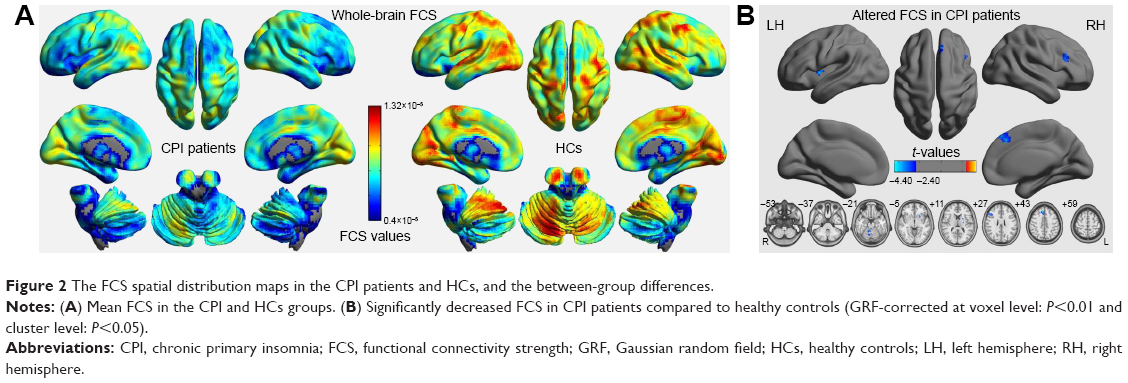 | Figure 2 The FCS spatial distribution maps in the CPI patients and HCs, and the between-group differences. |
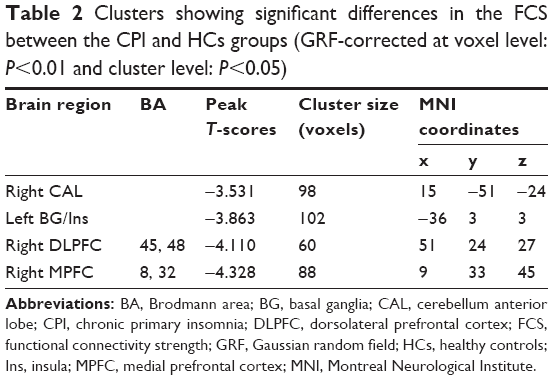 | Table 2 Clusters showing significant differences in the FCS between the CPI and HCs groups (GRF-corrected at voxel level: P<0.01 and cluster level: P<0.05) |
Alteration of the FCS-associated iFC network pattern
Figure S3 shows the iFC network patterns of all seed regions using one-sample t-tests (FDR-corrected; P<0.001). These seed regions exhibited significant differences in FCS between the CPI and HC groups, including 1) significantly decreased iFC between the right CAL and bilateral cerebellum posterior lobe (CPL), the left BG/thalamus, the right BG/thalamus, or bilateral superior frontal gyrus (SFG); 2) significantly decreased iFC between the left BG/Ins and the right BG, the left inferior frontal gyrus (IFG)/frontal operculum, or bilateral supplementary motor area/SFG; 3) significantly decreased iFC between the right DLPFC and the right ventral premotor area/middle frontal gyrus (PMv/MFG); and 4) significantly decreased iFC between the right MPFC and the right IFG/MFG, and between the right MPFC and bilateral SFG (Figure 3 and Table S1; GRF-corrected, voxel level: P<0.01 and cluster level: P<0.05).
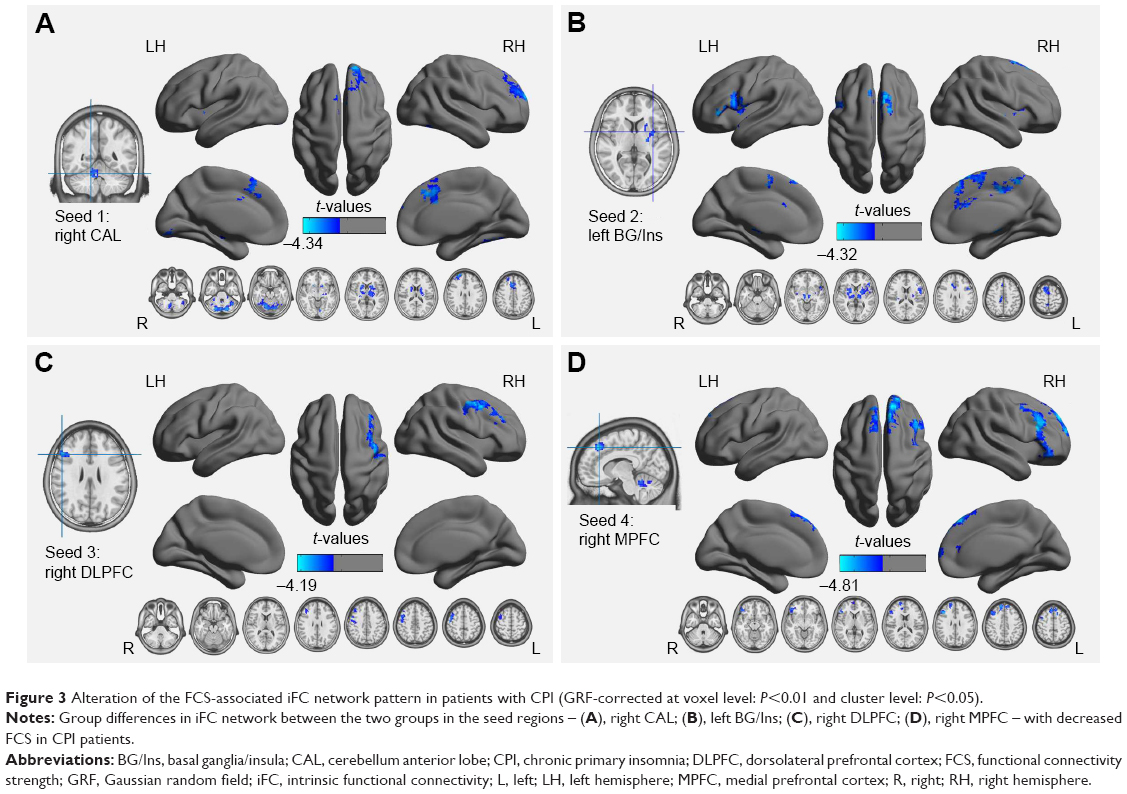 | Figure 3 Alteration of the FCS-associated iFC network pattern in patients with CPI (GRF-corrected at voxel level: P<0.01 and cluster level: P<0.05). |
Discriminatory performance analysis of the FCS indexes
To verify the ability to distinguish CPI patients from HCs, the mean FCS values were extracted in the regions with significantly decreased FCS in CPI patients. The ROC analysis revealed that the area under the curve (AUC) was 0.756 for the right CAL, 0.772 for the left BG/Ins, 0.793 for the right DLPFC, and 0.796 for the right MPFC (Figure 4 and Table S2). The LOOCV showed a cross-validated AUC of 0.757±0.008 (0.747–0.774) for the right CAL, 0.772±0.008 (0.763–0.794) for the left BG/Ins, 0.794±0.010 (0.786–0.817) for the right DLPFC, and 0.797±0.008 (0.788–0.817) for the right MPFC.
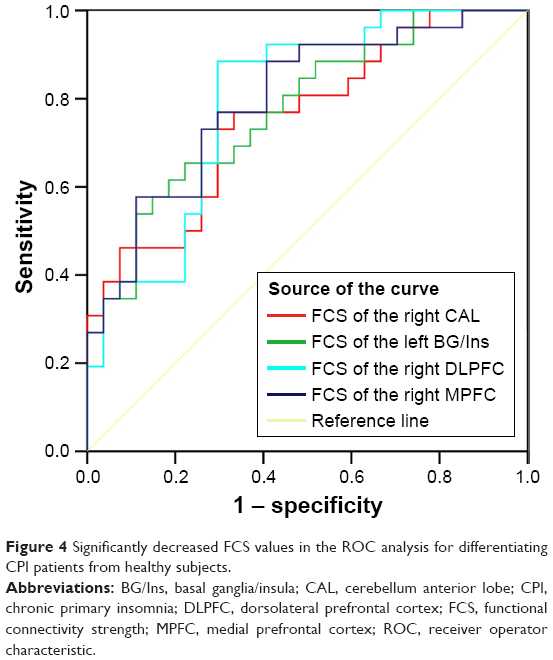 | Figure 4 Significantly decreased FCS values in the ROC analysis for differentiating CPI patients from healthy subjects. |
Clinical metrics associated with FCS in CPI patients
In the CPI group, the mean FCS in the right CAL (P<0.041) and the right MPFC (P<0.014) exhibited a significantly negative correlation with PSQI scores (Figure 5 and Table S3). In contrast, no significant relationship was observed between mean FCS values and other clinical metrics, such as the duration of insomnia.
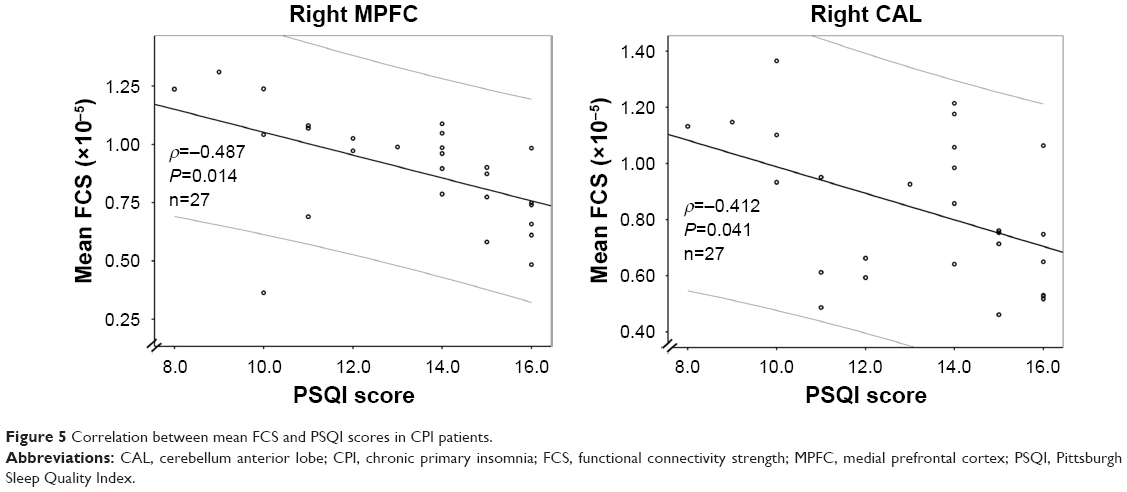 | Figure 5 Correlation between mean FCS and PSQI scores in CPI patients. |
Discussion
To the best of our knowledge, this study is the first to use FCS mapping to investigate functional connectivity changes in CPI patients. Three main findings were noted. First, using voxel-wise FCS, we were able to show that four regions (the right CAL, the left BG/Ins, the right DLPFC, and the right MPFC) exhibit functional vulnerability in CPI patients as shown by reduced functional connectivity. Second, a significant correlation was observed between PSQI scores and reductions in FCS in the right CAL and the right MPFC. Third, using ROC and cross-validations, we further showed that FCS could be used to discriminate CPI patients from HCs.
In the current study, we observed reduced FCS in the CPI patients, especially in the right CAL, the left BG/Ins, the right DLPFC, and the right MPFC; overall, the spatial distribution pattern of FCS in CPI patients was similar to that of the HC group. We first noted that the CPI group showed a significant reduction in FCS in the right MPFC, which is a joint functional cluster involved in part of the anterior DMN. The anterior DMN is involved in socially directed thoughts such as determining or inferring the purpose of others’ actions. In healthy subjects, hyperconnectivity is typically observed within the DMN during the resting state, but the connectivity is decreased in subjects undergoing sleep deprivation or with insomnia.27 Similar reductions in iFC have been identified in subjects undergoing sleep deprivation, including decreased connectivity in the anterior DMN, which has been suggested as a possible neural cause of the functional loss of cognition and emotional processing.27 In addition, decreased FCS values in the right MPFC have been correlated with poor sleep quality. Worsening sleep quality is often a comorbidity of emotional disorders,28 and reduced FCS in the right MPFC may represent an important factor underlying the loss of cognition and emotional processing associated with insomnia.
The right DLPFC is a critical structure that is involved in executive functions, decision-making, working memory, and social cognition.29 The DLPFC is connected to the OFC and to a variety of other brain areas. These connections allow the DLPFC to regulate the activity of those regions and receive information from and are regulated by those regions.29 In insomnia patients, significantly reduced GM densities, which have been linked to cognitive deficits, have been demonstrated by structural neuroimaging studies,4,8 indicating a link between poor sleep and memory dysfunction.30 In the current study, the left and right DLPFCs exhibited reduced iFC with the right PMv/MFG. Reduced connections of the DLPFC suggest an impairment of intrinsic pathways in CPI patients, although a determination of their precise role in CPI patients will require further work.
The BG/Ins is a joint cluster. The BG comprises multiple subcortical nuclei that are strongly interconnected with the cerebral cortex, including the thalamus, the brain stem, and several other regions. The BG is associated with the control of voluntary movements, procedural learning, cognition, emotion, and other functions. The Ins participates in a variety of functions, including perception, motor control, self-awareness, cognitive functioning, and interpersonal experiences. In the current study, we noted that the CPI group showed a significant reduction in FCS in the left BG/Ins, which is involved in hypoconnectivity within the central executive network (CEN). In previous studies, Smith et al10 found reduced regional cerebral blood flow (rCBF) in the BG/Ins in insomniacs via SPECT and then proposed that a minimum reduction in sleep onset latency after behavioral therapy for insomnia was closely followed by improvements in rCBF, which suggested that the BG/Ins might be preferentially targeted by the pathological mechanisms of CPI.
In addition, we found a significant reduction in FCS in the right CAL, as well as a reduction in iFC between the right CAL and bilateral CPL, the left and right BG/thalamus, and bilateral SFG. The CAL is regarded as the portion of the cerebellum responsible for mediating unconscious proprioception; it participates in and modulates motor and limbic functions. In an independent functional study, Dai et al19 reported that CPI patients showed reduced local connectivity (ReHo) in the CAL, indicating that disturbed nocturnal sleep could impact the cerebellum and may potentially be associated with a negative emotional state. In the current study, the impaired iFC pattern of the right CAL was mainly distributed in the bilateral BG/thalamus and bilateral SFG. Note that the BG/thalamus is involved in the motor functional system, and the bilateral SFG belongs to the CEN, which suggests that the disrupted connectivity in the right CAL affects insomnia patients via the SMN and CEN system. Additionally, decreased FCS in the right CAL is associated with higher PSQI scores (poor sleep) and may reflect a general disruption in CPI patients. Accordingly, poor sleep quality might affect the modulation of motor and limbic functions in individuals with CPI.
In this study, another important finding is that these above-mentioned altered FCS regions could differentiate CPI patients from control subjects. Specifically, the right DLPFC yielded the highest sensitivity and specificity. To the best of our knowledge, few studies have attempted to use functional connectivity or FCS metrics from rs-fMRI analyses as a classification tool for diagnosing CPI. The classification results presented here are preliminary because they have not been verified in a separate group. Hence, FCS metrics could be useful for diagnosing CPI patients, but further studies are warranted.
Finally, recent lines of investigations noted the role of noninvasive brain stimulation techniques (such as transcranial magnetic stimulation [TMS]) in probing in vivo the cortical excitability, functional connectivity, and neurochemical pathways of some sleep disorders, including insomnia and experimental sleep deprivation.31 Studies also highlight relatively disease-specific patterns among the different sleep disorders considered.31 Plasticity phenomena due to TMS might provide a further understanding of the role of neurotransmission pathways and remodeling of networks, which can be explored by functional connectivity analyses in CPI. TMS might be a valuable nonpharmacological tool, and voxel-wise FCS might be a valuable assessment technique in probing the pathological mechanisms of CPI.
This exploratory study had some limitations that should be acknowledged. First, only three neuropsychological tests were used in this study, but no significant differences in depression or anxiety were found between the groups. In the future, we could include a broader spectrum of tests to evaluate the cognitive function of CPI patients. Second, the study had a relatively small sample size. Third, with regard to the reported results, we mainly focused on the global FCS, whereas other types of FCS (ie, long- and short-range FCS) might distinguish intraregional and long-range interregional connectivity. These types of FCS should be investigated in the near future. Finally, we did not objectively assess sleep quality, daytime sleepiness, or the level of alertness of the scanning session in this study. Finally, all questionnaire-based assessments have limitations, which affect the imaging results. In the future, a more reliable method to rule out limitations should be used.
Conclusion
In the current study, we provide evidence that decreased FCS values in the right CAL, the left BG/Ins, the right DLPFC, and the right MPFC correspond to poor sleep quality in CPI patients. Reduced FCS values could be used to discriminate between CPI patients and HCs, revealing their potential use as diagnostic biomarkers.
Acknowledgments
The authors thank all the study participants. This study was supported by the National Natural Science Foundation of China (81460263 and 81560284); the Natural Science Foundation of Jiangxi, People’s Republic of China (20161BAB205245); and the Jiangxi Province Science and Technology Support Program (grant no 20151BBG70224). The funders had no role in the study design, data collection and analysis, decision to publish, or preparation of the manuscript.
Author contributions
All authors contributed toward data analysis, drafting and critically revising the paper and agree to be accountable for all aspects of the work.
Disclosure
None of the authors has any personal or financial involvement with organizations that have a financial interest in its content. The authors report no conflicts of interest in this work.
References
Benca RM. Diagnosis and treatment of chronic insomnia: a review. Psychiatr Serv. 2005;56(3):332–343. | ||
Reynolds CF 3rd, O’Hara R. DSM-5 sleep-wake disorders classification: overview for use in clinical practice. Am J Psychiatry. 2013;170(10):1099–1101. | ||
Edinger JD, Means MK, Carney CE, Krystal AD. Psychomotor performance deficits and their relation to prior nights’ sleep among individuals with primary insomnia. Sleep. 2008;31(5):599–607. | ||
Joo EY, Noh HJ, Kim JS, et al. Brain gray matter deficits in patients with chronic primary insomnia. Sleep. 2013;36(7):999–1007. | ||
Li S, Tian J, Bauer A, et al. Reduced integrity of right lateralized white matter in patients with primary insomnia: a diffusion-tensor imaging study. Radiology. 2016;280(2):520–528. | ||
Riemann D, Voderholzer U, Spiegelhalder K, et al. Chronic insomnia and MRI-measured hippocampal volumes: a pilot study. Sleep. 2007;30(8):955–958. | ||
Winkelman JW, Plante DT, Schoerning L, et al. Increased rostral anterior cingulate cortex volume in chronic primary insomnia. Sleep. 2013;36(7):991–998. | ||
Altena E, Vrenken H, Van Der Werf YD, van den Heuvel OA, Van Someren EJ. Reduced orbitofrontal and parietal gray matter in chronic insomnia: a voxel-based morphometric study. Biol Psychiatry. 2010;67(2):182–185. | ||
O’Byrne JN, Berman Rosa M, Gouin JP, Dang-Vu TT. Neuroimaging findings in primary insomnia. Pathol Biol (Paris). 2014;62(5):262–269. | ||
Smith MT, Perlis ML, Chengazi VU, et al. Neuroimaging of NREM sleep in primary insomnia: a Tc-99-HMPAO single photon emission computed tomography study. Sleep. 2002;25(3):325–335. | ||
Bonnet MH, Arand DL. 24-Hour metabolic rate in insomniacs and matched normal sleepers. Sleep. 1995;18(7):581–588. | ||
Nofzinger EA, Buysse DJ, Germain A, Price JC, Miewald JM, Kupfer DJ. Functional neuroimaging evidence for hyperarousal in insomnia. Am J Psychiatry. 2004;161(11):2126–2128. | ||
Altena E, Van Der Werf YD, Sanz-Arigita EJ, et al. Prefrontal hypoactivation and recovery in insomnia. Sleep. 2008;31(9):1271–1276. | ||
Drummond SP, Walker M, Almklov E, Campos M, Anderson DE, Straus LD. Neural correlates of working memory performance in primary insomnia. Sleep. 2013;36(9):1307–1316. | ||
Biswal BB. Resting state fMRI: a personal history. Neuroimage. 2012;62(2):938–944. | ||
Ilvesmäki T, Luoto TM, Hakulinen U, et al. Acute mild traumatic brain injury is not associated with white matter change on diffusion tensor imaging. Brain. 2014;137(Pt 7):1876–1882. | ||
Huang Z, Liang P, Jia X, et al. Abnormal amygdala connectivity in patients with primary insomnia: evidence from resting state fMRI. Eur J Radiol. 2012;81(6):1288–1295. | ||
Chen MC, Chang C, Glover GH, Gotlib IH. Increased insula coactivation with salience networks in insomnia. Biol Psychol. 2014;97:1–8. | ||
Dai XJ, Peng DC, Gong HH, et al. Altered intrinsic regional brain spontaneous activity and subjective sleep quality in patients with chronic primary insomnia: a resting-state fMRI study. Neuropsychiatr Dis Treat. 2014;10:2163–2175. | ||
Wang T, Li S, Jiang G, et al. Regional homogeneity changes in patients with primary insomnia. Eur Radiol. 2016;26(5):1292–1300. | ||
Zuo XN, Ehmke R, Mennes M, et al. Network centrality in the human functional connectome. Cereb Cortex. 2012;22(8):1862–1875. | ||
Yan CG, Craddock RC, Zuo XN, Zang YF, Milham MP. Standardizing the intrinsic brain: towards robust measurement of inter-individual variation in 1000 functional connectomes. Neuroimage. 2013;80:246–262. | ||
Van Dijk KR, Sabuncu MR, Buckner RL. The influence of head motion on intrinsic functional connectivity MRI. Neuroimage. 2012;59(1):431–438. | ||
Hou JM, Zhao M, Zhang W, et al. Resting-state functional connectivity abnormalities in patients with obsessive-compulsive disorder and their healthy first-degree relatives. J Psychiatry Neurosci. 2014;39(5):304–311. | ||
Buckner RL, Sepulcre J, Talukdar T, et al. Cortical hubs revealed by intrinsic functional connectivity: mapping, assessment of stability, and relation to Alzheimer’s disease. J Neurosci. 2009;29(6):1860–1873. | ||
Tillikainen L, Salli E, Korvenoja A, at al. A cluster mass permutation test with contextual enhancement for fMRI activation detection. Neuroimage. 2006;32(2):654–664. | ||
McKenna BS, Eyler LT. Overlapping prefrontal systems involved in cognitive and emotional processing in euthymic bipolar disorder and following sleep deprivation: a review of functional neuroimaging studies. Clin Psychol Rev. 2012;32(7):650–663. | ||
Ohayon MM, Roth T. Place of chronic insomnia in the course of depressive and anxiety disorders. J Psychiatr Res. 2003;37(1):9–15. | ||
Hoshi E. Functional specialization within the dorsolateral prefrontal cortex: a review of anatomical and physiological studies of non-human primates. Neurosci Res. 2006;54(2):73–84. | ||
Perrier J, Clochon P, Bertran F, et al. Specific EEG sleep pattern in the prefrontal cortex in primary insomnia. PLoS One. 2015;10(1):e0116864. | ||
Lanza G, Cantone M, Lanuzza B, et al. Distinctive patterns of cortical excitability to transcranial magnetic stimulation in obstructive sleep apnea syndrome, restless legs syndrome, insomnia, and sleep deprivation. Sleep Med Rev. 2015;19:39–50. |
Supplementary materials
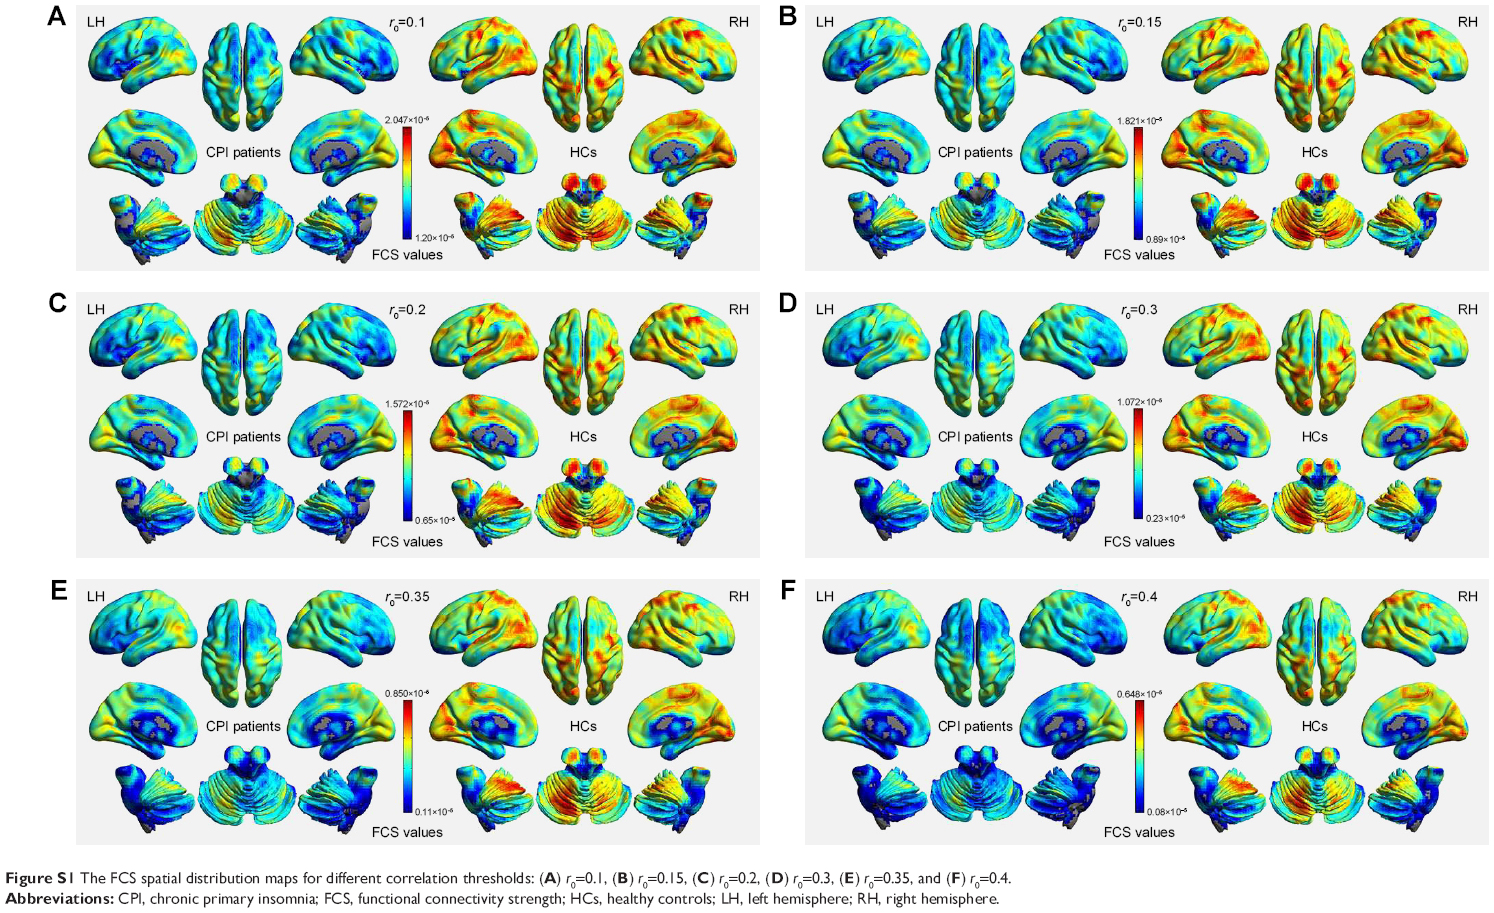 | Figure S1 The FCS spatial distribution maps for different correlation thresholds: (A) r0=0.1, (B) r0=0.15, (C) r0=0.2, (D) r0=0.3, (E) r0=0.35, and (F) r0=0.4. |
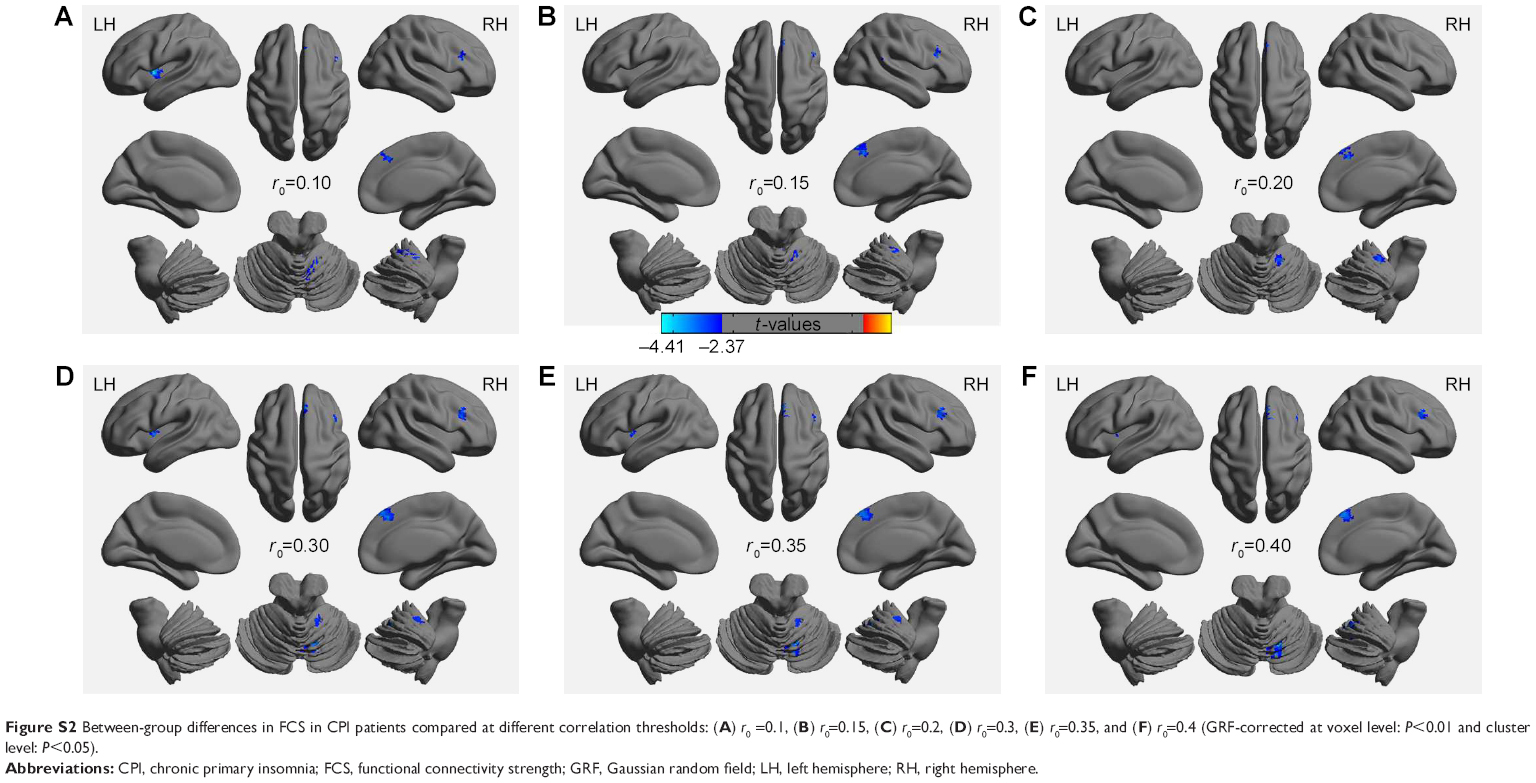 | Figure S2 Between-group differences in FCS in CPI patients compared at different correlation thresholds: (A) r0 =0.1, (B) r0=0.15, (C) r0=0.2, (D) r0=0.3, (E) r0=0.35, and (F) r0=0.4 (GRF-corrected at voxel level: P<0.01 and cluster level: P<0.05). |
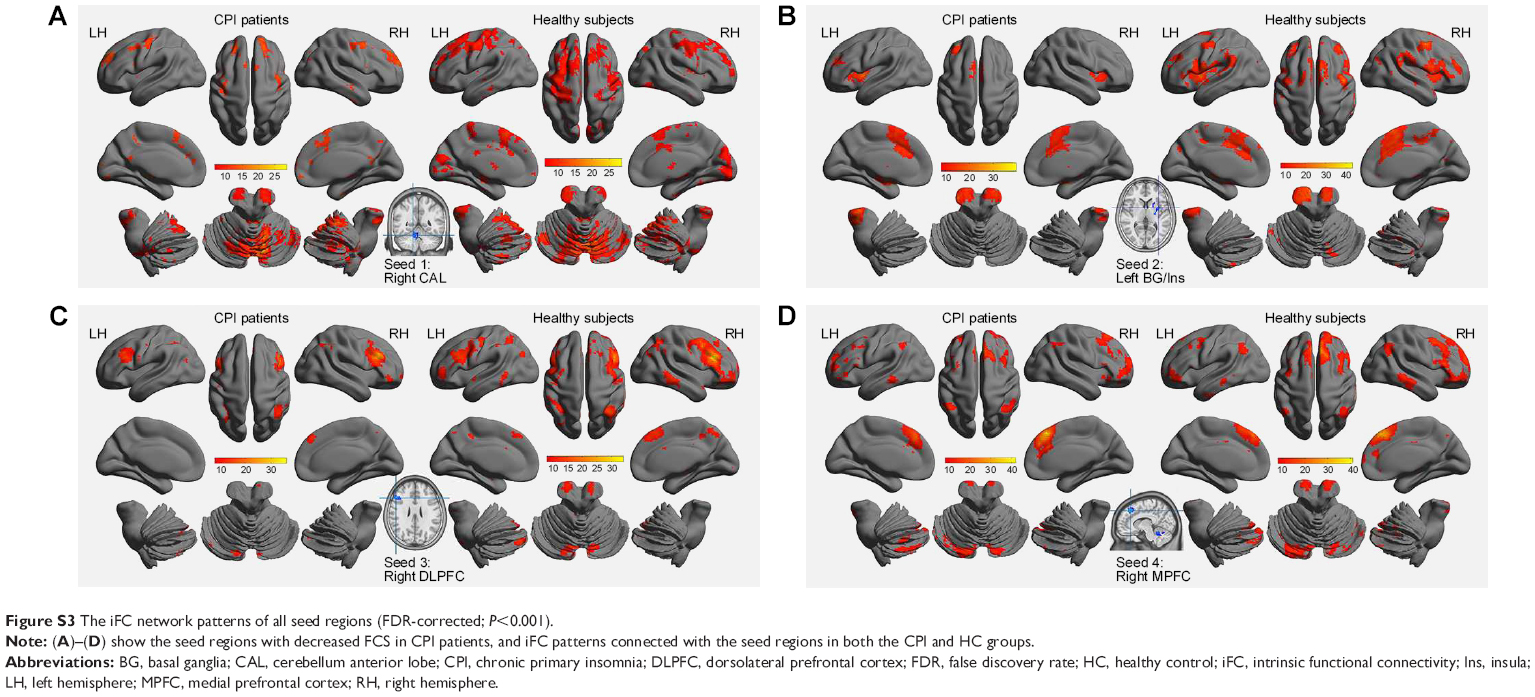 | Figure S3 The iFC network patterns of all seed regions (FDR-corrected; P<0.001). |
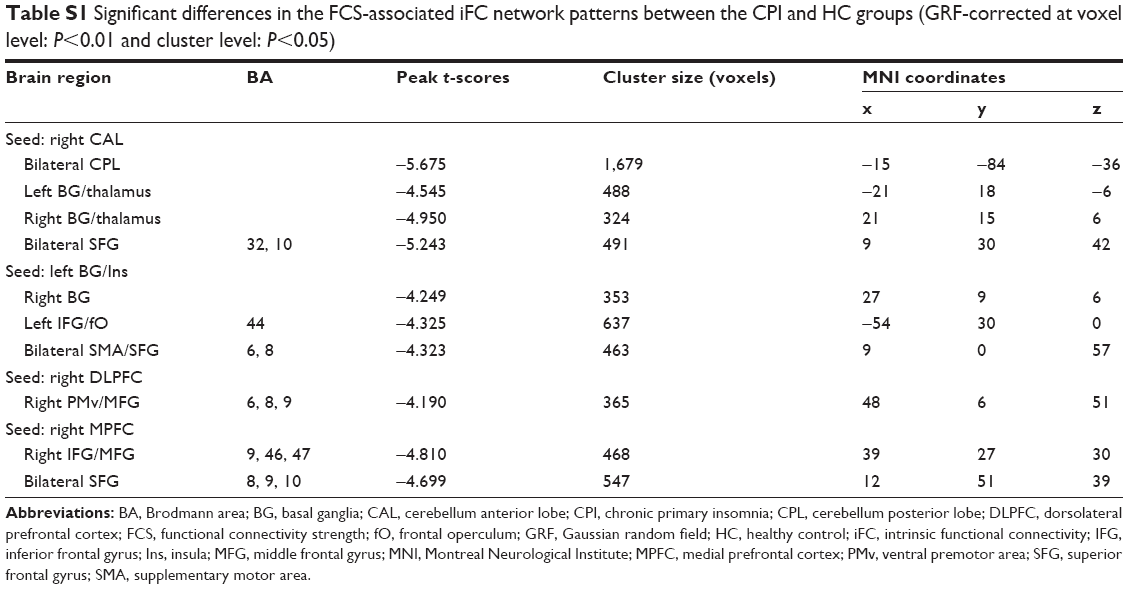 | Table S1 Significant differences in the FCS-associated iFC network patterns between the CPI and HC groups (GRF-corrected at voxel level: P<0.01 and cluster level: P<0.05) |
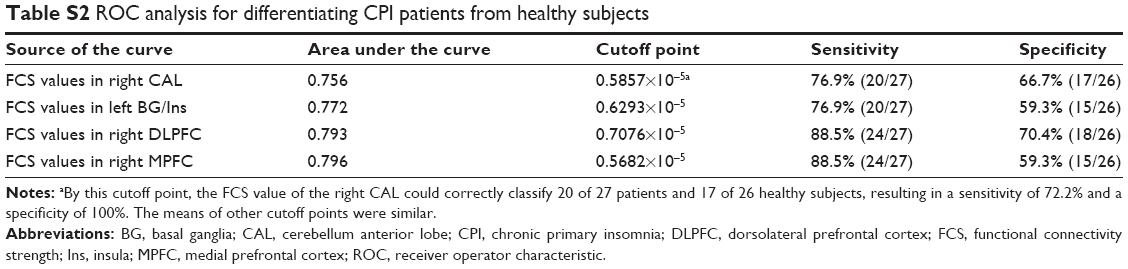 | Table S2 ROC analysis for differentiating CPI patients from healthy subjects |
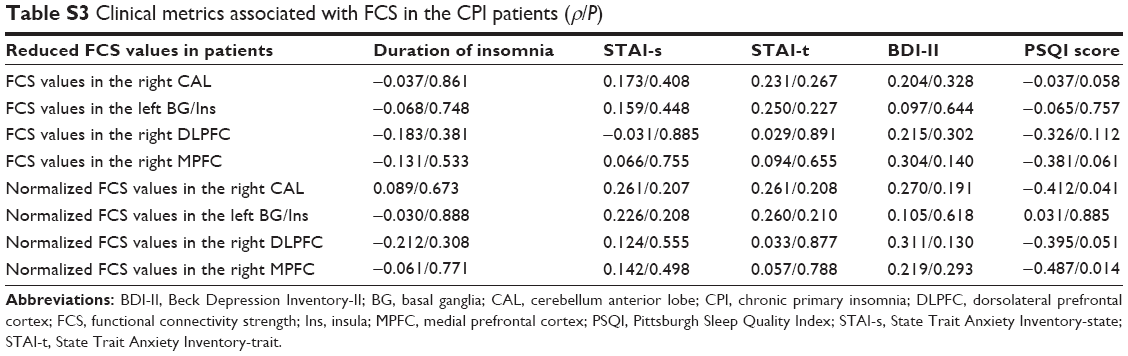 | Table S3 Clinical metrics associated with FCS in the CPI patients (ρ/P) |
 © 2017 The Author(s). This work is published and licensed by Dove Medical Press Limited. The full terms of this license are available at https://www.dovepress.com/terms.php and incorporate the Creative Commons Attribution - Non Commercial (unported, v3.0) License.
By accessing the work you hereby accept the Terms. Non-commercial uses of the work are permitted without any further permission from Dove Medical Press Limited, provided the work is properly attributed. For permission for commercial use of this work, please see paragraphs 4.2 and 5 of our Terms.
© 2017 The Author(s). This work is published and licensed by Dove Medical Press Limited. The full terms of this license are available at https://www.dovepress.com/terms.php and incorporate the Creative Commons Attribution - Non Commercial (unported, v3.0) License.
By accessing the work you hereby accept the Terms. Non-commercial uses of the work are permitted without any further permission from Dove Medical Press Limited, provided the work is properly attributed. For permission for commercial use of this work, please see paragraphs 4.2 and 5 of our Terms.