")
Back to Journals » Neuropsychiatric Disease and Treatment » Volume 19
Regional Homogeneity of the Left Posterior Cingulate Gyrus May Be a Potential Imaging Biomarker of Manic Episodes in First-Episode, Drug-Naive Bipolar Disorder
Authors Wu J, Qi S, Yu W, Gao Y, Ma J
Received 13 October 2023
Accepted for publication 7 December 2023
Published 12 December 2023 Volume 2023:19 Pages 2775—2785
DOI https://doi.org/10.2147/NDT.S441021
Checked for plagiarism Yes
Review by Single anonymous peer review
Peer reviewer comments 3
Editor who approved publication: Dr Roger Pinder
Jiajia Wu,1,2,* Shuangyu Qi,1,2,* Wei Yu,3,* Yujun Gao,4 Jun Ma1,2,4
1Department of Psychiatry, Wuhan Mental Health Center, Wuhan, People’s Republic of China; 2Wuhan Hospital for Psychotherapy, Wuhan, People’s Republic of China; 3Department of Psychiatry, Xianning Bode Mental Hospital, Xianning, People’s Republic of China; 4Department of Psychiatry, Renmin Hospital of Wuhan University, Wuhan, People’s Republic of China
*These authors contributed equally to this work
Correspondence: Jun Ma, Department of Psychiatry, Wuhan Mental Health Center, No. 89, Gongnongbing Road, Wuhan, Hubei Province, People’s Republic of China, Email [email protected]; Yujun Gao, Department of Psychiatry, Renmin Hospital of Wuhan University, No. 99 Zhangzhidong Road, Wuhan, Hubei Province, People’s Republic of China, Email [email protected]
Introduction: Abnormal brain networks with emotional response in bipolar disorder (BD). However, there have been few studies on the local consistency between manic episodes in drug-naive first-episode BD patients and healthy controls (HCs). The purpose of this study is to evaluate the utility of neural activity values analyzed by Regional Homogeneity (ReHo).
Methods: Thirty-seven manic episodes in first-episode, drug-naive BD patients and 37 HCs participated in resting-state functional magnetic resonance rescanning and scale estimation. Reho and receiver operating characteristic (ROC) curve methods were used to analyze the imaging data. Support vector machine (SVM) method was used to analyze ReHo in different brain regions.
Results: Compared to HCs, ReHo increased in the left middle temporal gyrus (MTG.L), posterior cingulate gyrus (PCG), inferior parietal gyrus, and bilateral angular gyrus, and decreased in the left dorsolateral superior frontal gyrus in target group. The ROC results showed that the ReHo value of the left PCG could discriminate the target group from the HCs, and the AUC was 0.8766. In addition, the results of the support vector machine show that the increase in ReHo value in the left PCG can effectively discriminate the patients from the controls, with accuracy, sensitivity, and specificity of 86.02%, 86.49%, and 81.08%, respectively.
Conclusion: The increased activity of the left PCG may contribute new evidence of participation in the pathophysiology of manic episodes in first-episode, drug-naive BD patients. The Reho value of the left posterior cingulate gyrus may be a potential neuroimaging biomarker to discriminate target group from HCs.
Keywords: bipolar disorder, first-episode, drug-naïve, manic episode, left posterior cingulate gyrus, regional homogeneity
Introduction
Bipolar disorder (BD) is a serious mental illness with high rates of suicide and relapse that severely impairs patients’ quality of life and social functioning and places a heavy burden on society and families.1–3 However, the pathophysiological mechanisms of BD remain unclear,4 and fMRI is an important tool for studying its mechanisms.5,6 With the rapid development of medical imaging, resting-state functional magnetic resonance imaging (rs-fMRI) has been widely used to study the pathogenesis, treatment effect, and prognosis of neuropsychiatric diseases. The exploration of brain imaging biomarkers is still a current research hot spot.7,8 rs-fMRI shows abnormal functional connectivity in specific brain areas in patients with BD and local dysfunction in multiple brain areas, including morphological changes in the frontal cortex, frontal lobe, cortex, thalamus, and amygdala.9 These brain areas are mainly concentrated in the default mode network (DMN).10 The network consists of a group of brain regions including the posterior cingulate gyrus (PCG), precuneus, medial prefrontal cortex (MPFC), bilateral angular gyrus (AG), lateral temporal cortex (LTC), and hippocampus (HPC).11,12 Many studies have shown that the DMN plays an important role in the pathophysiology of BD.13,14 Judging from the current research on abnormal functional connections of the DMN in BD, the conclusions of these studies are not entirely consistent.9 In BD type II, increases and decreases in functional connectivity related to the DMN were found.11 Psychotic pediatric BD is characterized by abnormal DMN connectivity in the anterior cingulate cortex/MPFC, bilateral caudate nuclei, AG, and left middle temporal gyrus (MTG.L), but non-psychotic pediatric BD is not.15 In BD patients, functional connectivity decreased from the pregenual anterior cingulate cortex to other areas located mainly in the posterior part of the DMN, such as the posterior cingulate cortex (PCG) and inferior temporal gyrus, and to salience network areas, such as the supracingulate anterior cingulate cortex and prefrontal cortex.16 It is worth noting that the analysis methods applied in these studies were independent component analysis (ICA) and/or functional connectivity based on seed points. Although both methods provide important clues for exploring the neurophysiology of BD, they have their own limitations.
Regional Homogeneity (ReHo) describes the similarity of the time series of a given voxel (BOLD signal) with the time series of its nearest neighbors. In ReHo, when a functional brain region is involved in a particular condition, the voxels within the region are more uniform in time, which is a proven and more reliable feature of rs-fMRI. Nearest neighbors are formed into clusters of 7, 19, or 27 voxels, and similarities are then calculated in these clusters. Each voxel will calculate ReHo once with its neighborhood, so the final ReHo is a three-dimensional volume corresponding to the brain position, which we can use for further analysis, such as statistical testing, machine learning, and so on.17,18 The ReHo method measures the regional coherence of low-frequency (<0.08 Hz) activity of fMRI signals, which reflects the local temporal uniformity of regional blood oxygenation level-dependent signals and serves as a complement to resting-state brain neural activity. Increases or decreases in ReHo represent abnormal activity in local brain areas. Therefore, ReHo analysis has been successfully used in studies investigating networks in psychiatric disorders.19–21 The Support vector machine (SVM) analysis method has proven to be of great practical clinical value in the context of decision-making in high-dimensional neuroimaging databases.22 In fMRI studies, SVM weights can be overlaid on the original brain space to create discriminant maps by visually tracing the most important weights to the brain regions with the highest discriminant values.23 Our previous study used the SVM method to explore the degree centrality of DMN in patients with bipolar mania.24 However, a direct comparison of ReHo in first-episode and drug-naive BD patients and healthy controls has not been studied. Therefore, we hypothesized that patients with first-episode, drug-naive BD would have changes in ReHo scores in emotional, cognitive, and sensorimotor domains and that abnormal ReHo scores would be associated with clinical features.
Here, we collected rs-fMRI data from drug-naive and first-episode bipolar mania patients and used the ReHo method to analyze whole-brain activity abnormalities. Their potential utility as neuroimaging biomarkers for first-episode and drug-naive BD was evaluated using SVM. We believe that this study will provide more promising evidence on the neuropathological mechanisms of BD.
Materials and Methods
Participants
A total of 37 manic episodes of first-episode bipolar patients and 37 healthy controls, aged between 12 and 35 years, were recruited from the outpatient ward of Renmin Hospital of Renmin Hospital of Wuhan University between October 2020 and December 2022. All volunteers underwent a face-to-face the Diagnostic and Statistical Manual of Mental Disorders, Fourth Edition (DSM-IV) semi-structured clinical interview and were independently diagnosed by two psychiatrists, following the methodology outlined by Kessing et al.25
To be included in the study, all patients had to meet the following criteria: no family history of BD, confirmed diagnosis of first episode of bipolar disorder based on medical history, age between 12 and 35, no history of psychiatric medication or electroconvulsive treatment, absence of cognitive impairment, intellectual disability, and low educational attainment.
Healthy controls were recruited from the community and universities through advertising and their gender distribution was matched to that of the patient group. Exclusion criteria for all participants included other psychiatric disorders meeting the Diagnostic and Statistical Manual of Mental Disorders, Fifth Edition (DSM-5) diagnostic criteria, a history of or current serious physical illness, pregnancy, brain structural abnormalities detected on MRI scans, and any restrictions or contraindications for undergoing MRI scans.
All subjects were screened by MMSE. The subjects had no cognitive impairment (>27 points), mental retardation (IQ < 85), and short education years (<12 years).26 All subjects were right-handed and of Chinese Han population.
The study was granted ethical approval by the Medical Research Ethics Committee of Renmin Hospital of Wuhan University and was conducted in accordance with the principles outlined in the Helsinki Declaration. Prior to participation, all subjects provided written informed consent.
Neuropsychological Assessment
The participants’ emotional state was assessed using the Young Mania Rating Scale (YMRS) and the Pittsburgh Sleep Quality Index (PSQI), while anxiety and depression levels were evaluated using the Hamilton Anxiety Scale (HAMA) and the Hamilton Depression Scale (HAMD). The entire neuropsychological assessment was conducted in a standardized environment by two trained psychiatrists.
Image Acquisition and Data Preprocessing
All participants underwent MRI scanning using an Achieva 3T-MRI scanner (GE, SIGNA Architect) in the presence of two licensed technicians with intermediate professional titles. Participants were instructed to lie down and keep their eyes closed while remaining awake throughout the scan. Prior to the scan, 3M earplugs were provided to minimize noise levels (<80 dB). All subjects were instructed to stay awake during the scanning session. T2 structural image scanning parameters included a repetition time (TR) set to the maximum, echo time (TE) set to the minimum, 1 excitation (NEX), slice thickness of 5 mm with a spacing of 1.5 mm, field of view (FOV) measuring 240 mm × 240 mm, and a total of 20 slices, resulting in a scanning duration of 1 min. 3D-T1 structural image scanning parameters included a TR set to the maximum, TE set to the minimum, 1 NEX, slice thickness of 2 mm with no spacing, FOV measuring 256 mm × 256 mm, 180 locs per tab, and a scanning duration of 4 min. Resting-state functional magnetic resonance imaging (rs-fMRI) parameters were as follows: TR = 2000 ms, TE = 30 ms, FOV = 220 mm × 220 mm, flip angle = 90°, matrix size = 64 × 64, slice thickness = 4 mm with no gap, resulting in a voxel resolution of 3 mm × 3 mm × 3 mm. A total of 36 slices were acquired over 240 time points, yielding a scanning duration of 8 min.
The acquired data underwent preprocessing using the data processing assistant for rs-fMRI (DPARSF) software in MATLAB.27 The first 10 time points were discarded, and slice timing correction and head motion correction were performed to adjust for temporal and spatial inconsistencies across the images. Participants with maximal displacements exceeding 2 mm in the x, y, or z-axis, as well as maximal rotations exceeding 2°, were excluded from the analysis. The structural image of each individual was coregistered to their functional image by first registering the individual T1 data to the individual EPI image. Subsequently, the T1 data were segmented into gray matter, white matter, and cerebrospinal fluid components, and the registration parameters obtained during the segmentation were applied to register the individual EPI image to the standard Montreal Neurological Institute (MNI) space. The voxel size was resampled to 3 mm × 3 mm × 3 mm during this normalization process. During functional image normalization, head motion parameters, white matter signals, and cerebrospinal fluid signals were regressed out as covariates. The resulting images were then smoothed using a Gaussian kernel with a full-width at half-maximum (FWHM) of 6 mm, followed by band-pass filtering (0.01–0.08 Hz) and linear detrending to remove low-frequency drift and high-frequency physiological noise.
Regional Homogeneity Analysis
Resting-state functional connectivity (RSFC) was calculated using the REST. For each voxel, time series data were extracted, and correlation coefficients were computed between each voxel and the remaining voxels across the brain. The resulting correlation matrix was binarized by thresholding at a correlation coefficient greater than 0.25. The number of connections for each voxel was then counted to generate a degree centrality measure. Individual degree centrality maps were transformed into z-scores using the mean and standard deviation of the entire grey matter mask. The resultant degree centrality maps were then smoothed with a Gaussian kernel (FWHM = 6 mm) and subjected to group comparisons.
Correlation Analysis
Regions with significant differences in degree centrality between groups were identified as “regions of interest”. Mean z-values for these regions were extracted and used in correlation analyses to investigate the relationship between ReHo values and clinical features in first-episode bipolar patients. To control for multiple comparisons, the Benjamini–Hochberg correction method with a significance threshold of P < 0.05 was applied.
Receiver Operating Characteristic Curve
Based on the identified regions from the correlation analysis, a total of six regions exhibiting increased ReHo in the MTG.L, PCG, inferior parietal gyrus, and AG, as well as decreased ReHo in the left dorsolateral superior frontal gyrus, were selected for further analysis. The ReHo values of these six regions were found to effectively differentiate between bipolar patients and healthy controls, as indicated by ROC curve analyses. The resulting ROC curves demonstrated good sensitivity and specificity.
Classification and Receiver Operating Characteristic Analyses
SVM methods using the SVMs software package in MATLAB (LIBSVM) were employed to perform classification analyses. Initially, two-sample t-tests were conducted to identify regions exhibiting significant differences between the patient and control groups. Subsequently, SVM classification was performed based on the ReHo values of the identified regions. A grid of parameters was evaluated using LIBSVM, and the highest cross-validation accuracy was selected from all evaluated parameter settings.
Statistical Analysis
We performed a one-way analysis of variance (ANOVA) to analyze group differences in age and years of education between the two groups using SPSS26.0. Gender distributions were analyzed using the chi-squared test. Analysis of covariance (ANCOVA) was performed to compare differences between the two groups on voxel-based ReHo value with age, gender, years of education, and frame displacement as covariates. Post hoc t-tests were then performed to compare differences in ReHo scores between groups. A Gaussian random field was used to correct for multiple comparisons using REST at p < 0.01 (voxel significance: p < 0.01, cluster significance: p < 0.01). Figures were plotted using GraphPad Prism 8.4.3.
Results
Demographic and Clinical Characteristics
Twenty BD patients were excluded due to the following factors: five, co-morbid anxiety; two, obsessive-compulsive disorder; two, co-morbid diagnosis of substance abuse or dependence; four, co-morbid other system diseases; five, head movement or uncoordinated scanning; two, brain organic diseases. Three HCs were excluded because their head motion was >2 mm in x, y, or z direction, and they did not consent to rescanning. Finally, a total of 37 BD patients and 37 HCs were enrolled in the analysis (Figure 1). No statistically significant differences were revealed in age across the two groups. However, statistically significant differences were revealed in education level and age across the two groups, and the two groups between BD showed significant statistical differences in YMRS, HRSD-17, and HAMA scores (Table 1).
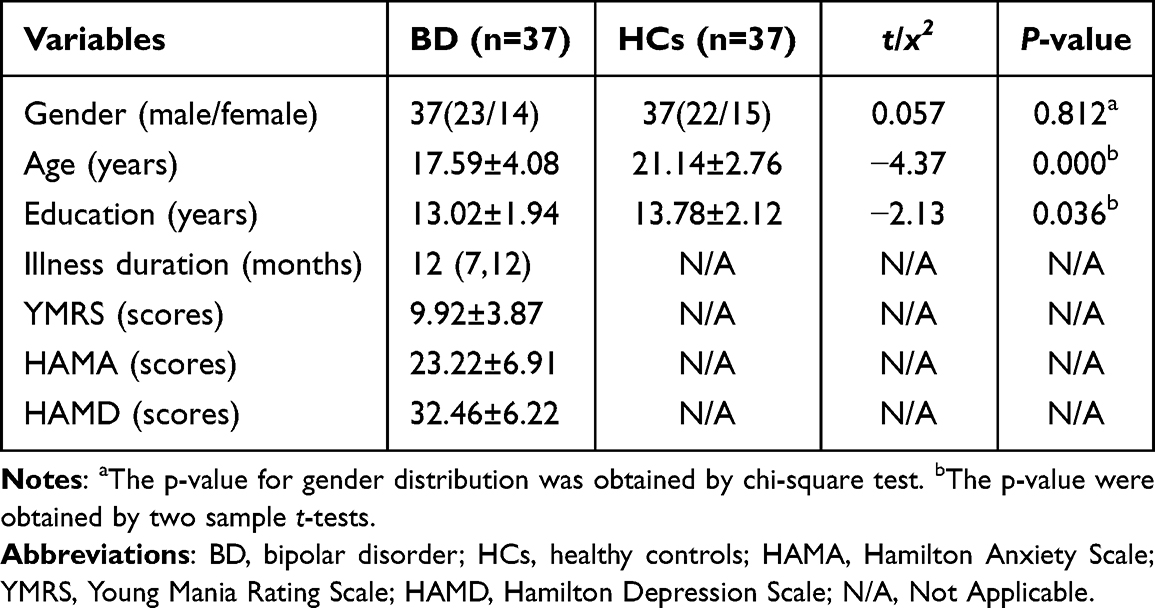 |
Table 1 Demographic and Clinical Characteristics of the Participants |
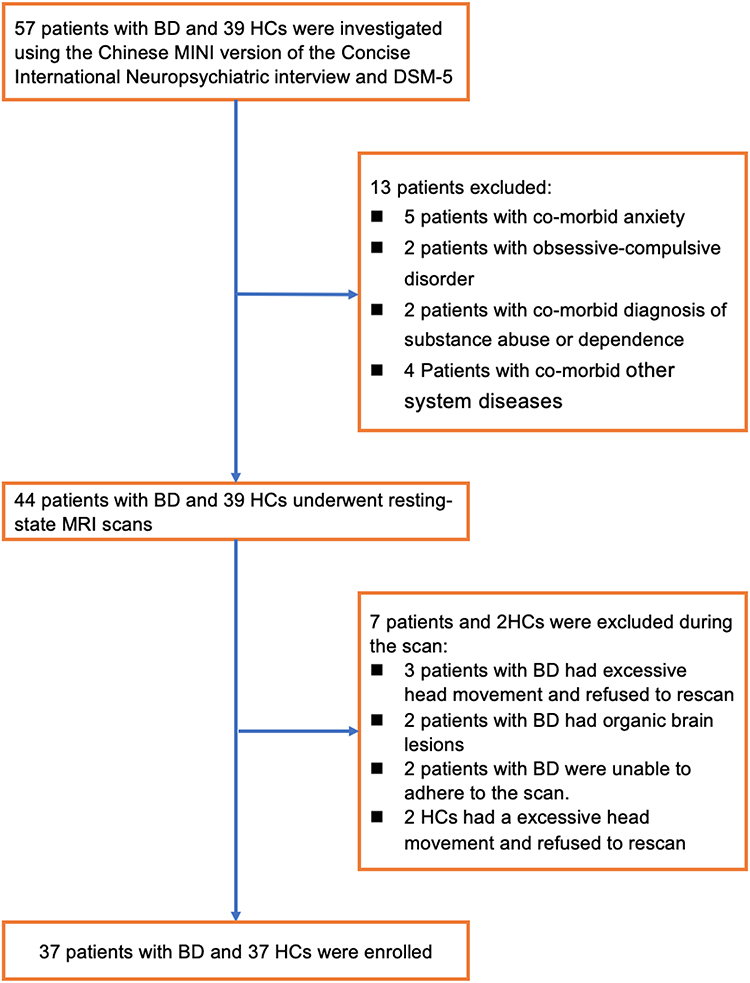 |
Figure 1 Flow chart of the selection process for the BD patients and the controls. |
Group Differences in Reho
We examined global brain Reho for each group. Compared with healthy controls, Reho increased in MTG.L, PCG, inferior parietal gyrus, and AG, and decreased in the left dorsolateral superior frontal gyrus in patients with first-episode bipolar patients (Table 2 and Figures 2 and 3).
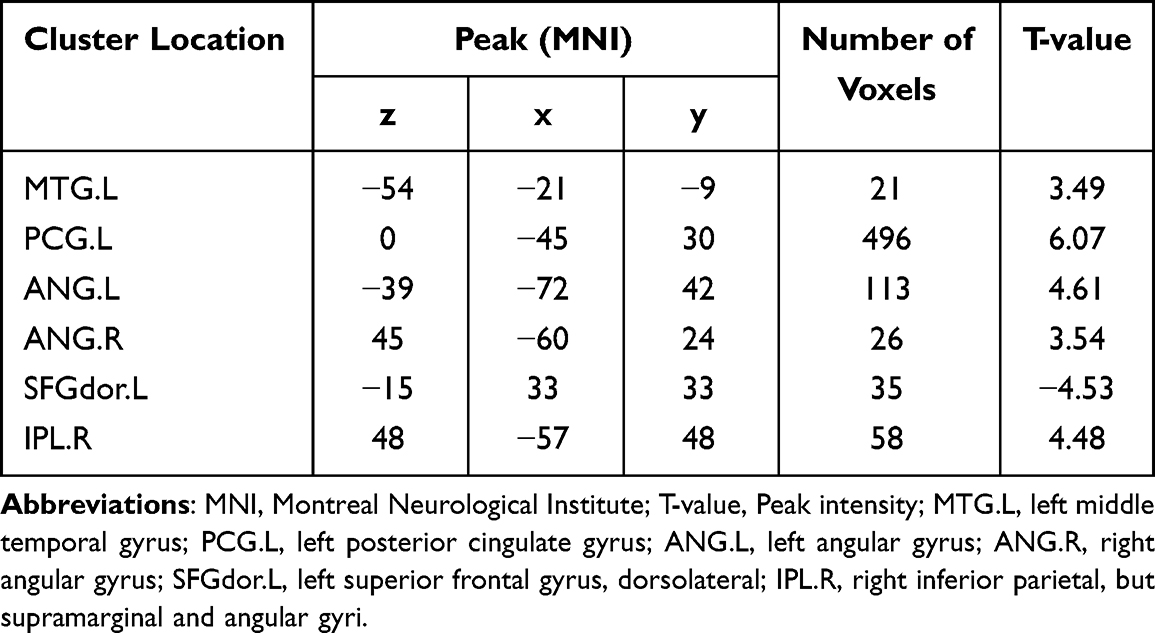 |
Table 2 Significant Reho Values Differences Across Groups |
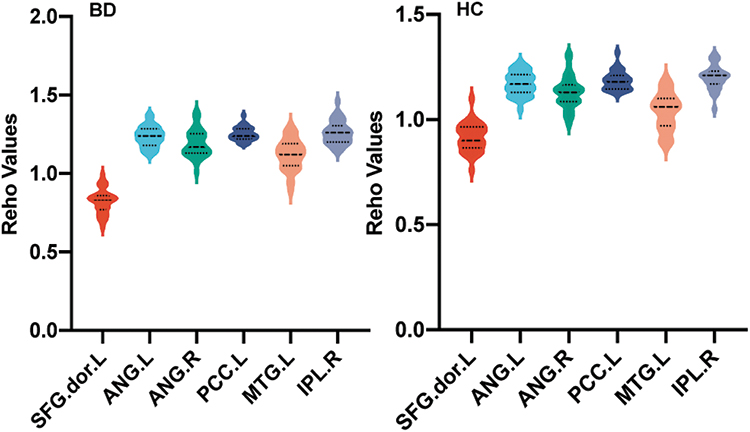 |
Figure 2 Violin diagram of ReHo values in different brain regions between BD group and HCs group. |
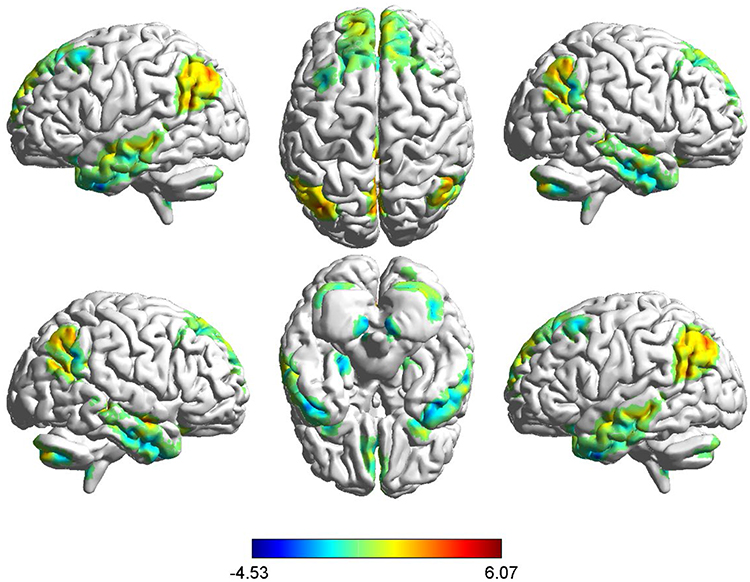 |
Figure 3 Brain areas with differences in ReHo values between BD and HCs groups. Compared with HCs, increased ReHo value in the left middle temporal gyrus, posterior cingulate gyrus, inferior parietal gyrus, and AG, and decreased in the left dorsolateral superior frontal gyrus in patients with first-episode bipolar patients. red denotes a higher ReHo value. |
Correlations Results
The correlation between the ReHo value and the neuropsychological evaluation score was analyzed using correlation analysis. No correlation between abnormal Reho values was found in both clustering and meter scores.
Receiver Operating Characteristic Results
We used ROC to analyze the degree centrality value of the difference between groups, and the results showed that Reho values in the left PCG could discriminate first-episode bipolar patients from healthy controls with an AUC of 0.8766 (Figures 3 and 4).
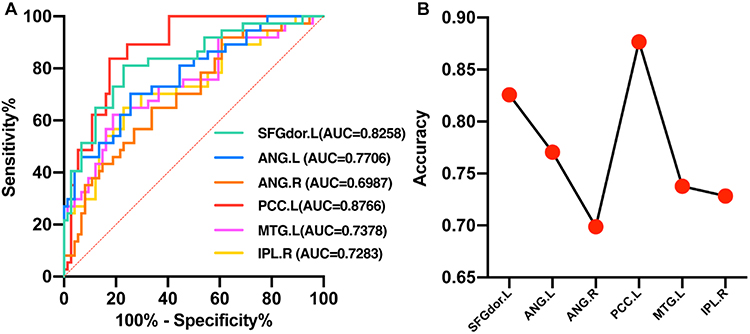 |
Figure 4 Line chart of AUC values in different brain regions between BD and HCs. (A) Shows that ReHo was higher in six brain regions in BD group compared with HCs. (B) Show that ReHo of the left PCC can distinguish the patients from HCs, with an AUC of 0.8766. Abbreviations: SFGdor.L, left superior frontal gyrus, dorsolateral; ANG.L, left angular gyrus; ANG.R, right angular gyrus; PCC.L, left posterior cingulate cortex; MTG.L, left middle temporal gyrus; IPL.R, right inferior parietal, but supramarginal and angular gyri. |
Support Vector Machine Results
Abnormal Reho values in different brain regions were used to classify individuals into these two groups. The left PCG in first-episode bipolar patients was analyzed individually using the SVM method, which showed that reduced Reho values in the left PCG could easily discriminate between first-episode bipolar patients and healthy controls with good accuracy (86.02%), specificity (86.49%), and sensitivity (81.08%) (Figure 5).
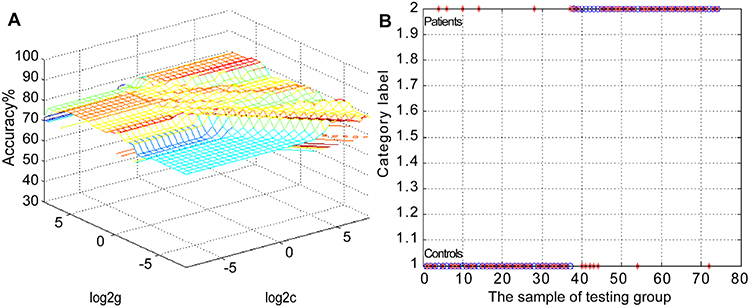 |
Figure 5 Three-dimensional visualization of SVM with the most optimal parameters. Patients were distinguished from controls by using increased ReHo values in the upper left PCC. Three-dimensional visualization of optimal parameters via SVM using ReHo values in significantly different regions. (A) The result of selecting SVM parameters through the 3D view; (B) Is the classification diagram of the ReHo value in the upper left PCC. Abbreviations: ReHo, Regional Homogeneity; Region 1, MTG.L, left middle temporal gyrus; Region 2, PCG.L, left posterior cingulate gyrus; Region 3, ANG.L, left angular gyrus; Region 4, ANG.R, right angular gyrus; Region 5, SFGdor.L, left superior frontal gyrus, dorsolateral; Region 6, IPL.R, right inferior parietal, but supramarginal and angular gyri. |
Discussion
In this study, we employ Reho and SVM analysis methods to investigate neuroimaging pathogenesis in first-episode, drug-naïve patients with BD. Our analysis of whole-brain ReHo values revealed significant changes in ReHo within BD. Our primary findings indicate increased Reho values in MTG.L, PCG, inferior parietal gyrus, and AG among BD patients when compared to HCs. In contrast, Reho values in the left dorsolateral superior frontal gyrus decreased. Notably, alterations in ReHo within the left PCG may serve as potential biomarkers for distinguishing BD patients from the controls. Using ReHo values as candidate biomarkers to differentiate between the patients and HCs through an SVM approach, elevated Reho values in the left PCG successfully discriminated between these two groups, achieving an accuracy of 86.02%, specificity of 86.49%, and sensitivity of 81.08%. Subsequent ROC analyses revealed that atypical Reho values in the left PCG may hold diagnostic value as a neuroimaging biomarker associated with bipolar mania, exhibiting an AUC of 87.66%.
The PCG, as the hub center of the brain’s DMN, is an important efferent nerve fiber of the HPC. It also has complex nerve fiber connections with the prefrontal lobe, parietal lobe, thalamus, and so on.28 A large number of studies have shown that PCG is one of the most metabolically active brain regions in the resting state and is closely related to attention,29 self-evaluation, episodic memory,30 and self-thinking. It is also important for maintaining self-awareness, self-guided thought activity during rest, and the regulation of cognition, emotion, action, and intuition.31 Study finds that changes in effective connectivity from the left MPFC to the left PCG circuit during working memory processing may be a core pathophysiological feature of BD.32 This may affect the emotional and cognitive deficits observed in BD patients.33 Activation of PCG in BD patients implies enhanced integration of emotional information and autobiographical memories related to each close relationship.34 Alterations in these systems, particularly in the anterior cingulate cortex (PACC), appear to play a central role in BD. However, the precise role of the PACC in mania and its functional connections with other midline regions (within and outside the DMN) remain unclear.16
Reho used in this study is a voxel analysis, which is based on the analysis method of resting state functional magnetic resonance imaging to reflect the synchronization of brain functional activity status of whole brain voxels in local regions. Increased Reho in the left PCG may reflect increased coherence of neural functional activity in the left PCG interacting with the entire DMN, resulting in hyperactive thinking and cognitive dysfunction common in patients with emotional BD, contrary to previous findings.35 This may be due to the disruption of the dynamic balance between separation and integration in the DMN in BD patients.
At the same time, many factors, including small sample size, BD I or BD II subtype, different states of BD (ie, depressive, manic, and stable phases), medication use (ie, antidepressants, mood stabilizers, and antipsychotics), age range, disease duration, and different metrics of fMRI applied, may contribute to these inconsistencies. Furthermore, the lack of reproducibility of rs-fMRI may also be due to the misuse of the liberal multiple-comparison correction strategy.11 Seed-based analysis showed that BD patients had abnormal brain structural and functional properties in the PCG, and the RSFC between the left PCG and the right MPFC was lower than that of controls. Abnormal RSFC patterns may indicate sensory and cognitive dysfunction in BD patients.36,37 Unfortunately, our study did not include measures of cognitive function. Actively exploring the correlation between differential impairments in cognition and brain network activation in subsequent studies may help reveal the differential development of BD. Previous studies have also applied the ReHo method to BD and reported widespread neural activity changes in multiple brain regions, including the frontal lobe, temporal lobe, parietal lobe, and limbic system.38,39 However, few overlapping changes were observed, with patients with bipolar depression having elevated ReHo scores in the middle frontal gyrus, superior frontal gyrus, insular cortex, precuneus, occipital lobe, and parietal cortex, whereas the cingulate, precentral gyrus, and inferior frontal gyrus were decreased.40 Meanwhile, some studies have found reduced ReHo scores in the precuneus, superior frontal gyrus, and parietal cortex in children with bipolar mania.41 Other studies have found that patients with type I and type II BD have decreased ReHo in the insular, temporal, and occipital cortices and increased ReHo in the middle and inferior gyrus.39 Distinguishing between MDD and BD by sMRI of cross-body volume difference using supervised machine learning methods with moderate classification accuracy.42
We also found by SVM analysis that the increased Reho value of the left PCG may serve as a promising biomarker for discriminating first-episode bipolar patients from healthy controls in SVM analysis, yielding good accuracy (86.02%), specificity (86.49%), and sensitivity (81.08%). In addition to the left PCG being enlarged, our study also found that the MTG.L, inferior parietal gyrus, and AG were enlarged. However, our study also found that the Reho value of the left dorsolateral superior frontal gyrus was reduced suggest that these brain regions are involved in the neuroimaging pathogenesis of patients with BD. However, our findings suggest that the increased Reho value of the left PCG may affect the function of this region, increasing the cooperation and connection between the DMN and the limbic system, and may serve as a discriminator between target patients and HCs candidate biomarkers.
When evaluating our findings, it is essential to acknowledge several limitations. Firstly, our results are exclusively derived from a single dataset collected at a single site. Additionally, a limitation of our research is the relatively small sample size. Secondly, it is noteworthy that age and educational attainment may have exerted some influence on the study outcomes. Thirdly, the controversy over the aetiological diagnosis of BD was also an important factor that negatively affected the results of the study.43 Future studies should consider a more extensive sample size and employ a longitudinal study design to investigate imaging biomarkers of first-episode bipolar mania. This can be accomplished by aggregating data from multiple centers, with participants experiencing their first bipolar episode while also controlling for age and educational level.
Conclusion
The present study demonstrates that the Reho value for manic states in first-episode BD patients is anomalous. These anomalies could serve as potential biomarkers for distinguishing between individuals experiencing their manic episode in the target group and HCs. Hence, these results underscore the significance of the left PCC in the pathogenesis of first-episode BD.
Data Sharing Statement
The datasets used and/or analyzed in this study are available from the corresponding author on reasonable request.
Ethics Statements
This study was conducted in accordance with the Declaration of Helsinki and approved by the Medical Research Ethics Committee of Renmin Hospital of Wuhan University. All patients had signed an informed consent form for inclusion.
Acknowledgments
The authors thank all the patients who participated in this study and the health-care professionals who performed the diagnostic and clinical evaluations.
Funding
This study was funded by the scientific research project of Wuhan Municipal Health Commission (WX19Y12 to JM: PI).
Disclosure
The authors report no conflicts of interest in this work.
References
1. Bellani M, Bontempi P, Zovetti N, et al. Resting state networks activity in euthymic bipolar disorder. Bipolar Disord. 2020;22(6):593–601. doi:10.1111/bdi.12900
2. Carvalho AF, Firth J, Vieta E, Ropper AH. Bipolar disorder. N Engl J Med. 2020;383(1):58–66. doi:10.1056/NEJMra1906193
3. Bauer MS. Bipolar disorder. Ann Intern Med. 2022;175(7):ITC97–ITC112. doi:10.7326/AITC202207190
4. Cerullo MA, Adler CM, Delbello MP, Strakowski SM. The functional neuroanatomy of bipolar disorder. Int Rev Psychiatry. 2009;21(4):314–322. doi:10.1080/09540260902962107
5. Chase HW, Phillips ML. Elucidating neural network functional connectivity abnormalities in bipolar disorder: toward a harmonized methodological approach. Biol Psychiatry Cogn Neurosci Neuroimaging. 2016;1(3):288–298. doi:10.1016/j.bpsc.2015.12.006
6. Okanda Nyatega C, Qiang L, Jajere Adamu M, Bello Kawuwa H. Altered striatal functional connectivity and structural dysconnectivity in individuals with bipolar disorder: a resting state magnetic resonance imaging study. Front Psychiatry. 2022;13:1054380. doi:10.3389/fpsyt.2022.1054380
7. Lin H, Xiang X, Huang J, Xiong S, Ren H, Gao Y. Abnormal degree centrality values as a potential imaging biomarker for major depressive disorder: a resting-state functional magnetic resonance imaging study and support vector machine analysis. Front Psychiatry. 2022;13:960294. doi:10.3389/fpsyt.2022.960294
8. Achalia R, Sinha A, Jacob A, et al. A proof of concept machine learning analysis using multimodal neuroimaging and neurocognitive measures as predictive biomarker in bipolar disorder. Asian J Psychiatr. 2020;50:101984. doi:10.1016/j.ajp.2020.101984
9. Syan SK, Smith M, Frey BN, et al. Resting-state functional connectivity in individuals with bipolar disorder during clinical remission: a systematic review. J Psychiatry Neurosci. 2018;43(5):170175. doi:10.1503/jpn.170175
10. Claeys EHI, Mantingh T, Morrens M, Yalin N, Stokes PRA. Resting-state fMRI in depressive and (hypo)manic mood states in bipolar disorders: a systematic review. Prog Neuropsychopharmacol Biol Psychiatry. 2022;113:110465. doi:10.1016/j.pnpbp.2021.110465
11. Gong J, Chen G, Jia Y, et al. Disrupted functional connectivity within the default mode network and salience network in unmedicated bipolar II disorder. Prog Neuropsychopharmacol Biol Psychiatry. 2019;88:11–18. doi:10.1016/j.pnpbp.2018.06.012
12. Chen G, Zhao L, Jia Y, et al. Abnormal cerebellum-DMN regions connectivity in unmedicated bipolar II disorder. J Affect Disord. 2019;243:441–447. doi:10.1016/j.jad.2018.09.076
13. Xue C, Zhang X, Cao P, et al. Evidence of functional abnormalities in the default mode network in bipolar depression: a coordinate-based activation likelihood estimation meta-analysis. J Affect Disord. 2023;326:96–104. doi:10.1016/j.jad.2023.01.088
14. Chen G, Wang J, Gong J, et al. Functional and structural brain differences in bipolar disorder: a multimodal meta-analysis of neuroimaging studies. Psychol Med. 2022;52(14):2861–2873. doi:10.1017/S0033291722002392
15. Zhong Y, Wang C, Gao W, et al. Aberrant resting-state functional connectivity in the default mode network in pediatric bipolar disorder patients with and without psychotic symptoms. Neurosci Bull. 2019;35(4):581–590. doi:10.1007/s12264-018-0315-6
16. Magioncalda P, Martino M, Conio B, et al. Functional connectivity and neuronal variability of resting state activity in bipolar disorder--reduction and decoupling in anterior cortical midline structures. Hum Brain Mapp. 2015;36(2):666–682. doi:10.1002/hbm.22655
17. Zang Y, Jiang T, Lu Y, He Y, Tian L. Regional homogeneity approach to fMRI data analysis. Neuroimage. 2004;22(1):394–400. doi:10.1016/j.neuroimage.2003.12.030
18. Jiang L, Zuo XN. Regional homogeneity: a multimodal, multiscale neuroimaging marker of the human connectome. Neuroscientist. 2016;22(5):486–505. doi:10.1177/1073858415595004
19. Huang Y, Wang W, Hei G, et al. Altered regional homogeneity and cognitive impairments in first-episode schizophrenia: a resting-state fMRI study. Asian J Psychiatr. 2022;71:103055. doi:10.1016/j.ajp.2022.103055
20. Cattarinussi G, Miola A, Trevisan N, et al. Altered brain regional homogeneity is associated with depressive symptoms in COVID-19. J Affect Disord. 2022;313:36–42. doi:10.1016/j.jad.2022.06.061
21. Qiu S, Chen F, Chen G, et al. Abnormal resting-state regional homogeneity in unmedicated bipolar II disorder. J Affect Disord. 2019;256:604–610. doi:10.1016/j.jad.2019.06.037
22. Gao Y, Zhao X, Huang J, et al. Abnormal regional homogeneity in right caudate as a potential neuroimaging biomarker for mild cognitive impairment: a resting-state fMRI study and support vector machine analysis. Front Aging Neurosci. 2022;14:979183. doi:10.3389/fnagi.2022.979183
23. Wu N, Zhang XY, Xia J, Li X, Yang T, Wang JH. Ratiometric 3D DNA machine combined with machine learning algorithm for ultrasensitive and high-precision screening of early urinary diseases. ACS Nano. 2021;15(12):19522–19534. doi:10.1021/acsnano.1c06429
24. Li G, Zhang B, Long M, Ma J. Abnormal degree centrality can be a potential imaging biomarker in first-episode, drug-naive bipolar mania. Neuroreport. 2023;34(6):323–331. doi:10.1097/WNR.0000000000001896
25. Kessing LV, Gonzalez-Pinto A, Fagiolini A, et al. DSM-5 and ICD-11 criteria for bipolar disorder: implications for the prevalence of bipolar disorder and validity of the diagnosis - a narrative review from the ECNP bipolar disorders network. Eur Neuropsychopharmacol. 2021;47:54–61. doi:10.1016/j.euroneuro.2021.01.097
26. Gontkovsky ST. Influence of IQ in interpreting MMSE scores in patients with multiple sclerosis. Neuropsychol Dev Cogn B Aging Neuropsychol Cogn. 2014;21(2):214–221. doi:10.1080/13825585.2013.795515
27. Chao-Gan Y, Yu-Feng Z. DPARSF: a MATLAB toolbox for ”pipeline” data analysis of resting-state fMRI. Front Syst Neurosci. 2010;4:13. doi:10.3389/fnsys.2010.00013
28. Zhang Y, Zhang X, Zhang J, et al. Gray matter volume abnormalities in type 2 diabetes mellitus with and without mild cognitive impairment. Neurosci Lett. 2014;562:1–6. doi:10.1016/j.neulet.2014.01.006
29. Moulton CD, Costafreda SG, Horton P, Ismail K, Fu CH. Meta-analyses of structural regional cerebral effects in type 1 and type 2 diabetes. Brain Imaging Behav. 2015;9(4):651–662. doi:10.1007/s11682-014-9348-2
30. Chen J, Zhang J, Liu X, et al. Abnormal subcortical nuclei shapes in patients with type 2 diabetes mellitus. Eur Radiol. 2017;27(10):4247–4256. doi:10.1007/s00330-017-4790-3
31. Zhuo Y, Fang F, Lu L, et al. White matter impairment in type 2 diabetes mellitus with and without microvascular disease. Neuroimage Clin. 2019;24:101945. doi:10.1016/j.nicl.2019.101945
32. Wu G, Wang Y, Mwansisya TE, et al. Effective connectivity of the posterior cingulate and medial prefrontal cortices relates to working memory impairment in schizophrenia and bipolar patients. Schizophr Res. 2014;158(1–3):85–90. doi:10.1016/j.schres.2014.06.033
33. LeDoux JE. Emotion circuits in the brain. Annu Rev Neurosci. 2000;23:155–184. doi:10.1146/annurev.neuro.23.1.155
34. Sun Q, Chen GQ, Wang XB, et al. Alterations of white matter integrity and hippocampal functional connectivity in type 2 diabetes without mild cognitive impairment. Front Neuroanat. 2018;12:21. doi:10.3389/fnana.2018.00021
35. Luo Z, Chen G, Jia Y, et al. Shared and specific dynamics of brain segregation and integration in bipolar disorder and major depressive disorder: a resting-state functional magnetic resonance imaging study. J Affect Disord. 2021;280(Pt A):279–286. doi:10.1016/j.jad.2020.11.012
36. Zhang S, Wang Y, Zheng S, et al. Multimodal MRI reveals alterations of the anterior insula and posterior cingulate cortex in bipolar II disorders: a surface-based approach. Prog Neuropsychopharmacol Biol Psychiatry. 2022;116:110533. doi:10.1016/j.pnpbp.2022.110533
37. Zhang G, Xiao Q, Wang C, et al. The different impact of depressive or manic first-episode on pediatric bipolar disorder patients: evidence from resting-state fMRI. Neuroscience. 2023;526:185–195. doi:10.1016/j.neuroscience.2023.06.015
38. Yao X, Yin Z, Liu F, et al. Shared and distinct regional homogeneity changes in bipolar and unipolar depression. Neurosci Lett. 2018;673:28–32. doi:10.1016/j.neulet.2018.02.033
39. Gao W, Jiao Q, Lu S, et al. Alterations of regional homogeneity in pediatric bipolar depression: a resting-state fMRI study. BMC Psychiatry. 2014;14:222. doi:10.1186/s12888-014-0222-y
40. Liang MJ, Zhou Q, Yang KR, et al. Identify changes of brain regional homogeneity in bipolar disorder and unipolar depression using resting-state FMRI. PLoS One. 2013;8(12):e79999. doi:10.1371/journal.pone.0079999
41. Xiao Q, Zhong Y, Lu D, et al. Altered regional homogeneity in pediatric bipolar disorder during manic state: a resting-state fMRI study. PLoS One. 2013;8(3):e57978. doi:10.1371/journal.pone.0057978
42. Han KM, De Berardis D, Fornaro M, Kim YK. Differentiating between bipolar and unipolar depression in functional and structural MRI studies. Prog Neuropsychopharmacol Biol Psychiatry. 2019;91:20–27. doi:10.1016/j.pnpbp.2018.03.022
43. Maes MH, Stoyanov D. False dogmas in mood disorders research: towards a nomothetic network approach. WJP. 2022;12(5):651–667. doi:10.5498/wjp.v12.i5.651
 © 2023 The Author(s). This work is published and licensed by Dove Medical Press Limited. The full terms of this license are available at https://www.dovepress.com/terms.php and incorporate the Creative Commons Attribution - Non Commercial (unported, v3.0) License.
By accessing the work you hereby accept the Terms. Non-commercial uses of the work are permitted without any further permission from Dove Medical Press Limited, provided the work is properly attributed. For permission for commercial use of this work, please see paragraphs 4.2 and 5 of our Terms.
© 2023 The Author(s). This work is published and licensed by Dove Medical Press Limited. The full terms of this license are available at https://www.dovepress.com/terms.php and incorporate the Creative Commons Attribution - Non Commercial (unported, v3.0) License.
By accessing the work you hereby accept the Terms. Non-commercial uses of the work are permitted without any further permission from Dove Medical Press Limited, provided the work is properly attributed. For permission for commercial use of this work, please see paragraphs 4.2 and 5 of our Terms.