Back to Journals » Clinical Ophthalmology » Volume 20
Referral Pattern Changes Over a Decade in a Tertiary Neuro-Ophthalmology Clinic
Authors Belson OD, Avisar N, Huna-Baron R ![]()
Received 25 January 2026
Accepted for publication 12 May 2026
Published 15 June 2026 Volume 2026:20 597432
DOI https://doi.org/10.2147/OPTH.S597432
Checked for plagiarism Yes
Review by Single anonymous peer review
Peer reviewer comments 3
Editor who approved publication: Dr Sotiria Palioura
Ori Daniel Belson,1,2 Nir Avisar,3,4 Ruth Huna-Baron3,4
1The Ruth and Bruce Rappaport Faculty of Medicine, Technion – Israel Institute of Technology, Haifa, Israel; 2Stanford Mussallem Center for Biodesign, Stanford University, Stanford, CA, USA; 3Goldschleger Eye Institute, Sheba Medical Center, Ramat Gan, Israel; 4Gray Faculty of Medical and Health Sciences, Tel Aviv University, Tel Aviv, Israel
Correspondence: Ruth Huna-Baron, Goldschleger Eye Institute, Sheba Medical Center, Ramat Gan, Israel, Email [email protected]
Purpose: To evaluate changes in referral patterns, including referral sources, patient demographics, and diagnostic patterns to a neuro-ophthalmology unit in a single tertiary medical center across two distinct three-year periods, a decade apart.
Methods: A retrospective database analysis of patients seen for their initial visit in the NO Unit at a tertiary Medical Center in Israel during January 1st, 2007–December 31st, 2009 (Group 1– 1436 patients), and during January 1st 2017–December 31st 2019 (Group 2– 2104 patients). Data collected included patients’ age, gender, referring provider specialty, primary complaint, clinical findings, and final diagnosis.
Results: Patients in Group 2 were significantly older than those in Group 1 (p < 0.024). There was a significant increase in referrals from ophthalmologists (p < 0.001) and pediatricians (p < 0.001), while referrals from neurologists (p < 0.006) and rehabilitation specialists (p < 0.003) declined, Diagnoses related to vision changes increased significantly over time (p < 0.001). Diagnoses related to complaint of diplopia were more frequent in Group 2 (p < 0.01). A multinomial logistic regression further demonstrated that, after adjusting for age and sex, diagnoses of pseudotumor cerebri (PTC) (OR = 1.46, p = 0.004) and tumor/compressive lesions (OR = 1.55, p < 0.001) were significantly more likely in Group 2 compared with Group 1, whereas optic nerve disease, ocular motility disorders, and visual function complaints showed no significant temporal change.
Conclusion: The study demonstrated an increase in referrals to NO services and a demographic shift toward older patient population. These findings emphasize the growing need for neuro-ophthalmologic expertise, particularly in the context of an aging population. Multinomial regression further showed that diagnoses of PTC and tumor/compressive lesions became significantly more common over the decade, highlighting evolving diagnostic trends that may inform resource allocation and future service planning.
Plain Language Summary: Neuro-ophthalmology clinics manage complex conditions affecting vision and the nervous system, yet little is known about how referral patterns to these services change over time.
In this study, we compared referrals to a tertiary neuro-ophthalmology clinic during two three-year periods a decade apart.
We examined referral sources, patient demographics, and final diagnoses.
We found a substantial increase in overall referrals over time, particularly from ophthalmologists and pediatricians. Patients referred in the later period were older, reflecting broader demographic changes. Certain diagnoses, including idiopathic intracranial hypertension and tumor-related conditions, became more common, even after accounting for age and sex differences.
These findings suggest that demand for neuro-ophthalmology services is increasing and evolving. Understanding these trends may help healthcare systems plan training, staffing, and resource allocation to better meet future patient needs.
Keywords: neuro-ophthalmology referral, referral patterns, neuro-ophthalmic diagnoses, referral provider
Introduction
Neuro-ophthalmology is a subspecialty that addresses disorders of the nervous system which affect vision, ocular movements, pupillary reflexes, and lid function. These conditions are often complex and may result in visual loss, severe morbidity, and even mortality. Usually, the number of neuro-ophthalmologists is small.1 Patients are usually referred to tertiary neuro-ophthalmology clinics by various specialists including ophthalmologists, neurologists, optometrists, neurosurgeons, endocrinologists, oncologists, as well as by secondary care providers, such as hospital departments. Current literature establishes that misdiagnoses before referrals are common.2–4 As changes in the prevalence of patients’ medical conditions are widespread, it is also important to identify changes in referral patterns to NO clinics in order to plan personnel and technology requirements and adjust medical education.
Supporting the global relevance of this issue, a recent study from Colombia reported substantial referral delays and misdiagnosis rates before neuro-ophthalmology consultation, emphasizing the importance of analyzing referral patterns to inform workforce planning and improve patient outcomes.5
Additional studies from specialized neuro-ophthalmology centers have demonstrated a high burden of neuro-ophthalmology consultations and a broad spectrum of patient presentations, reflecting increasing demand for subspecialty services. However, most available data are cross-sectional, and temporal changes in referral patterns remain insufficiently characterized.6,7
The objective of this study was to identify and analyze changes in referral sources, demographics, and diagnostic patterns in a tertiary Neuro-Ophthalmology clinic within a medical center by comparing two distinct three-year periods, a decade apart.
Patients and Methods
In the study, we completed a retrospective database analysis of de-identified patients who initially visited the Neuro-Ophthalmology Unit at Sheba Medical Center between two time periods: January 1st 2007 through December 31st, 2009, and from January 1st 2017 through December 31st 2019. The starting point was chosen since the implementation of electronic health records in our clinic. Diagnoses of all consecutive patients seen between those periods were included in the study, constituting 1436 patients between 2007 and 2009 (Group1) and 2104 patients between 2017 and 2019 (Group 2). All patients during such three-year periods were included to ensure comprehensive unbiased data coverage. The specific range of time periods and spread were thoughtfully designed in order to analyze possible variances in referrals to neuro-ophthalmology after a substantial time period (decade).
The clinic structure remained unchanged between the two periods, consisting of two neuro-ophthalmology specialists and one fellow.
The final diagnosis made by Neuro-ophthalmologists’ for each patient was labeled with one of the twenty-six various classifications as detailed in the Appendix. These classifications encompassed nearly 300 distinct diagnoses. We categorized them under a broader yet common classification. Examples of the classifications include “pupil” which encompasses nine sub-categories including miosis and mydriasis, the “optic nerve” which includes twenty-six sub-categories including papilledema and optic nerve cupping, and “vascular (CNS)” which includes 16 sub-categories including arteriovenous malformation and venous stenosis. Data collected included patients’ age, year of first appointment, identified gender, the specialty of the referring provider, primary complaint, findings, and final diagnosis.
Following a thorough process of compiling all the data and organizing it according to the variables listed above, the two time periods were analyzed and compared. The study focused on the variations between age, gender, and of referral provider specialty for each of the patients within both periods. The research also took a deeper look into the 26 various predetermined classifications to see if variations existed between each classification’s percent diagnosis per period, the mean age differences, as well as gender differences. The study also compared specific common diagnoses such as pseudotumor cerebri or meningioma and the factors contributing to their differences.
When choosing which specific diagnoses and classifications to take a deeper look into regarding gender, age, and incidence, the investigators chose significant and common classifications that are more commonly seen in the clinic. These diagnoses and classifications have a large impact on the field of ophthalmology due to their prevalence, thus analyzing these variables was of utmost priority during this study.
The protocol for this study was approved by the Sheba Medical Center institutional review board (IRB) and adhered to the Declaration of Helsinki. Informed consent was waived because the data were de-identified and retrospective.
Generative AI Disclosure
ChatGPT (OpenAI, GPT-4, 2024) was used for language editing and improvement of grammar and clarity in the preparation of this manuscript. The authors reviewed and verified all content for accuracy.
Statistical Analysis
Data were analyzed using IBM SPSS Statistics (version 28.0.1.0; IBM Corp., Armonk, NY, USA) and Python-based computational analysis.
Differences in mean age between groups were analyzed using the Mann–Whitney U-test.
All other analyses in which both groups had a count greater than five were performed using the Pearson chi-square test, whereas analyses involving a study group with a count of fewer than five were conducted using Fisher’s exact test.
All statistical analyses were two-sided, and a P value < 0.05 was considered statistically significant.
In addition to these analyses, a multinomial logistic regression model was applied to quantify temporal changes in diagnostic patterns between the two time periods. The dependent variable was the final diagnostic classification, and the primary predictor was year group (2017–2019 vs 2007–2009), with adjustment for age and sex. Odds ratios (ORs) with 95% confidence intervals were calculated to determine whether specific diagnoses became more or less common over time.
Results
Age and Gender
We included 3540 patients in our study. Group 1 included 1436 patients between the years 2007 and 2009, Group 2 included 2104 patients between 2017 and 2019. Group 1had patients aged 0.3 to 97 years and group 2 had patients aged 0.1 to 98 years (Figure 1). Group 2 was significantly older than Group 1 (44.61 ± 22.85 vs 46.09 ± 23.91 years, mean difference = 1.47 years, P < 0.024). Age distribution between both groups was also significantly different with distribution categorized according to ages less than 18 (16.0% Group 1 vs 16.7% Group 2), 18.0 to 49.9 (36.0% vs 33.7%), 50.0 to 64.9 (26.5% vs 20.1% p<0.0001), 65.0 to 79.9 (17.6 to 23.7% p<0.0001), and greater than 80.0 years old (3.9% vs 5.8%, P-value <0.006). Unlike age distribution, gender distribution was similar with 46.1% males in Group 1 vs 44.3% males in Group 2 (p<0.32).
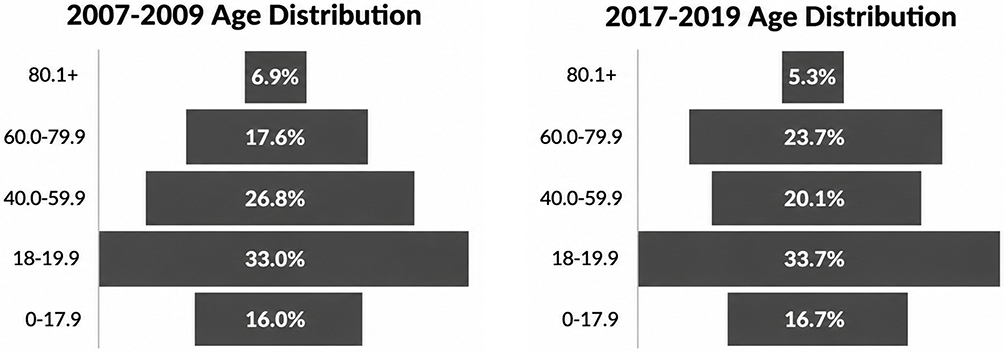 |
Figure 1 Age distribution. |
Referring Provider Specialty
During the years of the study, specialists from eighteen different fields referred patients to the NO department. Five of these specialties had significant differences between the two time periods. On one hand, a significant increase of referrals from ophthalmologists (55.4% vs 61.9%, P < 0.001) and pediatricians (0.6% vs 1.8%, P-value < 0.001) was found in the second time period. Meanwhile, referrals from neurologists (18.7% vs 15.2%, P < 0.006), rehabilitation (2.2% vs 1.0%, P < 0.003), and self (2.9% vs 1.0%, P < 0.001) decreased as detailed in Table 1.
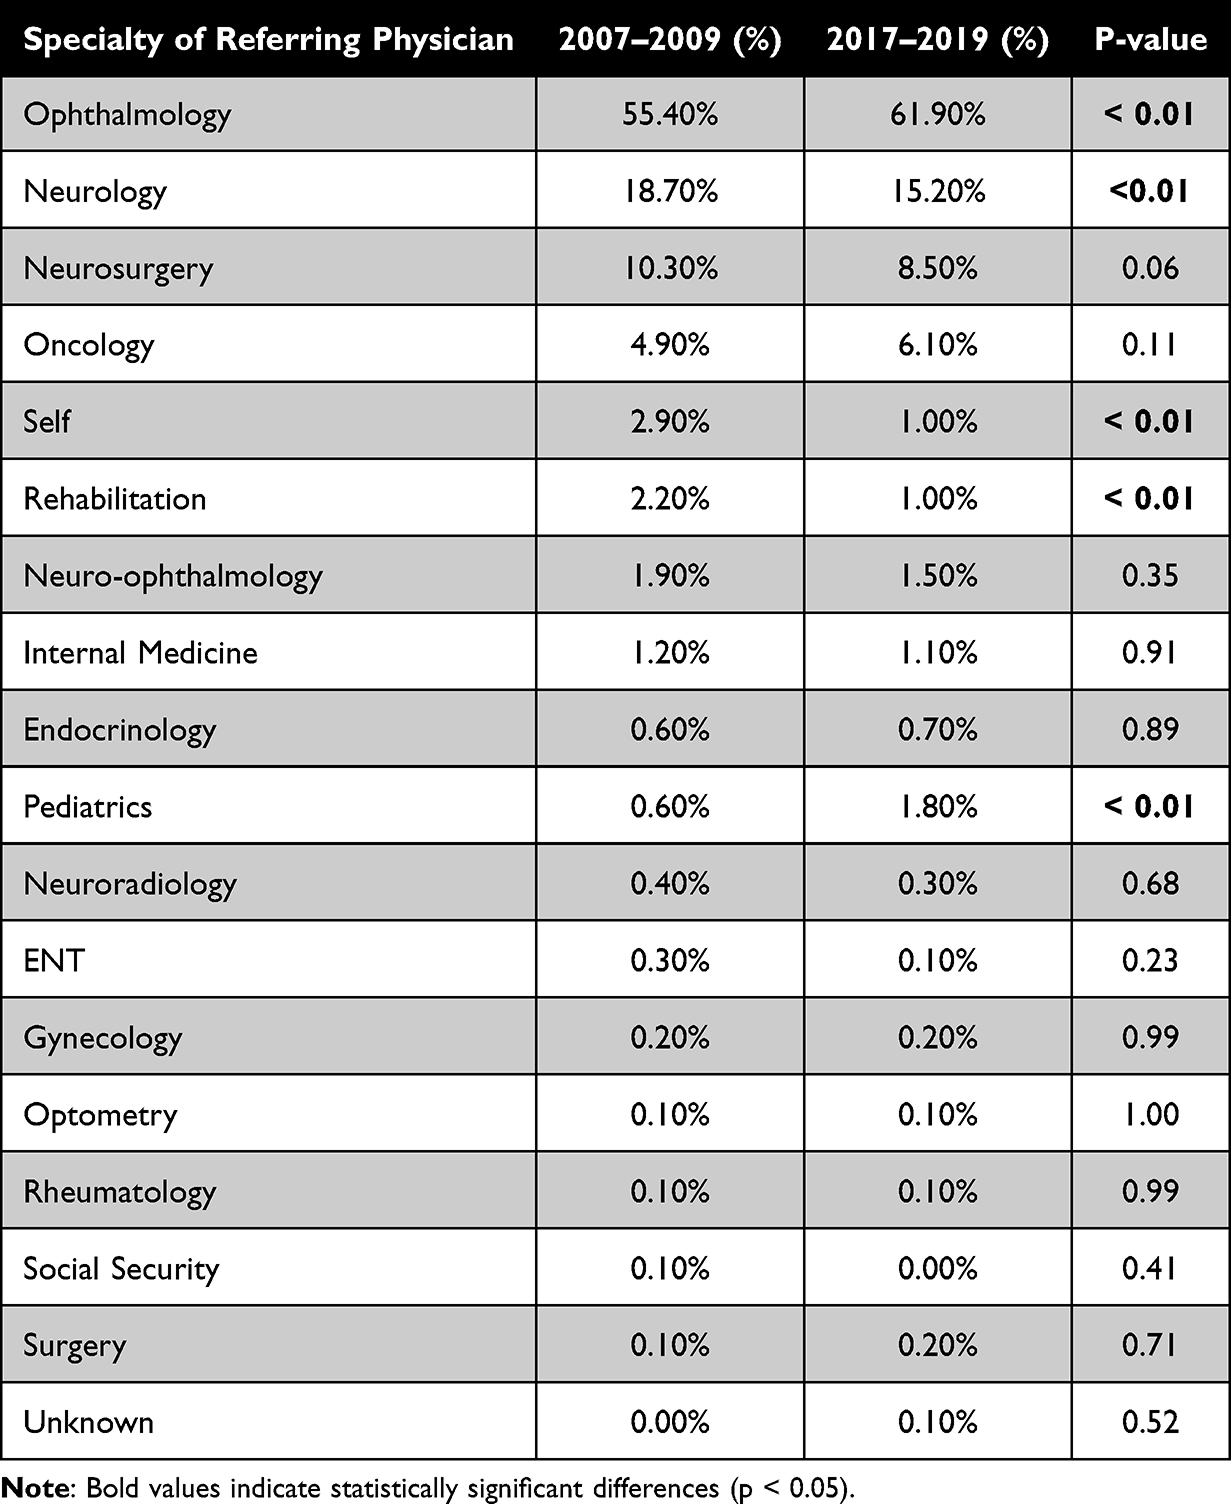 |
Table 1 Specialty of Referring Physician |
Diagnosis Patterns
Several different diagnosis classifications had significant differences when comparing the percent of that diagnosis classification between the two periods. The incidence of diagnosis related to vision change increased significantly during the years (13.9% vs 19.7%, P <0.001). Also, there was an increase of 50% in diagnosis of pain (4.3% vs 6.5%, P < 0.006). A significant decrease was found in prevalence of optic nerve diseases (23.7% vs 19.6%, P < 0.03) and in less common diagnoses such as orbital lesions (2.9% vs 1.6%, P <0.01), trauma (0.3% vs 0.0%, P < 0.03) and “normal exam” which indicates no abnormal findings (1.3% vs 0.2%, P <0.001) as detailed in Table 2.
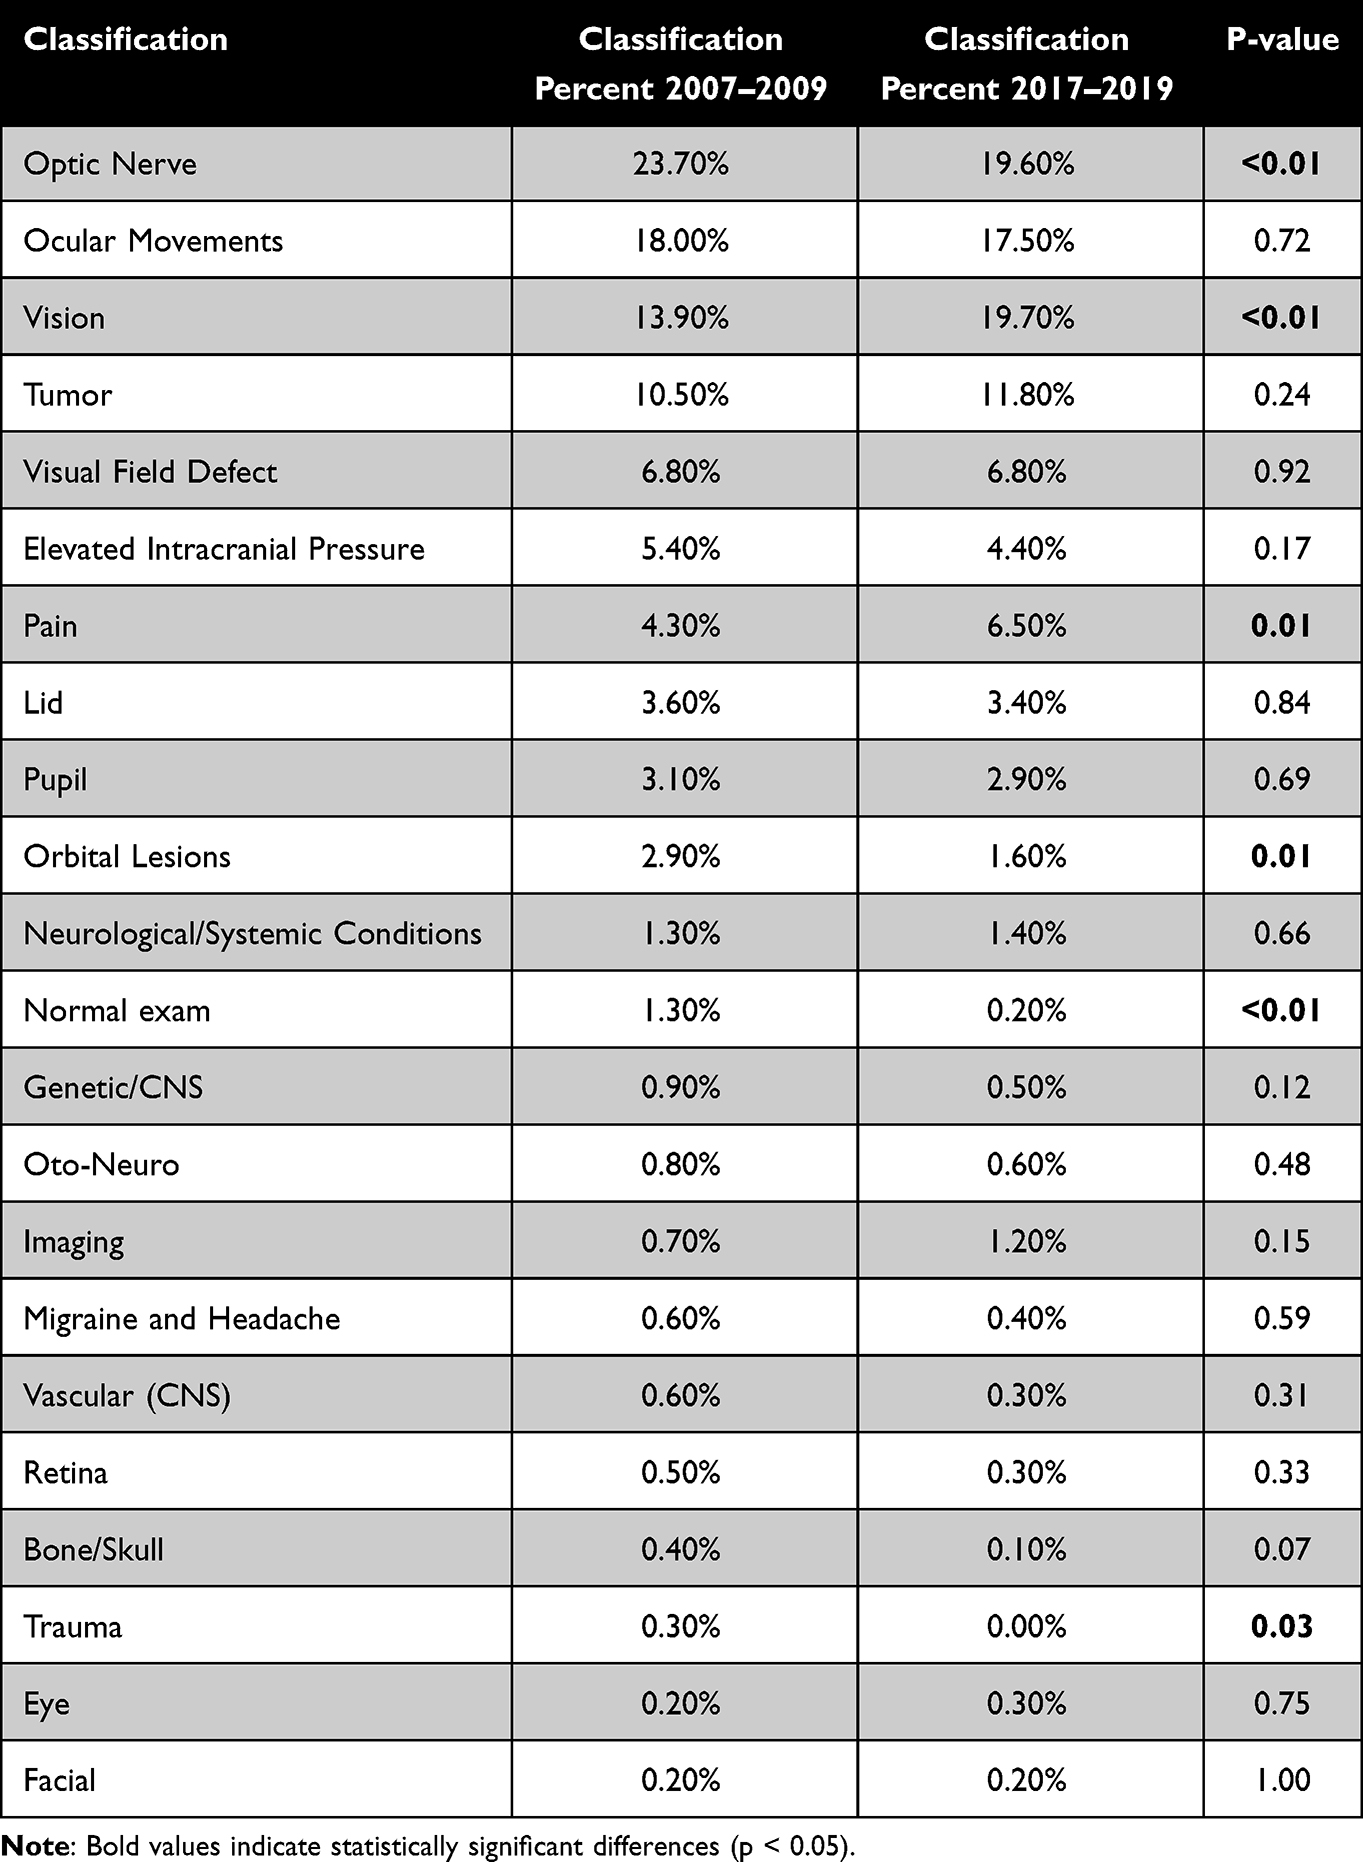 |
Table 2 Classes of Neuro-Ophthalmologic Diagnoses |
When examining the more common classes of diagnoses, no gender differences existed as detailed in Table 3. There were however differences regarding the age of the patients with disorders related to Ocular Movements (50.0 vs 54.9, P-value < 0.01) and Visual Field Defects (47.9 vs 55.3, P-value < 0.01) with older patients in Group 2. Patients with a diagnosis related to Pain were significantly younger in Group 2 (40.8 vs 34.7, P < 0.04).
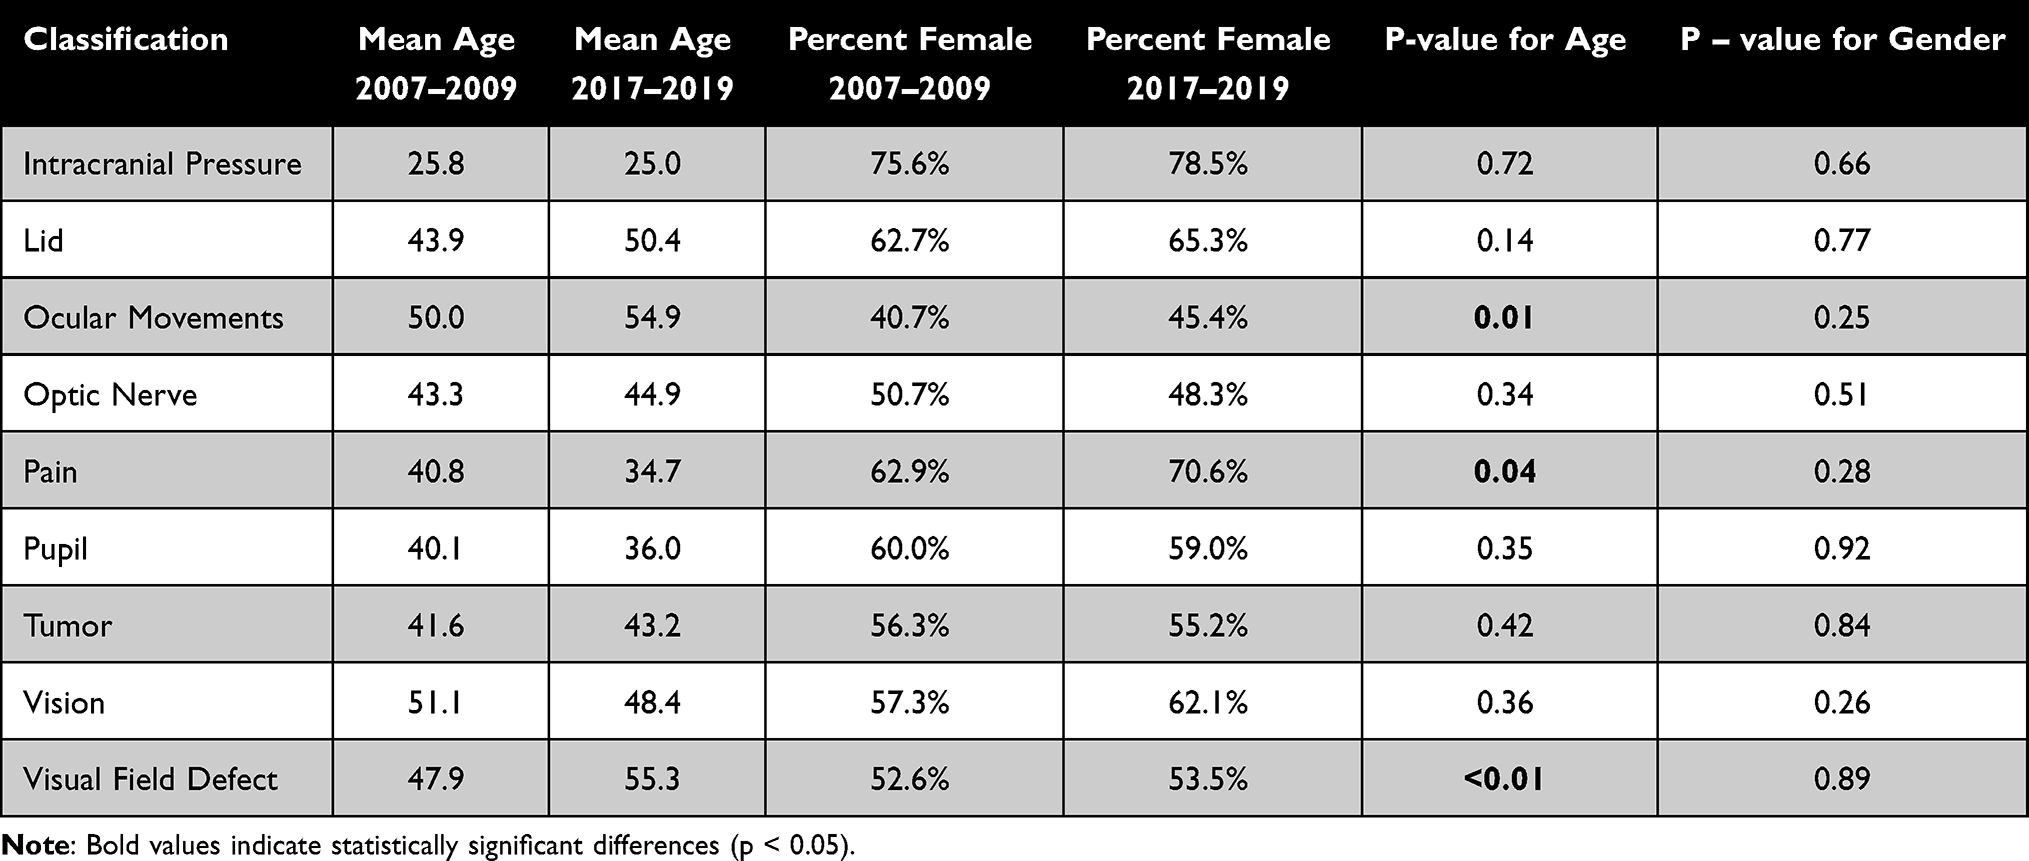 |
Table 3 Common Diagnoses |
Six specific diagnoses including anisocoria, diplopia, meningioma, optic neuritis, various types of ocular motor nerves palsy, and pseudotumor cerebri (PTC) were examined in detail. Within each of these diagnoses, age, gender, and differences between the frequency of diagnosis within the two time periods were compared as seen in Table 4. Diplopia was found to have a significant increase in Group 2 (6.7% vs 9.4%, P < 0.01), An increase in mean age of patients with ocular motor nerve palsies was also observed (51.9 vs 57.9, P-value < 0.02).
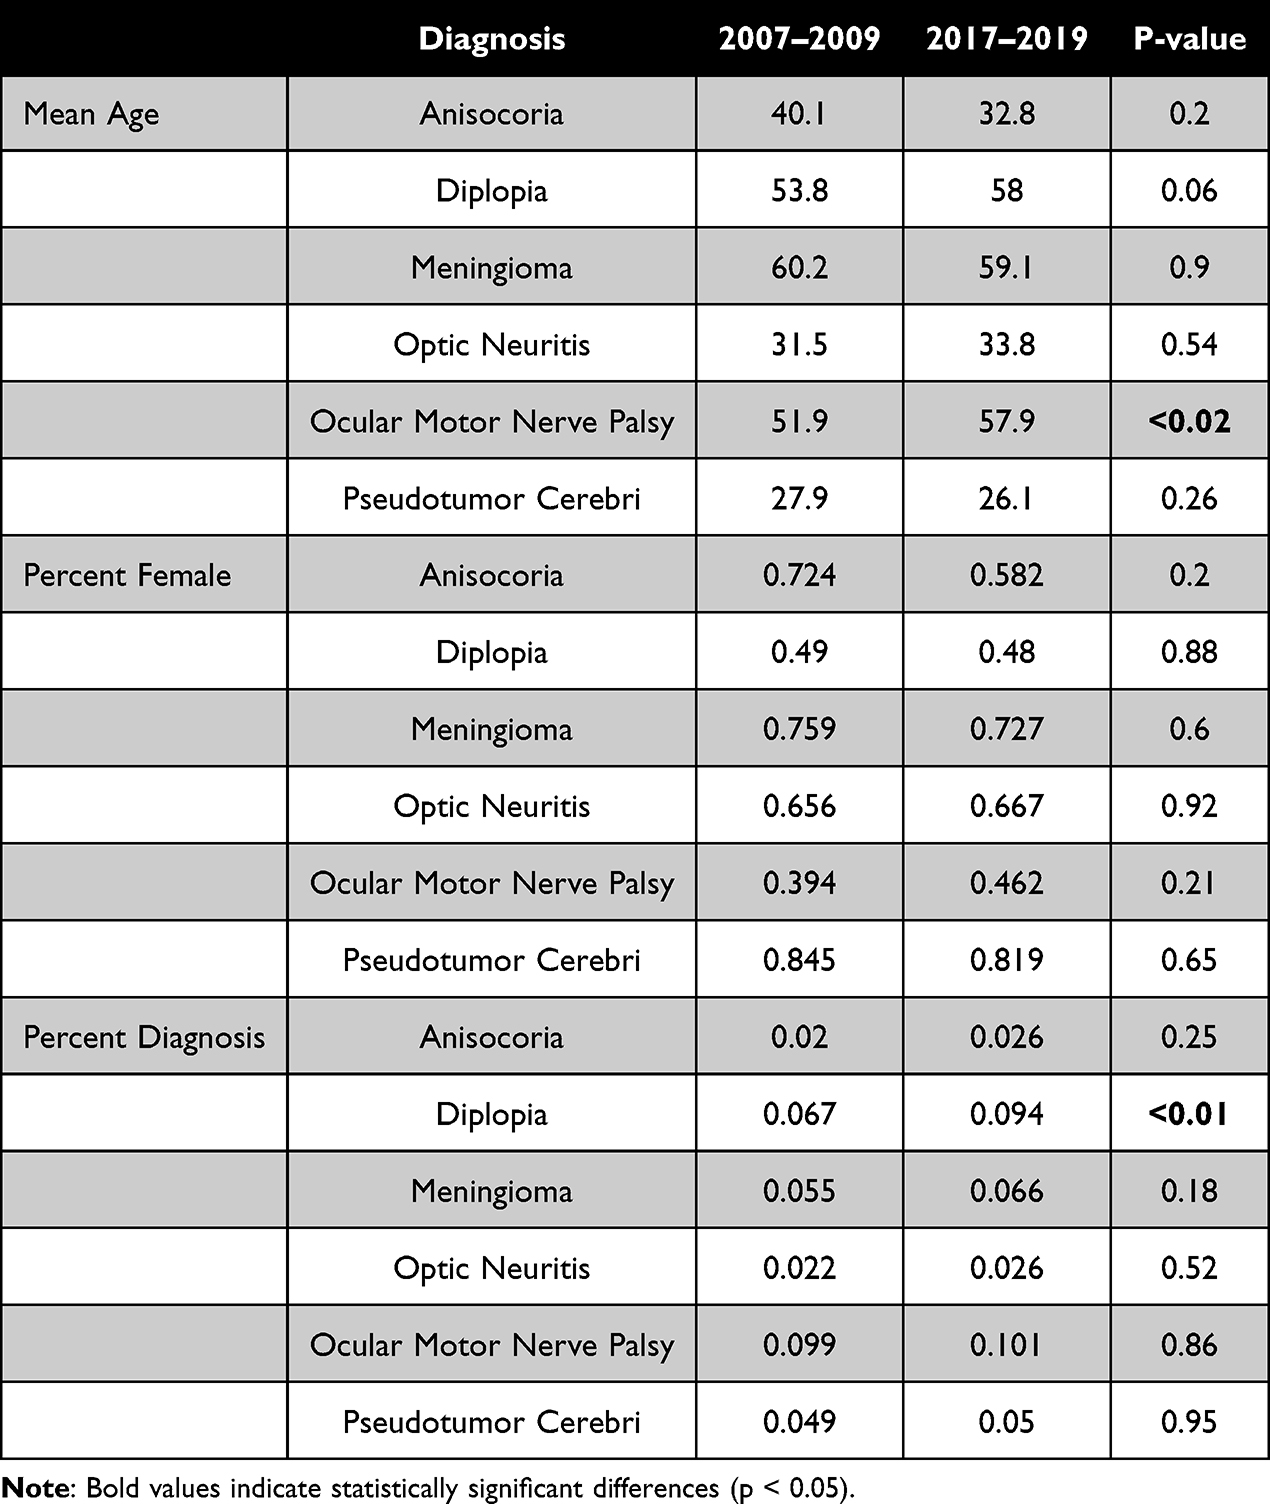 |
Table 4 Specific Diagnoses Difference in Age Distribution, Gender and Incidence |
Multinomial Regression Analysis
A multinomial logistic regression (Figure 2) was performed to evaluate whether specific diagnostic categories became more or less common over the decade, comparing 2017–2019 with 2007–2009 while adjusting for age and sex. The analysis demonstrated that diagnoses of PTC were significantly more likely in the later period (OR = 1.46, 95% CI: 1.13–1.90, p = 0.004). Similarly, tumor/compressive lesions showed a marked increase (OR = 1.55, 95% CI: 1.26–1.89, p < 0.001), indicating a true temporal rise beyond proportional frequency differences. In contrast, no significant change was observed in the likelihood of diagnoses related to optic nerve disease (OR = 1.18, p = 0.14), ocular motility disorders (OR = 0.98, p = 0.93), or visual function complaints (OR = 1.14, p = 0.20). These findings highlight diagnostic categories that have genuinely increased over time and reinforce the descriptive trends shown in earlier analyses.
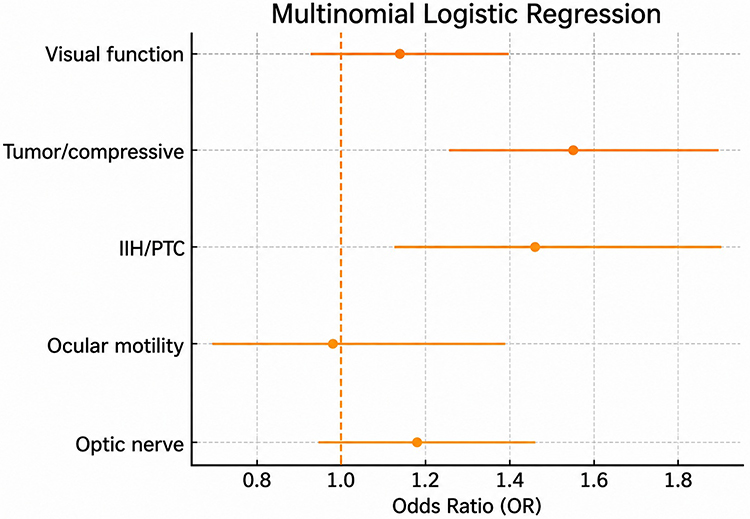 |
Figure 2 Temporal changes in diagnostic categories based on multinomial logistic regression. IIH/PTC and tumor/compressive diagnoses increased significantly in 2017–2019 compared with 2007–2009; other categories showed no significant change. |
Discussion
In this study, referral patterns to a tertiary neuro-ophthalmic clinic were studied between 2007 and 2009 (Group 1) and between 2017 and 2019 (Group 2). When evaluating the data, it was evident that there was an increase in the number of referrals to neuro-ophthalmologists. Overall, there was a 47% increase in referrals between the periods. The increase of referrals to NO clinic was higher than the general increase of 12% to the entire eye institute. Although the number of referrals increased in total, referrals from specialties such as neurology, rehabilitation, as well as self-referrals had decreased. In contrast, significant increases in referrals came from ophthalmologists and pediatricians. In parallel, national data from the Israeli Ministry of Health8 indicate that the rate of employed specialist physicians per 1000 population increased between 2010 and 2022 in ophthalmology (+14%), pediatrics (+19%), and neurology (+10%), reflecting a broader expansion of the specialist workforce.
New suspected diagnoses contributed to the increase in general pediatric referrals. These referrals were a result of suspected PTC which was the reason for eight referrals in the Group 2 and zero referrals in Group 1. During the second period, there were also four referrals by pediatricians due to headaches. Meanwhile, there were zero referrals due to headaches in the first period. These referrals may be the result of an increase in childhood obesity and the increase in precocious or normal variant puberty amongst children.9–11 Although not statistically significant, there were also increases in referrals from endocrinology, gynecology, internal medicine, NO, neuro-radiology, neurology, neurosurgery, oncology, optometry, and general surgery.
Data from the study also demonstrates that there was a significant change in the age groups from both ends of the decade. In the second time period, the age of patients shifted upward. The mean age increased from 44.62 years to 46.10 years and the 75th percentile increased from 63 to 67 years of age. The retrospective study also displayed an increase in the percentage of patients aged 65+ within the second period. Patients aged 65.0 to 79.9 increased from 17.6% to 23.7% and patients aged 80.0 and above increased from 3.9% to 5.8%.
These findings are supported by the aging population within Israel as reported by the World Bank which documented an increase of citizens aged 65 and older. During Group 1 time period 10% of the population was older than 65 whereas in Group 2 time period 12% of the population was older than 65. These findings are also consistent with other studies, which emphasize the importance of neuro-ophthalmology in the future. With a growing aging population, there is expected to be an increased demand for neuro-ophthalmology-related healthcare needs.12–14
Beyond descriptive differences, the multinomial logistic regression provided a clearer understanding of which diagnostic categories genuinely shifted over time. After adjusting for age and sex, the likelihood of diagnosing PTC and tumor/compressive lesions was significantly higher in 2017–2019 compared with 2007–2009 (OR = 1.46 and 1.55, respectively). These findings suggest that the observed increases are not solely due to changes in referral volume or demographic shifts, and can reflect a true rise in the detection or incidence of these conditions.
This may, in part, reflect increased availability of neuroimaging (MRI and CT) in Israel over time, which could have contributed to improved detection of underlying pathology rather than a true rise in incidence.15
Notably, during the later period, diagnostic practices for PTC were aligned with revised criteria for pseudotumor cerebri syndrome, which are more stringent than the previously used modified Dandy criteria.16
Moreover, the incidence of Idiopathic Intracranial Hypertension has increased significantly from 2.3 per 100,000/year in 2003 to 7.8 per 100,000/year in 2017.17 However, the observed increase in PTC referrals should be interpreted with caution. In Israel, as in other OECD healthcare systems, ongoing efforts to strengthen community-based care and maintain structured referral pathways may have influenced patterns of access to specialist services and contributed to increased detection rather than a true rise in incidence.18,
Similarly, epidemiological data demonstrate an increase in the incidence of primary brain tumors over time. In Ireland,19 the number of diagnosed cases increased from 2478 in 2005–2009 to 3590 in 2015–2019, alongside a rise in age-standardized incidence rates from 91.8 to 107.2 per 100,000 population, suggesting a growing disease burden.
In contrast, optic nerve disease, ocular motility disorders, and visual function complaints did not show significant temporal change, indicating stability in these diagnostic categories despite the broader evolution in referral patterns. This regression-based insight helps distinguish between diagnostic trends driven by population changes and those reflecting shifts in clinical practice, imaging utilization, or disease epidemiology.
Although insignificant, we also observed a decrease in the age of patients diagnosed with pseudotumor cerebri. The mean age decreased from 28 to 26. The 25th, 50th, and 75th age percentiles also decreased from 19 to 18.75 years, 26 to 24, and 35 to 30.5 years of age, respectively. Also an increase in the percentage of male patients with pseudotumor cerebri was noticed, rising from 15.5% to 18.1%. The cause of this trend could be the increase in overweight males within the population. According to Israel’s Central Bureau of Statistics during the year 2010 40% of men in Israel were overweight while in 2017 55% of men were overweight.20–22
Contrary to the trend above, when looking into our data concerning oculomotor nerve palsies, we found that there was a significant increase in the age distribution. Comparing Group 1 and Group 2, we noted an increase in the 25th, 50th, and 75th percentiles. The ages increased from 39 to 50, 58 to 62, and 70.0 to 72.0 years of age for each respective percentile. Reasons for these findings could include an increase in microvascular atherosclerosis, an increase in hypertension, an increase in metabolic hyperlipidemia, and obesity.23,24
Another interesting finding was the decrease in trauma diagnoses which might be due to miscoding or an increase in referrals to oculoplastic surgeons. Furthermore, one possible explanation for the decrease in referrals of patients with orbital lesions could be due to the growing number of oculoplastic surgeon or the improvement of orbital imaging.25 A rise in pain was also a noteworthy change which may have been due to the increased awareness or appreciation of pain in society as well as an increase in pain clinics.26
The main limitations of this study its retrospective review of patient data, and that the study was confined to available data. Furthermore, the study was conducted at a single tertiary center in a country with National Health Insurance, where comprehensive coverage is provided to all residents through four non-profit health organizations. To counter these limitations, we made sure to study two time periods of 3 years each wherein all the patients’ information was accessible. Additionally, this study was performed at a single tertiary clinic with access to a few neuro-ophthalmologists.
In conclusion, significant changes in referral patterns to our neuro-ophthalmology clinic were observed between 2007–2009 and 2017–2019. These trends indicate a notable increase in referrals, particularly from ophthalmologists, and a shift toward an older patient population. These evolving patterns warrant further investigation, as they may have significant implications for medical training, the strengthening of communication between tertiary centers and primary care services, and future neuro-ophthalmology resource allocation.
Data Sharing Statement
The datasets used and/or analyzed in the present study are available from the corresponding author on reasonable request.
Ethics Approval
This retrospective study was approved by the institutional review board of Sheba Medical Center (SMH 6867-20) and adhered to the tenets of the Declaration of Helsinki. The institutional review board waived the need for informed consent given the retrospective anonymized data collection.
Author Contributions
All authors made a significant contribution to the work reported, whether that is in the conception, study design, execution, acquisition of data, analysis and interpretation, or in all these areas; took part in drafting, revising or critically reviewing the article; gave final approval of the version to be published; have agreed on the journal to which the article has been submitted; and agree to be accountable for all aspects of the work.
Funding
No funding was received for this research.
Disclosure
No funds, grants, or other support was received for conducting this study. The authors do not have to disclose any financial or non-financial interests that are directly or indirectly related to the work submitted for publication.
References
1. DeBusk A, Subramanian PS, Scannell Bryan M, Moster ML, Calvert PC, Frohman LP. Mismatch in supply and demand for neuro-ophthalmic care. J Neuroophthalmol. 2022;42:62–10. doi:10.1097/WNO.0000000000001214
2. Mahase E. NICE guidance aims to reduce misdiagnosis and delayed referral for neurological conditions. BMJ. 2019;365:l2047. doi:10.1136/bmj.l2047
3. Schroeder RM, Stunkel L, Gowder MTA, et al. Misdiagnosis of third nerve palsy. J Neuroophthalmol. 2022;42:121–125. doi:10.1097/WNO.0000000000001010
4. Stunkel L, Mackay DD, Bruce BB, Newman NJ, Biousse V. Referral patterns in neuro-ophthalmology. J Neuroophthalmol. 2020;40:485–493. doi:10.1097/WNO.0000000000000846
5. Sheth S, Ramirez-Sanchez L, Rincón-Lopez JV, Mejia-Vergara AJ. Neuro-ophthalmology referral patterns: learnings from Colombia. J Neuroophthalmol. 2025;45:515–520. doi:10.1097/WNO.0000000000002377
6. Simao LM, de Almeida ACV, Viana MTSA, et al. The Patient’s clinical profile from a neuro-ophthalmology center in Brazil: a retrospective study. J Neuroophthalmol. 2024;44(4):e520–e525. doi:10.1097/WNO.0000000000002057
7. Okrent Smolar AL, Ray HJ, Dattilo M, et al. Neuro-ophthalmology emergency department and inpatient consultations at a large academic referral center. Ophthalmology. 2023;130(12):1304–1312. doi:10.1016/j.ophtha.2023.07.028
8. Ministry of Health (Israel). Health professions manpower in Israel 2023. Jerusalem: Ministry of Health; 2023. Available from: https://www.gov.il/BlobFolder/reports/health-professions-manpower/he/files_publications_units_info_manpower2023.pdf.
9. Westgate CSJ, Israelsen IME, Jensen RH, Eftekhari S. Understanding the link between obesity and headache, with focus on migraine and idiopathic intracranial hypertension. J Headache Pain. 2021;22:123. doi:10.1186/s10194-021-01337-0
10. Paley GL, Sheldon CA, Burrows EK, Chilutti MR, Liu GT, McCormack SE. Overweight and obesity in pediatric secondary pseudotumor cerebri syndrome. Am J Ophthalmol. 2015;159:344–352. doi:10.1016/j.ajo.2014.11.003
11. Bräuner EV, Busch AS, Eckert-Lind C, Koch T, Hickey M, Juul A. Trends in the incidence of central precocious puberty and normal variant puberty among children in Denmark, 1998 to 2017. JAMA Network Open. 2020;3(10):e2015665. doi:10.1001/jamanetworkopen.2020.15665
12. Welp A, Woodbury RB, McCoy MA, editors. Making Eye Health a Population Health Imperative: Vision for Tomorrow. Washington (DC): National Academies Press (US); 2016.
13. Swenor BK, Lee MJ, Varadaraj V, Whitson HE, Ramulu PY. Aging with vision loss: a framework for assessing the impact of visual impairment on older adults. Gerontologist. 2020;60:989–995. doi:10.1093/geront/gnz117
14. GBD 2019 Blindness and Vision Impairment Collaborators; Vision Loss Expert Group of the Global Burden of Disease Study. Causes of blindness and vision impairment in 2020 and trends over 30 years, and prevalence of avoidable blindness in relation to VISION 2020: the Right to Sight: an analysis for the Global Burden of Disease Study. Lancet Glob Health. 2021;9:e144–e160. doi:10.1016/S2214-109X(20)30489-7
15. The Global Economy.com. Israel: magnetic resonance imaging units [Internet]. 2021 [cited April 30, 2026]. Available from: https://www.theglobaleconomy.com/Israel/magnetic_resonance_imaging_units.
16. Friedman DI, Liu GT, Digre KB. Revised diagnostic criteria for the pseudotumor cerebri syndrome in adults and children. Neurology. 2013;81(13):1159–1165. doi:10.1212/WNL.0b013e3182a55f17
17. Miah L, Strafford H, Fonferko-Shadrach B, et al. Incidence, prevalence, and health care outcomes in idiopathic intracranial hypertension: a population study. Neurology. 2021;96(8):e1251–e1261. doi:10.1212/WNL.0000000000011463
18. OECD reviews of health care quality: Israel 2012: raising standards. Paris: OECD Publishing; 2012. Available from: https://www.oecd.org/content/dam/oecd/en/publications/reports/2012/10/oecd-reviews-of-health-care-quality-israel-2012_g1g1fd99/9789264029941-en.pdf.
19. Bennett K, O’Donovan B, Macnally S, et al. Trends in primary brain tumour incidence and mortality in Ireland 1995–2019. Ir J Med Sci. 2026. doi:10.1007/s11845-026-04326-x
20. Central Bureau of Statistics Israel. Selected data from the 2010 social survey on health and lifestyle. 2011. Available from: https://www.cbs.gov.il/en/mediarelease/Pages/2011/Selected-Data-from-the-2010-Social-Survey-on-Health-and-Lifestyle.aspx.
21. Central Bureau of Statistics Israel. Selected data on health and way of life from the 2017 social survey: weight, dieting, nutrition and eating habits. 2018. Available from: https://www.cbs.gov.il/en/mediarelease/Pages/2018/Selected-Data-on-Health-and-Way-of-Life-from-the-2017-Social-Survey.aspx.
22. Kilgore KP, Lee MS, Leavitt JA, et al. Re-evaluating the incidence of idiopathic intracranial hypertension in an era of increasing obesity. Ophthalmology. 2017;124:697–700. doi:10.1016/j.ophtha.2017.01.006
23. Zhou B, Carrillo-Larco RM, Danaei G, et al. Worldwide trends in hypertension prevalence and progress in treatment and control from 1990 to 2019: a pooled analysis of 1201 population-representative studies with 104 million participants. Lancet. 2021;398:957–980. doi:10.1016/S0140-6736(21)01330-1
24. Hill MF, Bordoni B. Hyperlipidemia. In: StatPearls. Treasure Island (FL): StatPearls Publishing; 2022.
25. Grand View Research. Oculoplastic surgery market size: industry research report, 2030. 2020. Available from: https://www.grandviewresearch.com/industry-analysis/oculoplastic-surgery-market.
26. Zajacova A, Grol-Prokopczyk H, Zimmer Z. Pain trends among American adults, 2002–2018: patterns, disparities, and correlates. Demography. 2021;58(2):711–738. doi:10.1215/00703370-8977691
 © 2026 The Author(s). This work is published and licensed by Dove Medical Press Limited. The
full terms of this license are available at https://www.dovepress.com/terms
and incorporate the Creative Commons Attribution
- Non Commercial (unported, 4.0) License.
By accessing the work you hereby accept the Terms. Non-commercial uses of the work are permitted
without any further permission from Dove Medical Press Limited, provided the work is properly
attributed. For permission for commercial use of this work, please see paragraphs 4.2 and 5 of our Terms.
© 2026 The Author(s). This work is published and licensed by Dove Medical Press Limited. The
full terms of this license are available at https://www.dovepress.com/terms
and incorporate the Creative Commons Attribution
- Non Commercial (unported, 4.0) License.
By accessing the work you hereby accept the Terms. Non-commercial uses of the work are permitted
without any further permission from Dove Medical Press Limited, provided the work is properly
attributed. For permission for commercial use of this work, please see paragraphs 4.2 and 5 of our Terms.