")
Back to Journals » Vascular Health and Risk Management » Volume 13
Reference values assessment in a Mediterranean population for small dense low-density lipoprotein concentration isolated by an optimized precipitation method
Authors Fernández-Cidón B, Padró-Miquel A, Alía-Ramos P, Castro-Castro MJ, Fanlo-Maresma M, Dot-Bach D , Valero-Politi J, Pintó-Sala X , Candás-Estébanez B
Received 16 January 2017
Accepted for publication 4 April 2017
Published 6 June 2017 Volume 2017:13 Pages 201—207
DOI https://doi.org/10.2147/VHRM.S132475
Checked for plagiarism Yes
Review by Single anonymous peer review
Peer reviewer comments 2
Editor who approved publication: Dr Konstantinos Tziomalos
Bárbara Fernández-Cidón,1–3 Ariadna Padró-Miquel,1 Pedro Alía-Ramos,1 María José Castro-Castro,1 Marta Fanlo-Maresma,4 Dolors Dot-Bach,1 José Valero-Politi,1 Xavier Pintó-Sala,4 Beatriz Candás-Estébanez1
1Clinical Laboratory, Hospital Universitari de Bellvitge, L’Hospitalet de Llobregat, Spain; 2Department of Biochemistry, Molecular Biology and Biomedicine, Autonomous University of Barcelona (UAB), Barcelona, Spain; 3Department of Pharmacotherapy, Pharmacogenetics and Pharmaceutical Technology, Institut d’Investigació Biomèdica de Bellvitge (IDIBELL), L’Hospitalet de Llobregat, Spain; 4Cardiovascular Risk Unit, Hospital Universitari de Bellvitge, L’Hospitalet de Llobregat, Spain
Background: High serum concentrations of small dense low-density lipoprotein cholesterol (sd-LDL-c) particles are associated with risk of cardiovascular disease (CVD). Their clinical application has been hindered as a consequence of the laborious current method used for their quantification.
Objective: Optimize a simple and fast precipitation method to isolate sd-LDL particles and establish a reference interval in a Mediterranean population.
Materials and methods: Forty-five serum samples were collected, and sd-LDL particles were isolated using a modified heparin-Mg2+ precipitation method. sd-LDL-c concentration was calculated by subtracting high-density lipoprotein cholesterol (HDL-c) from the total cholesterol measured in the supernatant. This method was compared with the reference method (ultracentrifugation). Reference values were estimated according to the Clinical and Laboratory Standards Institute and The International Federation of Clinical Chemistry and Laboratory Medicine recommendations. sd-LDL-c concentration was measured in serums from 79 subjects with no lipid metabolism abnormalities.
Results: The Passing–Bablok regression equation is y = 1.52 (0.72 to 1.73) + 0.07x (−0.1 to 0.13), demonstrating no significant statistical differences between the modified precipitation method and the ultracentrifugation reference method. Similarly, no differences were detected when considering only sd-LDL-c from dyslipidemic patients, since the modifications added to the precipitation method facilitated the proper sedimentation of triglycerides and other lipoproteins. The reference interval for sd-LDL-c concentration estimated in a Mediterranean population was 0.04–0.47 mmol/L.
Conclusion: An optimization of the heparin-Mg2+ precipitation method for sd-LDL particle isolation was performed, and reference intervals were established in a Spanish Mediterranean population. Measured values were equivalent to those obtained with the reference method, assuring its clinical application when tested in both normolipidemic and dyslipidemic subjects.
Keywords: sd-LDL-c, small dense lipoprotein, sd-LDL reference values
Introduction
High concentration of low-density lipoprotein cholesterol (LDL-c) is one of the major coronary heart disease (CHD) risk factors.1 The LDLs are a heterogeneous group of particles differing in size and density.2 Small dense LDL (sd-LDL) particles are more atherogenic than large buoyant LDL particles (lb-LDL)3–5 and are associated with CHD risk.6–9 These particles are formed as a consequence of a high activity of cholesteryl ester transfer protein and hepatic lipase enzyme in subjects with elevated triglyceride (TG) concentration.10,11 The increased atherogenicity of sd-LDL particles is due to their small size and density, which facilitates their infiltration in the subendothelial layer of arteries. It is also known that sd-LDL particles have a different apolipoprotein B conformation with a lower affinity for LDL receptors in the liver resulting in a decrease of LDL particle clearance.12 The sd-LDL particles are associated with hypertriglyceridemia and low HDL-c concentration. These three lipid abnormalities are usually called the lipid triad (LT) and are frequent in patients with premature CHD.13–16 The LT is a common finding in atherogenic dyslipidemia (AD) associated with insulin resistance, abdominal obesity and metabolic syndrome. Although LDL-c-lowering drugs are effective in AD management, in some subjects, the cardiovascular disease (CVD) risk is not increased although not achieving LDL-c targets.17–19 On the contrary, >20% of patients who had achieved LDL-c ≤1.81 mmol/L still show an atherogenic plaque progression.19,20 Therefore, studying the contribution of individual components of the LT to the atherogenic process can lead to an important improvement in the current understanding of the residual CVD risk in subjects who are on target of LDL-c concentrations.
TGs and HDL-c are usually included in the lipid profile, but the determination of sd-LDL particles is not performed in the routine analysis as its quantification is traditionally measured by ultracentrifugation that requires expensive equipment, complicated techniques and long assay times.21 Recently, new methods have been developed22 such as the nuclear magnetic resonance (NMR)23,24 that determines the size and number of LDL particles simultaneously and the Quantimetrix Lipoprint LDL System that quantifies LDL particle size subfractions25 or an automatized homogeneous assay for sd-LDL-c quantification,26–28 but both of them have limited clinical use because of their cost.
A precipitation method for sd-LDL particle isolation with heparin-Mg2+ was developed in 2003,29 being an easy and inexpensive method. However, this method has not been adapted to routine laboratories, and the reference values and the clinical utility in healthy and dyslipidemic population have not been studied. Therefore, it is interesting to optimize this method, check its interchangeability with ultracentrifugation, which is considered the reference method, and establish reference values in order to improve its contribution to clinical assessment.
CVD still remains a major cause of disability and premature death through the world, despite a number of breakthroughs in its prevention diagnosis and treatment. The accuracy in the diagnosis will decrease cardiovascular events as patients will benefit from more effective treatment.30 Although CVD mortality rates are lower in the southern countries of Europe, frequently considered to be a consequence of the Mediterranean diet, in Spain the hazard ratio estimated for CVD is 0.89% (95% confidence interval [CI]: 0.71–1.12)31 and for AD is 5.7%.19 Nevertheless, reference values for sd-LDL-c concentrations have not yet been studied in a Mediterranean population by this method. Therefore, the classification of patients according to their cardiovascular risk based on sd-LDL-c has not been possible. Effective detection of pathological sd-LDL-c concentrations in subjects with AD who have achieved LDL-c target could be very useful since it may explain the CVD residual risk associated to the LT.14,32–35 Subjects with a higher CVD risk with sd-LDL-c concentration above the reference value but normal LDL-c concentration would benefit from a combined therapy with statins plus fenofibrates instead of statin monotherapy or other therapeutic strategies.13,36–38
The evidence that correlates sd-LDL particles and CVD14,33,34,35,36 is clear. However, the current lack of practicability for its quantification in the routine laboratory and the absence of reference values in Mediterranean population make difficult to implement its measure in clinical laboratories. Achieving an inexpensive, easy and short time analysis method could facilitate sd-LDL-c concentration measurement in the clinical practice as a new dyslipidemia biomarker.
The aims of this study are to optimize a modification of the heparin-Mg2+ precipitation method for sd-LDL particle isolation and subsequent quantification, assess the results interchangeability with the reference method, and establish reference values using Clinical and Laboratory Standards Institute (CLSI) guidelines.
Materials and methods
Method optimization
Subjects
To evaluate the interchangeability with the reference method – ultracentrifugation – patients of both sexes with and without dyslipidemia attending to the clinical laboratory for their routine checkup were recruited. First, 30 serums from patients (aged 50–70 years) with no abnormal lipid concentrations according to the National Cholesterol Education Program (NCEP) guidelines were collected. In addition, 15 serums from patients (aged 55–75 years) with mixed dyslipidemia diagnosed in the Risk Cardiovascular Functional Unit of our hospital were selected.
In order to guarantee the method applicability in hypertriglyceridemic samples, serums from 50 severe dyslipidemic patients belonging to PREDIMED-PLUS trial39 were analyzed, and the correct isolation of sd-LDL was also checked. The inclusion criteria for these patients were the same as in PREDIMED-PLUS: adult males aged 55–75 years and adult females aged 60–75 years with a body mass index (BMI) ≥27 and <40 kg/m2 and who meet at least three criteria for the metabolic syndrome considered for the NCEP.
Measurement of sd-LDL-c concentration
All serum samples were collected in tubes without anticoagulant and with separating gel (Vacuette ref: 456069). Serum samples were conserved at 80°C until analysis. The precipitation assay was performed during next 2 weeks after blood extraction. The sd-LDL particles were isolated with a precipitation reagent that contains 150 U/mL heparin-Na+ (H3393; Sigma-Aldrich) and 90 mmol/L MgCl2. Each sample was prepared by mixing 300 µL of serum with 300 µL of the precipitation reagent and incubated for 10 min at 37°C. Then, the samples were maintained for 15 min at 0°C and centrifugated at 21913× g (14000 rpm) for 15 min at 4°C (centrifuge 6K15; Sigma-Aldrich). After that, the lipoproteins with a density <1.044 g/mL remained at the bottom of the tube forming a yellow precipitate. The supernatant is clear and contains HDL and sd-LDL particles with a density between 1.044 and 1.063 g/mL. An aliquot of the supernatant was removed for HDL-c and cholesterol analyses at the Cobas 711 (Roche® Diagnostics). The reagents used in the homogeneous automatized assays were Colesterol Liq Gen 2 for cholesterol and HDL-Cholesterol plus 3rd generation HDL-c. As the supernatant only contains cholesterol from HDL and sd-LDL lipoproteins, the sd-LDL-c concentration was estimated by subtracting HDL-c from the total cholesterol.
Precipitation method modifications
We adapted the precipitation method to the available equipment in our laboratory and reproduced the Hirano experiment cooling to 4°C and centrifuging at 14000 rpm. To promote the precipitate formation instead of centrifuging at 15000 rpm, we placed the samples at 0°C for 15 min. As a consequence of the lower temperature, the precipitate is packed tightly and larger numbers of samples can be processed before the precipitate begins to dissolve avoiding rich TG lipoproteins interferences. These modifications successfully ensure the sd-LDL particles isolation preserving the supernatant for longer until the separation from the sedimented lipoproteins takes place.
Method comparison
To validate the measuring procedure modifications, we compared sd-LDL particles after the precipitation and those obtained by the ultracentrifugation. To confirm the interchangeability between results obtained by both methods, sd-LDL-c concentration was measured in 30 normolipidemic and 15 dyslipidemic samples from patients described in the “Subjects” section. The sd-LDL particles were isolated by the precipitation assay as described earlier and by ultracentrifugation (290000× g for 7 h at 16°C). Supernatant obtained by both methods was removed, and cholesterol was measured at the Cobas 711 (Roche® Diagnostics).
To verify the method applicability in real patients with lipid metabolism disorders, we reproduced the precipitation conditions in serum collected from 50 patients included in the PREDIMED-PLUS trial.
Data were analyzed using Analyse-It v1.72 (Analyse-It Software Ltd., Leeds, UK). The outliers were eliminated using the Bland–Altman analysis that evaluates bias and 95% CI limits of agreement. Differences between methods were tested using the nonparametric method of Passing–Bablok regression.
Reference values assessment
Subjects
Seventy-nine participants (33 males), from the North East of Spain, aged 18–60 years were recruited. The demographic data collected included sex, age, height, weight, BMI, lifestyle habits (special diet, alcohol intakes, smokers and regular physical activity), family history, medication and glycated hemoglobin, lipids and lipoprotein measurement. We excluded subjects with the following conditions: <18 years of age, diabetes mellitus, dyslipidemia, pregnancy, cancer or undergoing chemotherapy, thyroid disorders, history of CVDs, BMI >25 kg/m2, those currently on lipid-lowering therapy and lipid concentrations above the cutoff values proposed by the NCEP to evaluate the CVD risk. Written informed consent was obtained from each subject, and the study was approved by the Clinical Research Ethics Committee of Bellvitge University Hospital. Lipid profile, glycated hemoglobin, anthropomorphic characteristics and lifestyle habits are specified in Table 1.
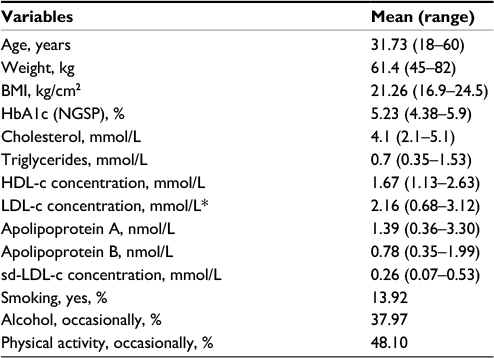 | Table 1 Subjects’ characteristics for the reference values assessment Note: *Calculated by Friedewald formula. Abbreviations: BMI, body mass index; HbA1c (NGSP), glycated hemoglobin (National Glycohemoglobin Standardization Program units); HDL-c, high-density lipoprotein cholesterol; LDL-c, low-density lipoprotein cholesterol; sd-LDL-c, small dense low-density lipoprotein cholesterol. |
Measurement of sd-LDL-c concentration
Blood samples were collected in tubes without anticoagulant and with separating gel (Vacuette ref: 456069). Serum aliquots from the primary tube were stored at −80°C for a maximum of 15 days. All analyses were performed the following 15 days after the blood extraction. The sd-LDL particles are isolated as described earlier, and then cholesterol and HDL-c were measured at the Cobas 711 (Roche® Diagnostics). Finally, sd-LDL-c concentration was estimated by subtracting HDL-c from the cholesterol measured in the supernatant.
Statistical analysis for the reference interval establishment
We performed the reference interval study according to the CLSI and The International Federation of Clinical Chemistry and Laboratory Medicine recommendations.40 Data were analyzed using Analyse-It v1.72 (Analyse-It Software Ltd.). Outliers were identified and omitted using a box plot. Data lying outside 3 interquartile ranges (IQRs) from the upper or lower edge of the box were eliminated. Reference interval partitioning test by sex and age was performed using Harris and Boyd’s approach. The Anderson–Darling nonparametric test was used to study the distribution data. As sd-LDL-c concentrations are distributed according to a Gaussian curve, a parametric method was used to establish the reference interval. The remainder 95% of values was considered to establish the reference interval.
Results
Evaluation of the precipitation method modifications
The modifications implemented promote the lipoproteins sedimentation when centrifugation at 14000 rpm is carried out. In order to facilitate the precipitation, the samples are cooled at 0°C. After the centrifugation, the pellet is formed and a clear supernatant can be easily removed in the case of normolipidemic serum. When assay is performed with lipidemic serum, TG aggregates remain on the top of the tube hampering the supernatant pipetting. However, the absence of TG aggregates sedimentation does not interfere with the sd-LDL-c quantification in the supernatant, as long as the TG aggregates are carefully removed from the supernatant before pipetting it. HDL-c values obtained in the serum before the sd-LDL particles isolation are used as a control of the precipitation method efficiency. If all the lipoproteins with a density >1.044 g/mL should remain in the supernatant after the rich TG lipoproteins sedimentation, the HDL-c measured in the supernatant should not have any change from the HDL-c initial values measured before the precipitation. This is a fast and inexpensive method that allows to measure sd-LDL-c concentration. Thirty samples can be processed at the same time, and 40 min are needed to isolate and quantify sd-LDL-c concentration.
Comparison between the precipitation method and the ultracentrifugation
The good association between the sd-LDL-c concentration measured after sd-LDL particles isolation by the precipitation method and the ultracentrifugation method for both normolipidemic and dyslipidemic samples (n=45) is shown in the linear equation (R2=0.993) provided by the Passing - Bablok regression analysis (y=1.52 [0.72 to 1.73] + 0.07 [−0.1 to 0.13]). Outliers were detected and excluded by the Bland–Altman analysis. Passing–Bablok regression analysis showed no significant deviation from linearity. The results with 95% CI for the slope (1.52 [0.72 to 1.73]) and the intercept (0.07 [−0.1 to 0.13]) demonstrate that no constant or proportional error was detected.
Reference interval estimation
Comparison of sd-LDL-c concentration in males and females demonstrated no distinct partitioning patterns, but sd-LDL-c concentrations are higher in males than females (Table 2). Age differences were not detected by Harris and Boyd’s test, and sd-LDL-c concentrations are not increased with age (Table 3).
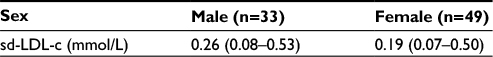 | Table 2 sd-LDL-c concentration by sex Note: Data are presented as mean (range). Abbreviation: sd-LDL-c, small dense low-density lipoprotein cholesterol. |
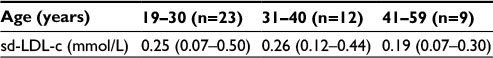 | Table 3 sd-LDL-c concentration by age Note: Data are presented as mean (range). Abbreviation: sd-LDL-c, small dense low-density lipoprotein cholesterol. |
Any outliers were detected, and the sd-LDL-c data observed a normal distribution (p=0.06). The reference interval estimated is 0.04–0.47 mmol/L.
Discussion
In this study, the original method reported by Hirano has been adapted to our laboratory technical conditions. In order to overcome such technical limitations, several modifications had to be integrated in the precipitation procedure like the cooling sample temperature during the rich TG lipoproteins sedimentation. Although a small number of samples were included in the method comparison, which may be considered a limitation of this study, slight modifications have been made from the original method. The results obtained by the original method had already been demonstrated to be interchangeable with the reference method in previous studies, and our results are consistent with them. Its clinical application has been tested in serum from dyslipidemic patients showing no differences in the precipitation procedure from the normolipidemic serum. Only serums from patients with hypertriglyceridemia showed aggregates that remained on the top of the tube. Despite the absence of lipoprotein sedimentation, the TG aggregates can be removed from the supernatant and no interference in the sd-LDL-c quantification was detected.28,29,41
The other aim of this study is to present reference values for serum sd-LDL-c concentration in a Mediterranean population from the North East of Spain. The reference value for serum sd-LDL-c concentration was 0.04–0.47 mmol/L. Thus far, no reference values for sd-LDL-c concentration have been reported using this methodology and this is not only the case in a Mediterranean population, but in other regions sd-LDL-c concentration also has not been estimated in a reference population. The method-specific reference values assessment rather than the universal reference values improves the decision-making process in a clinical setting enabling the CVD risk stratification. Regarding the strengths of this study, we determined the reference values in subjects who strictly met all the inclusion criteria and who had already completed an application form about their lifestyle instead of exporting data from the laboratory database, in order to provide the best reference intervals for use in preventive medicine.
These reference values were validated in a dyslipidemic population from the PREDIMED-PLUS trial.39 Even though all the participants are in lipid-lowering therapy, not every patient responds to the current treatment in the same way. Those who had achieved TG and LDL-c concentration targets presented sd-LDL-c concentration within the reference interval estimated. Subjects who still have elevated concentrations of TG and LDL-c after the lipid-lowering therapy presented sd-LDL-c concentrations higher than the established reference values. Further information about specific lipid-lowering treatments from patients with lower sd-LDL-c concentration should be analyzed in future investigations.
Conclusion
This study optimizes the interchangeability of the modified heparin-Mg2+ precipitation method and the ultracentrifugation method. Reference values for sd-LDL-c concentration were estimated in a Mediterranean population and proven in patients from the PREDIMED-PLUS trial. To our knowledge, it is the first study in which reference values have been established using this useful and easy-to-carry-out method. Further studies should determine the role of the concentration of sd-LDL particles in the atheroma progression and the severity of CHD, especially in patients with normal LDL-c concentrations with diabetes or hypertriglyceridemia and other conditions related with AD. Likewise, it would be necessary to establish a cutoff value from which the risk of CVD is increased compared to healthy individuals. Therefore, the measurement of sd-LDL-c concentration by this method could be useful to improve the evaluation of cardiovascular risk and to tailor preventive strategies in patients with high sd-LDL-c. The reference range obtained was from 0.04 to 0.47 mmol/L.
Disclosure
The authors report no conflicts of interest in this work.
References
Silverman MG, Blaha MJ, Krumholz HM, et al. Impact of coronary artery calcium on coronary heart disease events in individuals at the extremes of traditional risk factor burden: the Multi-Ethnic Study of Atherosclerosis. Eur Heart J. 2014;35(33):2232–2241. | ||
Rizzo M, Berneis K. Small, dense low-density-lipoproteins and the metabolic syndrome. Diabetes Metab Res Rev. 2007;23(1):14–20. | ||
Moriyama K, Takahashi E. Non-HDL cholesterol is a more superior predictor of small-dense LDL cholesterol than LDL cholesterol in Japanese subjects with TG levels <400 mg/dL. J Atheroscler Thromb. 2016;23(9):1126–1137. | ||
Voros S, Joshi P, Qian Z, et al. Apoprotein B, small-dense LDL and impaired HDL remodeling is associated with larger plaque burden and more non calcified plaque as assessed by coronary CT angiography and intravascular ultrasound with radiofrequency backscatter: results from the ATLANTA I study. J Am Heart Assoc. 2013;2(6):e000344. | ||
Phillips CM, Perry IJ. Lipoprotein particle subclass profiles among metabolically healthy and unhealthy obese and non-obese adults: does size matter? Atherosclerosis. 2015;242(2):399–406. | ||
Nishikura T, Koba S, Yokota Y, et al. Elevated small dense low-density lipoprotein cholesterol as a predictor for future cardiovascular events in patients with stable coronary artery disease. J Atheroscler Thromb. 2014;21(8):755–767. | ||
Hoogeveen RC, Gaubatz JW, Sun W, et al. Small dense low-density lipoprotein-cholesterol concentrations predict risk for coronary heart disease: the Atherosclerosis Risk In Communities (ARIC) study. Arterioscler Thromb Vasc Biol. 2014;34(5):1069–1077. | ||
Rizzo M, Berneis K. Low-density lipoprotein size and cardiovascular risk assessment. QJM. 2006;99(1):1–14. | ||
Austin MA, Breslow JL, Hennekens CH, Buring JE, Willett WC, Krauss RM. Low-density lipoprotein subclass patterns and risk of myocardial infarction. JAMA. 1988;260(13):1917–1921. | ||
Shimada A, Kimura H, Oida K, et al. Serum CETP status is independently associated with reduction rates in LDL-C in pitavastatin-treated diabetic patients and possible involvement of LXR in its association. Lipids Health Dis. 2016;15(1):57. | ||
Leança CC, Nunes VS, Panzoldo NB, et al. Metabolism of plasma cholesterol and lipoprotein parameters are related to a higher degree of insulin sensitivity in high HDL-C healthy normal weight subjects. Cardiovasc Diabetol. 2013;12:173. | ||
Mitsche MA, Packer LE, Brown JW, Jiang ZG, Small DM, McKnight CJ. Surface tensiometry of apolipoprotein B domains at lipid interfaces suggests a new model for the initial steps in triglyceride-rich lipoprotein assembly. J Biol Chem. 2014;289(13):9000–9012. | ||
Cabrera M, Sánchez-Chaparro MA, Valdivielso P, et al; ICARIA (Ibermutuamur CArdiovascular RIsk Assessment) Study Group. Prevalence of atherogenic dyslipidemia: association with risk factors and cardiovascular risk in Spanish working population. “ICARIA” Study. Atherosclerosis. 2014;235(2):562–569. | ||
Nordestgaard BG, Benn M, Schnohr P, Tybjaerg-Hansen A. Nonfasting triglycerides and risk of myocardial infarction, ischemic heart disease, and death in men and women. JAMA. 2007;298(3):299–308. | ||
Austin MA, King MC, Vranizan KM, Krauss RM. Atherogenic lipoprotein phenotype. A proposed genetic marker for coronary heart disease risk. Circulation. 1990;82(2):495–506. | ||
Arca M, Montali A, Valiante S, et al. Usefulness of atherogenic dyslipidemia for predicting cardiovascular risk in patients with angiographically defined coronary artery disease. Am J Cardiol. 2007; 100(10):1511–1516. | ||
Wong ND, Zhao Y, Patel R, et al. Cardiovascular risk factor targets and cardiovascular disease event risk in diabetes: a pooling project of the Atherosclerosis Risk in Communities Study, Multi-Ethnic Study of Atherosclerosis, and Jackson Heart Study. Diabetes Care. 2016;39(5):668–676. | ||
Alexopoulos D, Anastasiou-Nana M, Elisaf MS, et al; CHALLENGE Investigators. A contemporary cross-sectional study on dyslipidemia management, cardiovascular risk status, and patients’ quality of life in Greece: the CHALLENGE Study. Int J Cardiol. 2016;217:183–189. | ||
Aguiar C, Alegria E, Bonadonna RC, et al. A review of the evidence on reducing macrovascular risk in patients with atherogenic dyslipidaemia: a report from an expert consensus meeting on the role of fenofibrate-statin combination therapy. Atheroscler Suppl. 2015;19:1–12. | ||
Shen H, Xu L, Lu J, et al. Correlation between small dense low-density lipoprotein cholesterol and carotid artery intima-media thickness in a healthy Chinese population. Lipids Health Dis. 2015;14:137. | ||
Grundy SM. Atherogenic dyslipidemia: lipoprotein abnormalities and implications for therapy. Am J Cardiol. 1995;75(6):45B–52B. | ||
Williams PT, Zhao XQ, Marcovina SM, Otvos JD, Brown BG, Krauss RM. Comparison of four methods of analysis of lipoprotein particle subfractions for their association with angiographic progression of coronary artery disease. Atherosclerosis. 2014;233(2):713–720. | ||
Decewicz DJ, Neatrour DM, Burke A, et al. Effects of cardiovascular lifestyle change on lipoprotein subclass profiles defined by nuclear magnetic resonance spectroscopy. Lipids Health Dis. 2009;8:26. | ||
Otvos JD, Jeyarajah EJ, Bennett DW, Krauss RM. Development of a proton nuclear magnetic resonance spectroscopic method for determining plasma lipoprotein concentrations and subspecies distributions from a single, rapid measurement. Clin Chem. 1992;38(9):1632–1638. | ||
Hoefner DM, Hodel SD, O’Brien JF, et al. Development of a rapid, quantitative method for LDL subfractionation with use of the quantimetrix lipoprint LDL system. Clin Chem. 2001;47(2):266–274. | ||
Kikkawa K, Nakajima K, Shimomura Y, et al. Small dense LDL cholesterol measured by homogeneous assay in Japanese healthy controls, metabolic syndrome and diabetes patients with or without a fatty liver. Clin Chim Acta. 2015;438:70–79. | ||
Albers JJ, Kennedy H, Marcovina SM. Evaluation of a new homogenous method for detection of small dense LDL cholesterol: comparison with the LDL cholesterol profile obtained by density gradient ultracentrifugation. Clin Chim Acta. 2011;412(7–8):556–561. | ||
Ito Y, Fujimura M, Ohta M, Hirano T. Development of a homogeneous assay for measurement of small dense LDL cholesterol. Clin Chem. 2011;57(1):57–65. | ||
Hirano T, Ito Y, Saegusa H, Yoshino G. A novel and simple method for quantification of small, dense LDL. J Lipid Res. 2003;44(11):2193–2201. | ||
Writing C, Smith SC Jr, Collins A, et al. Our time: a call to save preventable death from cardiovascular disease (heart disease and stroke). Glob Heart. 2012;7:297–305. | ||
Jankovic N, Geelen A, Streppel MT, et al. WHO guidelines for a healthy diet and mortality from cardiovascular disease in European and American elderly: the CHANCES project. Am J Clin Nutr. 2015;102(4):745–756. | ||
Tani S, Matsumoto M, Nagao K, Hirayama A. Association of triglyceride-rich lipoproteins-related markers and low-density lipoprotein heterogeneity with cardiovascular risk: effectiveness of polyacrylamide-gel electrophoresis as a method of determining low-density lipoprotein particle size. J Cardiol. 2014;63(1):60–68. | ||
Arai H, Kokubo Y, Watanabe M, et al. Small dense low-density lipoproteins cholesterol can predict incident cardiovascular disease in an urban Japanese cohort: the Suita Study. J Atheroscler Thromb. 2013; 20(2):195–203. | ||
Bansal S, Buring JE, Rifai N, Mora S, Sacks FM, Ridker PM. Fasting compared with non-fasting triglycerides and risk of cardiovascular events in women. J Am Med Assoc. 2007;298(3):309–316. | ||
González Santos P. Dislipemia aterogénica. Clín Invest Arterioscler. 2012;24(suppl 1):3–7. | ||
Chapman MJ, Ginsberg HN, Amarenco P, et al; European Atherosclerosis Society Consensus Panel. Triglyceride-rich lipoproteins and high-density lipoprotein cholesterol in patients at high risk of cardiovascular disease: evidence and guidance for management. Eur Heart J. 2011;32(11):1345–1361. | ||
Ito MK. Long-chain omega-3 fatty acids, fibrates and niacin as therapeutic options in the treatment of hypertriglyceridemia: a review of the literature. Atherosclerosis. 2015;242(2):647–656. | ||
Tokuno A, Hirano T, Hayashi T, et al. The effects of statin and fibrate on lowering small dense LDL-cholesterol in hyperlipidemic patients with type 2 diabetes. J Atheroscler Thromb. 2007;14(3):128–132. | ||
PREDIMED-PLUS [homepage on the Internet]. Available from: http://predimedplus.com/. Accessed September 6, 2016. | ||
Horowitz GL, Altaie S, Boyd JC, et al. Defining, Establishing and Verifying Reference Intervals in the Clinical Laboratory; Approved Guideline-3rd Ed. CLSI Document C28-A3E. Wayne, PA: Clinical Laboratory Standards Institute; 2008. | ||
Cavalcante Lda S, da Silva EL. Application of a modified precipitation method for the measurement of small dense LDL-cholesterol (sd-LDL-C) in a population in Southern Brazil. Clin Chem Lab Med. 2012;50(9):1649–1656. |
 © 2017 The Author(s). This work is published and licensed by Dove Medical Press Limited. The full terms of this license are available at https://www.dovepress.com/terms.php and incorporate the Creative Commons Attribution - Non Commercial (unported, v3.0) License.
By accessing the work you hereby accept the Terms. Non-commercial uses of the work are permitted without any further permission from Dove Medical Press Limited, provided the work is properly attributed. For permission for commercial use of this work, please see paragraphs 4.2 and 5 of our Terms.
© 2017 The Author(s). This work is published and licensed by Dove Medical Press Limited. The full terms of this license are available at https://www.dovepress.com/terms.php and incorporate the Creative Commons Attribution - Non Commercial (unported, v3.0) License.
By accessing the work you hereby accept the Terms. Non-commercial uses of the work are permitted without any further permission from Dove Medical Press Limited, provided the work is properly attributed. For permission for commercial use of this work, please see paragraphs 4.2 and 5 of our Terms.