Back to Journals » International Journal of Nanomedicine » Volume 19
Reduced Graphene Oxide Fibers Combined with Electrical Stimulation Promote Peripheral Nerve Regeneration
Authors Zhao Y, Liu Y, Lu C, Sun D, Kang S, Wang X, Lu L
Received 10 November 2023
Accepted for publication 29 February 2024
Published 7 March 2024 Volume 2024:19 Pages 2341—2357
DOI https://doi.org/10.2147/IJN.S449160
Checked for plagiarism Yes
Review by Single anonymous peer review
Peer reviewer comments 2
Editor who approved publication: Professor Eng San Thian
Yuanyuan Zhao,1 Yang Liu,1 Cheng Lu,1 Daokuan Sun,2 Shiqi Kang,1 Xin Wang,2,* Laijin Lu1,*
1Department of Hand and Podiatric Surgery, Orthopedics Center, The First Hospital of Jilin University, Changchun, Jilin, People’s Republic of China; 2School of Materials Science and Engineering, Jilin University, Changchun, Jilin, People’s Republic of China
*These authors contributed equally to this work
Correspondence: Laijin Lu, Department of Hand and Podiatric Surgery, Orthopedics Center, The First Hospital of Jilin University, Changchun, Jilin, People’s Republic of China, Tel +86-13756661203, Fax +86 431 84808391, Email [email protected] Xin Wang, School of Materials Science and Engineering, Jilin University, Changchun, Jilin, People’s Republic of China, Tel +86-18 626 655 395, Fax +86 431 84 808 391, Email [email protected]
Background: The treatment of long-gap peripheral nerve injury (PNI) is still a substantial clinical problem. Graphene-based scaffolds possess extracellular matrix (ECM) characteristic and can conduct electrical signals, therefore have been investigated for repairing PNI. Combined with electrical stimulation (ES), a well performance should be expected. We aimed to determine the effects of reduced graphene oxide fibers (rGOFs) combined with ES on PNI repair in vivo.
Methods: rGOFs were prepared by one-step dimensionally confined hydrothermal strategy (DCH). Surface characteristics, chemical compositions, electrical and mechanical properties of the samples were characterized. The biocompatibility of the rGOFs were systematically explored both in vitro and in vivo. Total of 54 Sprague-Dawley (SD) rats were randomized into 6 experimental groups: a silicone conduit (S), S+ES, S+rGOFs-filled conduit (SGC), SGC+ES, nerve autograft, and sham groups for a 10-mm sciatic defect. Functional and histological recovery of the regenerated sciatic nerve at 12 weeks after surgery in each group of SD rats were evaluated.
Results: rGOFs exhibited aligned micro- and nano-channels with excellent mechanical and electrical properties. They are biocompatible in vitro and in vivo. All 6 groups exhibited PNI repair outcomes in view of neurological and morphological recovery. The SGC+ES group achieved similar therapeutic effects as nerve autograft group (P > 0.05), significantly outperformed other treatment groups. Immunohistochemical analysis showed that the expression of proteins related to axonal regeneration and angiogenesis were relatively higher in the SGC+ES.
Conclusion: The rGOFs had good biocompatibility combined with excellent electrical and mechanical properties. Combined with ES, the rGOFs provided superior motor nerve recovery for a 10-mm nerve gap in a murine acute transection injury model, indicating its excellent repairing ability. That the similar therapeutic effects as autologous nerve transplantation make us believe this method is a promising way to treat peripheral nerve defects, which is expected to guide clinical practice in the future.
Keywords: peripheral nerve defects, sciatic nerve injury, functional recovery, tissue engineering, conductive materials
Introduction
PNI is a common and high-incidence disease in clinical practice that is mostly caused by accidental trauma and local lesions.1,2 The lack of timely and effective treatment often leads to long-term sensory and motor dysfunction in many patients, especially those with long-gap peripheral nerve defects, thus seriously affecting their quality of life and imposing a heavy burden on social services. Autologous nerve transplantation is the most widely used neurosurgical approach, but encounters such problems as a shortage of donors, difficulty in adapting to the size of the nerve, and secondary damage to the donor area.3,4 Nerve guide conduits (NGCs) have received widespread attention in recent years and some of these conduits have been approved by the Food and Drug Administration (FDA) and were applied to clinical patients, even though a poor recovery of the sensory or motor function in comparison with nerve autografts still remained.5–10 As the first generation of implanted conduit, silicon tube has many advantages such as biocompatible, low cost, processability, inert and flexible characteristics. However, lacking of the ability of transmission of electrical stimuli and non-degradability are its obvious intrinsic disadvantages.11,12 Comparatively, conductive materials revealed promising capability to stimulate cellular activity with or without external ES, therefore, developing a new generation of stimulus-responsive scaffolds have received great attention in modulating neuron cell functions and promoting peripheral nerve regeneration.13
For in vivo in-situ regeneration, an ideal NGCs is above all to protect, stimulate neurite outgrowth, accelerate growth rate of neurons, and correctly guide axon regeneration from the proximal injured nerve into the distal nerve stump. The recovery of bioelectric signals is crucial for peripheral nerve regeneration, however, employing electrical fields in tissue engineering and regenerative medicine have not been taken seriously until recently.12 Graphene-based scaffolds (GBSs) assembled by building blocks such as graphene and its derivatives, graphene oxide (GO) and reduced GO (rGO) have been demonstrated to be favorable for peripheral nerve regeneration.14–16 They can promote the recovery of electrical nerve signals owing to their impressive conductivity and electrical stability.17 In particular, rGO, a two-dimensional nanomaterial comprising single-layer sheets of sp2 and sp3 hybridized carbons and partial content of oxygen-containing groups, has greater electrical conductivity and better thermal stability than GO, antibacterial but less cytotoxic even at higher concentrations.17 Recent studies have shown that rGO-based scaffolds could not only promote the behavior of the nerve cells, but also influence the neurogenic differentiation of various stem cells (eg, mesenchymal stem cells and neural stem cells).18–24 However, the combination of rGO-based scaffolds and ES as a strategy to repair PNI remains in its infancy since related mechanism by which ES and graphene-based scaffolds enhance nerve regeneration need to be clarified and the stimulation mode and parameters of ES have not been standardized. Furthermore, most of the reports in view of combination of rGO-based scaffolds and ES were correlated with rGO-coated/filled composites, which have been fabricated into forms of hydrogel,25 membrane,26 or conduit,22 normally possessing relatively lower electrical conductivity compared to pure rGO. Therefore, exploration regarding ES through rGO-based scaffold with high electrical conductivity for PNI repair might be a significant supplement for understanding the importance of balance between conductivity and ES for a proper neural regeneration. Meanwhile, considering the possibility of misdirection of regenerated axons by ES, a scaffold with well aligned architecture along the direction of axon growth is of most importance, in this present study, we chose reduced graphene oxide fibers (rGOFs) for study. rGOFs is a macroscopic carbonaceous fiber composed of reduced graphene oxide sheets which possess superior mechanical properties.27 Cytocompatibility of rGOFs prepared by one-step dimensionally confined hydrothermal (DCH) strategy was evaluated by human embryonic kidney 293 cell line (HEK-293), human neuroblastoma cell line (SH-SY5Y), rat embryonic neural progenitor cells (ENPCs), and rat trigeminal sensory neurons.28–30 Serrano and Guo et al in their respective in vitro experiments demonstrated that the rGOFs have the ability to support stem cell growth and regulate the cell differentiation, indicating their potential as a scaffold for neural regeneration.31,32
The rGOFs with oriented micro- and nano-channel structures were prepared using the DCH method,30 aiming to assess the effect of rGOFs combined with ES on peripheral nerve regeneration in a rat model of a 10 mm sciatic nerve defect. Even though an oriented structure has demonstrated to effectively affect polarization of macrophages and reduced expression of inflammatory factors, and has a significant impact on the efficacy of neural scaffolds,33 to the best of our knowledge, GBSs having such high electrical conductivity and oriented micro- and nano-topography that was combined with ES for long-gap PNI have not yet been reported. Therefore, this study performed in vivo assessment of nerve regeneration with the aid of silicon rGOFs-filled conduits combined with ES, exploring a promise alternative to nerve transplant therapy for fast regeneration and a desirable recovery effect.
Materials and Methods
Preparation and Characterization of rGOFs
Materials used for synthesis of GO suspensions and rGOFs have been described previously, and a modified Hummers’ method was employed to synthesis GO (Supplementary Information). To prepare rGOFs, GO suspensions at a concentration of 8 mg mL−1 were injected into a glass pipeline with an inner diameter of 1.0 mm using a syringe. After sealing both ends of the pipeline, the reactor containing GO suspensions was heated to 200°C for 2 h in a convection furnace. Then, drying in an oven at 40°C for 12 h and cooling down to room temperature in a pipeline for ready of rGOFs. The structure and morphology of the as-prepared samples were characterized by X-ray diffraction (XRD, Bruker, D2 Phaser) with CuKα radiation (λ = 1.5418 Å) at a generator voltage of 30 kV and a current of 10 mA, Raman spectrometer (Renishaw-RM1000, Renishaw) with 532 nm laser excitation, Fourier transform infrared spectroscopy (FTIR, Perkin Elmer, Spectrum One B UK) over a range of 450–4000 cm−1 and resolution of 1 cm−1, field-emission scanning electron microscope (SEM, Hitachi, SU8100) under the electron accelerating voltage of 5 kV, and transmission electron microscope (TEM, JEM-2100F) under the electron accelerating voltage of 100 kV. Surface charges of GO and rGOFs were analyzed by ζ potential study (Zetasizer Nano ZS90, Malvern, UK). The contact angle of the rGOFs was measured on OCA 25 instrument after pressing rGOFs powder into a disc with a diameter of 6 mm. Electrical properties were tested on a CHI660E electrochemical workstation (5 fibers for measurement). Mechanical properties were measured at least 3 fibers using a tensile tester (Shimadzu AGS-X) at a strain rate of 1 mm/min with a gauge length of 10 mm.
Cytotoxicity and Organ Toxicity of rGOFs
The testing of rGOFs cytotoxicity in mammalian cells was carried out by evaluating SC viability on rGOFs. Briefly, RSC96 (the Type of Culture Collection of the Chinese Academy of Sciences, Shanghai, China) were cultured in Dulbecco’s modified Eagle medium (high glucose, DMEM, Sangon Biotech, Shanghai, China) supplemented with 10% fetal bovine serum (FBS; Clark, USA) and 1% penicillin/streptomycin (Sangon Biotech, Shanghai, China) at 37 °C in a humidified atmosphere containing 5% CO2. Preparation of culture media containing rGOFs extracts of different concentrations for usage of cell culture.34 The rGOFs extract was tested for biological compatibility by using the calcein/PI cell viability/cytotoxicity test kit (Cat# C2015L, Beyotime, China) (co-cultivation duration: 24 h) and the cell counting kit-8 (CCK8, Cat# C0038, Beyotime, China) assay (co-cultivation duration: 12 h, 24 h, 48 h, and 72 h). The organ toxicity of rGOFs was investigated in Sprague-Dawley (SD) rats. We randomly divided 27 rats into three groups 1) Silicone conduit group (denoted by “S”): A 14-mm-long silicone tube (outer diameter, 2 mm; inner diameter, 1.5 mm; Pureshi, Shanghai, China) was used to connected the two severed ends of the nerve, and there was an overlap of approximately 2 mm between the catheter and the nerve stumps at both ends for easy suturing. 2) S+rGOFs-filled conduit group (denoted by “SGC”): We arranged 20 10-mm-long rGOFs longitudinally into a silicone tube which connect the broken nerve by using the same method of suturing with S group. 3) Autologous nerve transplantation group (denoted by “Auto”): We swapped the head and tail of the severed nerve segment, and sewed both ends together at the two ends of the severed nerve; and removed their visceral organs at 4, 8, and 12 weeks after surgery. The in vivo safety of the materials was assessed through the haematoxylin and eosin (H&E) staining of various organs in rats. We took three rats from each group at each time point.
Animal Models
We used 54 adult male SD rats (Liaoning Changsheng, China) weighing 240–260 g (six to eight weeks old) in the experiments.35 The rats were placed in separate cages at room temperature (23–25°C), and were given sufficient food and water. All experimental designs and reports complied with the guidelines provided by “Animal Research: In vivo Experimental Reporting”.36 The experimental scheme was approved by the Institutional Review Committee of the First Hospital of Jilin University (approval number: 20220739) on October 25, 2022.
After being in abrosia for 8 h, the rats were anesthetized with 2.5% isoflurane. They were then laid on their left side, and their right sciatic nerve was exposed through the intermuscular space between the gluteus superficialis muscle and the biceps femoris muscle, through a 3 cm skin incision starting from the sciatic tuberosity of the right thigh. We separated a 3-cm-long nerve segment and removed the 10-mm-long nerve segment in the middle. We then randomly divided the rats into six groups (n = 9). 1) Silicone conduit group (denoted by “S”): Surgical methods can be found in the Cytotoxicity and organic toxicity of rGOFs section. 2) S + ES group (denoted by “S+ES”): The surgical procedure was the same as that for group S, and ES (1–3 mA, 20 Hz) was administered postoperatively once every other day for 1 h by using SDZ-IV Nerve and Muscle Stimulator (Hwato, Suzhou, China).37,38 Each mouse was given a total of 10 electrical stimuli, and the stimulation electrodes were located in the soft tissues on both sides of their nerve stumps. 3) S+rGOFs-filled conduit group (denoted by “SGC”): Surgical methods can be found in the Cytotoxicity and organic toxicity of rGOFs section. 4) SGC + ES group (denoted by “SGC +ES”): The surgical procedure was the same for S group, while the ES was applied in the same manner as to S+ES group. 5) Autologous nerve transplantation group (denoted by “Auto”): Surgical methods can be found in the Cytotoxicity and organic toxicity of rGOFs section. 6) Sham group (denoted by “Sham”): We fully separated the nerves and sutured the wound. The nerves were sutured by using 8–0 sutures (Golden Ring Medicine, China), and the intermuscular spaces were sutured by using 6–0 absorbable sutures (Golden Ring Medicine, China). The skin incisions were sutured by using 4–0 threads (Escon, China). The wounds of all rats healed well after surgery, and no infection occurred. They were euthanized by using excessive anesthesia at 12 weeks after surgery (Figure S1).
Detecting the Recovery of Neurological Function
Gait Analysis
We assessed motor function by using the sciatic functional index (SFI). This was measured based on the footprints of the rats through walking trajectory tests that were conducted 12 weeks after surgery. We applied black ink to the hind paws of the rats and placed them on a strip covered with white paper (15 × 100 cm). Three parameters were obtained from their footprints: print length (PL: maximum distance from toe to heel), intermediate toe width (IT: distance from the second to the fourth toe), and toe width (TS: distance from the first to the fifth toe). SFI was calculated from the normal (N) and experimental (E) hind limbs, according to the following formula:
SFI= (−38.3 × (EPL-NPL)/NPL) + (13.3 × (EIT-NIT)/NIT) + (109.5 × (ETS-NTS)/NTS) - 8.8.
Where the SFI value ranged from −100 to 0, with −100 indicating complete neurological dysfunction and 0 indicating normal function.
Gastrocnemius Assessment
The bilateral gastrocnemius muscles of the rats were cut off, wiped off surface moisture, and weighed. We calculated the wet weight ratio by dividing the wet weight of the muscle on the injured side by the wet weight of the muscle on the normal side. The specimen was transected (thickness, 3 μm) after fixation, dehydration, and paraffin embedding. We then performed Masson trichrome staining. The images were captured by using an optical microscope (BX51, Olympus, Japan).39
Neuroelectrophysiology Assessment
An electric stimulator (electric pulse: 5 mA; duration: 0.1 ms; frequency: 1 Hz; Keypoint Neurotics Instruments, Alpine BioMed APS) was placed at both ends of the anastomotic nerve, with a distance of 10 mm between the stimulation points. The compound muscle action potentials (CMAPs) of the proximal and distal nerves as well as their latencies were recorded, and the nerve conduction velocity (NCV) was calculated according to the difference in latency.40
Histological Detection of Nerve Regeneration
H&E Staining
The regenerated nerves were completely cut off, soaked in 4% paraformaldehyde for 48 h, and embedded in paraffin. The cross-section of the specimen used for H&E staining was 3 μm.
Immunofluorescence Analysis
The regenerated nerves were fixed with 4% paraformaldehyde, dehydrated and embedded, and then sectioned (4 μm in thickness). After dewaxing, the slides were repaired by using microwaves in an EDTA (GPB1837, GenePool) buffer through boiling for 10 min. The slides were then incubated with 5% normal goat blocking serum at room temperature for 20 min. Once the blocking serum had been discarded, the slides were incubated overnight in a wet box at 4°C for one antibody, rabbit anti-S100 beta (1:250; Cat# ab52642, Abcam, Cambridge, UK), and mouse anti-neurofilament 200 (NF200; 1:250; Cat# N5389, Sigma, St. Louis, MO, USA). The slides were covered with secondary antibodies, goat anti-rabbit IgG H&L FITC (1:3000; Cat# ab6717, Abcam), and goat anti-mouse IgG H&L (Alexa Fluor®594) (1:3000; Cat# ab150116, Abcam), and were incubated at room temperature in the dark for 60 min. The DAPI (Cat# C1006, Beyotime, China) staining solution was then added to them dropwise, following which they were incubated at room temperature in the dark for 10 min. Finally, images were randomly obtained using a fluorescence microscope (Nikon Eclipse Ti-SR, Nikon, Japan).
Toluidine Blue Staining
The nerve specimens were fixed with 3% glutaraldehyde and then placed in 1% cesium tetroxide for 2 h. After that, they were dehydrated and embedded in an epoxy resin medium. The cross-section of the specimens was stained with 1% toluidine blue stain and their images were randomly obtained under an optical microscope (BX51, Olympus, Japan) by using CellSens Dimension software (Olympus, Japan).
Transmission Electron Microscopy
For transmission electron microscopic (TEM) studies, the regenerated nerves were fixed with 2.5% glutaraldehyde for 48 h, stained with 1% ozone acid (Electronic Microscope Science Co., Hatfield, Pennsylvania, USA), and then dehydrated with acetone by a gradient concentration. We then embedded the sample into epoxy resin and cut it into ultra-thin slices, each with a thickness of 70 nm. The slices were stained with uranyl acetate (Electron Microscope China) and lead citrate (Electron Microscope China), and then imaged by using a transmission electron microscope (JEOL, Japan). Image J software was used to determine the thickness of the regenerated myelin sheath, inner and outer diameters of the regenerated axons to calculate the G ratio, and the area of the regenerated axons.41
Immunohistochemistry Analysis
The cut sciatic nerves were fixed with 4% paraformaldehyde solution, embedded into paraffin, and cut crosswise into 4-µm-thick tissue slices. Following the inactivation of the endogenous enzymes and antigen repair, the sections of tissue were respectively stained with antibrain-BDNF (derived neurotrophic factor 1:100; Cat# ab108319, Abcam), TrkB (tropomyosin receptor kinase B 1:200; Cat# ab187041, Abcam), GAP-43 (growth-associated protein-43; 1:100; Cat# ab16053, Abcam), TGF-β (transforming growth factor-β 1:200; Cat# ab25121, Abcam), VEGF (vascular endothelial growth factor 1:100; Cat# ab46154, Abcam) and α-SMA (α-smooth muscle actin 1:100; Cat# 19,245, Cell Signaling Technology, Massachusetts, USA) incubated overnight at 4°C. The goat anti-rabbit antibody labeled with horseradish peroxidase was then used as the second antibody. A peroxidase substrate solution of 3.3-diaminoneneneba benzidine tetrahydrochloride (DAB; Zhongshan Jinqiao Biotechnology, China) was visualized for staining. Images of the slices were captured under a microscope and their average optical density was analyzed by using Image J software.
Statistical Analysis
No sample was excluded from the study. The evaluation was conducted by using a blind method. SPSS22.0 software (IBM, Armonk, NY, USA) was used for statistical analysis, the normality of the data was tested by the Shapiro–Wilk test and all data were consistent with the normal distribution. If multiple sets of variables were consistent with homogeneity of variance, variables were compared by one-way analysis of variance (ANOVA) and Bonferroni’s posthoc test. If multiple sets of variables were not consistent with homogeneity of variance, we applied Brown–Forsythe (B) analysis and the Dunnett T3 posthoc test. The difference was found to be statistically significant (P < 0.05). No sample was excluded from the study.
Results
Characterization of rGOFs
The structure of graphite, GO, and rGOFs were investigated by XRD. For graphite, a main diffraction peak at 26.4° was observed in Figure 1A, showing a perfectly crystalline with an interlayer spacing of 0.34 nm (PDF file No.04–007-2081). XRD pattern of GO sheets showed peak at 10.8° with an interlayer spacing of 0.84 nm and the increased interlayer spacing was ascribed to the oxidation of graphite different oxygen-containing groups present on the basal planes and at the edges of GO sheets, which can ensure their a satisfactory cytocompatibility.42 After reduction at 200°C for 2 h, the sharp 10.8° peak disappeared. However, a new broad diffraction peak at around 19.8° corresponding to the interlayer spacing of 0.37 nm for rGOFs appeared. The decreasing of interlayer spacing compared to GO was due to the desorption of oxygen-containing functional groups and H2O molecules in rGOFs, while the peak broadening indicated a smaller sheet size and relative short range order hierarchical structure existed in rGOFs. To characterize their chemical components, Raman spectroscopy and FTIR spectroscopy were performed. From Figure 1B, the typical Raman spectra of the graphite, GO sheets, and rGOFs samples, two peaks can be seen, namely a D band, related to the presence of disorder and defects in the samples, and a G band, corresponding to the in-plane motion of the carbon atoms. The D/G intensity ratio (ID/IG) was usually used to evaluate the level of disorder in graphene and its derivatives. The value of ID/IG increased dramatically from the graphite powder (0.23) to GO (0.84), indicating the increased density of crystal defects after oxidized treatment of graphite; while the rGOFs have the highest ID/IG value (1.28), arising from the removal of oxygen-containing groups, which created more structural defects such as vacancies.43 The surface functional group analysis was further observed by FTIR spectra, as shown in Figure 1C. After thermal treatment, oxygen-containing groups such as C-O-C stretching, C=O peak in carboxylic acid and carbonyl moieties, and -OH groups still remained in the rGOFs, which can provide them certain hydrophilicity. The morphology and topography of rGOFs were detected by SEM and the images showed an aligned channel-shaped appearance (Figure 1D). From the enlarged image, the rGO nanoshees with wrinkles on the surface can be clearly seen. In addition, the ultrathin sheets of GO and rGO appeared to be transparent, as indicated in Figure S2 and by red arrows in Figure 1D, respectively, suggesting their single or few-layered structural character. The surface negative charge in GO sheets (Figure S3) ensured their well dispersion to assembly into a 3D architecture of rGOFs. The hydrophilicity of rGOFs was evaluated by measurements of the angle of contact angles of water on the rGOFs, and the results were given in Figure 1E. The contact angle is smaller than 90°, indicating its plausible surface hydrophilicity for supporting cell adhesion, proliferation, and differentiation. The mechanical and electrical properties of the rGOFs were also characterized and the results were shown in Figure 1F and G, respectively. Compared to our previous study, the tensile strength (192.6 MPa) and stiffness (6.7 GPa) were similar with that of the rGOFs (where, s indicated the lateral size range of the GO sheets, < 1 μm),27 while the electrical conductivity (329.4 S·m−1) of our as-prepared rGOFs samples was higher than that of the rGOFs (237.28 S·m−1), which corresponded to the GO sheets with lateral size around 2.14 μm, as was given in Figure S4.
 |
Figure 1 Characterization of rGOFs. (A) XRD patterns of graphite, GO, and rGOFs. (B) Raman spectroscopy of graphite, GO, and rGOFs. (C) FTIR spectroscopy of GO and rGOFs. (D) SEM images of rGOFs with different magnifications. (E) Water contact angle of rGOFs. (F) Stress-strain curve of rGOFs from uniaxial test. (G) Circulating voltammetry curve of rGOFs. |
Cytotoxicity and Organ Toxicity of rGOFs
The results of the calcein/PI cell viability/cytotoxicity assay kit (Figure 2A and B) showed that when the RSC96 cells were co-cultured with different concentrations of the rGOFs extracts for 24 h present, no significant cell death occurred. The results of the CCK-8 (Figure 2C) showed that cultivate with different concentrations of extract at different time lengths (12h, 24h,48h, and 72h) had no significant influence on cell viability (P > 0.05). The results of organ H&E staining (Figure 2D: 12 weeks; Figure S5: 4 weeks and 8 weeks) showed that the use of silicone tubes, silicone tubes filled with rGOFs, and autograft respectively to bridge the defective nerve had no systematic organ damages. Therefore, our study demonstrated that the rGOFs could be safely explored for their application in repairing PNI.
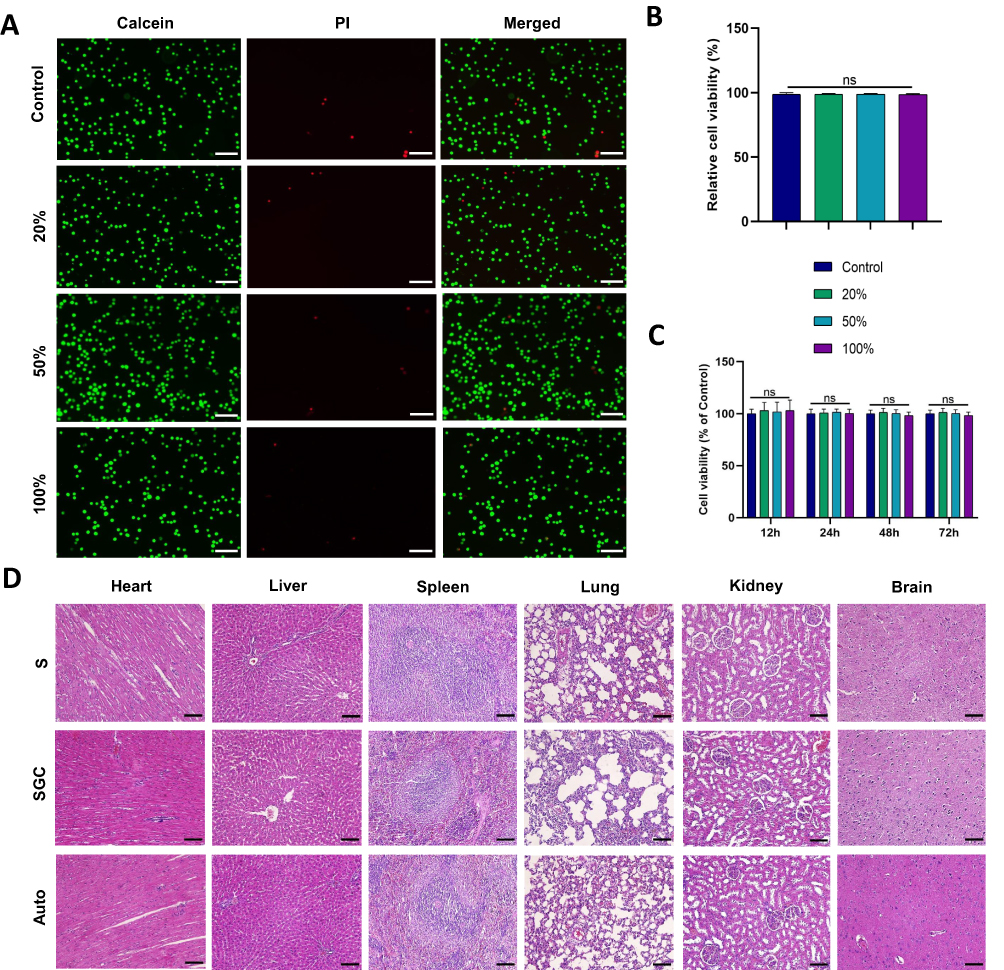 |
Figure 2 Biocompatibility of rGOFs. (A) The RSC96 cells were co-cultured with rGOF extracts of different concentrations for 24 h to obtain the results of the calcein/PI cell viability/cytotoxicity assay kit (green: live cells, red: dead cells). Scale bar: 100 μm. (B) The results of live cell count obtained by the calcein/PI cell viability/cytotoxicity assay kit and their statistical analysis. The date is shown as the mean ± SD (n = 6) (C) The number of live cells was counted and statistically analyzed when the RSC96 cells were co-cultured with rGOFs extracts of different concentrations for different time length by using cell counting kit-8. The date is shown as the mean ± SD (n = 6) (D) H&E staining of various organs of rats with different types of defective neural connections at 12 weeks after surgery. Scale bar: 50 μm. n = 3; ns: no statistical difference among the groups. |
Functional Evaluation of the Regenerated Sciatic Nerve at 12 Weeks After Surgery
Macroscopic Appearance of Regenerative Nerve
Macroscopic images of the recovered nerve were captured 12 weeks after surgery. No obvious neuroma formation was observed locally in each group. And neurons of the samples in SGC and group SGC+ES were coarser than those of S and group S+ES groups (Figure 3A).
 |
Figure 3 Functional evaluation of the regenerated nerves at 12 weeks after surgery. (A) The macroscopic appearance of each experimental group, with the white asterisks indicating the proximal ends and the white arrows indicating the distal ends. (B) Representative photographs of rat footprints of each groups. (C) Statistical analysis of the SFI of each group. (D) Macroscopic appearance of the isolated bilateral gastrocnemius muscles in each group; right side is the test side and the left side is the healthy side. (E) Wet weight ratio of the gastrocnemius muscles of each group. (F) Representative Masson trichrome staining microscopic images of transverse sections of gastrocnemius muscles in each group. Scale bar: 50 μm. (G) Percentage of fiber area in the gastrocnemius muscles. (H) Representative CMAP recordings on the injured side of the rats at distal nerve come from surgical limbs (Scale bar: 20 mV, 5 ms). (I) The peak amplitude at the proximal nerve, (J) at the distal nerve, and (K) Latency of CMAPs. (L) NCV analysis of each group. The data are shown as the mean ± SD (n = 6). $P < 0.05, $$P < 0.01, $$$P < 0.001 vs Group SGC; *P < 0.05, **P < 0.01, ***P < 0.001 vs Group SGC+ES; #P < 0.05, ##P < 0.01, ###P < 0.001 vs group Auto; &P < 0.05, &&P < 0.01, &&&P< 0.001 vs group Sham (one-way analysis of variance, followed by Bonferroni’s posthoc test). Abbreviations: SFI, sciatic functional index; CMAP, compound muscle action potential; NCV, nerve conduction velocity. |
Sciatic Functional Index
The SFI reflects the recovery of motor function. The measurements from the walking track analysis shown in Figure 3B indicated comparable values for the SGC+ES and Auto (−56.97 ± 4.89 vs −61.76 ± 3.88, P > 0.05) groups, both of which were significantly higher than S+ES (−76.07 ± 3.63) and S (−80.68 ± 3.62) groups at 12 weeks after surgery. There was no statistical difference between the SGC (−67.58 ± 4.33) and autograft (P > 0.05) groups; however, the SFI value of the SGC +ES group was higher than that of the SGC group (P=0.004). There was also no statistical difference between S and S+ES groups (P > 0.05) (Figure 3C). These results proved that motor function was restored in rats in both SGC+ES and SGC groups to a similar extent to those in Auto group.
Gastrocnemius Assessment
After nerve injury, the target muscle loses innervation and lacks contractile function, where this leads to muscular atrophy. Therefore, muscle recovery can be employed to assess nerve function. Figure 3D showed that except for rats in the Sham group, those in all other groups had smaller muscles on the experimental side than on the healthy side. The wet weight ratio of the gastrocnemius muscles of rats in groups SGC+ES (64.45 ± 6.60) and Auto (67.91 ± 9.64) recovered to similar extent (P > 0.05). The recovery of rats in groups S (37.32 ± 5.39) and S+ES (46.20 ± 4.25) were similar (P=0.362), relatively lower than those of rats in the other groups (P< 0.05) (Figure 3E). There was also no statistical difference between SGC+ES (68.93 ± 2.76) and Auto (70.07 ± 2.86) groups in the area percentage of gastrocnemius muscle fibers (Figure 3F and G) (P > 0.05), and the area percentage of gastrocnemius muscle fibers of the SGC+ES and SGC (63.65 ± 4.27) groups also were higher than the S and S+ES groups (P < 0.05), while no significant statistical difference was noted between S (54.04 ± 4.02) and S+ES (56.88 ± 3.70) groups (P > 0.05). These results illustrated that the recovery of gastrocnemius muscle function in rats in SGC+ES group was similar to that in Auto group. Although the functions of the gastrocnemius muscle in the SGC+ES and SGC groups were similar, there was still a difference between the SGC and Auto groups.
Neuroelectrophysiology Assessment
The CMAP amplitudes of each group exhibited similar trends of recovery at both the proximal and the distal ends. The amplitude of CMAP of the Sham group was 52.02 ± 2.83 mV, and there were statistical differences in the amplitude of CMAP both the proximal and distal ends of the regenerated nerve between the Sham group and the other groups (P< 0.001). No statistical difference was noted in recovery as reflected by the amplitude of CMAP between the SGC+ES Auto groups at either end (P > 0.05), while the SGC and Auto groups exhibited similar recovery (P > 0.05). The CMAP amplitudes recovery of the rats in S and S+ES groups was similar (P > 0.05), as shown in Figure 3H, I and J. The latencies of all groups were longer than that of the Sham group (0.88 ± 0.02 s). There was no statistical difference among the SGC group (1.59 ± 0.09 s), the SGC+ES (1.35 ± 0.06 s) and Auto (1.36 ± 0.09 s) groups (P > 0.05), which were significantly higher than both the S and S+ES groups (Figure 3K). The SGC+ES group, SGC group, and Auto group achieved similar recovery in terms of the NCV, but the effect in none of them was as good as that of the Sham group (79.28 ± 1.81 m/s). There was no statistical difference in the NCV between the S and S+ES groups, as shown in Figure 3L. This shows that the results of neurophysiological detection of the Auto group, SGC+ES group, and SGC group were similar, and were superior to those of the S and S+ES groups.
Histological Detection of Nerve Regeneration at 12 Weeks After Surgery
H&E Staining and Immunofluorescence Analysis for the Regenerated Nerves
The H&E staining of transverse sections of the regenerated nerves in each group is shown in Figure 4A, from which it is clear that the recovery of rats in the SGC+ES group was similar to that of those in the Auto group. The NF200/S100 double-immunofluorescent staining on the transverse sections of the regenerated nerves in each group is shown in Figure 4B–D. The ratios of NF200- and S100-positive areas was significantly higher in the SGC+ES group and Auto groups than in the other groups. The ratios of NF200- and S100-positive areas in the SGC+ES group were similar to those in the Auto group (P > 0.05), while the ratio of the NF200-positive area in the SGC group was similar to those in the SGC+ES (P = 0.123) and Auto groups (P = 0.29). The ratio of S100-positive areas in the SGC group was similar to that in the Auto group (P = 0.34), but lower than SGC +ES group (P = 0.049). The results showed that the levels of expression of NF200 and S100 were similar in the SGC+ES and Auto groups during the regeneration process, while those of NF200 in the SGC group were similar to those in the SGC +ES group and Auto group. The levels of expression of S100 were lower than those in the SGC+ES group but the same as those in the Auto group.
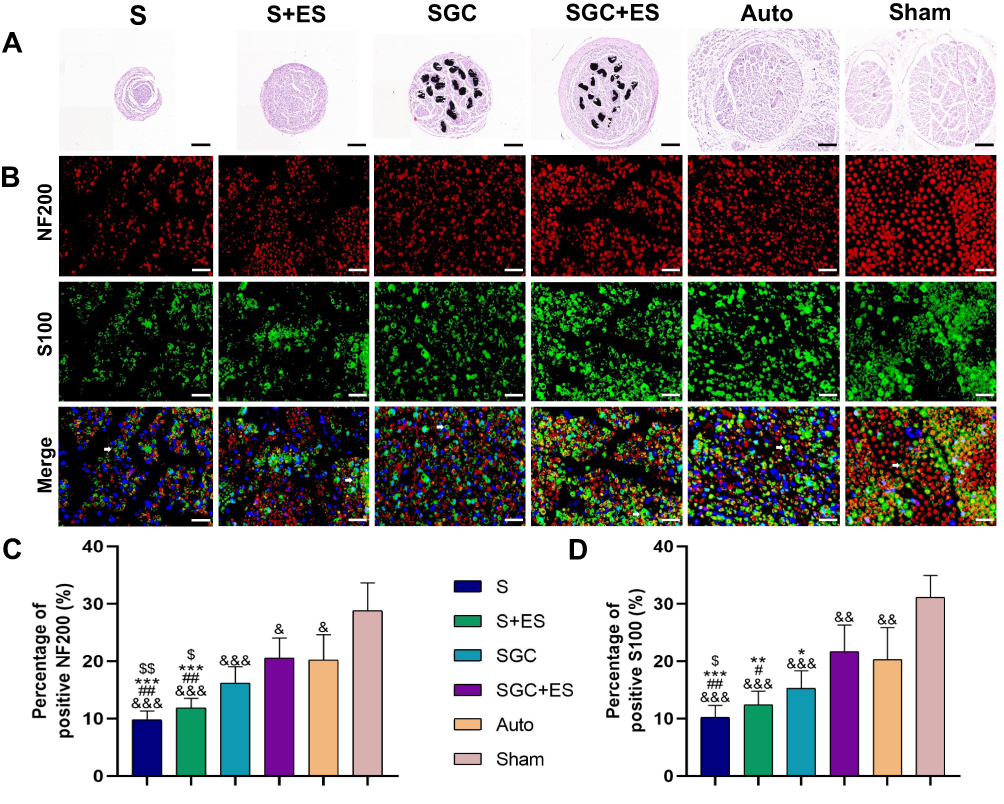 |
Figure 4 H&E staining and immunofluorescence analysis of the regenerated nerves at 12 weeks after surgery. (A) H&E staining of the transverse sections of regenerated nerves for each group of nerves. Scale bar: 200 μm. (B) Immunofluoresence staining results of NF200 (red, Alexa Fluor®594 staining)/S100 (green, FITC staining) of the cross-section of the regenerated nerve (white arrows). DAPI staining showing a blue nucleus. Scale bar: 25 μm. (C and D) Quantitative results of the positive area percentage of NF200 and S100. The data are shown as the mean ± SD (n = 3). $P < 0.05, $$P < 0.01 vs Group SGC; *P < 0.05, **P < 0.01, ***P < 0.001 vs group SGC+ES; #P < 0.05, ##P < 0.01 vs group Auto; &&P < 0.01, &&&P< 0.001 vs group Sham (Brown–Forsythe (B) analysis of variance, followed by the Dunnett T3 posthoc test). Abbreviations: H&E, hematoxylin and eosin; NF200, neurofilament 200; DAPI, 4′,6-diamidino-2-phenylindole. |
Myelinated Axon Assessment
The toluidine blue staining (Figure 5A) of the cross-section of the regenerated nerve in each group showed that the number of regenerated myelin sheaths in each group was smaller than that in the Sham group. Comparatively, the SGC+ES group showed a significant increase in the number of regenerated myelin sheaths, while there was no statistical difference in the thickness and G-ratio of the regenerated myelin sheaths among the Auto group, SGC+ES group, and SGC group (P >0.05). However, the myelinated axonal areas of the SGC+ES and Auto groups were significantly higher than that of the SGC, S and S+ES groups (Figure 5B–E). The results implied that the Auto, SGC+ES, and SGC groups achieved similar effects in terms of the thickness of the myelin sheaths, while the SGC+ES group had a similar area of regenerated axons as the Sham group.
 |
Figure 5 Analysis of myelinated axons in the regenerated nerves at 12 weeks after surgery. (A) Toluidine blue staining of the transverse sections of each group of nerves Scale bar: 10 μm. (B) Transmission Electron Microscopy images of the myelin sheaths of regenerated nerve. Scale bars: 5 μm (up) and 1 μm (down). (C) Statistical analysis of the thickness of the regenerated myelin sheath. (D) Statistical analysis of the G-ratio of the regenerated myelinated axons. (E) Statistical analysis of the area of the regenerated axons. Data are shown as the mean ± SD (n = 3). %P < 0.05 vs group S+ES; $$P < 0.01 vs group SGC; ***P < 0.001 vs group SGC +ES; #P < 0.05, ##P < 0.01, ###P < 0.001 vs group Auto; &&P < 0.01, &&&P< 0.001 vs group Sham (C and E): Brow–Forsythe (B) analysis of variance, followed by the Dunnett T3 posthoc test; (D): one-way analysis of variance followed by Bonferroni’s posthoc test). |
Immunohistochemistry Analysis of Regenerative Nerve at 12 Weeks After Surgery
Typical immunohistochemical images of the samples stained with the anti-BDNF antibody, anti- TrkB antibody and anti-GAP-43 antibody of each regenerative nerve group labeling axon regeneration are shown in Figure 6A–C. There was no statistically significant difference in the average optical densities of the three proteins between the SGC+ES and Auto groups (P > 0.05). These results indicate that the levels of axon regeneration in the SGC+ES and the Auto groups during the regeneration of the sciatic nerve were similar, and were significantly stronger than those in the other groups (Figure 6D–F). Typical immunohistochemical images of the samples stained with the anti-TGF-β antibody, anti-VEGF antibody and anti-α-SMA antibody of each regenerative nerve group labeling angiogenesis are shown in Figures 7A–C. There was no statistically significant difference in the average optical densities of the three proteins between the SGC+ES and the Auto groups (P > 0.05). These results indicate that the levels of angiogenesis in the SGC+ES and Auto groups during the regeneration of the sciatic nerve were similar, and were significantly stronger than those in the other groups (Figures 7D–F).
 |
Figure 6 Immunohistochemical evaluation of BDNF, TrkB and GAP-43. (A) Typical immunohistochemical images of the regenerated nervous tissue stained with the anti-BDNF antibody. Scale bar: 50 μm. (B) Typical immunohistochemical images of the regenerated nervous tissue stained with anti-TrkB antibody. Scale bar: 50 μm. (C) Typical immunohistochemical images of the regenerated nervous tissue stained with anti-GAP-43 antibody. Scale bar: 50 μm. (D) Statistical analysis of anti-BDNF antibody. (E) Statistical analysis of anti-TrkB antibody. (F) Statistical analysis of anti-GAP-43 antibody. The data are shown as the mean ± SD (n = 3). $$P < 0.01, $$$P < 0.001 vs group SGC; **P < 0.01, ***P < 0.001 vs group SGC+ES; #P < 0.05, ##P < 0.01, ###P < 0.001 vs group Auto; &&P < 0.01, &&&P< 0.001 vs group Sham (Brown–Forsythe (B) analysis of variance followed by Dunnett T3 posthoc test). Abbreviations: BDNF, brain-derived neurotrophic factor; TrkB, tropomyosin receptor kinase B; GAP-43, growth-associated protein-43. |
 |
Figure 7 Immunohistochemical evaluation of TGF-β, VEGF and α-SMA. (A) Typical immunohistochemical images of the regenerated nervous tissue stained with the anti-TGF-β antibody. Scale bar: 50 μm. (B) Typical immunohistochemical images of the regenerated nervous tissue stained with anti-VEGF antibody. Scale bar: 50 μm. (C) Typical immunohistochemical images of the regenerated nervous tissue stained with anti-α-SMA. Scale bar: 50 μm. (D) Statistical analysis of anti-TGF-β antibody. (E) Statistical analysis of anti-VEGF antibody. (F) Statistical analysis of anti-α-SMA antibody. The data are shown as the mean ± SD (n = 3). %%P < 0.01 vs group S+ES; $$P < 0.01, $$$P < 0.001 vs group SGC; **P < 0.01, ***P < 0.001 vs group SGC+ES; #P < 0.05, ##P < 0.01, ###P < 0.001 vs group Auto; &&P < 0.01, &&&P< 0.001 vs group Sham (D and F): one-way analysis of variance followed by Bonferroni’s posthoc test; (E) Brown–Forsythe (B) analysis of variance followed by Dunnett T3 posthoc test). Abbreviations: TGF-β, transforming growth factor-β; VEGF, vascular endothelial growth factor; α-SMA: α-smooth muscle actin. |
Discussion
Peripheral nerve injury often causes sensory or motor dysfunction as well as acute neuropathic pain, especially in case of long-gap nerve defect.44,45 After PNI, the recovery of nerve function depends on the growth and extension of regenerated axons through the injured site until they reach and reinnervate the distal target organ. Artificial NGCs or tissue engineered nerve grafts as alternative of “gold standard” have attracted more and more attention in clinical and scientific research.46
Studies have shown that graphene-based NGCs with good electrical conductivity and aligned topography were beneficial for cell adhesion, proliferation, and target migration, and application of ES was expected to enhance the recovery of function.22,23,46–49 However, research to date is still limited to in vitro experiments. A large amount of in vivo data are needed to support the repairing strategy of graphene-based NGCs in combination of ES. Wang et al coated rGO onto the surface of Antheraea pernyi silk fibroin/Poly (L-lactic acid-co-caprolactone) nanofiber scaffold through an in-situ redox reaction of GO.22 In vitro, the scaffold with ES exhibited a promotion of SC migration, proliferation, and myelin formation. The in vivo performance of implanting the rGO-based NGC into the sciatic nerve defect of rats (10 mm) was similar to that of autologous nerve transplantation after 12 weeks. In another study, Mao et al developed a conductive rGO/polycaprolactone (PCL) nanofibrils (NF)/adipose-drived stem cell (ADSC) filled PCL NGC by an alternatively dipping method to provide a promising technique for nerve regeneration.23 In Vitro results indicated that the rGO/NF and ES synergistically facilitated the differentiation of PC-12 cells; incubation ADSC, the composite PCL after 8 weeks in vivo experiments was found to be suitable for treatment of sciatic nerve with 5 mm gap between the distal and proximal nerve stumps. By adding ES on PC-12 cells through rGOFs, an improved attachment was observed (Figure S6). SCs are important supporting cells in peripheral nerve system, which can help to clean Wallerian degeneration products and myelin debris, form Bands of Büngner, and provide a three-dimensional ECM for axonal growth and maturation, and energetically support only if SCs at the distal can maintain their pro-regeneration phenotype. Therefore, in the present study, we evaluated SC viability on the rGOFs extracts and examined cell proliferation state for 12, 24, 48, and 72 h, respectively. It was turned out that SCs on rGOFs were similarly proliferative as tissue culture plate (control group), with the outcomes no statistical difference.
Considering the positive results of ES on neurons and good biocompatibility of rGOFs, we evaluated the repair ability of rGO-based NGC (silicon rGOF-filled conduit) with in vivo ES for a 10 mm defect in the sciatic nerve of rats (Scheme 1), simultaneously, we analyzed the regenerated nerves from both functional and histological perspectives. From a functional perspective, the recovery of motor function, gastrocnemius denervation atrophy, and neuroelectrophysiology were compared. The SGC+ES group and the Auto group achieved similar recovery results. From a morphological perspective, we focus on the regeneration of myelin sheath and axons. With regard to myelin thickness and myelin specific protein expression, as well as regenerated axon area and axon specific protein expression, there were no significant differences in recovery effects between the SGC+ES group and the Auto group. We have reason to believe that rGOFs combined with ES can achieve similar recovery effects as autologous nerve transplantation. It is worth mentioning that compared to the area of axonal regeneration, the SGC+ES group achieved a recovery effect close to that of the Sham group, indicating that rGOFs combined with ES have great potential in the treatment of long peripheral nerve defects. The effect of rGOFs was also confirmed. The functional recovery effect of the SGC group was similar to that of the SGC+ES group, but worse than that of the Auto group and the regeneration effect of axons and myelin sheaths in the SGC group is similar to that in the Auto group, but inferior to that in the SGC+ES group. This indicates that rGOFs alone have a positive effect on peripheral nerve regeneration, and the addition of ES significantly enhances its promoting effect.
 |
Scheme 1 Schematic diagram of this study. |
Graphene and its derivatives can improve neuronal survival and guide peripheral neuron growth, even without the aid of delivering cells or therapeutics, which are fundamental prerequisites to axon regeneration and PNI repair. By adding ES on neurons through graphene-based fibers, an accelerating growth rate was observed, which was ascribed to the increased intercellular Ca2+ concentration influx.50 ES can promote the upregulation of the regeneration associated genes (RAGs), such as GAP-43, which are key genes for axonal elongation, in nerve cells by increasing the BDNF and its high-affinity receptor TrkB. BDNF is important for the development of nerves and synaptic plasticity and the increased levels of BDNF can promote the re-myelination of damaged axons in the body.42,44 BDNF and TrkB are upregulated through a Ca2+-dependent mechanism.46 Studies have shown that ES can promote the directed migration and distribution of endothelial cells, which may be related to the expression of VEGF.46 VEGF is a strong angiogenic factor that can enhance endothelial cell proliferation, recruitment, and functional angiogenesis. Research has shown that TGF-β is associated with angiogenesis.51 And the high expression of α-SMA significantly indicate the vascular regeneration. Therefore, the rGOFs combined with ES can enhance the axonal regeneration and revascularization to a better outcome of neural recovery.
Graphene and its derivatives have generated significant interest in neural tissue engineering in recent years, where they are either used as a coating or a property-reinforcement in the polymer matrix. rGOFs with orientated micro- and nano-channel structure have exhibited outstanding ability to improve trigeminal neurofilament alignment and migration.31 In this study, the rGOFs that were filled into silicon conduit in which without adding any other cells or molecules confirmed the synergistic effect with exogenous ES on recovery of PNI. However, further research is needed on the molecular mechanisms by which rGOFs can effectively promote nerve regeneration and their synergistic effects with ES. In addition, it is worthwhile to employ commercial NGCs to replace silicone tubes and further explore the long-term stability and potential toxicity of rGOFs in vivo for their future clinical applications.
Conclusion
This study systematically explored the physico-chemical properties and biocompatibility of rGOFs, verified that rGOFs combined with exogenous ES can effectively promote the repair of long-distance sciatic defects in nerve of rats, which may be related to the upregulation of RAGs and the promotion of vascular regeneration. Therefore, application of ES through graphene-based conduits in vivo has great potential in repairing long-gap PNI.
Acknowledgments
We would like to appreciate the technical help from the Central Laboratory and Department of Pathology, the First Hospital (Section 2) of Jilin University.
Funding
This work was supported by the Project of the Department of Science and Technology of Jilin Province (YDZJ202201ZYTS673), the Project of the Natural Science Foundation of Jilin Province (20210101381JC), and the National Natural Science Foundation of China (No. 81901245).
Disclosure
The authors report no conflicts of interest in this work.
References
1. Asthana P, Zhang G, Sheikh KA, Him Eddie Ma C. Heat shock protein is a key therapeutic target for nerve repair in autoimmune peripheral neuropathy and severe peripheral nerve injury. Brain Behav Immun. 2021; 91:48–64.
2. Liu B, Xin W, Tan JR, et al. Myelin sheath structure and regeneration in peripheral nerve injury repair. Proc Natl Acad Sci U S A. 2019;116(44):22347–22352. doi:10.1073/pnas.1910292116
3. Lin YC, Marra KG. Injectable systems and implantable conduits for peripheral nerve repair. Biomed Mater. 2012;7(2):024102. doi:10.1088/1748-6041/7/2/024102
4. Pan D, Mackinnon SE, Wood MD. Advances in the repair of segmental nerve injuries and trends in reconstruction. Muscle Nerve. 2020;61(6):726–739. doi:10.1002/mus.26797
5. Kehoe S, Zhang XF, Boyd D. FDA approved guidance conduits and wraps for peripheral nerve injury: a review of materials and efficacy. Injury. 2012;43(5):553–572. doi:10.1016/j.injury.2010.12.030
6. Vijayavenkataraman S. Nerve guide conduits for peripheral nerve injury repair: a review on design, materials and fabrication methods. Acta Biomater. 2020;106:54–69. doi:10.1016/j.actbio.2020.02.003
7. Parker BJ, Rhodes DI, O’Brien CM, Rodda AE, Cameron NR. Nerve guidance conduit development for primary treatment of peripheral nerve transection injuries: a Commercial Perspective. Acta Biomater. 2021;135:64–86. doi:10.1016/j.actbio.2021.08.052
8. Yang HC, Li Q, Li LM, et al. Gastrodin modified polyurethane conduit promotes nerve repair via optimizing Schwann cells function. Bioact Mater. 2022;8:355–367. doi:10.1016/j.bioactmat.2021.06.020
9. Guan YJ, Ren ZQ, Yang BY, et al. Dual-bionic regenerative microenvironment for peripheral nerve repair. Bioact Mater. 2023;26:370–386. doi:10.1016/j.bioactmat.2023.02.002
10. Lu SY, Chen W, Wang JY, et al. Polydopamine‐decorated PLCL conduit to induce synergetic effect of electrical stimulation and topological morphology for peripheral nerve regeneration. Small Methods. 2023;7(2):e2200883. doi:10.1002/smtd.202200883
11. Chiono V, Tonda-Turo C, Ciardelli G, et al. In essays on peripheral nerve repair and regeneration. Artificial Scaffolds for Peripheral Nerve Reconstruction. 2009;87:173–198.
12. Mohammadi R, Masoumi-Verki M, Ahsan S, Khaleghjoo A, Amini K. Improvement of peripheral nerve defects using a silicone conduit filled with hepatocyte growth factor. Or Surg or Med or Pa. 2013;116(6):673–679. doi:10.1016/j.oooo.2013.07.006
13. Park HJ, Hong H, Thangam R, et al. Static and dynamic biomaterial engineering for cell modulation. Nanomaterials. 2022;12(8):1377. doi:10.3390/nano12081377
14. Shin SR, Li YC, Jang HL, et al. Graphene-based materials for tissue engineering. Adv Drug Deliv Rev. 2016;105:255–274. doi:10.1016/j.addr.2016.03.007
15. Bai RG, Ninan N, Muthoosamy K, et al. Graphene: a versatile platform for nanotheranostics and tissue engineering. Prog Mater Sci. 2018;91:24–69.
16. Raslan A, Del Burgo LS, Ciriza J, Pedraz JL. Graphene oxide and reduced graphene oxide-based scaffolds in regenerative medicine. Int J Pharmaceut. 2020;580:119226. doi:10.1016/j.ijpharm.2020.119226
17. Bellier N, Baipaywad P, Ryu N, et al. Recent biomedical advancements in graphene oxide-and reduced graphene oxide-based nanocomposite nanocarriers. Biomater Res. 2022;26(1):65. doi:10.1186/s40824-022-00313-2
18. Yao XY, Yan ZW, Wang X, Jiang HQ, Qian Y, Fan CY. The influence of reduced graphene oxide on stem cells: a perspective in peripheral nerve regeneration. Regen Biomater. 2021;8(4):rbab032. doi:10.1093/rb/rbab032
19. Li XP, Qu KY, Zhou B, et al. Electrical stimulation of neonatal rat cardiomyocytes using conductive polydopamine-reduced graphene oxide-hybrid hydrogels for constructing cardiac microtissues. Colloids Surf B Biointerfaces. 2021;205:111844. doi:10.1016/j.colsurfb.2021.111844
20. Zhang W, Fang LQC XX, Pi W, Han N. Reduced graphene oxide-embedded nerve conduits loaded with bone marrow mesenchymal stem cell-derived extracellular vesicles promote peripheral nerve regeneration. Neural Regen Res. 2023;18(1):200–206. doi:10.4103/1673-5374.343889
21. Wang QQ, Wang H, Ma Y, Cao XD, Gao HC. Effects of electroactive materials on nerve cell behaviors and applications in peripheral nerve repair. Biomater Sci. 2022;10(21):6061–6076. doi:10.1039/D2BM01216B
22. Wang J, Cheng Y, Chen L, et al. In vitro and in vivo studies of electroactive reduced graphene oxide-modified nanofiber scaffolds for peripheral nerve regeneration. Acta Biomater. 2019;84:98–113. doi:10.1016/j.actbio.2018.11.032
23. Mao W, Lee E, Cho W, Kang BJ, Yoo HS. Cell-directed assembly of luminal nanofibril fillers in nerve conduits for peripheral nerve repair. Biomaterials. 2023;2023:301.
24. Liu R, Huang X, Wang X, et al. Electrical stimulation mediated the neurite outgrowth of PC-12 cells on the conductive polylactic acid/reduced graphene oxide/polypyrrole composite nanofibers. Appl Surf Sci. 2021;560:149965. doi:10.1016/j.apsusc.2021.149965
25. Zheng F, Li R, He Q, et al. The electrostimulation and scar inhibition effect of chitosan/oxidized hydroxyethyl cellulose/reduced graphene oxide/asiaticoside liposome based hydrogel on peripheral nerve regeneration in vitro. Mater Sci Eng C Mater Biol Appl. 2020;109:110560. doi:10.1016/j.msec.2019.110560
26. Huang Z, Sun M, Li Y, Guo Z, Li H. Reduced graphene oxide-coated electrospun fibre: effect of orientation, coverage and electrical stimulation on Schwann cells behavior. J Mater Chem B. 2021;9:2656–2665. doi:10.1039/D1TB00054C
27. Cheng H, Hu C, Zhao Y, Qu L. Graphene fiber: a new material platform for unique applications. NPG Asia Materials. 2014;6:e113-–e113
28. Wychowaniec JK, Litowczenko J, Tadyszak K. Fabricating versatile cell supports from nano- and micro-sized graphene oxide flakes. J Mech Behav Biomed. 2020;103:103594. doi:10.1016/j.jmbbm.2019.103594
29. González-Mayorga A, López-Dolado E, Gutiérrez MC, et al. Favorable biological responses of neural cells and tissue interacting with graphene oxide microfibers. ACS Omega. 2017;2:8253–8263. doi:10.1021/acsomega.7b01354
30. Wang X, Guo M, Liu Y, et al. reduced graphene oxide fibers for guidance growth of trigeminal sensory neurons. ACS APPL BIO MATER. 2021;4:4236–4243. doi:10.1021/acsabm.1c00058
31. Serrano MC, Feito MJ, Gonzalez-Mayorga A, et al. Response of macrophages and neural cells in contact with reduced graphene oxide microfibers. Biomater Sci UK. 2018;6:2987–2997. doi:10.1039/C8BM00902C
32. Guo W, Zhang X, Yu X, et al. self-powered electrical stimulation for enhancing neural differentiation of mesenchymal stem cells on graphene-poly(3,4-ethylenedioxythiophene) hybrid microfibers. Acs Nano. 2016;10(5):5086–5095. doi:10.1021/acsnano.6b00200
33. Dong X, Wu P, Yan L, et al. Oriented nanofibrous P(MMD-Co-LA)/deferoxamine nerve scaffold facilitates peripheral nerve regeneration by regulating macrophage phenotype and revascularization. Biomaterials. 2022;280:121288. doi:10.1016/j.biomaterials.2021.121288
34. Zhou C, Xu AT, Wang DD, Lin GF, Liu T, He FM. The effects of sr-incorporated micro/nano rough titanium surface on rBMSC migration and osteogenic differentiation for rapid osteointegration. Biomater Sci. 2018;6(7):1946–1961. doi:10.1039/C8BM00473K
35. Onode E, Uemura T, Takamatsu K, et al. Bioabsorbable nerve conduits three-dimensionally coated with human induced pluripotent stem cell-derived neural stem/progenitor cells promote peripheral nerve regeneration in rats. Sci Rep. 2021;11(1):4204. doi:10.1038/s41598-021-83385-9
36. Yang J, Hsu CC, Cao TT, Ye H, Chen J, Li YQ. A hyaluronic acid granular hydrogel nerve guidance conduit promotes regeneration and functional recovery of injured sciatic nerves in rats. Neural Regen Res. 2023;18(3):657–663. doi:10.4103/1673-5374.350212
37. Li J, Liu Y, Liu HQ, Chen L, Li RJ. Ketogenic diet potentiates electrical stimulation–induced peripheral nerve regeneration after sciatic nerve crush injury in rats. Mol Nutr Food Res. 2020;64(7):e1900535. doi:10.1002/mnfr.201900535
38. Wu P, Zhao YN, Chen FX, et al. Conductive hydroxyethyl cellulose/soy protein Isolate/polyaniline conduits for enhancing peripheral nerve regeneration via electrical stimulation. Front Bioeng Biotechnol. 2020;8:709. doi:10.3389/fbioe.2020.00709
39. Chen QQ, Liu QY, Wang P, et al. Potential application of let-7a antagomir in injured peripheral nerve regeneration. Neural Regen Res. 2023;18(7):1584–1590. doi:10.4103/1673-5374.357914
40. Qin HJ, Li H, Chen JZ, et al. Artificial nerve graft constructed by coculture of activated Schwann cells and human hair keratin for repair of peripheral nerve defects. Neural Regen Res. 2023;18(5):1118–1123. doi:10.4103/1673-5374.355817
41. Zhang XW, Zhang H, Zhang Y, et al. 3D printed reduced graphene oxide-GelMA hybrid hydrogel scaffolds for potential neuralized bone regeneration. J Mater Chem B. 2023;11(6):1288–1301. doi:10.1039/D2TB01979E
42. Sydlik SA, Jhunjhunwala S, Webber MJ, et al. In vivo compatibility of graphene oxide with differing oxidation states. ACS Nano. 2015;9(4):3866–3874. doi:10.1021/acsnano.5b01290
43. Gómez-Navarro C, Meyer JC, Sundaram RS, et al. Atomic structure of reduced graphene oxide. Nano Lett. 2010;10(4):1144–1148. doi:10.1021/nl9031617
44. Wang SL, Liu XL, Kang ZC, Wang YS. Platelet-rich plasma promotes peripheral nerve regeneration after sciatic nerve injury. Neural Regen Res. 2023;18(2):375–381. doi:10.4103/1673-5374.346461
45. Behtaj S, St John JA, Ekberg JAK, Rybachuk M. Neuron-fibrous scaffold interfaces in the peripheral nervous system: a perspective on the structural requirements. Neural Regen Res. 2022;17(9):1893–1897. doi:10.4103/1673-5374.329003
46. Liu K, Yan L, Li RT, et al. 3D printed personalized nerve guide conduits for precision repair of peripheral nerve defects. Adv Sci (Weinh). 2022;9(12):e2103875. doi:10.1002/advs.202103875
47. Dong C, Qiao F, Hou W, et al. Graphene-based conductive fibrous scaffold boosts sciatic nerve regeneration and functional recovery upon electrical stimulation. Appl Mater Today. 2020;21:100870. doi:10.1016/j.apmt.2020.100870
48. Lu S, Chen W, Wang J, et al. Polydopamine-decorated plcl conduit to induce synergetic effect of electrical stimulation and topological morphology for peripheral nerve regeneration. Small Methods. 2023;7.
49. Chen X, Liu C, Huang Z, et al. Preparation of carboxylic graphene oxide-composited polypyrrole conduits and their effect on sciatic nerve repair under electrical stimulation. J Biomed Mater Res A. 2019;107(12):2784–2795. doi:10.1002/jbm.a.36781
50. Feng ZQ, Wang T, Zhao B, et al. Soft graphene nanofibers designed for the acceleration of nerve growth and development. Adv Mater. 2015;27:6462–6468. doi:10.1002/adma.201503319
51. Shoeibi S. Important signals regulating coronary artery angiogenesis. Microvasc Res. 2018. doi:10.1016/j.mvr.2017.12.002
 © 2024 The Author(s). This work is published and licensed by Dove Medical Press Limited. The
full terms of this license are available at https://www.dovepress.com/terms
and incorporate the Creative Commons Attribution
- Non Commercial (unported, 3.0) License.
By accessing the work you hereby accept the Terms. Non-commercial uses of the work are permitted
without any further permission from Dove Medical Press Limited, provided the work is properly
attributed. For permission for commercial use of this work, please see paragraphs 4.2 and 5 of our Terms.
© 2024 The Author(s). This work is published and licensed by Dove Medical Press Limited. The
full terms of this license are available at https://www.dovepress.com/terms
and incorporate the Creative Commons Attribution
- Non Commercial (unported, 3.0) License.
By accessing the work you hereby accept the Terms. Non-commercial uses of the work are permitted
without any further permission from Dove Medical Press Limited, provided the work is properly
attributed. For permission for commercial use of this work, please see paragraphs 4.2 and 5 of our Terms.