Back to Journals » Diabetes, Metabolic Syndrome and Obesity » Volume 8
Red cell distribution width in type 2 diabetic patients
Authors Nada AM ![]()
Received 24 March 2015
Accepted for publication 10 July 2015
Published 30 October 2015 Volume 2015:8 Pages 525—533
DOI https://doi.org/10.2147/DMSO.S85318
Checked for plagiarism Yes
Review by Single anonymous peer review
Peer reviewer comments 4
Editor who approved publication: Professor Ming-Hui Zou
Aml Mohamed Nada
Department of Internal Medicine, Unit of Endocrinology, Diabetes and Metabolism, Faculty of Medicine, Mansoura University, Mansoura, Egypt
Objective: To study the indices of some elements of the complete blood count, in type 2 diabetic patients, in comparison with nondiabetic healthy controls; and to find out the effects of glycemic control and different medications on these indices. To the best of our knowledge, this study is novel in our environment and will serve as a foundation for other researchers in this field.
Methods: This retrospective study included 260 type 2 diabetic patients on treatment and 44 healthy control subjects. Sex, age, weight, height, blood pressure, complete blood count, fasting plasma glucose, hemoglobin A1c (HbA1c), and lipid profile data, were available for all of the study population. For diabetic patients, data on duration of diabetes and all medications were also available.
Results: Red cell distribution width (RDW) was significantly higher in diabetic patients than in control subjects (P=0.008). It was also higher in patients with uncontrolled glycemia (HbA1c >7%) than those with good control (HbA1c ≤7%; P=0.035). Mean platelet volume (MPV) was comparable in both diabetic patients and healthy controls (P=0.238). RDW and MPV did not significantly correlate with fasting plasma glucose, HbA1c, or duration of diabetes. Both aspirin and clopidogrel did not show a significant effect on MPV. Both insulin and oral hypoglycemic agents did not show a significant effect on RDW, mean corpuscular volume, MPV, platelet count, or white blood cell count. Diabetic patients treated with indapamide or the combined thiazides and angiotensin receptor blockers showed no significant difference in RDW when compared with the control subjects.
Conclusion: RDW, which is recently considered as an inflammatory marker with a significant predictive value of mortality in diseased and healthy populations, is significantly higher in diabetic patients than healthy subjects and is particularly higher in uncontrolled glycemia. None of the studied hypoglycemic agents showed a significant effect on RDW. Diabetic hypertensive patients receiving antihypertensive therapy in the form of indapamide or the combined therapy of thiazides and angiotensin receptor blockers have RDW values comparable to those of the healthy population.
Keywords: red cell distribution, platelet, diabetes, inflammation
Introduction
The prevalence of type 2 diabetes has been increasing rapidly throughout the world. It is estimated that approximately 592 million people worldwide will become diabetic by year 2035, with a global prevalence of 10.1%.1 It is a global health problem because of its associated high morbidity and mortality. The primary cause of mortality in diabetic patients is cardiovascular diseases, whereas the major cause of morbidity is microvascular complications.2
The evidence associating red cell distribution width (RDW) with a higher risk of mortality has been expanding since the initial report of its prognostic utility in heart failure patients. RDW has also been shown to independently predict overall and cardiovascular mortality in the general population and various high-risk populations.3,4 It is also a strong predictor of mortality in many conditions such as obesity, malignancies, and chronic kidney diseases.5 Being an independent predictive value for various diseases makes it imperative to be studied in diabetes mellitus.
The RDW is a quantitative measure of the heterogeneity of the volume of red blood cells (RBCs) with higher values reflecting greater heterogeneity in cell sizes (anisocytosis). It is originally used together with the mean corpuscular volume (MCV) in clinical practice to differentiate between causes of anemia.6
Inflammation has been proposed as a component of diabetes. Patients with type 2 diabetes without atherosclerosis were found to have greater resting serum levels of acute-phase reactants than healthy people.3 Advanced glycation end products stimulate cytokine release from macrophages and these could act in concert with insulin deficiency and resistance to induce an acute-phase response.7
Platelets, another element of the complete blood count (CBC), play a key role in the development of atherothrombosis, a major contributor of cardiovascular events, and represent the major cause of mortality in diabetes. Platelet aggregation and adhesion play a major role in intravascular thrombosis on top of atherosclerosis, resulting in cardiovascular and cerebrovascular events. They may also be involved as a causative agent in the development of micro- and macrovascular diseases in diabetes, with respect to altered platelet morphology and function.8,9
Platelet hyperactivity has been reported in diabetes both in vivo and in vitro.10 Mean platelet volume (MPV) is an indicator of the average size and was suggested by some authors to be an indicator of the platelet activity and the state of thrombogenesis.8,10 Antiplatelets have been demonstrated to be very effective at decreasing myocardial infarction, stroke, and death.11 Leukocytes are known to participate in the inflammatory process accompanying atherosclerosis. They are recruited at the site of endothelial injury and form foam cells in the atheromatous plaque. Interleukins and tumor necrosis factor-α are released from activated leukocytes and cause endothelial dysfunction. White blood cell (WBC) count is positively associated with increased cardiovascular mortality, mainly from coronary heart disease.12
We aimed to use the CBC in type 2 diabetic patients as a simple and costless technique that is routinely done to investigate the state of various indices of blood elements, especially those which are claimed to have a role in the disease process and its complications, such as RDW, MPV, platelet count, and WBC count. We also elucidated the effects of various medications on these indices.
Patients and methods
We conducted a retrospective study that included 260 diabetic patients (98 females and 162 males) and 44 nondiabetic healthy controls (16 females and 28 males) from Internal Medicine Department, Diabetes and Endocrinology Clinics in Asir Central Hospital, a tertiary care hospital in Abha, Kingdom of Saudi Arabia. Informed consents were obtained from participants. This study was approved by the Hospital Ethics Committee. Patients were excluded if they had a history of smoking, anemia, chronic liver disease, dialysis, thyroid disease, pregnancy, heart failure, acute or chronic infection, or blood disease. Patients with known inflammatory conditions such as rheumatoid arthritis, systemic lupus erythematosus, and those receiving anticoagulants or had a diagnosis of malignancy or atherosclerotic coronary artery disease were also excluded.
Age of all participants and weight, height, systolic blood pressure (SBP) and diastolic blood pressure (DBP) were all available. Body mass index was calculated as follows: (weight [kg]/height [m2]). In diabetic patients, duration of diabetes and medications were all noted.
Laboratory analysis
All patients and healthy controls had CBC on venous blood samples taken into tripotassium ethylene diamine tetraacetic acid, using a Roche Minos cell counter and automatic blood counter (Avid CELL-DYN 3500; Abbot Laboratories, Abbot Park, IL, USA) within 2 hours of sample collection for platelet indices, WBC count, and RBC indices. Standardization, calibration of instrument, and processing of samples were done according to the manufacturer’s instructions. Hemoglobin A1c (HbA1c) levels were measured by high-performance liquid chromatography (Merck-Hitachi 9100; Merck®, Dermstadt, Germany). Fasting plasma glucose (FPG) levels, total cholesterol (T-Ch), low-density lipoprotein (LDL), high-density lipoprotein (HDL), and triglycerides (TGs) in whole serum were measured enzymatically using a Cobas 6000e autoanalyzer by hexokinase method and homogenous enzymatic colorimetric assay. Reference values were as follows: T-Ch: 3–5.2 mmol/L, LDL: <3.4 mmol/L, HDL: 0.62–1.55 mmol/L, TG: 0.34–2.28 mmol/L, WBC count: 4–11×109/μL, platelet count: 140–440×109/μL, MPV: 7–13 fL, RDW: 11%–14%, and MCV: 76–96 fL.
Statistical analysis
Collected data were verified prior to computerized data entry. The Statistical Package for Social Sciences (Version 21.0; IBM Corporation, Armonk, NY, USA) was used for the statistical analysis of data. Descriptive statistics (eg, frequency, mean, and standard deviation) were applied. Pearson’s correlation coefficient and tests of significance (eg, unpaired t-test) were applied. A significant P-value was considered at ≤0.05.
Results
Patient and healthy control characteristics are listed in Table 1. RDW was significantly higher in diabetic patients than healthy controls (P=0.008; Figure 1 and Table 1), whereas MCV was significantly smaller (P=0.036). No statistically significant differences were noted between both groups in MPV, platelet count, or WBC count. Comparing patients with HbA1c ≤7% (47 patients) and with HbA1c >7% (213 patients) showed higher RDW (P=0.035) and smaller MCV (P=0.016) in the group with HbA1c >7%, otherwise no other significant differences were noted (Table 2).
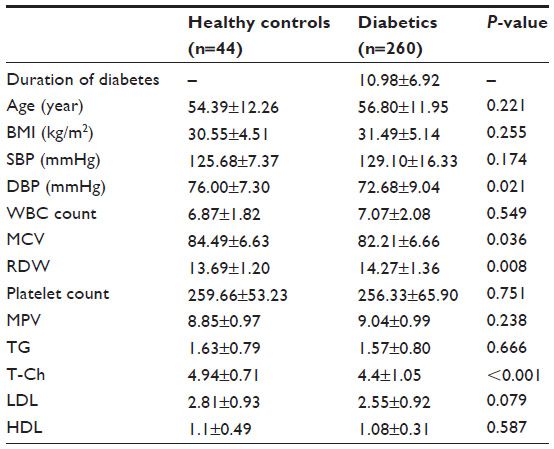 | Table 1 Criteria of diabetic patients and healthy controls |
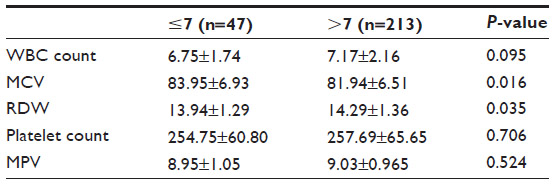 | Table 2 The studied CBC indices in diabetic patients with A1c ≤7% vs patients with A1c >7% |
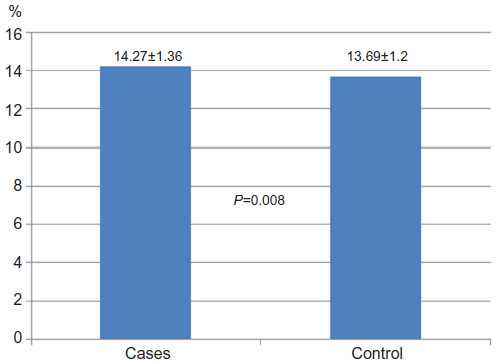 | Figure 1 Red cell distribution width in diabetic patients (n=260) vs controls (n=44). |
In the patient group, no statistically significant correlations were noted between RDW and FPG, A1c (P=0.22 and 0.781), blood pressure, or duration of diabetes. RDW was strongly and directly associated with the body mass index (P<0.0001). MCV showed to be inversely associated with BMI (P=0.016) and HbA1c (P=0.048). Platelet count was inversely correlated with age (P=0.035), whereas the WBC count was directly associated with the duration of diabetes (P=0.049). MPV showed direct but insignificant correlation with FPG and HbA1c (P=0.057 and 0.164, respectively). RDW, MCV, and MPV did not correlate significantly with any of the components of the lipid profile. Platelet count correlated inversely with TGs (r=−0.14, P=0.015) and directly with HDL (r=0.153, P=0.008). White cell count inversely correlated with both T-Ch and LDL (r=−0.155 and −0.152, P=0.007 and 0.008, respectively). MPV was inversely correlating with platelet count (r=−0.368, P<0.001; Table 3). WBC count was directly correlating with platelet count (r=0.16, P=0.01) and RDW, although the second correlation did not reach a statistical significance (r=0.118, P=0.059; Table 4).
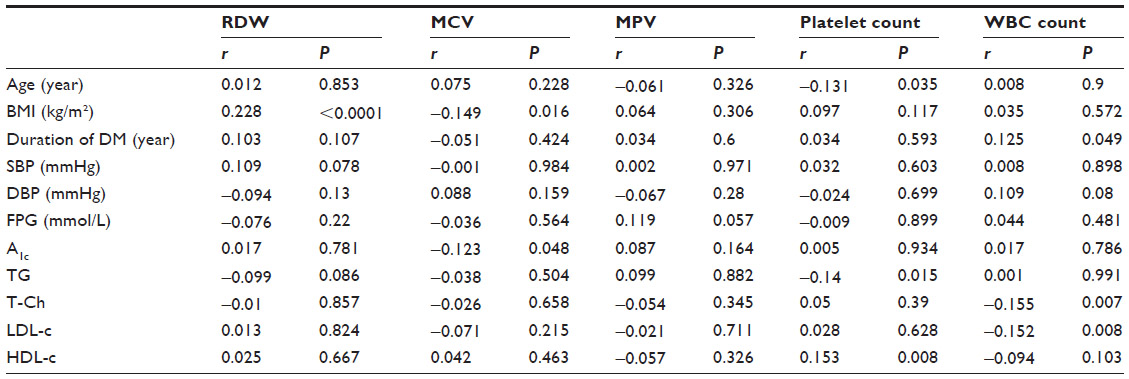 | Table 3 Correlations of CBC indices with various variables |
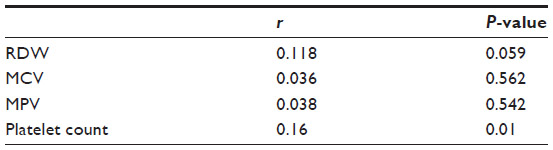 | Table 4 r and P-values of the correlations between WBC count and other CBC indices |
In comparison with controls, patients receiving indapamide had comparable RDW (14.79±1.25 vs 13.69±1.20, P=0.473) and MPV (8.68±0.85 vs 8.85±0.97, P=0.456). The thiazide group had significantly larger MPV (9.57±0.84 vs 8.85±0.97, P=0.009) and RDW (P=0.014). Combined indapamide and angiotensin-converting enzyme inhibitors therapy was associated with higher RDW (P<0.0001) and comparable MPV (P=0.403); meanwhile, the combined angiotensin receptor blockers (ARBs) and thiazides had comparable RDW (14.34±1.56 vs 13.69±1.2, P=0.15) and comparable MPV (8.75±0.8 vs 8.85±0.97, P=0.77) to controls. Calcium channel blockers did not show significant effects (Table 5).
 | Table 5 P-values of the effects of different medications in patients (in comparison with controls) |
Diabetic patients receiving antiplatelets in the form of aspirin (8.99±0.95 vs 8.85±0.97, P=0.368) or clopidogrel (8.88±0.76 vs 8.85±0.97, P=0.894) did not show significant difference in MPV when compared with controls. Statin therapy did not show a significant effect on CBC (Table 5, Figures 2 and 3).
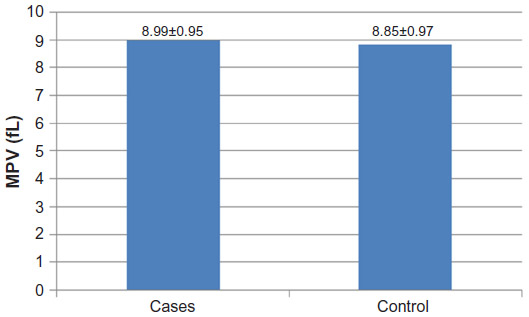 | Figure 2 No effect of aspirin on mean platelet volume (MPV) in diabetic patients (n=163) in comparison to control (n=44); P=0.368. |
 | Figure 3 No effect of clopidogrel on mean platelet volume (MPV) in diabetic patients (n=14) in comparison to control (n=44); P=0.89. |
Hypoglycemic agents, including insulin, metformin, sulfonylurea, pioglitazone, and dipeptidyl peptidase 4 inhibitors, did not show significant effects on any of the studied hematological indices (Table 5).
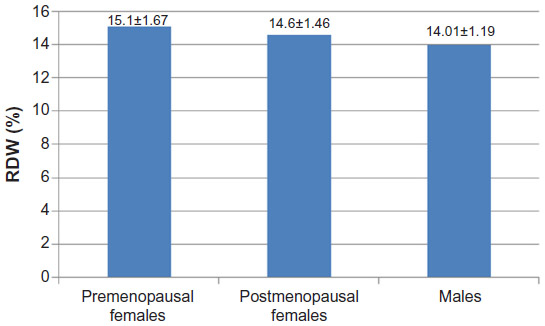
Both pre- and postmenopausal diabetic females showed significantly higher RDW and lower MCV when compared with men. No significant difference was found between pre- and postmenopausal women in any of the studied indices (Tables 6, 7, and Figure 4).
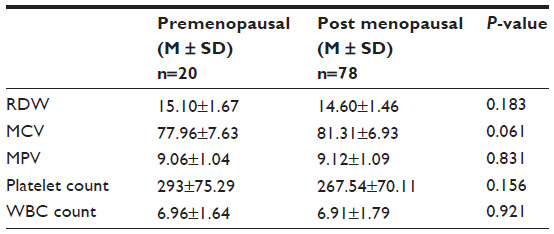 | Table 6 Comparison of the studied CBC indices in pre- and postmenopausal females |
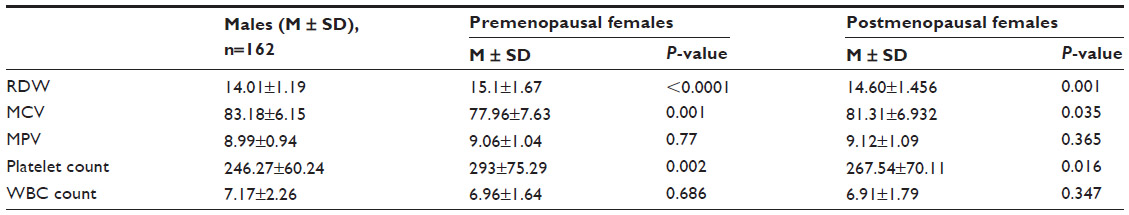 | Table 7 CBC indices in pre- and postmenopausal females in comparison with males |
 | Figure 4 RDW in premenopausal (n=20) and postmenopausal females (n=78) vs males (n=162; P≤0.0001 and 0.001 consecutively). |
Discussion
In the present study, higher RDW in diabetic patients than healthy controls (P=0.008) indicates the presence of anisocytosis, which is related to impairment of erythropoiesis and degradation of erythrocytes by fragmentation or agglutination.13,14 This occurs in the presence of chronic inflammation and increased level of oxidative stress.15
Hyperglycemia has several effects on RBCs, besides formation of glycated hemoglobin, it leads to reduced deformability, changes in mechanical properties of RBCs, increased adhesion, and increased osmotic fragility, leading to changes in erythrocyte structure and hemodynamic characteristics.16,17
Hyperglycemia reduces RBC life span, leading to high variability of the RBC volumes.18 Peterson et al has mentioned reduced average life span of RBCs in diabetic patients.19 This was also demonstrated by Emilia who showed that an extracellular oxidative milieu can be responsible for erythrocyte caspase-3 activation in type 2 diabetes. Activated caspase-3 impairs the maintenance of erythrocyte shape and function, thus contributing to the shortened life span of RBCs.20
The original studies of Peterson et al showed a modest but consistent increase in erythrocyte half-life after the establishment of tight glycemic control compared with the same patients studied in poor control.19 In our study, there was a significant difference in RDW, being significantly higher in patients with HbA1c >7%, indicating shorter life span with anisocytosis in uncontrolled diabetes.
Our report of higher RDW in type 2 diabetes is in contrast to a report by Cakir et al who did not find such a difference (P=0.53).21 Moreover, he did not find a significant difference in RDW in patients with HbA1c <7% or >7%. He also did not find a significant difference in RDW when diabetes duration was longer or shorter than 10 years. In our study, we did not observe a correlation between RDW and duration of diabetes (P=0.107).
Similar to our study, Vayá et al mentioned a significant strong correlation between RDW and BMI.22 Obesity is associated with a low-grade inflammatory process in the white adipose tissue,23,24 so its association with RDW can be considered reasonable.
In agreement with our findings, Sherif et al did not observe significant correlations between RDW and HbA1c, SBP, DBP, or duration of diabetes.25 Contrary to our results, she did not find a significant correlation between RDW and BMI.
In Vayá et al’s study, an inverse correlation was observed between RDW and TGs but was evident only in women (P<0.05).22 In another study in the general population, Lippi et al found an inverse association with HDL in both sexes and a direct association with hypertriglyceridemia and cholesterol/HDL ratio only in women.26 In our study, no significant associations between RDW and lipids were noticed.
We did not find significant effects of insulin, metformin, sulfonylurea, pioglitazone, or dipeptidyl peptidase 4 inhibitors on any of the studied hematological indices. To our knowledge, there are no previous reports about the effects of hypoglycemic agents on RDW or any of the other blood indices mentioned in our study.
In the present study, absence of a significant difference in MPV in type 2 diabetes is in consonance with results obtained by Akinsegun et al in Nigerian patients (P=0.593).27 On the contrary, several other authors stated a significantly higher MPV in patients with diabetes, such as Hekimsoy et al8 and Kodiatte et al.28 This also agrees with the findings seen in studies conducted by Zuberi et al9 and Jindal et al.29 One explanation for the higher MPV is that a significant number of these studies was done in diabetic patients postmyocardial infarction.
Absence of a significant correlation between MPV and FPG or HbA1c in our study is consistent with a report by ünübol et al.30 Similarly, Yenigün et al found no association between MPV and FPG, HbA1c, patient age, duration of diabetes, or blood pressure.31 This is also in agreement with our report and other reports.32,33 Similar to Kodiatte et al, we did not find a significant difference in MPV in patients with HbA1c ≤7% or >7% and no association with the BMI was found.28
On the other hand, positive correlations were demonstrated by Shah et al,34 Akinsegun et al,27 and De Luca et al35 between MPV and FPG and duration of diabetes. They suggested that achieving good glycemic control may limit platelet activation and delay the onset and progression of vascular complications.
Similar to De Luca et al,35 we found an inverse relation between MPV and platelet count. However, in contrast to his report, we did not find a significant association of MPV with age, TGs, or statin use (Table 5).
In our study, an inverse correlation between MPV and platelet count is in agreement with the study conducted by Akinsegun et al.27 This was explained to be as a result of small platelets being consumed in order to maintain a constant platelet functional mass.36
Absence of a significant effect of aspirin on MPV is in agreement with the report by Colkesen et al.37 In their study, aspirin-treated patients did not show a significant difference in MPV (P=0.9). In another study by Shah et al, MPV was a reproducible marker of platelet size and not affected by low-dose aspirin and was modestly associated with some, but not all, markers of platelet activity.38 The absence of an effect of aspirin on MPV and the extent of platelet aggregation were also mentioned by De Luca et al.39
Shechter et al mentioned individual variability of platelet response to clopidogrel.40 In our study, there was no significant effect of clopidogrel on MPV.
The antiplatelet effects of perindopril and other angiotensin-converting enzyme inhibitors (ACEIs) appear to be small. In the study by Gupta et al, perindopril treatment did not affect platelet indices.41 Other studies of the ACEI quinapril and the ARB losartan42 similarly have shown little effect on MPV. This is quite consistent with our findings as ACEIs and ARBs did not show a significant effect on MPV (P=0.291 and 0.106, respectively).
Analysis of the effects of antihypertensive medications in diabetic hypertensive patients in our study elicited that the use of indapamide may be preferable to the use of thiazides because it is associated with comparable RDW and MPV in healthy subjects. For the same reason, the combination therapy of thiazides and ARBs may also be preferable to the combination of indapamide and ACEI (Table 5).
In our study, platelet count inversely correlated with TGs and directly correlated with HDL (P=0.015 and 0.008). In another study, platelet count was correlating negatively with TGs in hypertriglyceridemia (r=−0.489, P<0.05).43 This is in agreement with our study results (r=−0.1, P=0.015), which state that the higher the TGs, the lower the platelet count.
Both Santimone et al44 and Papatheodorou et al45 demonstrated a positive association between WBC and platelet counts. In our study, WBC count was positively associated with RDW and platelet count (P=0.01), although the association with RDW did not reach a statistical significance (P=0.059). No association was found between WBC count and MPV (P=0.542) or MCV (P=0.562), although the relation between WBC count and MPV was reported by Santimone et al.44 The association of platelet count and RDW with WBC count may underline the role of both platelets and erythrocytes in inflammation.
No association was found between WBC count or platelet count and the FPG, BMI, or lipids in the study conducted by Papatheodorou et al.45 This is in agreement with our report apart from the relation to lipids. Our study revealed a strong negative correlation between WBC count and LDL (r=−0.152, P=0.008) and T-Ch (r=−0.155, P=0.007). This seems a paradox, which advocates further investigation.
In the study conducted by Tong et al,12 subjects with higher WBC counts had longer disease duration, higher SBP, DBP, BMI, HbA1c, FPG, LDL cholesterol, TGs, and lower HDL.
In consistence with the findings of Tong et al,12 our study results demonstrated a positive correlation between WBC count and duration of diabetes (P=0.049). However, the association between WBC count and T-Ch and LDL was an inverse one. We did not find a significant association with any of the FPG, HbA1c, TG, SBP or DBP, and WBC count.
Pre- and postmenopausal females had higher RDW, platelet count (P<0.0001 and 0.002, respectively) and smaller MCV (P=0.001) than males. Higher platelet count in women cannot be explained by the different hormonal profiles or a compensatory mechanism associated with menstrual blood loss because the difference was persistent regardless of the woman’s age.
Lippi et al found higher RDW in nondiabetic men than women.26 Some researchers found no correlation and no statistically significant differences in MPV between both sexes.46
Achie et al, in agreement with our report, did not find a significant difference in RBC indices or MPV between pre- and postmenopausal women.47
Conclusion
RDW, an RBC index, is uprising as a new marker associated with higher mortality in health and disease. Studying RDW in diabetes delineated higher RDW values than in healthy population. In diabetic patients, the glycemic control does affect the RDW. Good glycemic control is associated with lower RDW than in patients with poor control. Both RDW and BMI are directly and significantly associated. This positive correlation may strengthen the notion that RDW is an inflammatory marker, as obesity is considered as a state of subclinical inflammation. Diabetic hypertensive patients receiving antihypertensive therapy in the form of indapamide or the combined therapy of thiazides and ARBs have RDW values comparable to those of the healthy population. None of the studied hypoglycemic agents showed a significant effect on RDW.
The study in our population can be considered as an initial one that necessitates further studies to define the relation between RDW and different diabetic complications and its prognostic value. Further studies are also required to define specific values of the RDW to indicate specific risks in diabetic patients.
Disclosure
The author declares no conflicts of interest in this work.
References
Guariguata L, Whiting DR, Hambleton I, Beagley J, Linnenkamp U, Shaw JE. Global estimates of diabetes prevalence for 2013 and projections for 2035. Diabetes Res Clin Pract. 2014;103(2):137–149. | |
Mahsud MAJ, Khan A, Hussain J. Hematological changes in tobacco using type 2 diabetic patients. Gomal J Med Sci. 2010;8:8–11. | |
Pickup JC, Mattock MB, Chusney GD, Burt D. NIDDM as a disease of innate immune system: association of acute-phase reactants and interleukin-6 with metabolic syndrome X. Diabetologia. 1997;40: 1286–1292. | |
Zalawadiya SK, Zmily H, Farah J, Daifallah S, Ali O, Ghali JK. Red cell distribution width and mortality in predominantly African-American population with decompensated heart failure. J Card Fail. 2011;17:292–298. | |
Ridker PM, Cushman M, Stampfer MJ, Tracy RP, Hennekens CH. Plasma concentration of C-reactive protein and risk of developing peripheral vascular disease. Circulation. 1998;97:425–428. | |
Montagnana M, Cervellin G, Meschi T, Lippi G. The role of red blood cell distribution width in cardiovascular and thrombotic disorders. Clin Chem Lab Med. 2011;50(4):635–641. | |
Imani F, Horii Y, Suthanthiran M, et al. Advanced glycosylation end product-specific receptors on human and rat T-lymphocytes mediate synthesis of interferon γ: role in tissue remodelling. J Exp Med. 1993;178:2165–2172. | |
Hekimsoy Z, Payzinb B, Ornek T, Kandogan G. Mean platelet volume in type 2 diabetic patients. J Diabetes Complications. 2004;18:173–176. | |
Zuberi BF, Akhtar N, Afsar S. Comparison of mean platelet volume in patients with diabetes mellitus, impaired fasting glucose and non-diabetic subjects. Singapore Med J. 2008;49(2):114–116. | |
Bae SH, Lee J, Roh KH, Kim J. Platelet activation in patients with diabetic retinopathy. Korean J Ophthalmol. 2003;17:140–144. | |
Antithrombotic Trialists’ Collaboration. Collaborative meta-analysis of randomised trials of antiplatelet therapy for prevention of death, myocardial infarction, and stroke in high risk patients. BMJ. 2002;324: 71–86. | |
Tong PC, Lee KF, So WY, et al. White blood cell count is associated with macro and microvascular complications in Chinese patients with type 2 diabetes. Diabetes Care. 2004;27(1):216–222. | |
Briggs C, Bain BJ. Basic haematological techniques. In: Bain BJ, Bates I, Laffan M, Lewis SM, editors. Dacie and Lewis Practical Haematology. 10th ed. (Chap 3). Philadelphia, PA: Churchill Livingstone; 2006:26–54. | |
Ryan DH. Examination of blood cells. In: Lichtman MA, Kipps TJ, Seligsohn U, et al, editors. Williams Hematology. 8th ed. (Chap 2). New York, NY: The McGraw-Hill Companies, Inc.; 2010. | |
Ferrucci L, Guralnik JM, Woodman RC, et al. Proinflammatory state and circulating erythropoietin in persons with and without anemia. Am J Med. 2005;118:128. | |
Symeonidis A, Athanassiou G, Psiroyannis A, et al. Impairment of erythrocyte viscoelasticity is correlated with levels of glycosylated haemoglobin in diabetic patients. Clin Lab Haematol. 2001;23(2):103–109. | |
Livshits L, Srulevich A, Raz I, et al. Effect of short-term hyperglycemia on protein kinase C alpha activation in human erythrocytes. Rev Diabet Stud. 2012;9(2–3):94–103. | |
Panzer S, Graninger W, Kronik G, Bettelheim P, Lechner K. Glycosylated hemoglobin as long-term parameter in appraising the severity of hemolytic disease. J Mol Med. 1983;61(17):839–843. | |
Peterson CM, Jones RL, Koenig RJ, Melvin ET, Lehrman ML. Reversible hematologic sequelae of diabetes mellitus. Ann Intern Med. 1977;86:425–429. | |
Maellaro E, Leoncini S, Moretti D, et al. Erythrocyte caspase-3 activation and oxidative imbalance in erythrocytes and in plasma of type 2 diabetic patients. Acta Diabetol. 2013;50(4):489–495. | |
Cakir L, Aktas G, Enginyurt O, Cakir SA. Mean platelet volume increases in type 2 diabetes mellitus independent of HbA1c level. Acta Med Mediterr. 2014;30:425–428. | |
Vayá A, Sarnago A, Fuster O, Alis R, Romagnoli M. Influence of inflammatory and lipidic parameters on red blood cell distribution width in a healthy population. Clin Hemorheol Microcirc. 2015;59:379–385. | |
Rodríguez-Hernández H, Simental-Mendía LE, Rodríguez-Ramírez G, Reyes-Romero MA. Obesity and inflammation: epidemiology, risk factors, and markers of inflammation. Int J Endocrinol. 2013; 2013:678159. | |
Fuentes E, Fuentes F, Vilahur G, Badimon L, Palomo I. Mechanisms of chronic state of inflammation as mediators that link obese adipose tissue and metabolic syndrome. Mediators Inflamm. 2013;2013: 136584, 11. | |
Sherif H, Ramadan N, Radwan M, Hamdy E, Reda R. Red cell distribution width as a marker of inflammation in type 2 diabetes mellitus. Life Sci J. 2013;10(4):32–39. | |
Lippi G, Sanchis-Gomar F, Danese E, Montagnana M. Association of red blood cell distribution width with plasma lipids in a general population of unselected outpatients. Kardiol Pol. 2013;71:931–936. | |
Akinsegun A, Akinola Olusola D, Sarah JO, et al. Mean platelet volume and platelet counts in type 2 diabetes mellitus on treatment and non-diabetic mellitus controls in Lagos, Nigeria. Pan Afr Med J. 2014;18:42. | |
Kodiatte TA, Manikyam UK, Rao SB, et al. Mean platelet volume in type 2 diabetes mellitus. J Lab Physicians. 2012;4(1):5–9. | |
Jindal S, Gupta S, Gupta R, et al. Platelet indices in diabetes mellitus: indicators of diabetic microvascular complications. Hematology. 2011;16:86–89. | |
ünübol M, Ayhan M, Güney E. The relationship between mean platelet volume with microalbuminuria and glycemic control in patients with type II diabetes mellitus. Platelets. 2012;23(6):475–480. | |
Yenigün EC, Okyay GU, Pirpir A, Hondur A, Yildirim S. Increased mean platelet volume in type 2 diabetes mellitus. Dicle Med J. 2014;41: 17–22. | |
Beckman JA, Creager M, Libby P. Diabetes and atherosclerosis: epidermiology, pathophysiology and management. JAMA. 2002; 287(19):2570–2581. | |
Luscher TF, Creager MA, Beckman JA, Consentino F. Diabetes and vascular disease: pathophysiology, clinical consequences and medical therapy. Circulation. 2003;108:1655–1661. | |
Shah B, Sha D, Xie D, Emile R, Mohler ER, Berger J. The relationship between diabetes, metabolic syndrome, and platelet activity as measured by mean platelet volume: The National Health and Nutrition Examination Survey, 1999–2004. Diabetes Care. 2012;35:1074–1078. | |
De Luca G, Santagostino M, Secco GG, et al. Mean platelet volume and the extent of coronary artery disease: results from a large prospective study. Atherosclerosis. 2009;206(1):292–297. | |
Chu SG, Becker RC, Berger PB, et al. Mean platelet volume as a predictor of cardiovascular risk: a systematic review and meta-analysis. J Thromb Haemost. 2010;8:148–156. | |
Colkesen Y, Coskun I, Muderrisoglu H. The effect of aspirin on mean platelet volume in patients with paroxysmal atrial fibrillation. Platelets. 2013;24(4):263–266. | |
Shah B, Valdes V, Nardi MA, Hu L, Schrem E, Berger JS. Mean platelet volume reproducibility and association with platelet activity and anti-platelet therapy. Platelets. 2014;25(3):188–192. | |
De Luca G, Verdoia M, Cassetti E, et al; Novara Atherosclerosis Study (NAS) Group. Mean platelet volume is not associated with platelet reactivity and the extent of coronary artery disease in diabetic patients. Blood Coagul Fibrinolysis. 2013;24:619–624. | |
Shechter M, Beigel B, Varon B, Fefer P. Increased mean platelet volume is associated with non responsiveness to clopidogrel. Thromb Hemost. 2014;112(1):137–141. | |
Gupta RK, Kjeldsen SE, Motley E, Weder AB, Zweifler AJ, Julius S. Platelet function during antihypertensive treatment with quinapril, a novel angiotensin converting enzyme inhibitor. J Cardiovasc Pharmacol. 1990;17:13–19. | |
Jagroop I, Mikhailidis D. Angiotensin II can induce and potentiate shape change in human platelets: effect of losartan. J Hum Hypertens. 2001;14:581–585. | |
Shen T, Liu BW, Liu Y, Bai H, Zhang ZH. Effects of hypertriglyceridemia on platelet activities in endogenous hypertriglyceridemic patients. Sichuan Da Xue Xue Bao Yi Xue Ban. 2004;35:15–17. | |
Santimone I, Di Castelnuovo A, De Curtis A, et al; MOLI-SANI Project Investigators. White blood cell count, sex and age are major determinants of heterogeneity of platelet indices in an adult general population: results from the MOLI-SANI project. Haematologica. 2011;96:1180–1188. | |
Papatheodorou KP, Papanas NP, Papazoglou DP, Dimitriadis GD, Papazoglou LP, Ntakomyti EN. Correlation of WBC and PLT count with parameters of type 2 diabetes mellitus. Endocr Abst. 2006;11:373. | |
Butkiewicz AM, Kemona H, Dymicka-Piekarska V, Matowicka-Karna J, Radziwon P, Lipska A. Platelet count, mean platelet volume and thrombocytopoietic indices in healthy women and men. Thromb Res. 2006;118(2):199–204. | |
Achie LN, Olorunshola KV, Mabrouk M. A study of some red cell indices in menopausal women in Zaria, Nigeria. Asian J Med Sci. 2011;3:154–157. |
 © 2015 The Author(s). This work is published and licensed by Dove Medical Press Limited. The
full terms of this license are available at https://www.dovepress.com/terms
and incorporate the Creative Commons Attribution
- Non Commercial (unported, 3.0) License.
By accessing the work you hereby accept the Terms. Non-commercial uses of the work are permitted
without any further permission from Dove Medical Press Limited, provided the work is properly
attributed. For permission for commercial use of this work, please see paragraphs 4.2 and 5 of our Terms.
© 2015 The Author(s). This work is published and licensed by Dove Medical Press Limited. The
full terms of this license are available at https://www.dovepress.com/terms
and incorporate the Creative Commons Attribution
- Non Commercial (unported, 3.0) License.
By accessing the work you hereby accept the Terms. Non-commercial uses of the work are permitted
without any further permission from Dove Medical Press Limited, provided the work is properly
attributed. For permission for commercial use of this work, please see paragraphs 4.2 and 5 of our Terms.