Back to Journals » Neuropsychiatric Disease and Treatment » Volume 11
Red cell distribution width and neurological scoring systems in acute stroke patients
Authors Kara H ![]() , Degirmenci S, Bayir A, Ak A, Akinci M, Dogru A, Akyurek F, Kayis SA
, Degirmenci S, Bayir A, Ak A, Akinci M, Dogru A, Akyurek F, Kayis SA
Received 25 January 2015
Accepted for publication 14 February 2015
Published 18 March 2015 Volume 2015:11 Pages 733—739
DOI https://doi.org/10.2147/NDT.S81525
Checked for plagiarism Yes
Review by Single anonymous peer review
Peer reviewer comments 3
Editor who approved publication: Dr Roger Pinder
Hasan Kara,1 Selim Degirmenci,1 Aysegul Bayir,1 Ahmet Ak,1 Murat Akinci,1 Ali Dogru,1 Fikret Akyurek,2 Seyit Ali Kayis3
1Department of Emergency Medicine, Faculty of Medicine, Selcuk University, Konya, Turkey; 2Department of Biochemistry, Faculty of Medicine, Selcuk University, Konya, Turkey; 3Department of Biostatistics, Faculty of Medicine, Karabuk University, Karabuk, Turkey
Objectives: The purpose of the present study was to evaluate the association between the red blood cell distribution width (RDW) and the Glasgow Coma Scale (GCS), Canadian Neurological Scale (CNS), and National Institutes of Health Stroke Scale (NIHSS) scores in patients who had acute ischemic stroke.
Methods: This prospective observational cohort study included 88 patients who have had acute ischemic stroke and a control group of 40 patients who were evaluated in the Emergency Department for disorders other than acute ischemic stroke. All subjects had RDW determined, and stroke patients had scoring with the GCS, CNS, and NIHSS scores. The GCS, CNS, and NIHSS scores of the patients were rated as mild, moderate, or severe and compared with RDW.
Results: Stroke patients had significantly higher median RDW than control subjects. The median RDW values were significantly elevated in patients who had more severe rather than milder strokes rated with all three scoring systems (GCS, CNS, and NIHSS). The median RDW values were significantly elevated for patients who had moderate rather than mild strokes rated by GCS and CNS and for patients who had severe rather than mild strokes rated by NIHSS. The area under the receiver operating characteristic curve was 0.760 (95% confidence interval, 0.676–0.844). Separation of stroke patients and control groups was optimal with RDW 14% (sensitivity, 71.6%; specificity, 67.5%; accuracy, 70.3%).
Conclusion: In stroke patients who have symptoms <24 hours, the RDW may be useful in predicting the severity and functional outcomes of the stroke.
Keywords: cerebrovascular accident, hematology, prognosis, severity
Introduction
The red blood cell distribution width (RDW) is a measure of the variation of red blood cell volume. The RDW is the variation coefficient of the standard deviation of the curve of red blood cell volume distribution. It is a parameter that is easily and inexpensively determined by automated flow cytometry as part of a complete blood count. The normal values of RDW range between 11.5% and 14.5%.1,2 The RDW is a measure of the variation of red blood cell volume and is used in the differentiation of anemias, and high RDW values occur when there is wide variation in the morphology and size of red blood cells.3 High RDW levels may be observed in various disorders such as hemolysis that causes premature release of reticulocytes, iron deficiency, vitamin B12 deficiency, folic acid deficiency, and ineffective hematopoiesis with reduced release of erythrocytes from the bone marrow. The RDW levels are also elevated in pregnancy, thrombotic thrombocytopenic purpura, and inflammatory bowel disease.4,5 High RDW levels also may be associated with elevated levels of inflammatory tests such as C-reactive protein (CRP), erythrocyte sedimentation rate, and interleukin (IL) levels.6–8
In disorders other than anemia, the prognostic importance of high RDW levels previously received insufficient attention because of lack of knowledge. However, high RDW levels are associated with a poor prognosis in certain disorders such as acute myocardial infarction, stroke, and peripheral artery disease,9,10 and RDW is a predictor of mortality in patients who have cardiovascular disease, cancer, chronic lung disease, symptomatic chronic congestive cardiac insufficiency, acute stroke, or acute cardiac insufficiency.2,4,11 Some studies have reported that RDW is a diagnostic and prognostic marker in cardiovascular and thrombotic disorders and a marker of mortality risk in acute dyspnea, community-acquired pneumonia, and critical intensive care patients.1,9,12–14 The RDW may be used as a prognostic marker in stroke patients.15
Acute ischemic stroke, a clinical disorder caused by non-traumatic cerebrovascular disease, has an acute onset, frequently causes neurological deficit, and may persist >24 hours or can be fatal in <24 hours. Acute ischemic stroke is diagnosed by history, physical and neurological examination, and imaging methods. The diagnosis of acute ischemic stroke is based on cerebral imaging techniques, but biochemical examination of tissue damage can be an alternative strategy for early diagnosis. It would be helpful to have a biomarker to screen and identify patients who have had acute ischemic stroke, especially in patients before hospitalization who may be candidates for thrombolytic therapy. However, there is no widely used, rapidly determined, and sensitive biomarker of acute ischemic stroke.16 For prediction of the severity and mortality of acute ischemic stroke, scoring systems such as the Glasgow Coma Scale (GCS), Canadian Neurological Scale (CNS), and National Institutes of Health Stroke Scale (NIHSS) are used. These scoring systems quantify the severity of acute ischemic stroke based on the physical examination of patients.
The purpose of the present study was to evaluate the association between RDW, which was performed routinely in the central laboratory of our hospital, and the GCS, CNS, and NIHSS scores in patients who have had acute ischemic stroke.
Materials and methods
Patients
This prospective observational cohort study was performed at the Emergency Department, Medical School Hospital, Selçuk University, Konya, Turkey, between January 2014 and June 2014. Patients who were considered for inclusion in the study presented with symptoms <24 hours and were diagnosed with acute ischemic stroke based on the history, physical examination, computed tomography (CT) scan that was performed at the Emergency Department, and diffusion-weighted magnetic resonance imaging scan performed during the first 24 hours of symptoms. Patients were excluded for age <18 years; CT diagnosis of cerebral hemorrhage, subdural hematoma, intracerebral mass, or cerebrovascular damage secondary to trauma; presence of infection, known immunological disorders, malignancy, or pregnancy; or presence of hemoglobinopathy or other conditions that may be associated with abnormal RDW such as sickle cell anemia, thalassemia, or other anemias or current use of iron, folic acid, or vitamin B12 supplements.
There were 88 acute ischemic stroke patients who were included in the study. The control group included 40 patients who presented to the Emergency Department with various complaints and were diagnosed as having disorders other than acute ischemic stroke, confirmed by clinical findings, laboratory tests, and imaging studies. Before starting the study, all patients and control subjects were informed about the study and provided written informed consent. The study was conducted in accordance with the principles of the Declaration of Helsinki and approved by the Institutional Review Committee on Human Research of Selçuk University Faculty of Medicine.
Evaluation
At the time of presentation, the patients underwent a physical examination, neurological examination, and scoring with the GCS, CNS, and NIHSS scores. The severity of stroke was graded as mild (NIHSS ≤8), moderate (NIHSS, 9–15), or severe (NIHSS ≥16).17 The severity of impaired level of consciousness was rated as mild (GCS, 15), moderate (GCS, 8–14), or severe (GCS ≤7).18 The severity of impaired neurological status was rated as mild (CNS, 8.5–10), moderate (CNS, 2.5–8), or severe (CNS, 0–2).19
On presentation, all patients had routine blood tests and 12-lead electrocardiograms. During the first hour of admission, blood samples were obtained in tubes that contained ethylenediaminetetraacetic acid and sent to the hospital biochemistry laboratory for complete blood count which included white blood cell count, red blood cell count, hemoglobin, hematocrit, mean corpuscular volume, RDW, and platelet count. The complete blood count was completed within 1 hour (Cell-Dyn 3700 Hematology Analyzer, Abbott Laboratories, Abbott Park, IL, USA). Anemia was defined as hemoglobin level <130 g/L in men and <120 g/L in women.20 The white blood cell count, red blood cell count, platelet count, and hemoglobin were measured using laser, flow cytometry, and spectrophotometry methods.
Statistical analyses
Descriptive statistics of continuous variables were obtained for the study and control groups. Non-parametric statistical methods were used because the RDW values did not have a normal distribution and transformation was not helpful. Within the patient groups, RDW values were compared for sex, hypertension, coronary artery disease, NIHSS score, and CNS score using Kruskal–Wallis test. The Mann–Whitney test was used for post hoc analysis. Receiver operating characteristic (ROC) curves were generated, and the area under the curve was used to determine the optimum cutoff points to separate the patient and control groups with RDW values. Statistical significance was defined by P≤0.05.
Results
Most stroke patients were men aged >65 years (Table 1). The stroke patients had significantly lower median values of mean arterial pressure and GCS score than control subjects (Table 1). There were no differences between stroke patients and control subjects in frequency of comorbidities or median laboratory test values except stroke patients had significantly higher median RDW than control subjects (Table 1).
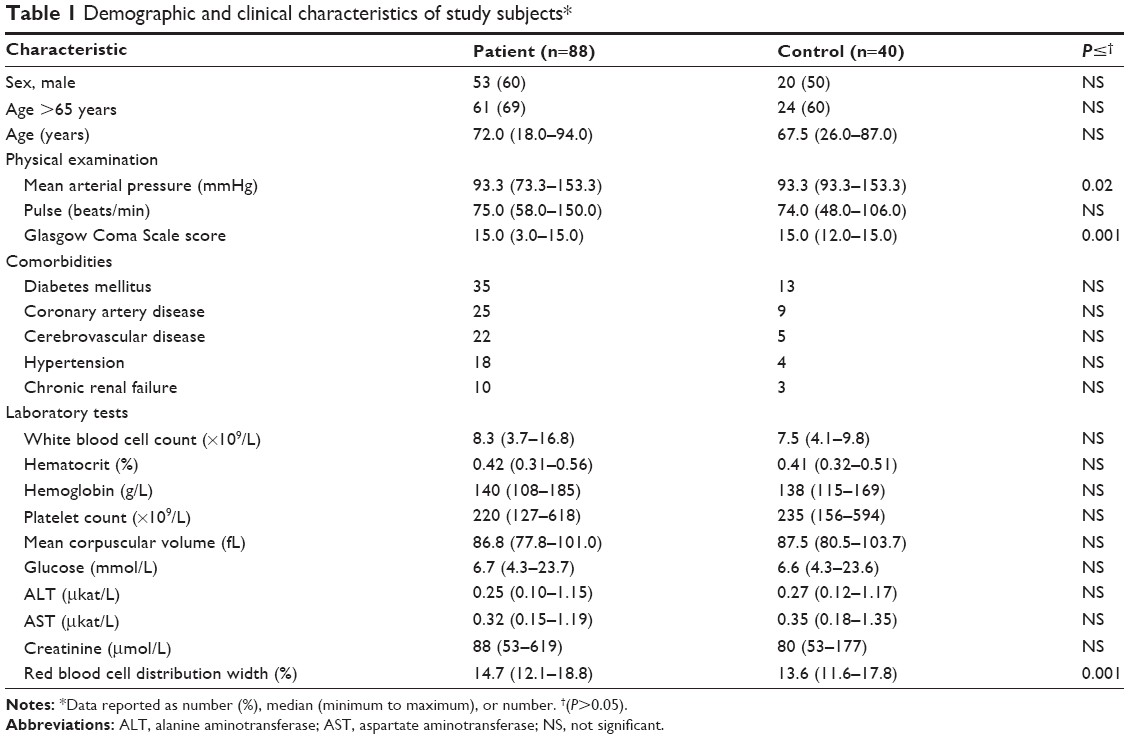 | Table 1 Demographic and clinical characteristics of study subjects* |
The median RDW values were significantly greater in patients who had more severe rather than milder strokes rated with all three scoring systems (GCS, CNS, and NIHSS) (Table 2). The median RDW values were significantly greater for patients who have had moderate rather than mild stroke rated by GCS and CNS and for patients who have had severe rather than mild stroke rated by NIHSS (Table 2).
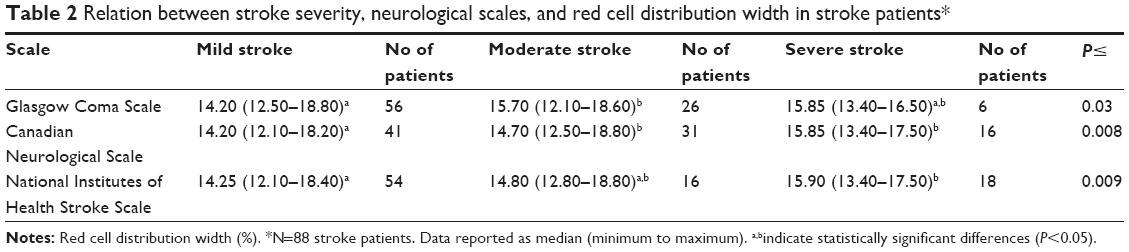 | Table 2 Relation between stroke severity, neurological scales, and red cell distribution width in stroke patients* |
The ROC analysis showed that the area under the ROC curve was 0.760 (95% confidence interval, 0.676–0.844) (Figure 1). Separation of stroke patients and control groups was optimal with RDW 14% (sensitivity, 71.6%; specificity, 67.5%; accuracy, 70.3%) (Table 3).
 | Figure 1 Receiver operating characteristic (ROC) curve for plasma red blood cell distribution width (RDW) in the diagnosis of stroke. |
 | Table 3 Sensitivity, specificity, predictive value, and accuracy of red cell distribution width for acute ischemic stroke |
Discussion
In this study, we assessed the association between RDW and the neurological scoring systems GCS, CNS, and NIHSS in acute ischemic stroke patients. Comparison of median RDW values showed significantly increased RDW associated with increased stroke severity with each scoring system (Table 2). Therefore, in stroke patients who had symptoms <24 hours, the RDW may be useful in predicting the severity and functional results of the stroke. High RDW values are associated with various medical disorders and malnutrition, and RDW at hospitalization is a predictor of early mortality.21 The present study suggests that RDW may have clinical importance because it may be an independent prognostic predictor in stroke.
Inflammation is important in the development of ischemic stroke, atherosclerosis, and ischemia. As a marker of inflammation, RDW is correlated with other inflammatory markers such as CRP.22,23 Inflammation may affect bone marrow function and iron metabolism. The inflammatory cytokines may cause elevated RDW levels by inhibiting red cell maturation and enabling the release of new and large reticulocytes to the circulation.12
High RDW is associated with failed red blood cell production because of deficiencies of iron, vitamin B12, or folate. Therefore, high RDW is an integrated risk factor for conditions of general suboptimal health associated with lower systemic corrective maintenance, recovery, and defense capacity.4 High oxidative stress may prolong the survival of red blood cells, increase the premature release of large red blood cells into the peripheral circulation, and cause elevation in RDW. Furthermore, inflammation may contribute to morphologic changes in red blood cells by changing membrane glycoproteins and ion channels.24,25 Chronic inflammation, oxidative stress, and neurohumoral activation may contribute to the development of atherosclerosis, and elevated RDW may be useful as a simple parameter to follow the development of atherosclerosis.
A study about the risk of stroke showed that RDW was an important hematologic index for stroke in patients who had cardiac insufficiency.26 In addition, high RDW is associated with the development of stroke and is strongly associated with cardiovascular causes and all causes of death in patients who are diagnosed with stroke.4 Another case-control study showed that RDW is a strong indicator of stroke.15 The present results extend the previous findings by showing an association between RDW and stroke severity using neurological scoring systems.
A short time from onset of complaints to presentation to the hospital is important for attempts to obtain effective reperfusion in patients who have had ischemic stroke. A major problem in these patients is the delay in diagnosis with clinical examination and imaging methods such as CT and magnetic resonance imaging. Therefore, a rapid blood test would be useful for the diagnosis of ischemic stroke. The optimal blood test would support the clinical findings and imaging results and provide information about cerebral damage. In addition, the test should be simple, rapid, inexpensive, and performed at the bedside. A specific blood marker that could be determined in the early stage of stroke in small hospitals would be useful to screen patients who may require further evaluation for diagnosis and treatment under emergency situations because of the risk of permanent neurological injury. However, many patients, including elderly patients, have multiple comorbidities and anemia from other causes; therefore, the RDW may not be adequately specific to screen for stroke in many patients.
The present data are consistent with the results of a previous study in stroke patients that showed a significant relation between NIHSS and RDW in univariate analysis (Table 2).27 Another previous study in patients who had hypertension showed that RDW >13.8% had high sensitivity (80%) and specificity (75%) in predicting non-dipping pattern hypertension.28 A study about migraine patients showed that RDW >13.2% had sensitivity 69% and specificity 61% for the diagnosis of migraine.29 In a follow-up study of 153 patients who had chronic cardiac insufficiency, RDW >15.2% had sensitivity 87% and specificity 74%, and the ROC curve for RDW had an area under the curve of 0.923.26 However, there are few studies available about the association between stroke and RDW, and there have been insufficient data about the cutoff values of RDW in the prediction of stroke. The present study showed an optimal RDW cutoff of 14% (Table 3) and area under the curve of 0.760 (Figure 1).
It may be difficult to predict functional results in patients who have had ischemic stroke. Numerous indicators of functional results have been suggested, and there is controversy about the most appropriate scale for evaluating the severity of stroke. The strongest indicators include patient age and scales that measure the severity of the neurological deficit such as NIHSS.30,31 The NIHSS and CNS, which are scales of stroke impairment, have been designed for prospective rating and are used in determining prognosis.32,33 Although NIHSS is frequently used by neurologists, it may be too complex for use by emergency specialists, general practitioners, or paramedics.34 In developing countries and hospitals that have limited neurology specialists, it may be more practical to evaluate stroke patients with CNS, which is less complex than NIHSS and has adequate reliability. It may be more appropriate to use NIHSS in specialized medical centers or in clinical studies that require detailed examination of patients.35
Although CNS may be simpler, easier to apply, and less comprehensive than NIHSS, the present study showed that the scores of NIHSS and CNS were similar in determining the severity of stroke. With all three scales tested (GCS, CNS, and NIHSS), stroke severity increased with an increase in RDW (Table 2).
Limitations of the present study include the limited number of patients. In addition, RDW was measured only once, and RDW may change with blood loss or hemolysis. Therefore, we could not evaluate fluctuations in RDW and variations in RDW with time. Furthermore, blood samples for assessing RDW were collected in one medical center, and blood samples collected from different populations may provide different RDW results. The data may have been confounded by the absence of testing for levels of iron, vitamin B12, and folic acid.
In summary, the present study showed that RDW, a widely used and inexpensive test, potentially is an important parameter for the diagnosis of stroke and may predict prognosis. We used GCS, CNS, and NIHSS to determine stroke severity and observed that increased stroke severity was associated with higher RDW. Therefore, RDW is a strong predictor for stroke severity. More studies are required to evaluate the association between ischemic stroke and hematologic parameters, assess the pathophysiology, and confirm the validity of the present results.
Disclosure
The authors declare no potential conflicts of interest with respect to the research, authorship, and/or publication of this article. This research received no specific grant from any funding agency in the public, commercial, or not-for-profit sectors.
References
Şenol K, Saylam B, Kocaay F, Tez M. Red cell distribution width as a predictor of mortality in acute pancreatitis. Am J Emerg Med. 2013;31(4):687–689. | ||
Sadaka F, O’Brien J, Prakash S. Red cell distribution width and outcome in patients with septic shock. J Intensive Care Med. 2013;28(5):307–313. | ||
Tonelli M, Sacks F, Arnold M, et al. Relation between red blood cell distribution width and cardiovascular event rate in people with coronary disease. Circulation. 2008;117(2):163–168. | ||
Ani C, Ovbiagele B. Elevated red blood cell distribution width predicts mortality in persons with known stroke. J Neurol Sci. 2009;277(1–2):103–108. | ||
Ye Z, Smith C, Kullo IJ. Usefulness of red cell distribution width to predict mortality in patients with peripheral artery disease. Am J Cardiol. 2011;107(8):1241–1245. | ||
Wheeler AP, Bernard GR. Treating patients with severe sepsis. N Engl J Med. 1999;340(3):207–214. | ||
Parrillo JE, Parker MM, Natanson C, et al. Septic shock in humans: advances in the understanding of pathogenesis, cardiovascular dysfunction, and therapy. Ann Intern Med. 1990;113(3):227–242. | ||
Perlstein TS, Weuve J, Pfeffer MA, Beckman JA. Red blood cell distribution width and mortality risk in a community-based prospective cohort. Arch Intern Med. 2009;169(6):588–594. | ||
Patel KV, Semba RD, Ferrucci L, et al. Red cell distribution width and mortality in older adults: a meta-analysis. J Gerontol A Biol Sci Med Sci. 2010;65(3):258–265. | ||
Dabbah S, Hammerman H, Markiewicz W, Aronson D. Relation between red cell distribution width and clinical outcomes after acute myocardial infarction. Am J Cardiol. 2010;105(3):312–317. | ||
Patel KV, Ferrucci L, Ershler WB, Longo DL, Guralnik JM. Red blood cell distribution width and the risk of death in middle-aged and older adults. Arch Intern Med. 2009;169(5):515–523. | ||
Ku NS, Kim HW, Oh HJ, et al. Red blood cell distribution width is an independent predictor of mortality in patients with gram-negative bacteremia. Shock. 2012;38(2):123–127. | ||
Hunziker S, Celi LA, Lee J, Howell MD. Red cell distribution width improves the simplified acute physiology score for risk prediction in unselected critically ill patients. Crit Care. 2012;16(3):R89. | ||
Montagnana M, Cervellin G, Meschi T, Lippi G. The role of red blood cell distribution width in cardiovascular and thrombotic disorders. Clin Chem Lab Med. 2011;50(4):635–641. | ||
Ramírez-Moreno JM, Gonzalez-Gomez M, Ollero-Ortiz A, Roa-Montero AM, Gómez-Baquero MJ, Constantino-Silva AB. Relation between red blood cell distribution width and ischemic stroke: a case-control study. Int J Stroke. 2013;8(6):E36. | ||
Jensen MB, Chacon MR, Sattin JA, Levine RL, Vemuganti R. Potential biomarkers for the diagnosis of stroke. Expert Rev Cardiovasc Ther. 2009;7(4):389–393. | ||
Muchada M, Rubiera M, Rodriguez-Luna D, et al. Baseline National Institutes of Health Stroke Scale-adjusted time window for intravenous tissue-type plasminogen activator in acute ischemic stroke. Stroke. 2014;45(4):1059–1063. | ||
Dinsmore J. Traumatic brain injury: an evidence-based review of management. Continuing Education in Anaesthesia, Critical Care and Pain. 2013;13(6):189–195. | ||
Saposnik G, Fang J, O’Donnell M, et al. Escalating levels of access to in-hospital care and stroke mortality. Stroke. 2008;39(9):2522–2530. | ||
World Health Organization. Indicators and Strategies for Iron Deficiency and Anemia Programmes. Report of the WHO/UNICEF/UNU Consultation. December 6–10; 1994; Geneva, Switzerland. | ||
Kho AN, Hui S, Kesterson JG, McDonald CJ. Which observations from the complete blood cell count predict mortality for hospitalized patients? J Hosp Med. 2007;2(1):5–12. | ||
Rost NS, Wolf PA, Kase CS, et al. Plasma concentration of C-reactive protein and risk of ischemic stroke and transient ischemic attack: the Framingham study. Stroke. 2001;32(11):2575–2579. | ||
Lippi G, Targher G, Montagnana M, Salvagno GL, Zoppini G, Guidi GC. Relation between red blood cell distribution width and inflammatory biomarkers in a large cohort of unselected outpatients. Arch Pathol Lab Med. 2009;133(4):628–632. | ||
Ghaffari S. Oxidative stress in the regulation of normal and neoplastic hematopoiesis. Antioxid Redox Signal. 2008;10(11):1923–1940. | ||
Song CS, Park DI, Yoon MY, et al. Association between red cell distribution width and disease activity in patients with inflammatory bowel disease. Dig Dis Sci. 2012;57(4):1033–1038. | ||
Kaya A, Isik T, Kaya Y, et al. Relationship between red cell distribution width and stroke in patients with stable chronic heart failure: a propensity score matching analysis. Clin Appl Thromb Hemost. 2015;21(2):160–165. | ||
Ntaios G, Gurer O, Faouzi M, Aubert C, Michel P. Red cell distribution width does not predict stroke severity or functional outcome. Int J Stroke. 2012;7(1):2–6. | ||
Ozcan F, Turak O, Durak A, et al. Red cell distribution width and inflammation in patients with non-dipper hypertension. Blood Press. 2013;22(2):80–85. | ||
Celikbilek A, Zararsiz G, Atalay T, Tanik N. Red cell distribution width in migraine. Int J Lab Hematol. 2013;35(6):620–628. | ||
Kwah LK, Harvey LA, Diong J, Herbert RD. Models containing age and NIHSS predict recovery of ambulation and upper limb function six months after stroke: an observational study. J Physiother. 2013;59(3):189–197. | ||
Pashapour A, Atalu A, Farhoudi M, et al. Early and intermediate prognosis of intravenous thrombolytic therapy in acute ischemic stroke subtypes according to the causative classification of stroke system. Pak J Med Sci. 2013;29(1):181–186. | ||
Bushnell CD, Johnston DC, Goldstein LB. Retrospective assessment of initial stroke severity: comparison of the NIH Stroke Scale and the Canadian Neurological Scale. Stroke. 2001;32(3):656–660. | ||
Inoa V, Aron AW, Staff I, Fortunato G, Sansing LH. Lower NIH Stroke Scale Scores Are Required to Accurately Predict a Good Prognosis in Posterior Circulation Stroke. Cerebrovasc Dis. 2014;37(4):251–255. | ||
Whelley-Wilson CM, Newman GC. A stroke scale for emergency triage. J Stroke Cerebrovasc Dis. 2004;13(6):247–253. | ||
Nilanont Y, Komoltri C, Saposnik G, et al. The Canadian Neurological Scale and the NIHSS: development and validation of a simple conversion model. Cerebrovasc Dis. 2010;30(2):120–126. |
 © 2015 The Author(s). This work is published and licensed by Dove Medical Press Limited. The
full terms of this license are available at https://www.dovepress.com/terms
and incorporate the Creative Commons Attribution
- Non Commercial (unported, 3.0) License.
By accessing the work you hereby accept the Terms. Non-commercial uses of the work are permitted
without any further permission from Dove Medical Press Limited, provided the work is properly
attributed. For permission for commercial use of this work, please see paragraphs 4.2 and 5 of our Terms.
© 2015 The Author(s). This work is published and licensed by Dove Medical Press Limited. The
full terms of this license are available at https://www.dovepress.com/terms
and incorporate the Creative Commons Attribution
- Non Commercial (unported, 3.0) License.
By accessing the work you hereby accept the Terms. Non-commercial uses of the work are permitted
without any further permission from Dove Medical Press Limited, provided the work is properly
attributed. For permission for commercial use of this work, please see paragraphs 4.2 and 5 of our Terms.