")
Back to Journals » Substance Abuse and Rehabilitation » Volume 14
Recovery Capital Gains May Precede Craving Reduction in Opioid Use Disorder
Authors Bormann NL , Weber AN , Miskle B, Arndt S, Lynch AC
Received 1 August 2023
Accepted for publication 3 October 2023
Published 5 October 2023 Volume 2023:14 Pages 113—118
DOI https://doi.org/10.2147/SAR.S433350
Checked for plagiarism Yes
Review by Single anonymous peer review
Peer reviewer comments 2
Editor who approved publication: Dr Rajendra D. Badgaiyan
Nicholas L Bormann,1 Andrea N Weber,2,3 Benjamin Miskle,2,4 Stephan Arndt,2,5 Alison C Lynch2,6
1Psychiatry and Psychology, Mayo Clinic Health System, Albert Lea, MN, USA; 2Psychiatry, University of Iowa, Iowa City, Iowa, USA; 3Internal Medicine, University of Iowa, Iowa City, Iowa, USA; 4Pharmacy, University of Iowa, Iowa City, Iowa, USA; 5Biostatistics, University of Iowa, Iowa City, Iowa, USA; 6Family Medicine, University of Iowa, Iowa City, Iowa, USA
Correspondence: Nicholas L Bormann, Psychiatry and psychology, Mayo Clinic Health System, 408 W Fountain St, Albert Lea, MN, 56007, USA, Tel +1 507 377 6411, Fax +1 507 377 6443, Email [email protected]
Purpose: Cravings for drugs and alcohol have been significantly associated with worse treatment outcomes. We investigated if improvements in recovery capital (RC) (eg, a measure of social capital/network, financial resources, education, and cultural factors) over time were associated with decreased reported cravings.
Patients and Methods: The original cohort consisted of 133 participants (63 females) with opioid use disorder seeking outpatient treatment, who completed the Assessment of Recovery Capital (ARC) (range 0 to 50) and the Brief Addiction Monitor (BAM) thrice over the 6-month study. Intervention was medication and case management. Analysis included one-way mixed models testing change over time for ARC total scores and single question craving rating (5-point Likert scale). Cross-lagged panel estimates used structural equation models with variables z-scored, allowing for path coefficient evaluation as standard deviations (sd).
Results: Total ARC significantly increased over the study (χ 2 = 33.77, df = 2, p < 0.0001), with baseline of 36.6 (n = 114, sd = 11.1) and 6-month of 41.2 (n = 107, sd = 9.5). Craving also changed significantly (χ 2 = 8.51, df = 2, p < 0.015), with baseline of 1.1 (n = 101, sd = 1.2) and 6-month of 0.9 (n = 107, sd = 1.1). The cross-lag from baseline RC to 3-month craving was significant (β = − 0.28, SE = 0.11, z = − 2.53, p < 0.011). The converse was not true; baseline craving did not affect later RC. Results were similarly significant when comparing 3-month to 6-month. The majority of sample was on buprenorphine.
Conclusion: As RC improves, the reported cravings at both 3- and 6-month study time points are significantly reduced. When evaluated inversely, there was not a significant association with baseline cravings and follow-up RC. Significant path coefficients provide an estimation of a directional effect from increased RC towards craving reduction.
Keywords: substance-related disorders, epidemiologic measurements, cohort studies, opiate substitution treatment, drug users
Introduction
Cravings, defined as an individual’s subjective experience or the intrusive thoughts relating to a desire to use a substance, have long been a focus of drug and alcohol research.1 Craving occurrence can be distressing and has been correlated with return to substance use after a period of sobriety. Alcohol-related cravings at residential treatment admission2 and discharge2,3 have been predictive of relapse one-year post-treatment. Similar findings are seen with cocaine, nicotine, and opioids—higher cravings are positively associated with their future use.4,5 In some studies, substance use craving has not predicted future use,1 however, this may be confounded by inconsistent measurement and varying follow-up.6
Craving for a substance is one criterion for the Diagnostic and Statistical Manual of Mental Disorders, Fifth Edition (DSM-5)7 diagnosis of a substance use disorder (SUD). Methadone and buprenorphine, full agonist and partial agonist medication treatments for opioid use disorder (OUD), are frequently titrated to target the reduction or elimination of opioid cravings.8 Naltrexone, a mu-opioid antagonist, is available for treatment of both OUD and alcohol use disorder (AUD), with positive impact seen on cravings.9 Nicotine-replacement therapies, such as patches, lozenges, or gum, are also commonly used to treat nicotine cravings in aid of tobacco cessation.
Formal scales exist to quantify cravings, such as the Penn Alcohol Craving Scale (PACS)10 and the Craving Scale.11 These are often Likert-based scales assessing domains of desire for substance use over the past day or week, the severity of peak cravings, the amount of time cravings are present, and the strength of environmental factors. While validated research scales exist, clinical assessment is commonly done through use of a single question,1 which may be a stand-alone measure such as a visual analog scale or part of a larger questionnaire like the Brief Addiction Monitor (BAM).12 Cravings may intensify with increased psychosocial stressors13 and substance-related cues, such as triggering visuals, experiences, or contexts,14 and regular assessment through measurement-based care may provide indication when increased support is needed.
Recovery from substance use is not evenly distributed across the population. Recovery capital (RC) attempts to quantify this and is the total of a person’s resources that they bring to bear on starting and maintaining their cessation of substance misuse.15 Previous research has identified a weak correlation between increased RC and decreased alcohol craving; however, a validated scale of RC was not used.16 RC is classically defined as four domains: 1) social capital, or the shared contacts and mutual responsibilities afforded to one by presence in a social network; 2) physical capital, or any financial asset that may be converted to resources to pay for medications and treatment or primary needs such as housing and clothing; 3) human capital, which encompasses one’s overall health, educational attainment and ability to meet goals; and 4) cultural capital, or the beliefs, expectations or lived experiences that arise from one’s membership within a specific group or culture.15 This historical perspective includes negative capital; however, there is support to move away from a valence-perspective and towards a conceptualization of strengths and barriers for recovery.17
When patients are engaged in treatment, illicit substance use decreases, while RC increases.18,19 Higher RC is also associated with decreased alcohol relapse rates in AUD20 and greater odds of past 30-day alcohol abstinence in OUD.21 We were unable to find any previous literature evaluating cravings and RC that utilized a validated RC scale. Considering the weak correlation previously shown,16 we looked to expand on these findings using a validated RC measure. We hypothesized that as RC improved, cravings for substance use would decrease over time.
Materials and Methods
Participants
Study recruitment occurred from December 2018 through August 2021 and has been previously described.18 The original dataset was 133 participants who were patients with an OUD seeking treatment at the University of Iowa (Iowa City, IA, USA) Medications for Addiction Treatment (MAT) Clinic, where they could receive both medication and case management services for substance use and other co-occurring mental health diagnoses. Clinic referral could be through self-referral, through other University of Iowa providers, through the emergency department or consult service within the hospital or through community partnerships. The primary intervention was participation in this clinic, which prioritized engagement over adherence. Specific to this evaluation, alcohol use was not a contraindication to initiation or continuation of medications for OUD (MOUD) per clinic practices.
Inclusion criteria were patients 18 years or older and had been diagnosed with an OUD, were enrolled in the MAT clinic, had spoken English proficiency adequate to participate in case management and were planning to continue care for at least 6 months. Patients self-reported demographic data. Case managers approached patients at clinic intakes and follow-ups who were eligible and invited them to participate in the study. Case managers conducted the BAM12 and the Assessment of Recovery Capital (ARC)22 at intake and both 3- and 6-month follow-ups. The BAM is a 17-item questionnaire that assesses an individual’s health, drug, and alcohol use. The only BAM question used was #8: “In the past 30 days, how much were you bothered by cravings or urges to drink alcohol or use drugs?” with possible responses of “Not at all”, “Slightly”, “Moderately”, “Considerably” and “Extremely”. The ARC is a 50-item questionnaire that assesses 10 domains of recovery strengths and is summed to a single score; each domain is scored 0 to 5, giving total scale range of 0 to 50. ARC assessment takes 5 to 10 minutes in total and has shown moderate test–retest reliability.22 For our sample, Cronbach’s alpha was 0.92 (95% CI: 0.90–0.94) based on the sum of the domain scores. The BAM was used instead of a specific craving scale as it was the only craving metric assessed for the cohort.
This study was approved by the University of Iowa Institutional Review Board for Human Subjects Research, and informed consent was obtained. This study complies with the Declaration of Helsinki. All study data were collected and managed using Research Electronic Data Capture (REDCap) tools hosted at the University of Iowa.23
Statistical Analysis
Means and standard deviations are provided for continuous variables. Frequencies and percentages are shown for categorical variables. For craving scores, 0 represented “Not at all”, 1 represented “Slightly”, and so on. One-way mixed models tested change over time for ARC total scores and ratings of craving. The model included the repeated measures, Baseline, 3-Month, and 6-Month follow-ups. Follow-up pairwise comparisons of model means used model-based t-tests.
Cases with data missing at later points were compared to cases with complete data on the ARC and craving ratings to assess selective attrition. For example, those with missing 3-Month ARC scores were contrasted with those with ARC scores on the Baseline ARC and craving ratings. There were no significant differences for later missing data based on the earlier measurements using unadjusted t-tests.
Cross-lagged panel estimates used structural equation models in the lavaan package24 for R version 4.2.1.25 The model included a random intercept for cases. Before this analysis, all variables were standardized to z-scores so that the path coefficients refer to standard deviation units. Additionally, the analysis used maximum likelihood estimates, robust standard errors, and a listwise selection of cases. For simplicity and to provide a semi-replication, two models were run. The first model included baseline and 3-month values, while the second model included 3-month and 6-month values. A more complex analysis using all three measurement times provided similar results but is not shown. Additional R packages utilized were car,26 emmeans27 and lmer.28
Results
The original sample consisted of 133 unique participants. From this cohort, we only used those that had non-missing data at either baseline and 3-months or 3-months and 6-months (n = 114). Patients’ ages ranged from 22 to 70 years, with a mean of 36.5 (sd = 9.3). The sample was nearly evenly split, with males providing 52.6% (n = 60) of the sample. Most patients were non-Hispanic Whites (87.7%), while 6.1% identified as Black/African American, 4.4% as Hispanic, and 1.8% as “Other”. Approximately 10% of participants had less than a high school diploma or equivalent, 30% had a high school diploma or equivalent, 40% had some college and 20% had a technical or bachelor’s degree. A third were employed full-time, 15% employed part-time, 8% were disabled with the remaining unemployed. All participants were either on buprenorphine-naloxone or buprenorphine monoproduct (dosing within Food and Drug Administration guidelines) except for one who was on naltrexone.
Patients’ total ARC significantly increased over the study (mixed model χ 2 = 33.77, df = 2, p < 0.0001), with baseline of 36.6 (n = 114, sd = 11.1), 3-month of 39.5 (n = 114, sd = 9.9) and 6-month of 41.2 (n = 107, sd = 9.5). Pairwise comparisons indicated that all measures differed, further suggesting improvement. Craving also changed significantly over the study period (mixed model χ 2 = 8.51, df = 2, p < 0.015), with baseline of 1.1 (n = 101, sd = 1.2), 3-month of 0.9 (n = 114, sd = 1.1), and 6-month of 0.9 (n = 107, sd = 1.1). Follow-up t-tests indicated that 3-month and 6-month cravings significantly differed from baseline; however, the change from 3-month to 6-month was not significant.
Figure 1 shows the results for the cross-lagged panel analysis predicting 3-month from baseline variables. At baseline, RC and craving were highly anticorrelated (r = −0.52, SE = 0.12, p < 0.001) but less so at 3 months (r = −0.14, SE = 0.10, p = 0.157). Of interest, the cross-lag from baseline RC to 3-month craving was significant (β = −0.28, SE = 0.11, z = −2.53, p < 0.011). The converse was not true, however. Baseline craving did not affect later RC (β = −0.13, SE = 0.08, z = 1.54, p < 0.13). While baseline RC effected later craving, craving did not show an effect on RC.
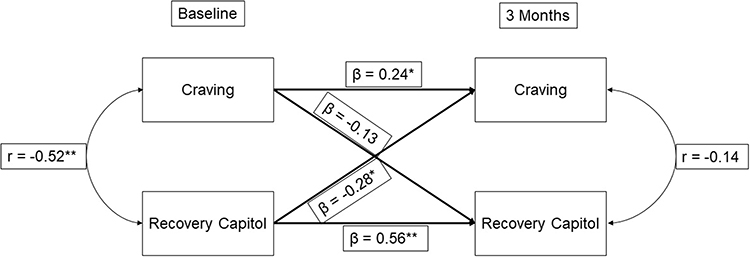 |
Figure 1 Path coefficients (standardized) – baseline to month 3. Notes: Recovery Capital = Assessment of Recovery Capital total score; Craving = Brief Addiction Monitor (BAM) question #8. n = 101, consisting of complete data sample used in analysis. *p < 0.05, **p < 0.01; r, Pearson’s correlation coefficient; β, pathway coefficient. |
When using values from month 3 to predict values at month 6, the results were essentially the same as baseline to month 3. RC at month 3 significantly affected craving (β = −0.19, SE = 0.09, z = −2.24, p < 0.03); however, month 3 craving did not significantly impact month 6 RC (β = −0.09, SE = 0.07, z = −1.32, p < 0.19) (Supplemental Figure 1). The pattern of the other relationships also held. While it would be interesting to compare the two cross-lagged results, the standard errors are too large and prevent this comparison.
Discussion
The study findings were consistent with the a priori hypothesis: as RC improves, there is a significant reduction in reported cravings at both 3- and 6-month study time points. When evaluated inversely, there was not a significant association with baseline cravings and follow-up RC. Additionally, the incorporation of path coefficients allows for an estimation of a directional effect. This provides support for the argument that RC growth can have a significant impact on patients’ subjective experience as quantified by cravings.
These findings concur with previous literature. In a study of 323 discharged patients 3 months following an inpatient stay at an alcohol treatment facility, 77 questions were identified as measuring aspects of RC. Using factor analysis, this was reduced to 23, with areas covered including religion, finances, relationships, housing, and substance use. They found a weak negative correlation between RC and alcohol craving at 3-month follow-up (r = −0.112, p = 0.044, n = 293).16 Our results build upon this data by using ARC, a validated measure of RC, in a cohort of treatment-seeking patients with OUD, over a longer period.
Cravings themselves are an important aspect of clinical assessment. Patients often report cravings as distressing and seek assistance in eliminating them. Increased cravings have been significantly associated with next-week alcohol use6 and opioid use.5 Regular assessment of both cravings and RC, intervening in areas where a deficit is noted, may therefore impact SUD outcomes. Higher RC has been previously significantly associated with lower risk substance use (in comparison to high risk)29 and improved quality of life,30 along with decreases in illicit substance use18 and self-reported crimes committed.19 RC’s effect on cravings may be reflecting changes in incentive salience,31 helping to drive motivational changes. Higher RC is reflecting an increase in recovery resources and strengths. Environmental cues that trigger expected rewards may be therefore easier to withstand and move past with these resource strengths. While treatment with MOUD and case management likely directly influences craving reductions, our findings suggest that at least a portion of this is influenced by RC.
Limitations
These findings do have significant limitations. The sample reported low-level cravings. This likely reflects methodology that allowed established clinic patients to participate. Nearly all individuals (99%) were on buprenorphine, with cravings being a frequent clinical assessment with goal of titration to minimize cravings balanced against side effects and/or FDA-approved dose limits. Although we do not have data to directly compare buprenorphine dosing distribution, based on this established clinic protocol, it is unlikely that elevations in cravings were due to buprenorphine underdosing. Additionally, the model included the baseline craving measure. Although the BAM is a validated tool, only one question addresses cravings. Comparison with validated scales, such as the Craving Scale,11 would increase generalizability. As the formal definition of a craving has not been universally agreed upon, a scale that assesses this from a multifaceted approach (such as duration, intensity, or context) may describe cravings in a more relevant way. Scales that are designed to be substance-specific may also provide additional information, as compared to the general craving question that BAM utilizes. Cravings are relatively ubiquitous across substances however, and decreases in these are consistent with treatment goals. Our model also lacked covariates. However, RC is a summary measure of a large number of factors that support recovery. A future study may set out to determine which factors (covariates) were most strongly associated with cravings. Our intervention was also not randomized. Having an arm without active case management or without MOUD could help delineate the impact of those specific interventions on RC. Our sample also consisted of a primarily White, homogenous cohort of treatment-seeking patients from an academic clinic at a tertiary hospital that draws from rural areas. We also lacked information on co-occurring diagnoses and use of other psychiatric medications, which may impact generalizability. We also did not look at sex differences due to the sample size; however, there is little support in the current literature that one sex may be more vulnerable to cravings or relapse than the other.32
Conclusion
We saw reductions in cravings for substance use at 3- and 6-months as RC increased in a primary OUD treatment-seeking cohort on buprenorphine maintenance treatment. Significant path coefficients provide an estimation for a directional effect stemming from increases in RC; however, limitations preclude full confidence in this. As cravings are often significantly associated with a return to substance use, psychosocial interventions that can be used concurrently with MAT may provide another mechanism for additional treatment options.
Acknowledgments
This work was supported by the Health Resources and Services Administration, Rockville, MD [grant number T25HP37624]; the Substance Abuse and Mental Health Services Administration located in Rockville, MD [grant numbers 6H79TI085118-01M001, 6H79TI083998-01M002, TI081620]; and the Iowa Department of Public Health located in Des Moines, IA [grant numbers 5881SA144E, 5881SA145E, and 5881SA137E].
Disclosure
The authors report no conflicts of interest in this work.
References
1. Tiffany ST, Wray JM. The clinical significance of drug craving. Ann N Y Acad Sci. 2012;1248(1):1–17. doi:10.1111/j.1749-6632.2011.06298.x
2. Schneekloth TD, Biernacka JM, Hall-Flavin DK, et al. Alcohol craving as a predictor of relapse. Am J Addict. 2012;21 Suppl 1:S20–6. doi:10.1111/j.1521-0391.2012.00297.x
3. Stohs ME, Schneekloth TD, Geske JR, Biernacka JM, Karpyak VM. Alcohol Craving Predicts Relapse After Residential Addiction Treatment. Alcohol Alcohol. 2019;54(2):167–172. doi:10.1093/alcalc/agy093
4. Vafaie N, Kober H. Association of Drug Cues and Craving With Drug Use and Relapse: a Systematic Review and Meta-analysis. JAMA Psychiatry. 2022;79(7):641–650. doi:10.1001/jamapsychiatry.2022.1240
5. McHugh RK, Fitzmaurice GM, Carroll KM, et al. Assessing craving and its relationship to subsequent prescription opioid use among treatment-seeking prescription opioid dependent patients. Drug Alcohol Depend. 2014;145:121–126. doi:10.1016/j.drugalcdep.2014.10.002
6. McHugh RK, Fitzmaurice GM, Griffin ML, Anton RF, Weiss RD. Association between a brief alcohol craving measure and drinking in the following week. Addiction. 2016;111(6):1004–1010. doi:10.1111/add.13311
7. American Psychiatric Association. Diagnostic and Statistical Manual of Mental Disorders.
8. Volkow ND, Blanco C. The changing opioid crisis: development, challenges and opportunities. Mol Psychiatry. 2021;26(1):218–233. doi:10.1038/s41380-020-0661-4
9. Ray LA, Green R, Roche DJO, Magill M, Bujarski S. Naltrexone effects on subjective responses to alcohol in the human laboratory: a systematic review and meta-analysis. Addict Biol. 2019;24(6):1138–1152. doi:10.1111/adb.12747
10. Flannery BA, Volpicelli JR, Pettinati HM. Psychometric properties of the Penn Alcohol Craving Scale. Alcohol Clin Exp Res. 1999;23(8):1289–1295. doi:10.1111/j.1530-0277.1999.tb04349.x
11. Weiss RD, Griffin ML, Hufford C. Craving in hospitalized cocaine abusers as a predictor of outcome. Am J Drug Alcohol Abuse. 1995;21(3):289–301. doi:10.3109/00952999509002698
12. Cacciola JS, Alterman AI, Dephilippis D, et al. Development and initial evaluation of the Brief Addiction Monitor (BAM). J Subst Abuse Treat. 2013;44(3):256–263. doi:10.1016/j.jsat.2012.07.013
13. Preston KL, Kowalczyk WJ, Phillips KA, et al. Context and craving during stressful events in the daily lives of drug-dependent patients. Psychopharmacology. 2017;234(17):2631–2642. doi:10.1007/s00213-017-4663-0
14. Preston KL, Kowalczyk WJ, Phillips KA, et al. Exacerbated Craving in the Presence of Stress and Drug Cues in Drug-Dependent Patients. Neuropsychopharmacology. 2018;43(4):859–867. doi:10.1038/npp.2017.275
15. Cloud W, Granfield R. Conceptualizing recovery capital: expansion of a theoretical construct. Subst Use Misuse. 2008;43(12–13):1971–1986. doi:10.1080/10826080802289762
16. Sterling R, Slusher C, Weinstein S. Measuring recovery capital and determining its relationship to outcome in an alcohol dependent sample. Am J Drug Alcohol Abuse. 2008;34(5):603–610. doi:10.1080/00952990802308114
17. Best D, Hennessy EA. The science of recovery capital: where do we go from here? Addiction. 2022;117(4):1139–1145. doi:10.1111/add.15732
18. Lynch AC, Weber AN, Hedden S, Sabbagh S, Arndt S, Acion L. Three-month outcomes from a patient-centered program to treat opioid use disorder in Iowa, USA. Subst Abuse Treat Prev Policy. 2021;16(1):8. doi:10.1186/s13011-021-00342-5
19. Bormann NL, Weber AN, Miskle B, Arndt S, Lynch AC. Recovery Capital Correlates With Less Methamphetamine Use and Crime in the Community. J Addict Med. 2023. doi:10.1097/ADM.0000000000001200
20. Gilbert PA, Soweid L, Kersten SK, et al. Maintaining recovery from alcohol use disorder during the COVID-19 pandemic: the importance of recovery capital. Drug Alcohol Depend. 2021;229(Pt A):109142. doi:10.1016/j.drugalcdep.2021.109142
21. Bormann NL, Weber AN, Arndt S, Lynch A. Improvements in recovery capital are associated with decreased alcohol use in a primary opioid use disorder treatment-seeking cohort. Am J Addict. 2023. doi:10.1111/ajad.13431
22. Groshkova T, Best D, White W. The Assessment of Recovery Capital: properties and psychometrics of a measure of addiction recovery strengths. Drug Alcohol Rev. 2013;32(2):187–194. doi:10.1111/j.1465-3362.2012.00489.x
23. Harris PA, Taylor R, Thielke R, Payne J, Gonzalez N, Conde JG. Research electronic data capture (REDCap)--a metadata-driven methodology and workflow process for providing translational research informatics support. J Biomed Inform. 2009;42(2):377–381. doi:10.1016/j.jbi.2008.08.010
24. Rosseel Y. lavaan: an R Package for Structural Equation Modeling. J Stat Softw. 2012;48(2):1–36. doi:10.18637/jss.v048.i02
25. R: a Language and Environment for Statistical Computing. R Foundation for Statistical Computing; 2022. Available from: https://www.R-project.org/.
26. Fox J, Weisberg S. An R Companion to Applied Regression.
27. Lenth RV. emmeans: estimated Marginal Means, aka Least-Squares Means. 2023.
28. Bates D, Machler M, Bolker BM, Walker SC. Fitting Linear Mixed-Effects Models Using lme4. J Stat Softw. 2015;67(1):1–48. doi:10.18637/jss.v067.i01
29. Eddie D, Bergman BG, Hoffman LA, Kelly JF. Abstinence versus moderation recovery pathways following resolution of a substance use problem: prevalence, predictors, and relationship to psychosocial well-being in a U.S. national sample. Alcohol Clin Exp Res. 2022;46(2):312–325. doi:10.1111/acer.14765
30. Laudet AB, White WL. Recovery capital as prospective predictor of sustained recovery, life satisfaction, and stress among former poly-substance users. Subst Use Misuse. 2008;43(1):27–54. doi:10.1080/10826080701681473
31. Koob GF, Volkow ND. Neurobiology of addiction: a neurocircuitry analysis. Lancet Psychiatry. 2016;3(8):760–773. doi:10.1016/S2215-0366(16)00104-8
32. Nicolas C, Zlebnik NE, Farokhnia M, Leggio L, Ikemoto S, Shaham Y. Sex Differences in Opioid and Psychostimulant Craving and Relapse: a Critical Review. Pharmacol Rev. 2022;74(1):119–140. doi:10.1124/pharmrev.121.000367
 © 2023 The Author(s). This work is published and licensed by Dove Medical Press Limited. The full terms of this license are available at https://www.dovepress.com/terms.php and incorporate the Creative Commons Attribution - Non Commercial (unported, v3.0) License.
By accessing the work you hereby accept the Terms. Non-commercial uses of the work are permitted without any further permission from Dove Medical Press Limited, provided the work is properly attributed. For permission for commercial use of this work, please see paragraphs 4.2 and 5 of our Terms.
© 2023 The Author(s). This work is published and licensed by Dove Medical Press Limited. The full terms of this license are available at https://www.dovepress.com/terms.php and incorporate the Creative Commons Attribution - Non Commercial (unported, v3.0) License.
By accessing the work you hereby accept the Terms. Non-commercial uses of the work are permitted without any further permission from Dove Medical Press Limited, provided the work is properly attributed. For permission for commercial use of this work, please see paragraphs 4.2 and 5 of our Terms.