Back to Journals » Diabetes, Metabolic Syndrome and Obesity » Volume 16
Real-World Effectiveness and Safety of Hydrogen Inhalation in Chinese Patients with Type 2 Diabetes: A Single-Arm, Retrospective Study
Authors Ji H, Zhao Z, Liu Z, Sun R, Li Y, Ding X, Ni T
Received 16 March 2023
Accepted for publication 8 June 2023
Published 5 July 2023 Volume 2023:16 Pages 2039—2050
DOI https://doi.org/10.2147/DMSO.S412898
Checked for plagiarism Yes
Review by Single anonymous peer review
Peer reviewer comments 2
Editor who approved publication: Prof. Dr. Antonio Brunetti
Hongxiang Ji,1 Ziyi Zhao,2 Zeyu Liu,3 Ruitao Sun,3 Yuquan Li,1 Xiaoheng Ding,2 Tongshang Ni4
1College of Traditional Chinese Medicine, Shandong University of Traditional Chinese Medicine, Jinan, People’s Republic of China; 2Department of Hand and Foot, Microsurgery, The Affiliated Hospital of Qingdao University, Qingdao, People’s Republic of China; 3School of Clinical Medicine, Department of Medicine, Qingdao University, Qingdao, People’s Republic of China; 4Center of Integrated Traditional Chinese and Western Medicine, School of Basic Medicine, Qingdao University, Qingdao, People’s Republic of China
Correspondence: Tongshang Ni, Center of Integrated Traditional Chinese and Western Medicine, School of Basic Medicine, Qingdao University, No. 308, Ningxia Road, Qingdao, Shandong, People’s Republic of China, Email [email protected] Xiaoheng Ding, Department of Hand and Foot, Microsurgery, The Affiliated Hospital of Qingdao University, No. 59, Haier Road, Qingdao, Shandong, People’s Republic of China, Email [email protected]
Aim: To evaluate the real-life effectiveness and safety of Chinese patients with type 2 diabetes mellitus (T2DM) receiving hydrogen inhalation (HI) treatment as a supplementary treatment.
Methods: This retrospective, multicenter, observational 6-months clinical study included T2DM patients maintaining HI, visited at 4 time points. The primary outcome is the mean change in glycated hemoglobin (HbA1c) at the end of the study compared to baseline. The secondary outcome is analyzing the mean change of fasting plasma glucose (FPG), weight, lipid profile, insulin dose and homeostasis model assessment. Linear regression and logistics regression are applied to evaluate the effect of HI after the treatment.
Results: Of the 431 patients comprised, it is observed a significant decrease in HbA1c level (9.04± 0.82% at baseline to 8.30± 0.99% and 8.00± 0.80% at the end, p< 0.001), FPG (165.6± 40.2 mg/dL at baseline to 157.1± 36.3mg/dL and 143.6± 32.3mg/dL at the end, p< 0.001), weight (74.7± 7.1kg at baseline to 74.8± 10.0kg and 73.6± 8.1kg at the end, p< 0.001), insulin dose (49.3± 10.8U/d at baseline to 46.7± 8.0U/d and 45.2± 8.7U/d, p< 0.001). The individuals in subgroup with higher baseline HbA1c and longer daily HI time duration gain greater HbA1c decrease after 6 months. Linear regression shows that higher baseline HbA1c level and shorter diabetes duration are significantly in relation to greater HbA1c reduction. Logistics regression reveals that lower weight is associated with a higher possibility of reaching HbA1c< 7%. The most common adverse event is hypoglycemia.
Conclusion: HI therapy significantly improves glycemic control, weight, insulin dose, lipid metabolism, β-cell function and insulin resistance of patients with type 2 diabetes after 6 months. Higher baseline HbA1c level and shorter diabetes duration is related to greater clinical response to HI.
Keywords: type 2 diabetes, observational study, hydrogen inhalation, glycemic control, real-world study
Introduction
As one of the most serious metabolic diseases, diabetes mellitus (DM) has influenced countless lives in the world, resulting in growing public health burden.1 It is estimated that over 366 million population would be plagued by DM in 2030.2 Type 2 diabetes mellitus (T2DM), as a chronic progressive disease, accounts for approximately 90% of cases of all diabetes. Meanwhile, T2DM is related to various cardiovascular and non-vascular diseases including infections, stroke diseases, cancers and nervous system dysregulation.3
Lifestyle amelioration and medical intervention act as the main role of reducing the T2DM occurrence and complications. Although metformin has been recommended as the first‑line T2DM therapy, the failure rate for metformin treatment is over 20% after 5-years usage.4,5 After insulin usage, the risk of weight gain and hypoglycemia is increasing, which lead to lower possibility of reaching optimal glycemic control.6 Despite the GLP-1RA is recommended as the first injectable medication, the compliance of T2DM patients is significantly lower in the real-world study (RWS) compared to randomized controlled trial (RCT).7–10While the pharmaceutical drug industry is updating greatly in recent years, developing novel therapeutic strategy for T2DM remains a major problem in medical field.
Molecular hydrogen, as an inert gas with ability of antioxidant, anti-inflammatory, anti-apoptotic and rapid diffuses, has been widely considered as an effective strategy for various diseases in the past few years.11,12 Recently, hydrogen has shown nonnegligible therapeutic effects in diabetes mellitus. It is reported that the supplement of hydrogen molecule significantly reduces FPG and improve insulin sensitivity in diabetic animal models.13–16 Kajiyama et al17 reveals that 4 of 6 patients with impaired glucose tolerance recover normal glucose tolerance after 8-week hydrogen treatment. LeBaron et al18 reports that 24-week intake of hydrogen-rich water leads to FPG decrease and 12% reduction of HbA1c in subjects with metabolic syndrome. The authors have previously demonstrated that the hydrogen inhalation (HI) therapy significantly improves the glycemic control of T2DM patients compared to control group in real-world setting.19
However, it remains unclear about the detailed treatment effect of HI in T2DM subjects. Therefore, this single-arm, real-world study is designed to evaluate the effectiveness and safety of HI and reinforce its therapeutic effect in Chinese T2DM patients, enriching the evidence base of HI treatment in patients with type 2 diabetes.
Materials and Methods
Study Design and Patient Population
This is an observational, single-arm, retrospective, multicenter study to examine the real-life effectiveness and safety of HI as a supplementary therapy in Chinese T2DM patients. We analyzed the data from the electronic health records database composed of the records of patients who kept HI for at least 6 months in the specific HI departments between October 2019 and October 2021 in Tsingtao, China. Hydrogen-producing machine (HZS-2700A, Qingdao Haizhisheng Corp., LTD, Tsingtao, China) provided pure hydrogen gas with the flow rate of 3.0 L/h. Subjects inhaled the hydrogen gas by nasal cannula at their convenience while the time period of each inhalation and the frequency was based on individual decision, in view of the high safety profile of hydrogen gas.20 After the inhalation, patient daily hydrogen gas intake conditions would be recorded systematically. The hydrogen gas flow rate of 3.0 L/h was selected as it was most frequently used by T2DM individuals.
Patients were included if they met the following criteria: (1) Chinese adults (≥18). (2) T2DM diagnosis. (3) kept HI throughout the study, which was defined as no less than 1 hour per day. (4) without previous experience of molecule hydrogen treatment before this study. (5) without change in hypoglycemic medication at least 2 months before the study began. Subjects were excluded if they were (1) type 1 diabetes patients. (2) maintaining malignant disease or severe gastric, intestinal, cardiac, hepatic, pancreatic and renal diseases. (3) concurrent participation in any other studies.
Data Collection and Assessments
The demographic, clinical and laboratory data were measured at 4 data visit points: in order to show subject previous treatment status, V0 is defined as the timepoint when patient latest anti-diabetic prescriptions were made before the study, which was without switching at least 2 months, V1 (baseline), V2 (3±1 month after the baseline) and V3 (6±1 month after the baseline).
Baseline characteristics including sex, age, body mass index (BMI), diabetes duration, blood pressure, heart rate, estimated glomerular filtration rate (eGFR), creatinine, hematocrit, uric acid, hypertension, dyslipidemia, microvascular and macrovascular complications were measured at V1. The investigator extracted the self-monitoring of blood glucose (SMBG) from the patient diary which was performed at 4 different time points a day including before and after breakfast, after lunch and dinner. HbA1c, HbA1c<7% proportion, FPG, triglyceride (TG), total cholesterol (TC), low-density lipoprotein (LDL), high-density lipoprotein (HDL), fasting c-peptide, homeostasis model assessment of insulin resistance (HOMA-IR), homeostasis model assessment of β-cell function (HOMA-β), weight, insulin dose, SMBG, HI situation and antidiabetic medicines were assessed at each time point. The assessment of HOMA model is performed in patients without insulin usage record throughout the study period. HOMA-IR and HOMA-β are calculated as: HOMA-IR=FPG (mg/dL) × FINS (μU/mL) / 405, HOMA-β= 360×FINS (μU/mL) / (FPG (mg/dL) – 63) (%).
Safety was analyzed by recording hypoglycemia, adverse event (AE) and serious adverse event (SAE) which were documented in the medical records by their attending physicians. Measured SMBG≤3.9 mmol/L (70 mg/dL) was considered documented hypoglycemia, meanwhile, symptoms consistent with hypoglycemia appearing at least once were recorded as symptomatic hypoglycemia, or asymptomatic hypoglycemia if not. Daytime hypoglycemia referred to hypoglycemia event that occurred at least once between 06:00 am and 11:59 pm or nocturnal hypoglycemia if not. Severe hypoglycemia was defined as symptomatic hypoglycemia requiring third-party intervention.
The primary endpoint of the study was the change of HbA1c from baseline to V3. The secondary endpoint included the change in FPG, the proportion of patients achieving HbA1c <7%, SMBG, weight, HOMA-IR, HOMA-β, fasting C-peptide, lipid profile and insulin dose from baseline to the end of the study. HbA1c was also assessed in a subgroup of patients by baseline HbA1c (<8.0%, ≥8.0 to <9.0%, and ≥9.0%) and average daily HI duration (<3h, ≥3 to <6h and ≥6h).
Ethics Approval
This trial was approved by the Ethics Committee of Medical College of Qingdao University (approval number: QDU-HEC-2022019). Written informed consents were collected from all the patients. The study was executed in line with the revised Declaration of Helsinki.
Statistical Analysis
A sample size of 325 patients is demanded to display statistically significant differences in HbA1c change after hydrogen treatment with a power of 95%, minimum expected reduction in HbA1c of 0.1%, SD of 0.5% and 0.05 in two-sided significant level.
Statistical analyses are performed with SPSS 26.0 (IBM Corp. Armonk, NY, USA). Numerical data are expressed as the mean ± standard deviation (SD). The data at different time points during treatment are compared by repeated-measures analysis of variance (ANOVA) or paired t-test. The Wilcoxon signed-rank test and Kruskal–Wallis H-test are used in the subgroup analysis of HbA1c based on baseline HbA1c or HI. Ordinal data are presented as frequency (percentage) analyzed by the χ2 test. Linear regression analysis is performed to evaluate baseline factors influencing the glycemic change after HI. Parameters affecting the HbA1c<7% are assessed by applying binary logistics regression. All statistical tests are two-tailed test and consider p-value <0.05 as statistically significant.
Result
General Patient Characteristics
A total number of 431 patients with T2DM was included in the study with 45.7% male, mean age of 59.3±9.3 years, mean diabetes duration of 11.2±3.3 years, mean body weight of 74.7±7.1 kg and mean BMI of 27.9±2.9 kg/m2 (Table 1). The average daily HI time duration was 4.9±1.1 h in 6-months treatment.
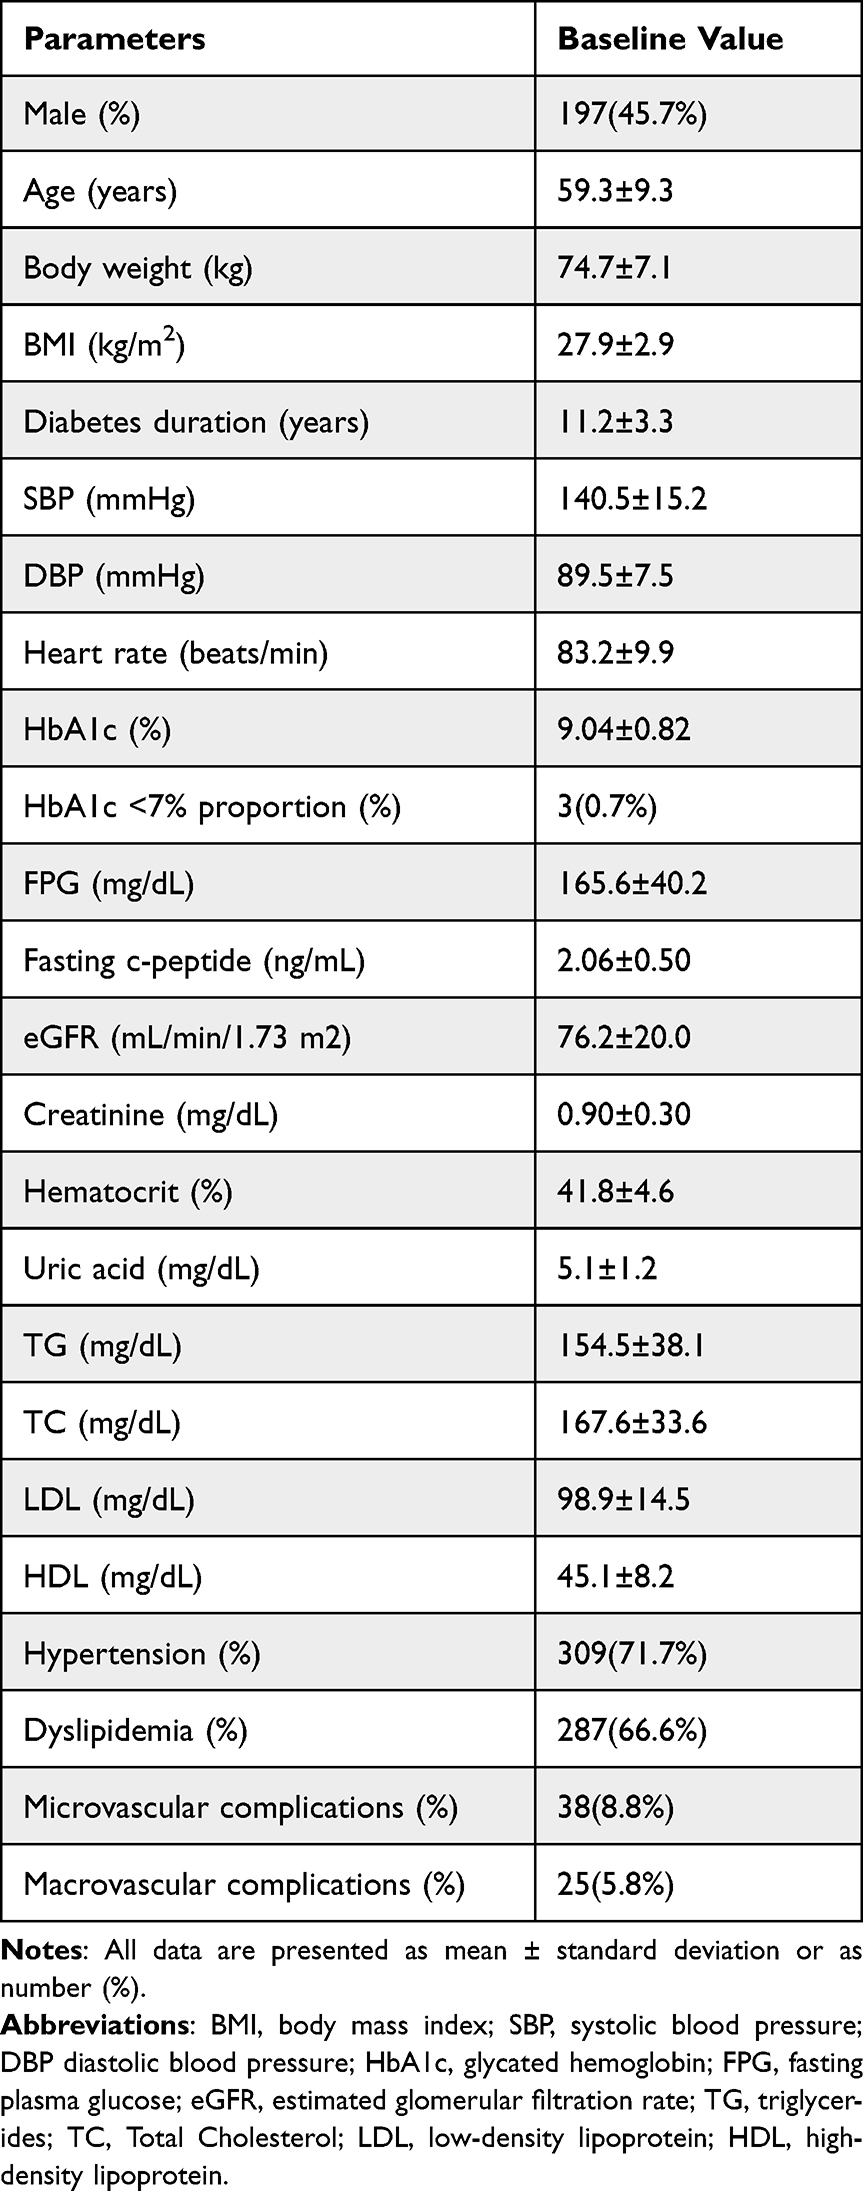 |
Table 1 Baseline Characteristics of the T2DM Patients in the Study (n=431) |
Effectiveness Evaluation
Compared to V0, the baseline level of HbA1c was significantly increased while the FPG showed no significant difference. HbA1c remained decreasing significantly from baseline (9.04±0.82%) to 8.30±0.99% at 3 months and 8.00±0.80% at 6 months (p<0.001) (Figure 1A). Compared to baseline (0.7%), subjects reaching HbA1c<7% were significantly increasing to 8.1% at 3 months (p<0.05) and 9.3% at 6 months (p<0.05), but no significant difference between 3 months and 6 months was observed. The subjects presented a significant decrease in FPG from 165.6±40.2mg/dL at baseline to 157.1±36.3 mg/dL at V2 and 143.6±32.3 mg/dL at V3 (p<0.001) (Figure 1B). The SMBG profile during the study is presented in Figure 2, which shows a significant reduction in each blood glucose monitor point during three visits (all p<0.001).
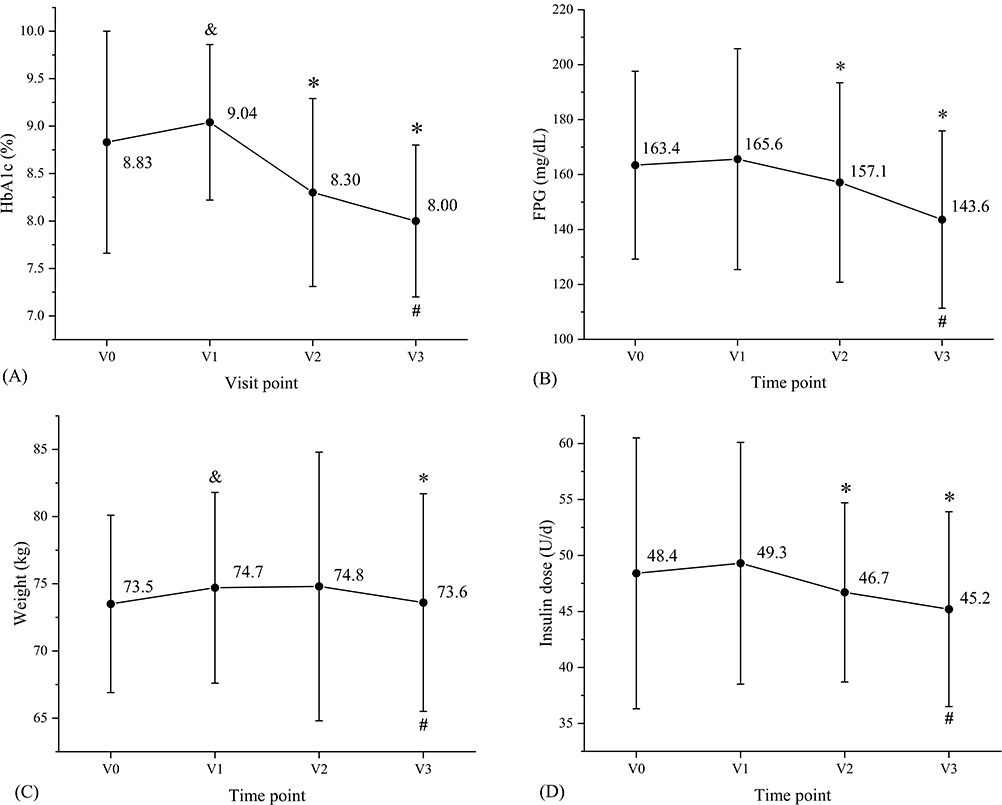 |
Figure 1 Comparation of HbA1c (A), FPG (B), weight (C), insulin dose (D) levels at different visit point during the study (n=431 except insulin dose n=280). Data are shown as mean ± sd. &p<0.05 represents V1 vs V0; *p < 0.05 vs V1; #p < 0.05 vs V2. Abbreviations: HbA1c, glycated hemoglobin; FPG, fasting plasma glucose. |
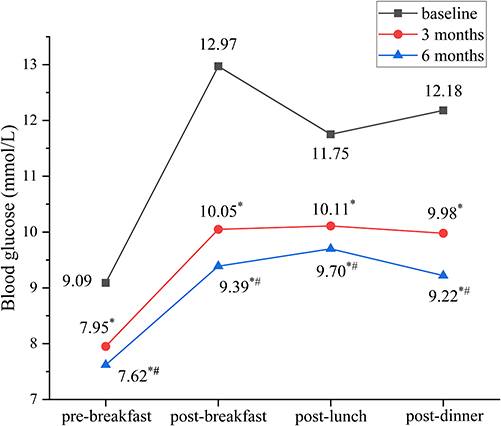 |
Figure 2 Change of daily glycemic profile at 4 time points from baseline to the study end (n=431). Data are shown as mean. *p < 0.05 vs baseline; #p < 0.05 vs 3 month. |
There was a significant increase in body weight at baseline in comparison with V0. The mean weight increased slightly from baseline (74.7±7.1kg) to V2 (74.8±10.0kg) with no significance, which reduced significantly to 73.6±8.1kg at V3 (p<0.001) (Figure 1C). The mean insulin dose kept decreasing significantly from 49.3±10.8 U/d at V1 to 46.7±8.0 U/d at V2 and 45.2±8.7 U/d at V3 (p<0.001) (Figure 1D).
Compared to V0, the baseline level of TG was increasing while it presented a significant reduction in HDL. TG increased significantly from 151.9±37.6mg/dL at V2 to 153.2±37.7mg/dL at the study end. It demonstrated a decrease in TC and LDL throughout the study (167.6±33.6mg/dL at V1, 160.2±32.5mg/dL at V2 and 153.0±26.3mg/dL at V3, p<0.001; 98.9±14.5mg/dL at V1, 95.5±15.2mg/dL at V2 and 94.9±14.3mg/dL at V3, p<0.001 separately). The level of HDL reduced from 45.1±8.5mg/dL at baseline to 44.1±6.7mg/dL at V2 while increased to 44.8±8.0mg/dL at V3 (p<0.001). HOMA-β maintained rising from 30.88±7.64% at V1 to 36.35±7.60% at V2 and 39.03±8.36% at V3 with p<0.001, while HOMA-IR kept decreasing during the study as well, reaching 2.92±0.83 at V3 from 3.70±0.87 at V1 and 3.27±0.89 at V2 (p<0.001). Fasting c-peptide significantly decreased from 2.06±0.50ng/mL at V1 to 2.01±0.54 ng/mL at V2 but increased to 2.03±0.52 ng/mL at V3 as shown in Figure 3.
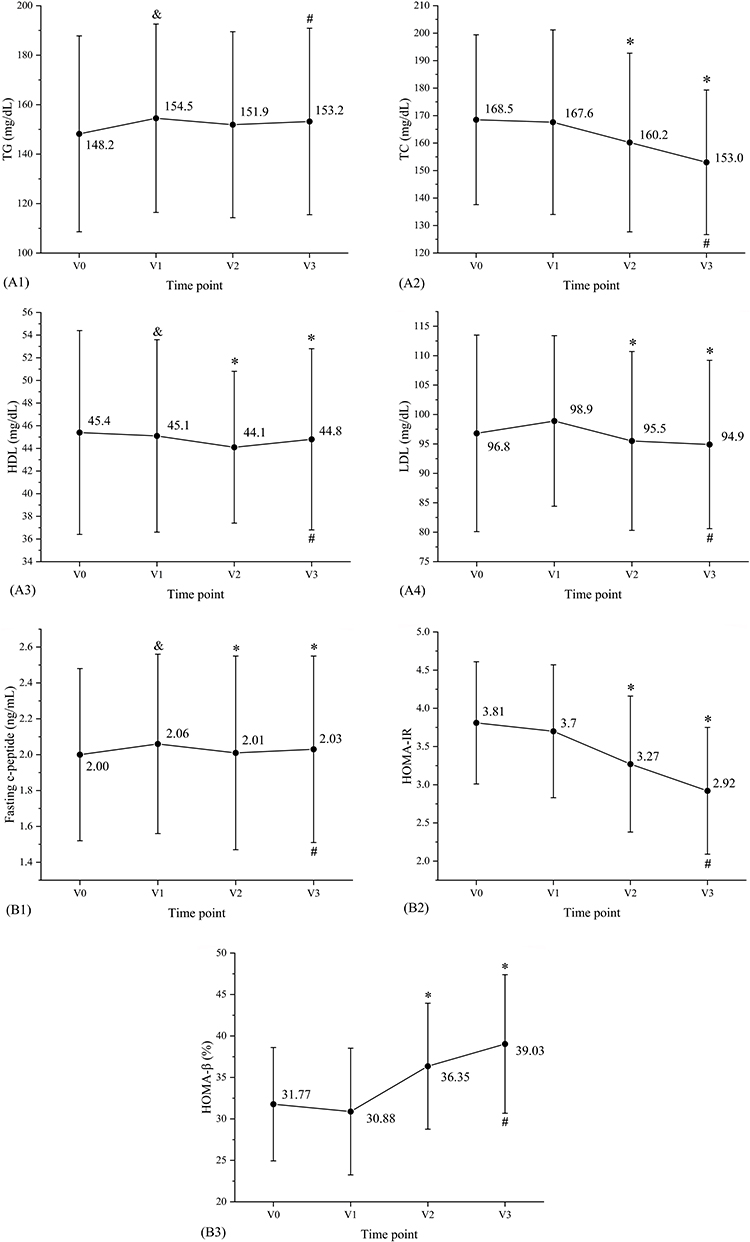 |
Figure 3 The difference of Lipid profile (A), islet function index (B) at 4 visit points during treatment (n=431 except islet function index n=151). Data are shown as mean ± sd. &p<0.05 represents V1 vs V0; *p < 0.05 vs V1; #p < 0.05 vs V2. Abbreviations: TG, triglycerides; TC, Total Cholesterol; LDL, low-density lipoprotein; HDL, high-density lipoprotein; HOMA-IR, homeostasis model assessment of insulin resistance; HOMA-β, homeostasis model assessment of β-cell function. |
During the study, individuals taking insulin accounted for the largest number of 65% and without altering each time point. While patients taking α-glucosidase inhibitor and SGLT-2 inhibitor kept rising, the number of subjects applying GLP-1 receptor agonists remained ascending. The utilization of hypoglycemic medication agents during the study is recorded in Table 2.
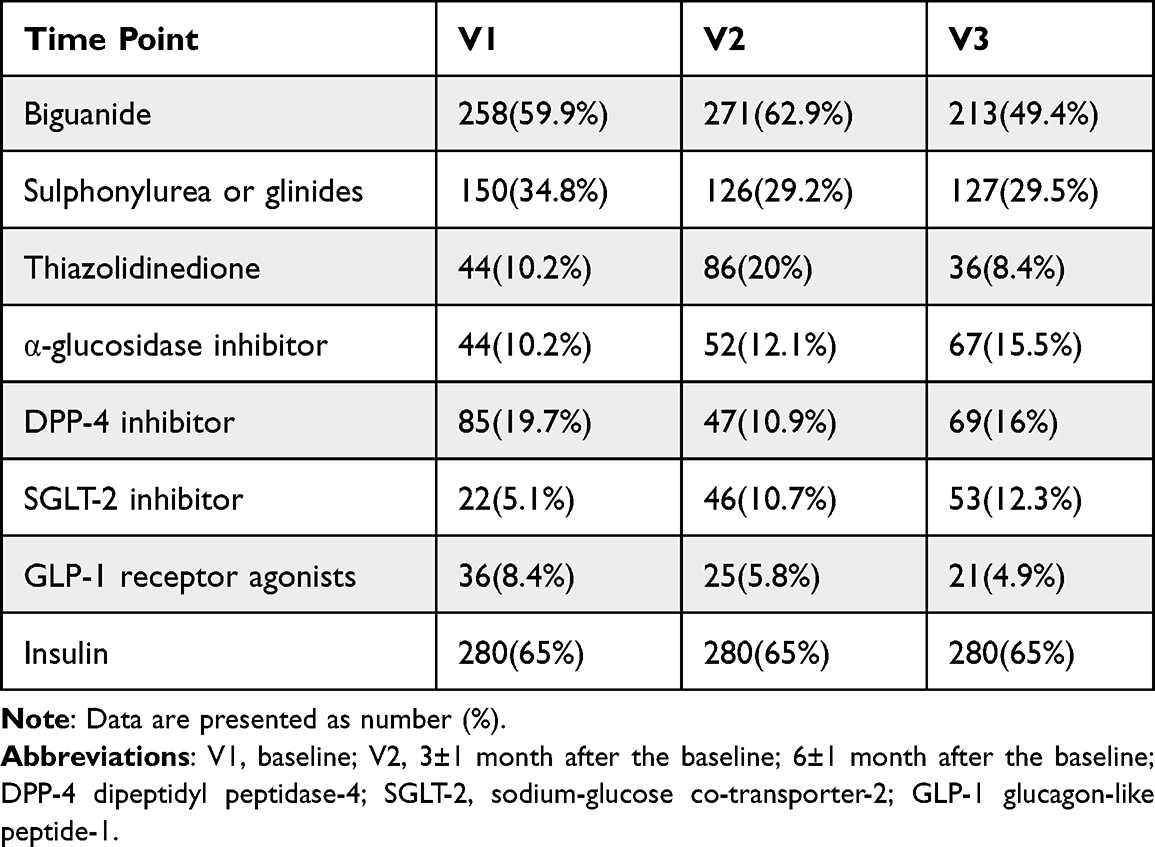 |
Table 2 Change in Anti-Diabetic Medication During the Study (n=431) |
The proportion of participants reaching different HbA1c levels at each visit point is displayed in Figure 4, revealing a growing number of individuals reaching HbA1c<8% throughout the study. In the subgroup analysis stratified by baseline HbA1c level, the greater HbA1c reduction at V3 was discovered in the higher HbA1c group compared to baseline (Figure 5A), but patients in HbA1c<8% group, although only 7.5% patients achieving HbA1c<7% at baseline, had succeeded in attaining HbA1c<7% at V3 completely while other groups failed. Meanwhile, in the subgroup analysis stratified by average HI duration per day, a further decrease of HbA1c at the last visit was observed in the longer HI group (Figure 5B). However, all the individuals who kept the least inhalation duration per day during the study have reached HbA1c<7% at V3. Interestingly, the average HI duration per day at different time points displays a significant upward trend (p<0.001).
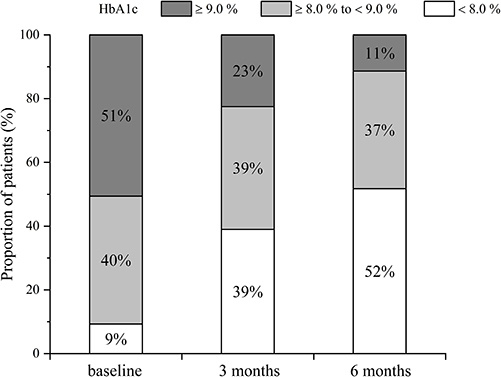 |
Figure 4 The proportion of participants maintaining different HbA1c levels at baseline and follow-up (n=431). |
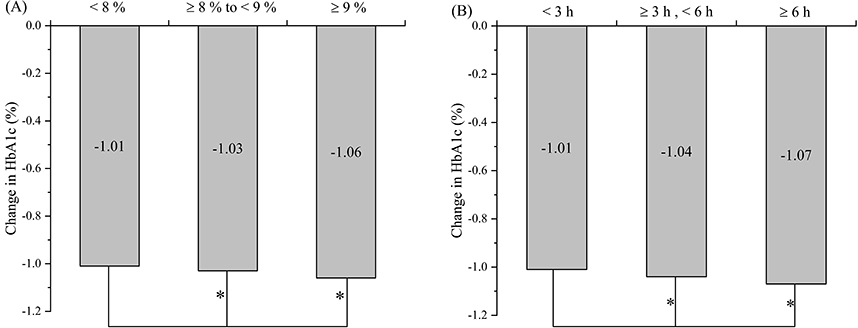 |
Figure 5 Change in HbA1c after the treatment stratified by glycemic control at baseline (A) and average duration of HI per day (B) (n=431). *p < 0.001. Abbreviation: HbA1c, glycated hemoglobin. |
Linear regression analysis was performed to assess the baseline predictive factors associated with HbA1c lowering effects by HI. In the univariate analysis, the higher baseline HbA1c, higher baseline weight and shorter diabetes duration were in relation to the decrease in HbA1c at V3 compared to baseline (Table 3). After including all the significant factors in the univariate analysis into the multivariate analysis, it presented that higher HbA1c level and shorter diabetes duration were the predictive factors independently and significantly, leading to HbA1c decrease in patients applying HI for at least 6 months. Binary logistic regression exploring the relation between baseline factors and reaching HbA1c<7% showed that the “<65kg” weight group gained the highest likelihood of achieving HbA1c<7%, while the “≥65kg to <75kg” group, “≥85kg” group and “≥75kg to <85kg” group attained lower possibility successively (p<0.01). However, characteristics of patients including age, gender and diabetes duration presented no significance.
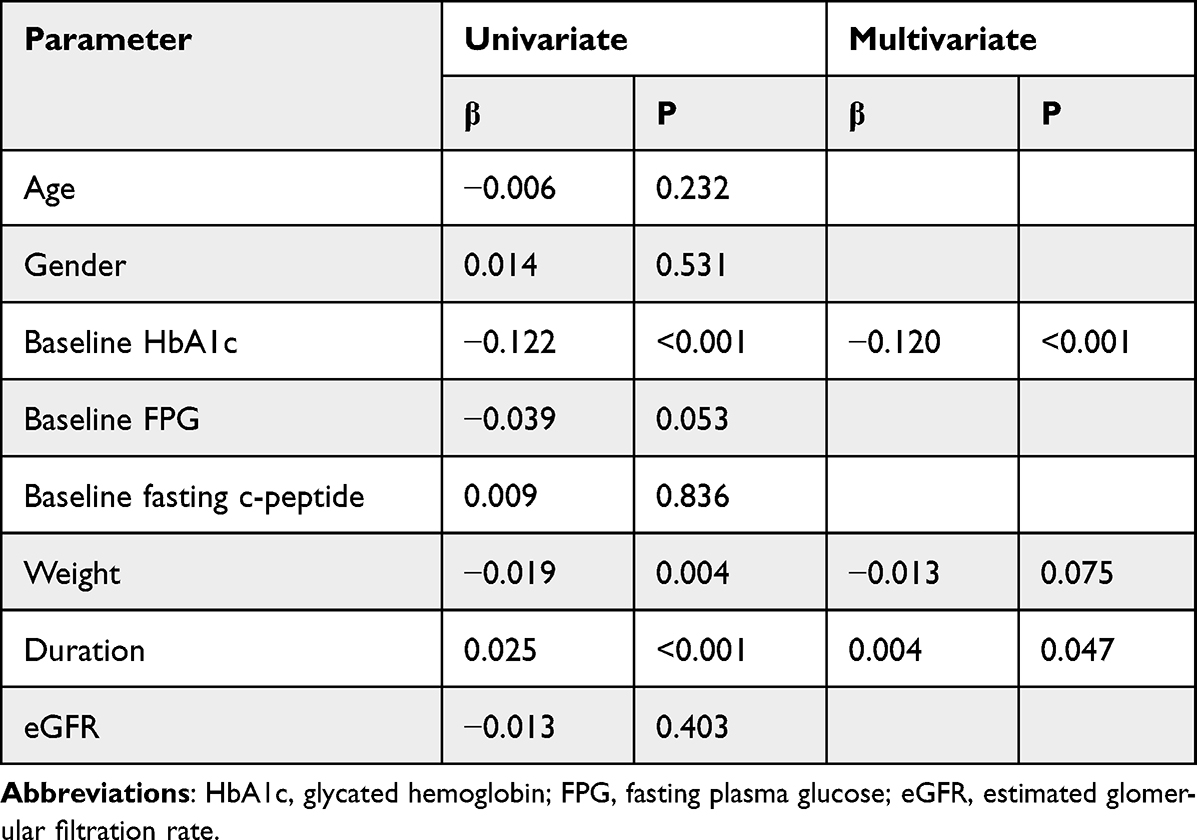 |
Table 3 Linear Regression Analysis of Baseline Parameters in Relation to HbA1c Change at the End of Study (n=431) |
Safety Outcome
The frequency of adverse event episode incidence is summarized in Table 4. In total, AEs were reported in 23 patients, among which 14 patients were recorded hypoglycemia during the study. Hypoglycemia was the most common adverse event, accounting for 3.2%. The gastrointestinal adverse event with an incidence of 1.8% was also observed during the study. There were no SAEs recorded throughout the whole study.
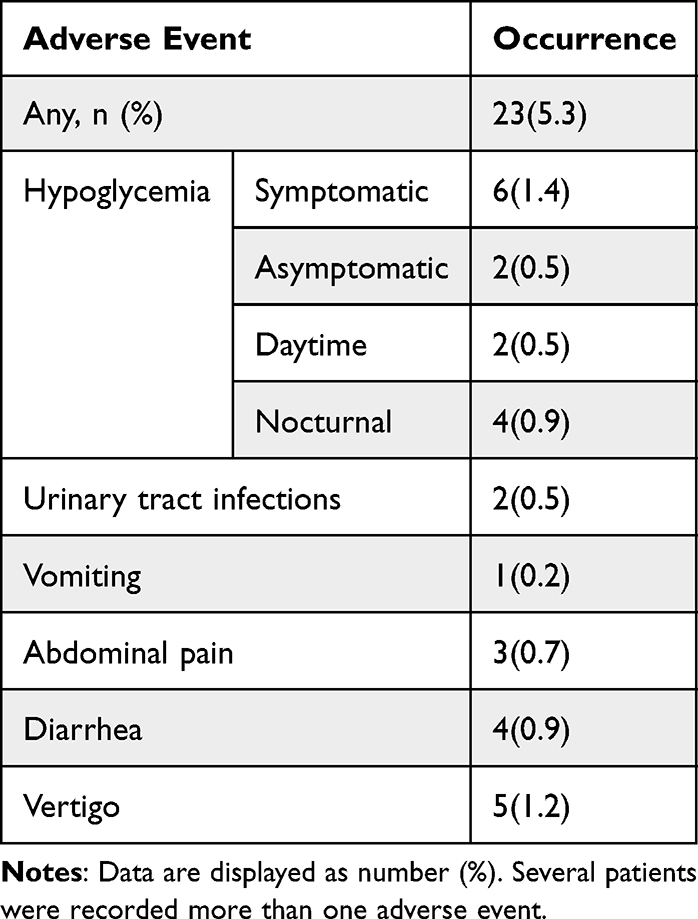 |
Table 4 Adverse Event Recorded Throughout the Study (n=431) |
Discussion
It has been observed that HbA1c, FPG and insulin dose remained decreasing throughout the study and body weight reduced compared to baseline. Lipid profile is partially ameliorated and insulin resistance is improved. The independent predictors of lowering the blood glucose by applying the HI treatment are higher baseline HbA1c and shorter diabetes duration.
Several parameters with pre-baseline records demonstrate the fact that patient previous treatments usually lead to insufficient control of blood glucose, lipid profile and insulin resistance. Compared to V0, the baseline level of HbA1c, TG, HDL and body weight deteriorate, while other parameters show no significant difference. It might account for the motivation of patients initiating HI treatment.
HbA1c remains decreasing significantly from baseline (9.04±0.82%) to 8.30±0.99% at 3 months and 8.00±0.80% at 6 months. Previous RCT reveals the fact that molecular hydrogen therapy improves HbA1c and FPG in individuals with metabolic syndrome after 24 weeks as well.18 However, it does not in accordance with another study utilizing hydrogen-rich water in 36 patients with type 2 diabetes, and the discrepancy could at least partially be explained by different hydrogen usage and sample size.17 Significant reduction in FPG from 165.6±40.2mg/dL at baseline to 157.1±36.3 mg/dL at V2 and 143.6±32.3 mg/dL at V3 is consistent with several previous animal researches.13,14,16 The SMBG profile displays a significant reduction in each blood glucose monitor point during three visits, as hydrogen gas is found to be able to lower blood glucose in animal model.15 The activation of phosphatidylinositol-3-OH kinase, protein kinase C, AMP-activated protein kinase might be relation to the glycemic amelioration.21
As overweight is a risk factor of T2DM,22 the mean weight has a slight increasing trend from baseline (74.7±7.1kg) to V2 (74.8±10.0kg) with no significance, which reduces significantly to 73.6±8.1kg at V3. However, previous study demonstrated that HI had no effect of the body weight of 10 overweight women in 4 weeks treatment.23 We assume that the difference might be caused by different sample size and short period, as the weight improvement was finally shown after treatment of 6 months in this study.
As T2DM patients frequently suffer from high blood glucose levels, insulin resistance and hyperinsulinemia, these factors are associated with abnormal lipid metabolism.24,25 HI could significantly reduce the TC and LDL levels after 6 months treatment, which is in accordance with previous studies applying hydrogen therapy.13,14,16 The reduction in TG is insignificant before the last visit, which might indict that this effect requires long period of treatment. Several studies also displayed that hydrogen-water could reduce plasma TG in diabetic animals,26 while it presented no significant effect in another similar study.21 Again, the difference might be partially due to different hydrogen administration methods. HDL acts as an important role which would reversely transport cholesterol.27 Interestingly, HDL decreased from V1 to V2, but increased at V3 significantly in current study. The therapeutic effect of molecular hydrogen in HDL is contradictory in previous RCTs of metabolic syndrome.18,28,29
HOMA-β keeps rising while HOMA-IR keeps decreasing during the study significantly, reflecting the recovery of insulin resistance and β-cell function. Similar effects have been reported in many previous studies.13,15–17 Hydrogen could suppress the ectopic deposition of lipids in liver tissue, an importance inducement for insulin resistance,30 which may account for the insulin resistance amelioration.14
In the subgroup analysis, a higher baseline HbA1c level is associated with a greater hypoglycemic effect, yet those in the lower baseline HbA1c group reached HbA1c<7% completely at the V3. Higher HI duration per day is related to a greater HbA1c lowering effect. However, all the objects in the shorter inhalation duration group achieved HbA1c<7%. It might result from the fact that individuals with lower HbA1c concentration do not require an overlong duration of HI to gain an ideal glycemic control. It is noteworthy that patient’s inhalation duration per day tends to extend, which may indict that subjects are willing to apply HI treatment, or to say, with great compliance.
In the multivariate regression analysis, it is observed that higher baseline HbA1c and shorter diabetes duration are independent hypoglycemic predictors. A lower weight is associated with a higher possibility of reaching HbA1c<7% by binary logistic regression.
Hypoglycemia adverse events are the most common AE with an incidence of 3.2%, while no severe adverse event is observed. Although few AEs were recorded, hydrogen treatment has been reported having high safety profile.20,31 The AE occurred in each patient is not recorded during the study.
The OH⋅, damaging the components of cell in lack of targeted detoxification route, is associated with cellular necrosis and apoptosis, and the selective elimination of the OH⋅ by molecular hydrogen may account for its therapeutic mechanism.32,33 It is reported that enhancing the expression of hepatic fibroblast growth factor 21 is related to diabetes and obesity improvement in previous study.26 Ming et al report that the suppression of TLR4/MyD88/NF-κB signaling by hydrogen might explain its benefit in blood glucose and lipid.13
This study has several limitations: firstly, lacking in control group restricts the study research, which limits the evaluation of the effectiveness and safety outcome of HI. Secondly, it is hard to control the usage of antidiabetic medication during the study due to its real-world nature, which might influence the therapeutic response of hydrogen treatment. Furthermore, although patient increasing time period of HI might suggest adherence to HI therapy, this study is lacking in direct measurement of medication adherence. In addition, our study population is solely limited to Chinese individuals which partly restricts the universality of the study findings. Lastly, fewer AEs might be neglected as it was extracted from medical records. In addition to these limitations, this real-life study offers important clinical data and provides valuable inspiration for anti-diabetic practice.
Conclusion
In brief, HI therapy is beneficial to the glycemic control of T2DM subjects in real-life medical environment, improving body weight, insulin dose, lipid profile, β-cell function and insulin resistance. Baseline HbA1c and diabetes duration could influence the HbA1c reduction. The HI therapy is a novel and effective treatment for T2DM.
Data Sharing Statement
The data presented in this study are available on request from the corresponding author. The data are not publicly available due to the containment of private demographic and clinical data of patients.
Acknowledgment
The authors declare great appreciation to Qingdao Haizhisheng Corp., LTD, Tsingtao, China, for providing access permission to the patient data.
Funding
This study is funded by Qingdao University, Qingdao, China (funding number: RH2200001592).
Disclosure
The authors have no conflict of interest.
References
1. Dabbah MA, Graham J, Petropoulos IN, Tavakoli M, Malik RA. Automatic analysis of diabetic peripheral neuropathy using multi-scale quantitative morphology of nerve fibres in corneal confocal microscopy imaging. Med Image Anal. 2011;15:738–747. doi:10.1016/j.media.2011.05.016
2. Copeland KC, Silverstein J, Moore KR, et al. Management of newly diagnosed type 2 diabetes mellitus (T2DM) in children and adolescents. Pediatrics. 2013;131:364–382. doi:10.1542/peds.2012-3494
3. Zaccardi F, Webb DR, Yates T, Davies MJ. Pathophysiology of type 1 and type 2 diabetes mellitus: a 90-year perspective. Postgrad Med J. 2016;92:63–69. doi:10.1136/postgradmedj-2015-133281
4. Inzucchi SE, Bergenstal RM, Buse JB, et al. Management of hyperglycemia in type 2 diabetes: a patient-centered approach. Diabetes Care. 2012;35:1364–1379. doi:10.2337/dc12-0413
5. Kahn SE, Haffner SM, Heise MA, et al. Glycemic durability of rosiglitazone, metformin, or glyburide monotherapy. N Engl J Med. 2006;355:2427–2443. doi:10.1056/NEJMoa066224
6. Ahrén B, Foley J, Bosi E. Clinical evidence and mechanistic basis for vildagliptin’s action when added to metformin. Diabetes Obes Metab. 2011;13:193–203. doi:10.1111/j.1463-1326.2010.01321.x
7. American Diabetes Association. 6. Glycemic targets: standards of medical care in diabetes-2020. Diabetes Care. 2020;43:S66–S76. doi:10.2337/dc20-S006
8. Mody R, Huang Q, Yu M, et al. Adherence, persistence, glycaemic control and costs among patients with type 2 diabetes initiating dulaglutide compared with liraglutide or exenatide once weekly at 12‐month follow‐up in a real‐world setting in the United States. Diabetes Obes Metab. 2019;21:920–929. doi:10.1111/dom.13603
9. Edelman SV, Polonsky WH. Type 2 diabetes in the real world: the elusive nature of glycemic control. Diabetes Care. 2017;40:1425–1432. doi:10.2337/dc16-1974
10. Davies MJ, D’Alessio DA, Fradkin J, et al. Management of hyperglycaemia in type 2 diabetes, 2018. A consensus report by the American Diabetes Association (ADA) and the European Association for the Study of Diabetes (EASD). Diabetologia. 2018;61:2461–2498. doi:10.1007/s00125-018-4729-5
11. Ohta S. Molecular hydrogen as a preventive and therapeutic medical gas: initiation, development and potential of hydrogen medicine. Pharmacol Ther. 2014;144:1–11. doi:10.1016/j.pharmthera.2014.04.006
12. Huang CS, Kawamura T, Toyoda Y, Nakao A. Recent advances in hydrogen research as a therapeutic medical gas. Free Radic Res. 2010;44:971–982. doi:10.3109/10715762.2010.500328
13. Ming Y, Ma QH, Han XL, Li HY. Molecular hydrogen improves type 2 diabetes through inhibiting oxidative stress. Exp Ther Med. 2020;20:359–366. doi:10.3892/etm.2020.8708
14. Zheng M, Yu H, Xue Y, et al. The protective effect of hydrogen-rich water on rats with type 2 diabetes mellitus. Mol Cell Biochem. 2021;476:3089–3097. doi:10.1007/s11010-021-04145-x
15. Zhang XL, Liu J, Jin K, et al. Subcutaneous injection of hydrogen gas is a novel effective treatment for type 2 diabetes. J Diabetes Investig. 2018;9:83–90. doi:10.1111/jdi.12674
16. Wang QJ, Zha X-J, Kang Z-M, et al. Therapeutic effects of hydrogen saturated saline on rat diabetic model and insulin resistant model via reduction of oxidative stress. Chin Med J. 2012;125:1633–1637. doi:10.3760/cma.j.issn.0366-6999.2012.09.020
17. Kajiyama S, Hasegawa G, Asano M, et al. Supplementation of hydrogen-rich water improves lipid and glucose metabolism in patients with type 2 diabetes or impaired glucose tolerance. Nutr Res. 2008;28:137–143. doi:10.1016/j.nutres.2008.01.008
18. LeBaron TW, Singh R, Fatima G, et al. The effects of 24-week, high-concentration hydrogen-rich water on body composition, blood lipid profiles and inflammation biomarkers in men and women with metabolic syndrome: a randomized controlled trial. Diabetes Metab Syndr Obes. 2020;13:889–896. doi:10.2147/dmso.S240122
19. Zhao ZY, Ji H, Zhao Y, et al. Effectiveness and safety of hydrogen inhalation as an adjunct treatment in Chinese type 2 diabetes patients: a retrospective, observational, double-arm, real-life clinical study. Front Endocrinol. 2023;13. doi:10.3389/fendo.2022.1114221
20. LeBaron TW, Laher I, Kura B, Slezak J. Hydrogen gas: from clinical medicine to an emerging ergogenic molecule for sports athletes. Can J Physiol Pharmacol. 2019;97:797–807. doi:10.1139/cjpp-2019-0067
21. Amitani H, Asakawa A, Cheng K, et al. Hydrogen improves glycemic control in type1 diabetic animal model by promoting glucose uptake into skeletal muscle. PLoS One. 2013;8:e53913. doi:10.1371/journal.pone.0053913
22. Hegazi R, El-Gamal M, Abdel-Hady N, Hamdy OJ. Epidemiology of and risk factors for type 2 diabetes in Egypt. Ann Glob Health. 2015;81:814–820. doi:10.1016/j.aogh.2015.12.011
23. Korovljev D, Trivic T, Drid P, Ostojic SM. Molecular hydrogen affects body composition, metabolic profiles, and mitochondrial function in middle-aged overweight women. Ir J Med Sci. 2018;187:85–89. doi:10.1007/s11845-017-1638-4
24. Aslam M, Aggarwal S, Sharma KK, Galav V, Madhu SV. Postprandial hypertriglyceridemia predicts development of insulin resistance glucose intolerance and type 2 diabetes. PLoS One. 2016;11:e0145730. doi:10.1371/journal.pone.0145730
25. Qiu J, Liu Y, Yue Y, Qin Y, Li Z. Dietary tartary buckwheat intake attenuates insulin resistance and improves lipid profiles in patients with type 2 diabetes: a randomized controlled trial. Nutr Res. 2016;36:1392–1401. doi:10.1016/j.nutres.2016.11.007
26. Kamimura N, Nishimaki K, Ohsawa I, Ohta SJO. Molecular hydrogen improves obesity and diabetes by inducing hepatic FGF21 and stimulating energy metabolism in db/db mice. Obesity. 2011;19:1396–1403. doi:10.1038/oby.2011.6
27. Fisher EA, Feig JE, Hewing B, Hazen SL, Smith JD. High-density lipoprotein function, dysfunction, and reverse cholesterol transport. Arterioscler Thromb Vasc Biol. 2012;32:2813–2820. doi:10.1161/ATVBAHA.112.300133
28. Song GH, Li M, Sang H, et al. Hydrogen-rich water decreases serum LDL-cholesterol levels and improves HDL function in patients with potential metabolic syndrome. J Lipid Res. 2013;54:1884–1893. doi:10.1194/jlr.M036640
29. Nakao A, Toyoda Y, Sharma P, Evans M, Guthrie N. Effectiveness of hydrogen rich water on antioxidant status of subjects with potential metabolic syndrome-an open label pilot study. J Clin Biochem Nutr. 2010;46:140–149. doi:10.3164/jcbn.09-100
30. Snel M, Jonker JT, Schoones J, et al. Ectopic fat and insulin resistance: pathophysiology and effect of diet and lifestyle interventions. Int J Endocrinol. 2012;2012:983814. doi:10.1155/2012/983814
31. Yoritaka A, Kobayashi Y, Hayashi T, Saiki S, Hattori N. Randomized double-blind placebo-controlled trial of hydrogen inhalation for Parkinson’s disease: a pilot study. Neurol Sci. 2021;42:4767–4770. doi:10.1007/s10072-021-05489-4
32. Ohsawa I, Ishikawa M, Takahashi K, et al. Hydrogen acts as a therapeutic antioxidant by selectively reducing cytotoxic oxygen radicals. Nat Med. 2007;13:688–694. doi:10.1038/nm1577
33. Hong Y, Chen S, Zhang JM. Hydrogen as a selective antioxidant: a review of clinical and experimental studies. J Int Med Res. 2010;38:1893–1903. doi:10.1177/147323001003800602
 © 2023 The Author(s). This work is published and licensed by Dove Medical Press Limited. The
full terms of this license are available at https://www.dovepress.com/terms
and incorporate the Creative Commons Attribution
- Non Commercial (unported, 3.0) License.
By accessing the work you hereby accept the Terms. Non-commercial uses of the work are permitted
without any further permission from Dove Medical Press Limited, provided the work is properly
attributed. For permission for commercial use of this work, please see paragraphs 4.2 and 5 of our Terms.
© 2023 The Author(s). This work is published and licensed by Dove Medical Press Limited. The
full terms of this license are available at https://www.dovepress.com/terms
and incorporate the Creative Commons Attribution
- Non Commercial (unported, 3.0) License.
By accessing the work you hereby accept the Terms. Non-commercial uses of the work are permitted
without any further permission from Dove Medical Press Limited, provided the work is properly
attributed. For permission for commercial use of this work, please see paragraphs 4.2 and 5 of our Terms.
Recommended articles
Poor Self-Care Practices and Being Urban Resident Strongly Predict Chronic Complications Among Patients with Type 2 Diabetes in Eastern Ethiopia: A Hospital-Based Cross-Sectional Study
Letta S, Aga F, Yadeta TA, Geda B, Dessie Y
Diabetes, Metabolic Syndrome and Obesity 2022, 15:2095-2106
Published Date: 20 July 2022
Red Blood Cell Parameters and Their Correlation with Glycemic Control Among Type 2 Diabetic Adult Patients in Eastern Ethiopia: A Comparative Cross-Sectional Study
Arkew M, Asmerom H, Tesfa T, Tsegaye S, Gemechu K, Bete T, Haile K
Diabetes, Metabolic Syndrome and Obesity 2022, 15:3499-3507
Published Date: 9 November 2022
Determinants of Glycemic Control in Thai Adults with Insulin-Treated Type 2 Diabetes Mellitus: A Cross-Sectional Study
Riangkam C, Sanguanthammarong S, Lertwattanarak R
Patient Preference and Adherence 2025, 19:1909-1922
Published Date: 5 July 2025
Effectiveness of Conservative Treatment on Chronic Venous Disease Symptoms and Quality of Life in Patients with Type 2 Diabetes: Results from a Subanalysis of the VEIN STEP Observational Study
Ulloa JH, Tazi Mezalek Z, González Ochoa AJ, Hosseini Sadrabadi F, Blanc-Guillemaud V, Philips JC, Feodor T
Vascular Health and Risk Management 2026, 22:556035
Published Date: 24 February 2026