")
Back to Journals » Clinical Epidemiology » Volume 15
Real-World Dispensing Patterns of Inhalation Medication in Young Adult Asthma: An Inception Cohort Study
Authors Mommers I , van Boven JF , Schuiling-Veninga CC , Bos JH , Koetsier M , Hak E , Bijlsma MJ
Received 8 March 2023
Accepted for publication 8 May 2023
Published 14 June 2023 Volume 2023:15 Pages 721—732
DOI https://doi.org/10.2147/CLEP.S410036
Checked for plagiarism Yes
Review by Single anonymous peer review
Peer reviewer comments 2
Editor who approved publication: Professor Henrik Sørensen
Irene Mommers,1 Job FM van Boven,2,3 Catharina CM Schuiling-Veninga,1 Jens HJ Bos,1 Marten Koetsier,1 Eelko Hak,1 Maarten J Bijlsma1,4
1Pharmacotherapy, Epidemiology and -Economics, University of Groningen, Groningen, the Netherlands; 2Groningen Research Institute for Asthma and COPD, University Medical Center Groningen, Groningen, the Netherlands; 3Department of Clinical Pharmacy and Pharmacology, University Medical Center Groningen, Groningen, the Netherlands; 4Laboratory of Population Health, Max Planck Institute for Demographic Research, Rostock, Germany
Correspondence: Irene Mommers, University of Groningen, Department of Pharmacotherapy, -Epidemiology and -Economics, Antonius Deusinglaan 1, Building 3214, Room 0450, Groningen, 9713 AV, the Netherlands, Tel +31 50 36 32476, Email [email protected]
Purpose: The Global Initiative for Asthma (GINA) suggests a step-wise approach for pharmacological treatment of asthma. Valid study of real-world treatment patterns using dispensing databases includes proper measurement of medication adherence. We aim to explore such patterns by applying a time-varying proportion of days covered (tPDC)-based algorithm.
Patients and Methods: We designed a retrospective inception cohort study using the University of Groningen IADB.nl community pharmacy dispensing database. Included were 19,184 young adults who initiated asthma medication anywhere between 1994 and 2021, in the Netherlands. Main treatment steps were defined as: 1 - SABA/ICS-formoterol as needed, 2 - low dose ICS, 3 - low dose ICS + LABA or tiotropium, or intermediate dose ICS, 4 - intermediate to high dose ICS + LABA or tiotropium, triple therapy, or high dose ICS, 5 - treatment prescribed by a specialist. Changes in treatment steps were determined using a time-varying proportion of days covered (tPDC)-based algorithm. Individual drug treatment trajectories were visualized over time using a lasagna plot.
Results: At initiation, of the 19,184 included individuals, 52%, 7%, 15%, 16%, and 10% started treatment in steps 1 to 5, respectively. The median (IQR) follow-up time was 3 (1– 7) years. Median (IQR) number of switches was 1 (0– 3). Comparing starting step to last observed step, 37% never switched between treatment steps, 20% of individuals stepped down and 22% stepped up.
Conclusion: The low proportion of treatment switches between steps indicates that tailoring of treatment to patients’ needs might be suboptimal. The tPDC-based algorithm functions well in translating dispensing data into continuous drug-utilization data, enabling a more granular assessment of treatment patterns among asthma patients.
Keywords: asthma management, respiratory disease, inhaler medication, personalized medicine, longitudinal, observational
Introduction
Asthma is a chronic respiratory disease, with an estimated prevalence of over 262 million worldwide.1 Symptoms caused by chronic inflammation of the lower airways present themselves in episodes and include shortness of breath, coughing, wheezing, and tightness of the chest.2 It has a high impact on quality of life and can even be lethal. Asthma often presents itself intermittent and sometimes progressive. Fortunately, both symptoms and underlying inflammation can be reduced by the use of inhalation medication.3 Inhalation medication for asthma entails two components: controllers and relievers. Where controllers are used on a daily basis to prevent exacerbations, relievers are only intended for quick relief of acute symptoms. The Global Initiative for Asthma (GINA) recommends a stepwise approach for managing asthma with options to step-up and step-down treatment, depending on severity. Step-up consists of an increase in dose or addition/change in medication, and step-down the reverse. Step-up is recommended based on the presence of symptoms and step-down after complete absence of symptoms over at least 3 months respectively.4 Although switches in steps of asthma treatment have been recommended, knowledge about long-term treatment trajectories in clinical practice is scarce.
Trajectories of asthma treatment have often been studied using prescription, dispensing, or claims databases. Such databases are representative for clinical practice, allow for studying large populations over extensive time-periods, and are widely available.5–12 However, the study of long-term treatment patterns is complicated by the fact that in general medication adherence among individuals with asthma is moderate to poor.13,14 For example, when a patient is poorly adherent, this often means that more time will pass before they refill their medication, as compared to when they would have been fully adherent.15 As a consequence, it is challenging to determine whether individuals are poorly adherent to their treatment when the time between refills increases or whether they stepped down their daily dosage at the recommendation of a clinician.12 With the availability of flexible, advanced algorithms, it is possible to create continuous drug utilization data using a dispensing database, which allows us to study individual treatment trajectories over time. Here, we will apply a time-varying proportion of days covered-based algorithm to explore individual asthma treatment trajectories among young adults using the widely used in research and representative dispensing database IADB.nl.
Data and Methods
Study Design and Setting
This is an observational, longitudinal, inception cohort study on young Dutch adults initiating inhaled asthma medication. The data for this study ranged from January 1 of 1994 till December 31 of 2020. For the analyses, continuous data were created from the dispensing records, by determining the periods of use for different medication groups for each individual. Therefore, we used a time-varying proportion of days covered (tPDC)-based algorithm. With these data, individuals were assigned to treatment steps at each point in time during follow-up based on guidelines for adult asthma from the Dutch College of General Practitioners (NHG), which follow the GINA recommendations.4,16 The individual treatment trajectories were visualized using a lasagna plot,17 and the overall treatment patterns of starters in step 1–5 were also quantified using descriptive statistics. In addition, sensitivity analyses were performed to determine the effect of decisions made during analyses, as well as to explore the effect of changes in treatment guidelines over the years.
Study Population
We included individuals initiating short- and/or long-acting selective β2-adrenoreceptor agonists (SABA/LABA): salbutamol, terbutaline, salmeterol, or formoterol; inhaled corticosteroids (ICS): beclomethasone, budesonide, fluticasone, or ciclesonide; or a fixed-dose combination of ICS and LABA (ICS-LABA): salmeterol-fluticasone, formoterol-budesonide, formoterol-beclomethasone, vilanterol-fluticasone, formoterol-fluticasone, or salmeterol-budesonide (Table 1). To be included, an individual had to be present in the database for 1 year prior to first-start of any of these drugs according to a second dispensing within 1 year. To exclude paediatric asthma, patients <16 years at first-start, were excluded. Additionally, to exclude possible chronic obstructive pulmonary disease (COPD) patients, individuals who were ≥45 years old at initiation, or who initiated treatment with LABA or tiotropium only (without ICS), or who received roflumilast, were excluded.
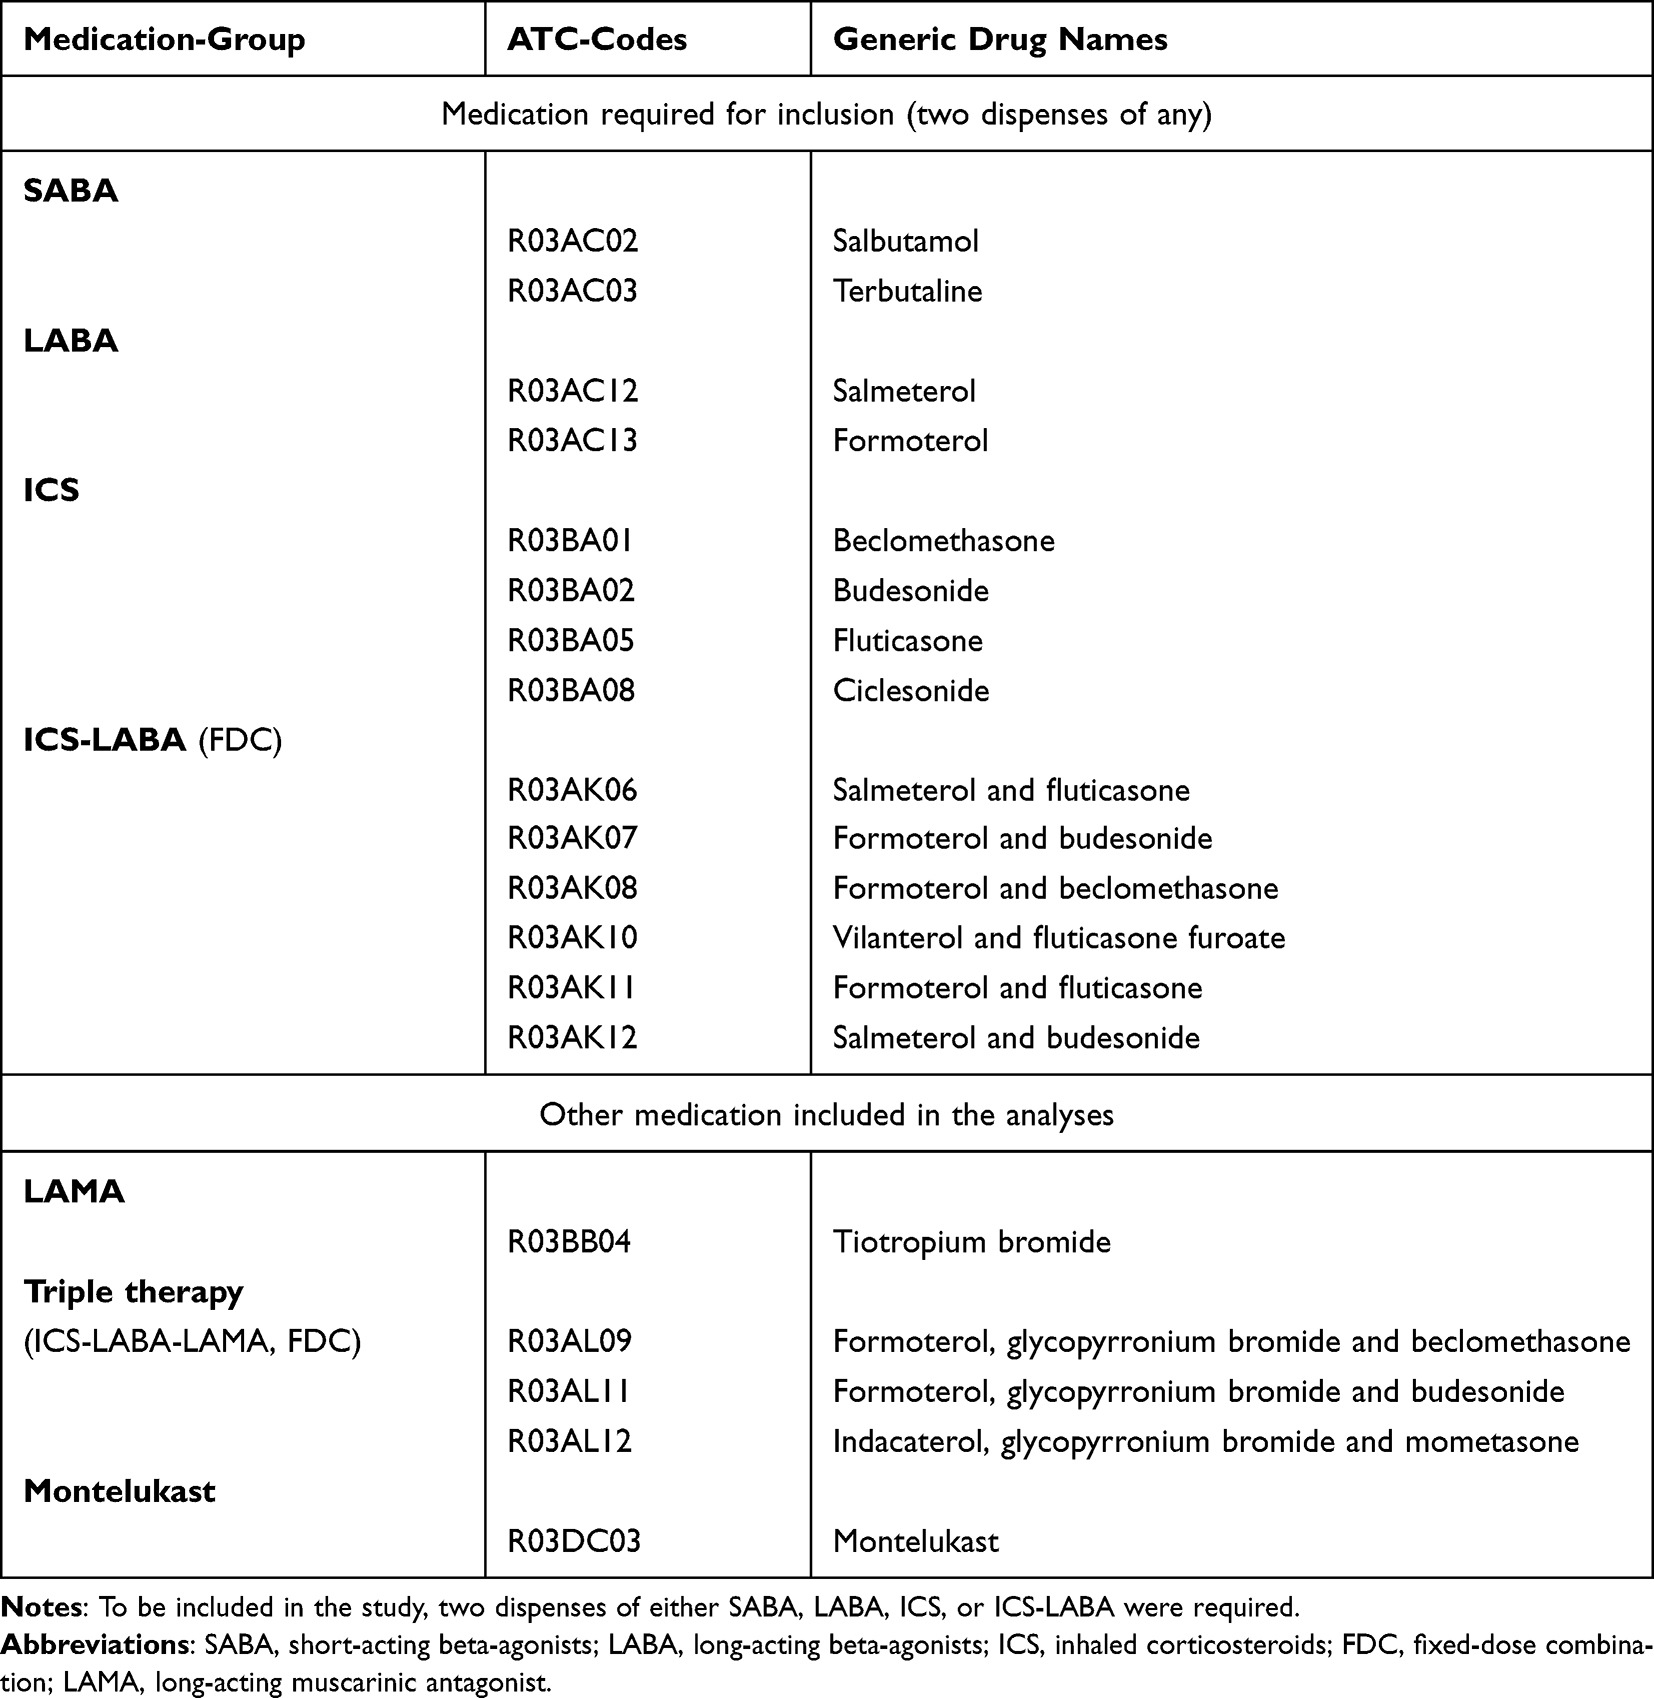 |
Table 1 Medication Groups with Corresponding ATC-Codes and Generic Drug Names |
Data Source
We used data from the University of Groningen IADB.nl dispensing database. The IADB.nl database, including data from January 1 1994 onwards, contains anonymized patient-level dispensing data of all individuals (approximately 1,120,000), regardless of their health-care insurance, from estimated 120 community pharmacies in the north of the Netherlands. Personal information includes gender and date of birth. Dispensing records include the dispensing date, Anatomical Therapeutic Chemical (ATC) code, quantity, prescribed dose, number of days covered, type of prescriber and an anonymous identifier for the pharmacy and prescribing physician (general practitioner or specialist). Due to the high patient-pharmacy commitment in the Netherlands, the dispensing records for each individual in the IADB.nl database are virtually complete, except for medication dispensed during hospitalization and over-the-counter drugs. Of note, over-the-counter sale of inhalation medication for treatment of asthma has not been allowed in the Netherlands in the studied period. The dispensing rates from this database have been found to be representative for the entire Dutch population.18,19
Treatment Steps
We assigned individuals to treatment steps at initiation as well as at each moment during follow-up based on guidelines for adult asthma from the Dutch College of General Practitioners (NHG) in December 2020, which roughly correspond to the GINA recommendations.4,16 These steps were as follows: 1 – reliever (SABA or low-dose budesonide/beclomethasone plus formoterol, as needed) only, 2 - low dose ICS, 3 - low dose ICS + LABA other than budesonide/beclomethasone plus formoterol, or intermediate dose ICS, 4 - intermediate to high dose ICS + LABA, triple therapy, or high dose ICS, 5 – medication prescribed by specialists (Figure 1). Tiotropium can be used as a substitute for LABA, in case of side-effects. When using montelukast, individuals were placed in step three or higher, depending on what other medication they received. ICS plus LABA could either consist of simultaneous use of an ICS inhaler and a LABA inhaler or of a fixed dose combination inhaler, containing both ICS and LABA. Whether an ICS dose was classified as low, medium, or high was drug and inhaler specific and was determined based on the total daily dose. The cut-off values for each type of ICS, LABA, or combination thereof defining whether they were prescribed in low, intermediate, or high doses are added to the supplement (Supplementary Table 1). For SABA this was not relevant, as it should only be used as reliever, regardless of its prescribed dose.
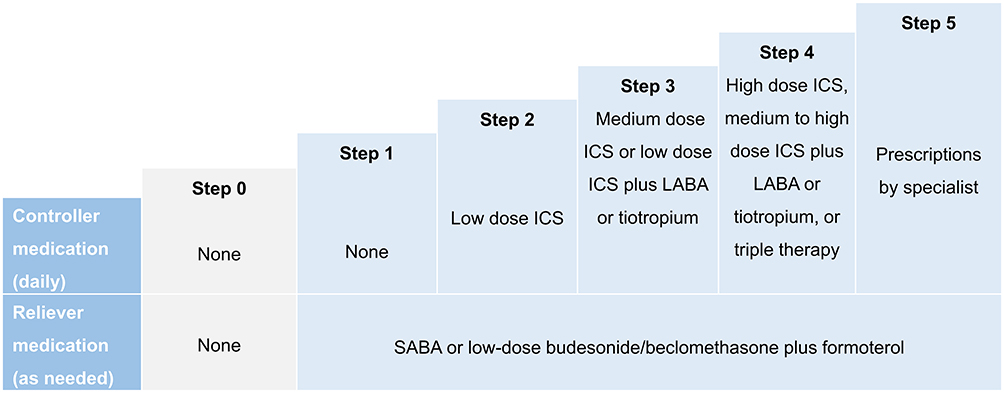 |
Figure 1 Treatment steps as defined in this study. |
Periods of Use and Time-Dependent Proportion of Days Covered-Based Algorithm
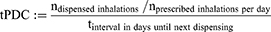
Moments in time an individual used which specific asthma medication was determined using the time-varying proportion of days covered-based algorithm. For each dispense, the time-varying proportion of days covered (tPDC) was calculated based on Bijlsma et al,20 as follows:
These “periods of use” were determined for each combination of group of medication (Table 1) and dose category (if relevant; Supplementary Table 1), separately. No distinctions were made between specific drugs within a medication-group, nor between specific dosages within a dose-category. Stockpiling was taken into account by transferring the surplus of days from one interval between two dispenses to the next interval, when the number of days covered exceeded the number of days in the interval (thus tPDC>1).
The potential stop date was defined as the dispensing date plus the number of days covered when assuming intermediate adherence, plus 60 days. Intermediate adherence was defined as the average between full adherence and discontinuation (eg non-adherence). For controller medication, full adherence was represented by a tPDC of 1, and discontinuation was defined as a tPDC of 0.5 or lower. For reliever medication, full adherence and discontinuation were represented by at tPDC of at least 0.5 and lower than 0.05, respectively. Consequently, intermediate adherence was defined as 0.75 for controller medication, and for reliever medication as 0.275. Medication was considered to be discontinued when the tPDC dropped below the relevant cut-off value for discontinuation and the date of next dispensing exceeded the potential stop-date.
Analyses
With these “periods of use”, the treatment of each individual was mapped into the aforementioned treatment steps, on a continuous timescale. Nonetheless, to reduce computational load, only the treatment step on the first day of every person-week was used for analyses. The individual treatment trajectories were visualized using a lasagna plot.17 In this plot, each individuals’ trajectory over time is portrayed by a horizontal layer, of which the colors represent the treatment step of the specific individual at each time point. The layers of all individuals are subsequently stacked on top of each other, like lasagna. The layers were sorted on their first and second treatment steps to enhance the readability of the plot. The overall treatment patterns of starters in step 1–5 were quantified using descriptive statistics. During periods of follow-up where no medication was dispensed (step 0), individuals were classified in their prior treatment step.
Four sets of sensitivity analyses were performed. Firstly, to determine the robustness of the analyses with respect to the definition of discontinuation, we set the cut-off value for discontinuation of controller medication to 0.25 instead of 0.5, and reran the analyses. Secondly, a sensitivity analysis was performed to determine the effect of ignoring periods of no treatment (step 0) in the quantification of the treatment patterns. This was done by performing the quantification analyses twice; once classifying individuals into their prior treatment step when a step 0 interval occurred during follow-up and once actually classifying these as step 0 intervals. Thirdly, a sensitivity analysis was performed to determine whether individuals were not treated at all during step 0 intervals, or whether they used other drugs for obstructive airway diseases that were not included in the aforementioned treatment steps. Therefore, we obtained and reported the number of step 0 intervals in which there were other dispenses with ATC-code R03 for the individual and time-interval, or 60 days prior. Fourthly, to assess potential impact of asthma treatment guidelines changes over time, we investigated period effects by stratifying the study population based on period in which they first-started and compared their results. These periods ranged from 1995 to 2001, from 2002 to 2007, from 2008 to 2013 and from 2014 to 2020.
Results
Patient Selection and Baseline Characteristics
A total of 59,945 individuals were identified based on filled prescriptions for relevant medication (Table 1), of which 19,704 were aged <45 years at treatment-initiation. In addition, 520 individuals were excluded because of using LABA and/or tiotropium as only start-medication, or ever-use of roflumilast, since this might indicate diagnosis with COPD instead of asthma. This resulted in a final study-population of 19,184 individuals (Figure 2).
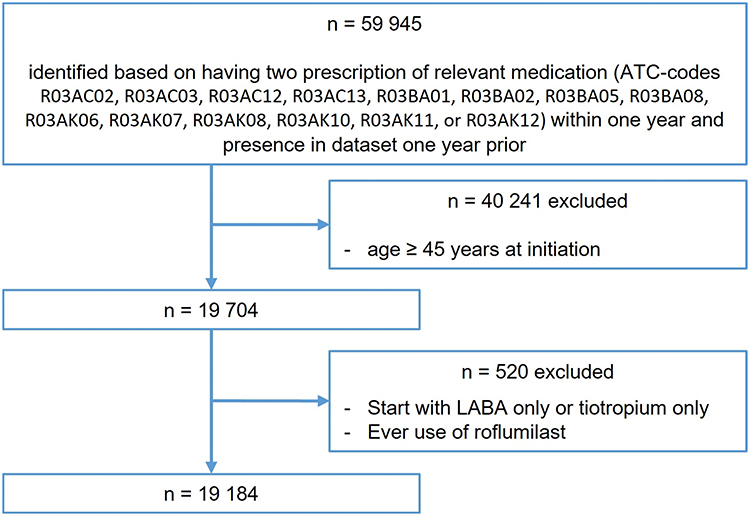 |
Figure 2 Flow chart of patient selection. |
The mean follow-up time was 5.0 years, with a median of 3.0 (IQR: 1.1–7.4) years. In total, 65.3% was female, 25.8% was aged 16 to 24 years, 31.1% aged 25 to 34 years and 43.1% aged 35 to 44 years, at initiation of treatment (Table 2).
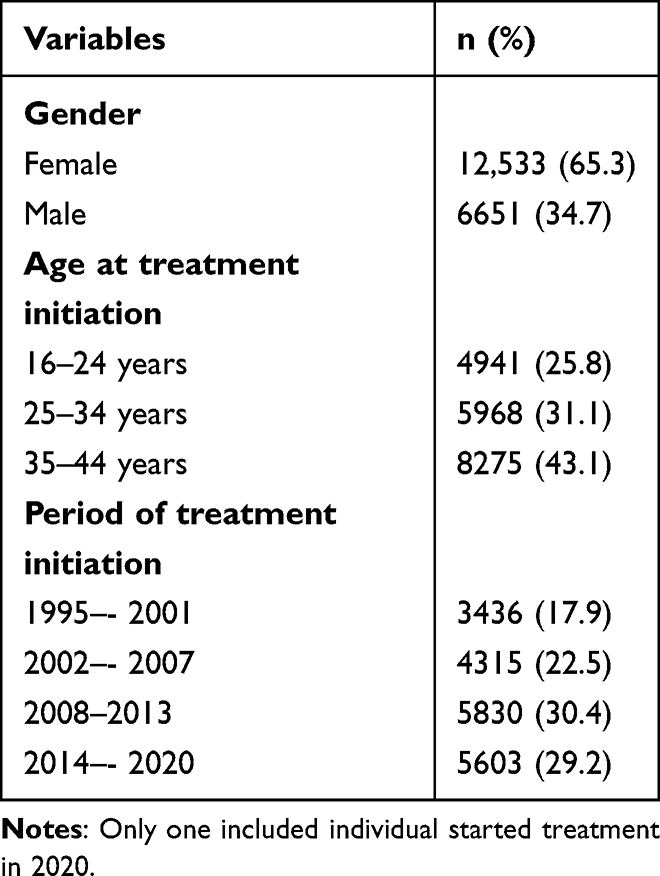 |
Table 2 Patient and Treatment Characteristics |
Treatment Patterns
Over half of the individuals (52.3%) initiated treatment in step 1, 6.7% in step 2, followed by 15.4%, 15.5%, and 10.1% in step 3, 4, and 5, respectively. Focussing on steps 1 to 5, 11,226 (58.5%) individuals ended their follow-up in the same treatment step as they started in, 4128 (21.5%) in a higher step and 3830 (20.0%) in a lower one. The probability of stepping-up seemed to decrease with increasing starting-step (29.5%, 27.6%, 20.4%, and 7.3% for step 1 to 4, respectively). In contrast, probability of ending up in a lower step did not seem to increase for higher starting-steps (all in range of 41–42%). (Table 3)
 |
Table 3 Treatment Patterns Stratified by Initial Asthma Treatment Step |
The visualisation of individual treatment trajectories showed fair stability in treatment step, but still several switches could be noted. Although some pattern could be identified regarding starters in step 2 to 4 switching back to step 1, this was less frequently spotted in those at step 5 treatment. In addition, where individuals starting in step 2 or 3 mainly seemed to step-up to a treatment step nearby, a significant proportion (11.5%) of those in step 1 step-up to 4 directly. Although most patterns observed in Figure 3 seem to be in congruence with the descriptives in Table 3, a vast amount of step 0 appears in the plot as well. Remarkably, this applies not only to individuals starting in the lower treatment steps, like 1 to 3, but also in high quantities in step 4 and 5 (Figure 3).
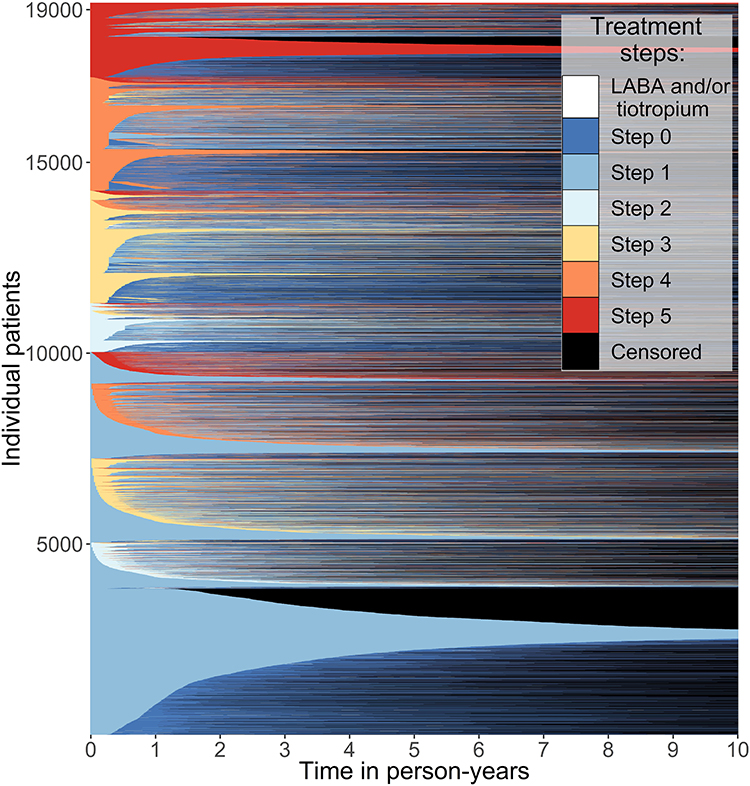 |
Figure 3 Treatment trajectories of individuals over a period of 10 person-years. |
Sensitivity Analyses
The first sensitivity analysis tested the robustness of the results by decreasing the cut-off value for discontinuation from 0.5 to 0.25. This led to an increased number of individuals ending up in step 1 (difference of n=841, from 51.8% to 56.2%) at the end of follow-up. The majority of them (n=531) also started in step 1. However, the proportion of individuals in this step who never switched during the entire follow-up period remained the same (38.2%). Among individuals starting in step 5, the percentage of never-switchers increased from 54.1% to 60.8%. This also resulted in a slightly higher proportion of individuals ending up in this step (from 11.9% to 12.7%). Overall, the change in cut-off value had a low impact on the direction and strength of the results (Supplementary Figure 1 and Supplementary Table 2).
The second sensitivity analysis included step 0 in the quantification of the treatment trajectories. This meant that the last known step for the majority of individuals (57.2%) became step 0 and the proportion ending up in step 1 decreased from 51.8% to 22.3%. Similarly, where previously 20% of individuals ended in a lower step compared to their first step, this now occurred to the majority of individuals (66.6%). Additionally, the number of switches increased from a median (IQR) of 1 (0–3) to 3 (1–6). (Supplementary Table 3) This shows that the decision on whether or not to include step 0 highly influences the results.
The third sensitivity analysis was performed to determine whether individuals were not treated at all during step 0 intervals or whether they used other drugs for obstructive airway diseases. In total, 26236 step 0 intervals were recorded for 13650 different individuals. Other R03 prescriptions were filled during, or 60 days prior to, only 410 of these step 0 intervals, for 322 different individuals. Therefore, the use of other drugs for obstructive airway diseases during step 0 intervals is deemed neglectable. Lastly, the fourth sensitivity analysis, which was the investigation of period effects, showed no noteworthy differences between periods (Supplementary Figures 2–5).
Discussion
This inception–cohort study explored individual treatment trajectories and overall treatment patterns among young adults initiating inhalation medication, using a time-varying proportion of days covered-based algorithm. Half of the individuals started in step 1, whereas between 6% and 16% in higher steps. Most individuals switched only once on average, but if “no treatment” was considered a switch as well, individuals switched three times on average. As first switch, most individuals (40%) stepped up, one in five stepped down and one in three never switched, except for incidental cessation of treatment. For individuals initiating in step 2 to 4, the most common step-down was directly to step 1. Eventually, the majority ended follow-up in the same step they started in, and overall step up occurred almost twice as frequently as overall step down.
Our study focused on treatment trajectories, as guidelines recommend that inhalation medication should be tailored based on control of asthma.4 Not only is it advised by both the NHG and GINA to increase in step when asthma is controlled poorly but also to decrease medication if that is possible. In this study, we found that among individuals starting in step 1, one in three did not switch from step 1, and half of the individuals that started in step 5 did not switch from step 5. These percentages were larger than the percentages of non-switchers in the other treatment steps. This could be expected, since many individuals in step 1 with well-controlled asthma do not have a need to switch, while individuals with poorly controlled asthma cannot go beyond step 5. Nevertheless, also in step 2, 3, and 4, considerable proportions of individuals never changed treatment step (23.5%, 26.8%, and 36.6%, respectively; Table 3). The low number of switches between steps could be a result of clinical inertia. However, the possibility also remains that treatment is well selected upfront, and asthma is controlled sufficiently, but not enough to realistically step down. In order to draw conclusions on this, further research taking into account outcomes related to asthma control is needed. Nevertheless, it raises questions on how well physicians implement the dynamic nature of treatment that is advised by the guidelines on treatment of patients treated for asthma.
The findings of our study largely corroborate those found in a study in the UK.21 Gayle et al studied real-life prescribing of asthma treatment in general practices over time. They found that most adults stayed within the same treatment step over a 6-month interval. They found that from step 5, the most common switch was to step 4, and from step 2, 3, and 4, the most common switch was to step 1. This is supported by our study, by both the first switch of treatment step made and by comparing the last known treatment step with step started in for each individual. However, in contrast to our study, they found step 5 to be the least stable step. We believe that this difference can be explained by the UK study defining step 5 as “long-term/frequent use of oral corticosteroids” as prescribed by the BTS/SIGN guidelines. This clearly deviates from the step 5 classification used in our study, entailing “prescriptions from a specialist” that would eg also include biologics or high-dose ICS/LABA. To the best of our knowledge, no other studies were directly comparable to our study. Other papers did not employ a longitudinal design, deviated strongly in their categorization of treatment steps, selected individuals based on asthma severity or even based on treatment step or did not follow treatment from initiation onwards.22–29
Studying treatment trajectories using dispensing data can be challenging for diseases where a lack of adherence is common. With dispensing data only, we cannot know whether these “gaps” between refills are due to cessation on advise of a general practitioner/specialist or due to poor adherence. From the numerous measures available to quantify adherence, we chose to use the proportions of days covered to create an algorithm, which is time-varying and assesses when treatment is discontinued.30 This is in line with the commentary of Steiner (2016), stating that “Adherence measures should assess the time when adherence begins and ends, and the variability in adherence between those time points.”31 The “period of use” was added to the algorithm to overcome (at least partially) the problems caused by potential lack of adherence. Our analyses showed robustness to different “period of use” definitions. Therefore, we believe that the overall classification of steps and their sequence is not strongly affected by the inability to observe when exactly an individual switches and what “gaps” in treatment represent. Hence, we can conclude that the proportion of days covered-based algorithm is a potentially useful method to overcome particular challenges that arise when using prescription, dispensing, or claims databases to explore treatment trajectories. The algorithm can create a detailed picture of the treatment trajectories in clinical practice. Nevertheless, a crucial part of the algorithms implementation is that sensitivity analyses must be performed in order to test the influence of classification-parameters to the situation of interest.
To visualize the individual treatment trajectories, a lasagna plot was used. Lasagna plots can be seen and interpreted like a heatmap, tailored to longitudinal data, and form a good alternative when spaghetti plots do not suffice due to larger numbers of individuals.17 For this study, it sufficed in portraying the treatment trajectories, as Figure 3 was visually in line with the quantified treatment results (Table 3). It managed to portray the time-paths as well as the variability of treatment trajectories both between and within individuals. Therefore, it proved to be superior for this goal in comparison to, for example, a spaghetti plot or Sankey diagram.17,32 For future research, it would be interesting to study the effects, patterns, and switches in treatment on asthma control and exacerbations or to compare treatment patterns between different patient-groups. For both these purposes, lasagna plots could also be used for easy visualization.
Another important aspect when studying treatment trajectories for asthma based on dispensing data, is how to take into account follow-up “gaps” in treatment (defined as step 0: no treatment). The median number of switches, focusing on step 1 to 5, was only one, but increased to three, if no treatment (ie step 0) was considered as a switch as well. This choice also affected the proportions of overall step-up and step-down. We cannot determine whether these gaps are due to cessation of treatment or caused by lack of adherence. In either case, the sensitivity analysis showed that this decision can have a considerable impact on the results. Whether this variability is of importance depends on study aims. Although this sensitivity analysis assessed the effect of gaps in between dispenses on treatment patterns, we do not have insight into the extent of complete non-adherence, ie non-initiation or complete, long-term cessation, which is a limitation of this study. Regardless, sensitivity analyses regarding classification and accounting for gaps are highly recommended.
This study was conducted using IADB data from 1994 up till 2020. Readers must be aware that during this period GINA strategy report has changed over time,33–35 thus conclusions on compliance with guidelines must be drawn with care. As the greatest change in the history of GINA occurred in 2019,4 it would be interesting to study what effect this change has had on the dispensing patterns. Unfortunately, not enough follow-up data was yet available to study this effect within the scope of this study. In addition, no diagnostic information was available. As there is much overlap in medication prescribed for asthma and COPD or chronic cough, some misclassification might have occurred.4,36,37 Reasons for censoring included a change of pharmacy to one that is not included in the IADB (eg in case of moving), having filled no further prescriptions at all (ie not limited to inhalation medication), death, or moment of follow-up lying in the future (ie has not taken place yet). As both asthma specific and all-cause mortality rates in the studied age category are uncommon,38,39 selective mortality will unlikely lead to bias within this study. In addition, due to the high patient-pharmacy commitment in the Netherlands, the dispensing records for each individual in the IADB are virtually complete, except for over-the-counter drugs and medication dispensed during hospitalization.18
Conclusion
In conclusion, using the time-varying proportion of days covered-based algorithm seems to function well in translating dispensing data into continuous data, enabling a more granular assessment of treatment trajectories among individuals diagnosed with asthma. The low proportion of treatment switches between steps indicates that tailoring of treatment to patient’s needs might be suboptimal. Further research taking into account treatment outcomes is needed to gain further insight on this.
Abbreviations
ATC code, Anatomical Therapeutic Chemical code; COPD, chronic obstructive pulmonary disease; FDC, fixed-dose combination; GINA, Global Initiative for Asthma; ICS, inhaled corticosteroids; LABA, long-acting selective β2-adrenoreceptor agonist; LAMA, long-acting muscarinic antagonist; NHG, Dutch College of General Practitioners; SABA, short-acting selective β2-adrenoreceptor agonist; tPDC, time-varying proportion of days covered.
Data Sharing Statement
The data used for this study were provided by the University of Groningen IADB.nl community pharmacy dispensing database. Reasonable requests to access the data should be directed to the IADB (e-mail: [email protected]).
Ethics Approval and Informed Consent
The University of Groningen IADB.nl community pharmacy dispensing database contains data that is collected in accordance with the Dutch and European guidelines on privacy requirements (GDPR) for handling human data. Approval of the medical ethics committee was not needed nor required for this study.
Consent for Publication
No images or recordings were included in this manuscript that require consent for publication.
Acknowledgments
We would like to acknowledge the participating pharmacies for supplying their data for research purposes and the IADB.nl staff for data collection, maintenance, and providing us with the dataset.
Author Contributions
All authors made a significant contribution to the work reported, whether that is in the conception, study design, execution, acquisition of data, analysis and interpretation, or in all these areas; took part in drafting, revising, or critically reviewing the article; gave final approval of the version to be published; have agreed on the journal to which the article has been submitted; and agree to be accountable for all aspects of the work.
Funding
This research received no specific grant from any funding agency in the public, commercial, or not-for-profit sectors.
Disclosure
Dr Job FM van Boven reports grants and/or personal fees from AstraZeneca, Chiesi, GSK, Novartis, Teva, and Trudell Medical, outside the submitted work. The authors report no other conflicts of interest in this work.
References
1. GBD 2019 Diseases and Injuries Collaborators. Global burden of 369 diseases and injuries in 204 countries and territories, 1990–2019: a systematic analysis for the global burden of disease study 2019. Lancet. 2020;396(10258):1204–1222. doi:10.1016/s0140-6736(20)30925-9
2. Mims JW. Asthma: definitions and pathophysiology. Int Forum Allergy Rhinol. 2015;5(1):S2–6. doi:10.1002/alr.21609
3. Baiardini I, Braido F, Brandi S, et al. The impact of GINA suggested drugs for the treatment of asthma on health-related quality of life: a GA(2)LEN review. Allergy. 2008;63(8):1015–1030. doi:10.1111/j.1398-9995.2008.01823.x
4. Global Initiative for Asthma. Global strategy for asthma management and prevention; 2022. Available from: www.ginasthma.org.
5. Aarnio E, Huupponen R, Martikainen JE, Korhonen MJ. First insight to the Finnish nationwide electronic prescription database as a data source for pharmacoepidemiology research. Res Social Adm Pharm. 2020;16(4):553–559. doi:10.1016/j.sapharm.2019.06.012
6. Ankrah D, Hallas J, Odei J, Asenso-Boadi F, Dsane-Selby L, Donneyong M. A review of the Ghana national health insurance scheme claims database: possibilities and limits for drug utilization research. Basic Clin Pharmacol Toxicol. 2019;124(1):18–27. doi:10.1111/bcpt.13136
7. Backer V, Lykkegaard J, Bodtger U, Agertoft L, Korshoej L, Braüner EV. The Danish national database for asthma. Clin Epidemiol. 2016;8:601–606. doi:10.2147/clep.S99494
8. Lin LY, Warren-Gash C, Smeeth L, Chen PC. Data resource profile: the national health insurance research database (NHIRD). Epidemiol Health. 2018;40:e2018062. doi:10.4178/epih.e2018062
9. Furu K, Skurtveit S, Langhammer A, Nafstad P. Use of anti-asthmatic medications as a proxy for prevalence of asthma in children and adolescents in Norway: a nationwide prescription database analysis. Eur J Clin Pharmacol. 2007;63(7):693–698. doi:10.1007/s00228-007-0301-9
10. Choi JY, Yoon HK, Lee JH, et al. Current status of asthma care in South Korea: nationwide the health insurance review and assessment service database. J Thorac Dis. 2017;9(9):3208–3214. doi:10.21037/jtd.2017.08.109
11. Putman B, Coucke L, Vanoverschelde A, Mehuys E, Lahousse L. Community pharmacist counseling improves adherence and asthma control: a nationwide study. BMC Health Serv Res. 2022;22(1):112. doi:10.1186/s12913-022-07518-0
12. van Boven JFM, Koponen M, Lalic S, et al. Trajectory analyses of adherence patterns in a real-life moderate to severe asthma population. J Allergy Clin Immunol Pract. 2020;8(6):1961–1969.e6. doi:10.1016/j.jaip.2019.12.002
13. Hassan M, Davies SE, Trethewey SP, Mansur AH. Prevalence and predictors of adherence to controller therapy in adult patients with severe/difficult-to-treat asthma: a systematic review and meta-analysis. J Asthma. 2020;57(12):1379–1388. doi:10.1080/02770903.2019.1645169
14. Bårnes CB, Ulrik CS. Asthma and adherence to inhaled corticosteroids: current status and future perspectives. Respir Care. 2015;60(3):455–468. doi:10.4187/respcare.03200
15. Grymonpre R, Cheang M, Fraser M, Metge C, Sitar DS. Validity of a prescription claims database to estimate medication adherence in older persons. Med Care. 2006;44(5):471–477. doi:10.1097/01.mlr.0000207817.32496.cb
16. Bottema JW, Broekhuizen L, Chavannes NH, et al. NHG-Standaard Asthma bij volwassenen (M27); 2022.
17. Swihart BJ, Caffo B, James BD, Strand M, Schwartz BS, Punjabi NM. Lasagna plots: a saucy alternative to spaghetti plots. Epidemiology. 2010;21(5):621–625. doi:10.1097/EDE.0b013e3181e5b06a
18. Visser ST, Schuiling-Veninga CC, Bos JH, de Jong-van den Berg LT, Postma MJ. The population-based prescription database IADB.nl: its development, usefulness in outcomes research and challenges. Expert Rev Pharmacoecon Outcomes Res. 2013;13(3):285–292. doi:10.1586/erp.13.20
19. Sediq R, van der Schans J, Dotinga A, et al. Concordance assessment of self-reported medication use in the Netherlands three-generation Lifelines Cohort study with the pharmacy database iaDB.nl: the PharmLines initiative. Clin Epidemiol. 2018;10:981–989. doi:10.2147/clep.S163037
20. Bijlsma MJ, Janssen F, Hak E. Estimating time-varying drug adherence using electronic records: extending the proportion of days covered (PDC) method. Pharmacoepidemiol Drug Saf. 2016;25(3):325–332. doi:10.1002/pds.3935
21. Gayle A, Tebboth A, Pang M, et al. Real-life prescribing of asthmatic treatments in UK general practice over time using 2014 BTS/SIGN steps. NPJ Prim Care Respir Med. 2019;29(1):25. doi:10.1038/s41533-019-0137-7
22. Baldacci S, Simoni M, Maio S, et al. Prescriptive adherence to GINA guidelines and asthma control: an Italian cross sectional study in general practice. Respir Med. 2019;146:10–17. doi:10.1016/j.rmed.2018.11.001
23. Bloom CI, Nissen F, Douglas IJ, Smeeth L, Cullinan P, Quint JK. Exacerbation risk and characterisation of the UK’s asthma population from infants to old age. Thorax. 2018;73(4):313–320. doi:10.1136/thoraxjnl-2017-210650
24. Covvey JR, Johnston BF, Wood F, Boyter AC. Is the BTS/SIGN guideline confusing? A retrospective database analysis of asthma therapy. Prim Care Respir J. 2013;22(3):290–295. doi:10.4104/pcrj.2013.00060
25. Neville RG, Pearson MG, Richards N, et al. A cost analysis on the pattern of asthma prescribing in the UK. Eur Respir J. 1999;14(3):605–609. doi:10.1034/j.1399-3003.1999.14c20.x
26. Tibble H, Sheikh A, Tsanas A. Derivation of asthma severity from electronic prescription records using British thoracic society treatment steps. BMC Pulm Med. 2022;22(1):397. doi:10.1186/s12890-022-02189-3
27. Terl M, Pohunek P, Kuhn M, Bystron J. Four seasons of Czech asthma study: asthma characteristics and management reality in the Czech Republic. J Asthma. 2020;57(8):898–910. doi:10.1080/02770903.2019.1619082
28. Dilokthornsakul P, Thompson AM, Campbell JD. Treatment patterns and related clinical consequences in adults with asthma. J Asthma. 2019;56(7):739–747. doi:10.1080/02770903.2018.1490749
29. Lugogo N, Gilbert I, Tkacz J, Gandhi H, Goshi N, Lanz MJ. Real-world patterns and implications of short-acting β(2)-agonist use in patients with asthma in the United States. Ann Allergy Asthma Immunol. 2021;126(6):681–689.e1. doi:10.1016/j.anai.2021.01.024
30. Raebel MA, Schmittdiel J, Karter AJ, Konieczny JL, Steiner JF. Standardizing terminology and definitions of medication adherence and persistence in research employing electronic databases. Med Care. 2013;51(8 Suppl 3):S11–21. doi:10.1097/MLR.0b013e31829b1d2a
31. Steiner JF. Measuring adherence with medications: time is of the essence. Pharmacoepidemiol Drug Saf. 2016;25(3):333–335. doi:10.1002/pds.3932
32. Otto E, Culakova E, Meng S, et al. Overview of Sankey flow diagrams: focusing on symptom trajectories in older adults with advanced cancer. J Geriatr Oncol. 2022;13(5):742–746. doi:10.1016/j.jgo.2021.12.017
33. Bousquet J. Global initiative for asthma (GINA) and its objectives. Clin Exp Allergy. 2000;30(1):2–5. doi:10.1046/j.1365-2222.2000.00088.x
34. Reddel HK, FitzGerald JM, Bateman ED, et al. GINA 2019: a fundamental change in asthma management. Treatment of asthma with short-acting bronchodilators alone is no longer recommended for adults and adolescents. Europ Res J. 2019;53(6):1901046. doi:10.1183/13993003.01046-2019
35. Reddel HK, Levy ML. The GINA asthma strategy report: what’s new for primary care? NPJ Prim Care Respir Med. 2015;25:15050. doi:10.1038/npjpcrm.2015.50
36. Labaki WW, Rosenberg SR. Chronic obstructive pulmonary disease. Ann Intern Med. 2020;173(3):Itc17–itc32. doi:10.7326/aitc202008040
37. Arai Y, Okuyama K, Onishi Y, Schelfhout J, Tokita S, Kubo T. Clinical characteristics and drug utilisation patterns in patients with chronic cough: a retrospective cohort study using a Japanese claims database. BMC Pulm Med. 2022;22(1):429. doi:10.1186/s12890-022-02180-y
38. Trivedi M, Denton E. Asthma in children and adults-what are the differences and what can they tell us about asthma? Front Pediatr. 2019;7:256. doi:10.3389/fped.2019.00256
39. Silverstein MD, Reed CE, O’Connell EJ, Melton LJ 3rd, O’Fallon WM, Yunginger JW. Long-term survival of a cohort of community residents with asthma. N Engl J Med. 1994;331(23):1537–1541. doi:10.1056/nejm199412083312301
 © 2023 The Author(s). This work is published and licensed by Dove Medical Press Limited. The full terms of this license are available at https://www.dovepress.com/terms.php and incorporate the Creative Commons Attribution - Non Commercial (unported, v3.0) License.
By accessing the work you hereby accept the Terms. Non-commercial uses of the work are permitted without any further permission from Dove Medical Press Limited, provided the work is properly attributed. For permission for commercial use of this work, please see paragraphs 4.2 and 5 of our Terms.
© 2023 The Author(s). This work is published and licensed by Dove Medical Press Limited. The full terms of this license are available at https://www.dovepress.com/terms.php and incorporate the Creative Commons Attribution - Non Commercial (unported, v3.0) License.
By accessing the work you hereby accept the Terms. Non-commercial uses of the work are permitted without any further permission from Dove Medical Press Limited, provided the work is properly attributed. For permission for commercial use of this work, please see paragraphs 4.2 and 5 of our Terms.