")
Back to Journals » Infection and Drug Resistance » Volume 16
RDW-SD is Superior to RDW-CV in Reflecting Liver Fibrosis Stage in Patients with Chronic Hepatitis B
Authors Yang K, Sun B, Zhang S, Pan Y, Fang J
Received 21 June 2023
Accepted for publication 18 September 2023
Published 27 October 2023 Volume 2023:16 Pages 6881—6891
DOI https://doi.org/10.2147/IDR.S427047
Checked for plagiarism Yes
Review by Single anonymous peer review
Peer reviewer comments 2
Editor who approved publication: Professor Sandip Patil
Kai Yang,1 Beibei Sun,2 Shicheng Zhang,3 Ying Pan,1 Jun Fang4
1Department of Medical Technology, Anhui Medical College, Hefei, Anhui, 230601, People’s Republic of China; 2Department of Clinical Laboratory, the Second Hospital of Anhui Medical University, Hefei, Anhui, 230601, People’s Republic of China; 3School of Public Health and Health Management, Anhui Medical College, Hefei, Anhui, 230601, People’s Republic of China; 4Faculty of Pharmaceutical Science, Sojo University, Kumamoto, 860-0082, Japan
Correspondence: Jun Fang, Faculty of Pharmaceutical Science, Sojo University, Ikeda 4-22-1, Kumamoto, 860-0082, Japan, Email [email protected]
Purpose: The clinical significance of the red blood cell distribution width (RDW)-coefficient of variation (RDW-CV) has been recognized in numerous diseases, but few studies have investigated the usefulness of RDW-standard deviation (RDW-SD). This study aimed to compare the utility of RDW-SD and RDW-CV in evaluating liver fibrosis stage in patients with chronic hepatitis B (CHB).
Patients and Methods: In this retrospective study, we enrolled 720 treatment-naïve CHB patients and 578 healthy controls, and evaluated their clinical parameters. In CHB patients, the associations between RDW-CV and liver fibrosis stage were analyzed as compared to RDW-SD using one-way analysis of variance (ANOVA), Spearman’s rank correlation, student’s t-test, binary logistic regression, and receiver operating characteristic (ROC) curve.
Results: RDW-SD, rather than RDW-CV was significantly elevated in CHB patients compared with healthy controls. Correlation analysis showed a stronger association between RDW-SD and liver fibrosis stage than RDW-CV in CHB patients. RDW-CV and RDW-SD are both independent predictors of significant fibrosis. For the diagnosis of significant fibrosis, the area under the receiver operating characteristic curve (AUC) for RDW-CV was 0.599, while for RDW-SD, it was 0.706. RDW-to-platelet ratio (RPR), a novel index for liver fibrosis calculated as RDW-CV/platelet, exhibited an AUC of 0.730. This AUC increased to 0.752 when RDW-CV in the RPR formula was replaced with RDW-SD. Additionally, subgroup analyses based on age, gender, and HBeAg status showed that the AUC for RDW-SD in diagnosing significant fibrosis was significantly greater than that for RDW-CV, with statistically significant differences.
Conclusion: RDW-SD showed superiority in reflecting liver fibrosis stage and diagnosing liver significant fibrosis than RDW-CV in treatment-naïve CHB patients.
Keywords: red blood cell distribution width, liver fibrosis, chronic hepatitis B
Introduction
Red blood cells (RBCs) account for the most numerous cell type in the bloodstream and serve various physiological functions.1 Besides their well-known roles in oxygen and carbon dioxide transport, RBCs also play a role in systemic nitric oxide metabolism, redox balance, and inflammatory response regulation.2,3 Thus, it is not surprising that abnormal RBCs indices, such as mean corpuscular volume (MCV), mean corpuscular hemoglobin (MCH), mean cell hemoglobin concentration (MCHC), and red blood cell distribution width (RDW), have been linked to neurodegenerative diseases, metabolic disorders, cardiovascular disease, hepatorenal disorders, and cancer.4–6 Among these indices, RDW is one of the indices routinely reported in the complete blood count (CBC) test, and it reflects the size variability of RBCs in peripheral blood. Previously, RDW was primarily used for the differential diagnosis of anemia in the hematologic field.7 However, increasing evidence suggests that RDW could be a significant predictor of outcomes in various diseases, including chronic liver disease.8,9 Moreover, some researchers have developed a novel non-invasive index called the RPR and discovered that it can be used to evaluate liver fibrosis and cirrhosis across a wide array of chronic liver diseases.10,11 However, it is important to note that in these studies, RDW is calculated as a ratio by multiplying one standard deviation (SD) of the RBCs volume by the MCV and then multiplying the result by 100. This method of calculating RDW is now commonly referred to as RDW-coefficient of variation (RDW-CV). Recently, certain blood cell analyzers have the capability to offer an alternative type of RDW measurement, known as RDW-standard deviation (RDW-SD), as part of the CBC test. Unlike RDW-CV, RDW-SD is not a ratio but rather a direct measurement of the width of the distribution curve of RBCs volume at a level 20% above the baseline. Currently, RDW-SD is considered a more accurate indicator of variations in RBCs size than RDW-CV for the following reasons. Firstly, RDW-CV equation uses MCV as the denominator, and any changes in MCV may affect the accuracy of RDW-CV in reflecting RBCs volume differences.12 For example, in chronic liver disease, RBCs have highly heterogeneous volumes with high MCV.13 Therefore, RDW-CV may underestimate the deviation of RBCs width. However, RDW-SD is an absolute value that is not influenced by MCV. Secondly, RDW-CV is limited to measuring the RBCs distribution within ±1 SD range by using 1 SD as the numerator, excluding other abnormally sized cells beyond this range. In contrast, RDW-SD measures a wider range of RBCs volume distribution that extends beyond ±1 SD, making it a better representative of RBCs volume heterogeneity.14 Indeed, there is evidence that using RDW-SD instead of RDW-CV makes it easier to identify certain patients with anemia.12
Hepatitis B virus (HBV) is a DNA virus that primarily infects liver cells and causes chronic hepatitis B (CHB) infection. CHB affects approximately 296 million people worldwide, with 30% of cases in China.15 Upon infection, the human immune system is activated and initiates T cell-mediated cellular immunity and B cell-mediated humoral immunity to attack the virus.16,17 Although these responses can clear most of the infection, they also cause severe immune-mediated inflammation and liver cell damage, leading to hepatitis. Inflammation and regeneration processes release cytokines and chemokines that activate hepatic stellate cells (HSCs) and promote the development of liver fibrosis.18–20 Liver fibrosis is a critical turning point in the progression of chronic hepatitis towards end-stage liver disease (ESLD), as it is the main precursor lesion for cirrhosis and liver cancer.21 If left untreated, liver fibrosis can progress to cirrhosis and eventually lead to ESLD, such as liver failure and liver cancer.22 Thus, early detection and treatment of liver fibrosis is essential to prevent severe liver complications and improve patients’ quality of life and prognosis. While several studies have evaluated the clinical value of RDW-CV in predicting liver fibrosis progression and cirrhosis outcome in chronic HBV-infected patients, data on RDW-SD are still limited. Therefore, this study aims to investigate the potential clinical significance of RDW-SD in reflecting liver fibrosis in treatment-naive HBV-infected individuals.
Materials and Methods
Study Design and Patients
This study enrolled 720 CHB patients from the Second Hospital of Anhui Medical University between April 2011 and July 2019. These patients were newly diagnosed with CHB and had not received any prior antiviral treatment. The inclusion criteria were as follows: age between 18 and 75 years, detectable hepatitis B surface antigen (HBsAg) in serum for at least 6 months, and the absence of serological markers for other types of viral hepatitis, including hepatitis A, hepatitis C, hepatitis E, cytomegalovirus hepatitis, and Epstein-Barr virus hepatitis. Participants co-infected with human immunodeficiency virus (HIV), individuals with decompensated cirrhosis (DLC), liver failure (LF), hepatocellular carcinoma (HCC), or extrahepatic malignancies were excluded from the study. Additionally, 578 healthy controls who matched the age and sex of the patient group and visited the same hospital for physical examination during the same period were selected. The study was conducted in accordance with the Helsinki Declaration of 1983 and was approved by the Ethics Boards of Anhui Medical College and the Second Hospital of Anhui Medical University. Informed consent was obtained from all participants.
Liver Histology Examination
The patients underwent ultrasound-guided liver biopsies within one day of admission. Liver specimens shorter than 15 mm were considered unqualified. The qualified specimens were fixed with 10% neutral formalin, embedded in paraffin, and stained with H&E and Masson trichrome. The histological assessment of each liver biopsy tissue was performed under double-blind conditions by two independent experienced pathologists in the Department of Pathology at the Second Hospital of Anhui Medical University, according to the METAVIR scoring system. The degree of liver fibrosis was staged from F0-F4, and significant fibrosis was defined as ≥F2.
Laboratory Tests
Various biochemical parameters were analyzed using a Siemens Dimension RXL automated chemistry analyzer (Diamond Diagnostics, Holliston, MA), including total protein (TP), albumin, globulin, alanine aminotransferase (ALT), aspartate aminotransferase (AST), total bilirubin (TBIL), alkaline phosphatase (ALP), gamma-glutamyl transpeptidase (γ-GGT), blood urea nitrogen (BUN), creatinine, and uric acid. Hematological parameters, such as white blood count (WBC), neutrophils, lymphocytes, monocytes, RBCs count, hemoglobin (Hb), MCV, MCH, MCHC, RDW-CV, RDW-SD, platelet count, platelet distribution width (PDW), and mean platelet volume (MPV), were determined using a Sysmex XE2100 hematology analyzer (Sysmex Corporation, Kobe, Japan). Virological parameters, such as HBsAg and hepatitis B e antigen (HBeAg), were measured using an Abbott Architect i2000 system (Abbott Laboratories, Chicago, IL, USA), and hepatitis B virus DNA (HBV DNA) was detected using a Strata Gene MX3000P Detection System (Stratagene, La Jolla, CA, USA).
Statistical Analysis
The data were analyzed using SPSS software (version 19.0, SPSS Inc., Chicago, IL, USA) or MedCalc statistical software (version 20.118, MedCalc Software Ltd., Ostend, Belgium). Descriptive statistics are presented as mean ± standard deviation or number (percentage). The chi-square test was used to compare categorical variables, and the Student’s t-test, Mann–Whitney U-test, or one-way ANOVA was used to compare continuous variables as appropriate. Correlations between RDW-CV, RDW-SD, and liver fibrosis stage were evaluated using Spearman’s rank correlation coefficient analysis. Binary logistic regression was used to identify risk factors for significant liver fibrosis. The diagnostic ability of RDW-CV and RDW-SD to identify significant fibrosis was assessed using receiver-operating characteristic (ROC) curve analysis. The areas under the curves (AUCs) were compared using the DeLong method.23 Statistical significance was defined as a P value less than 0.05.
Results
RDW-CV and RDW-SD in CHB Patients and Healthy Controls
The demographic and clinical data of the subjects are presented in Table 1. Overall, the age and gender distributions were comparable between CHB patients and healthy controls. However, many biochemical and hematological parameters in CHB patients were significantly altered. Among the biochemical parameters, serum TP, albumin, and BUN levels were significantly lower in CHB patients compared to healthy controls, while serum globulin, ALT, AST, TBIL, ALP, GGT, and creatinine levels were significantly higher in CHB patients. Among the hematological parameters, RBCs count and hemoglobin were significantly lower, and MCV, MCH, and MCHC were significantly higher in CHB patients compared to those in healthy controls. Notably, RDW-SD was significantly higher in CHB patients than in healthy controls, while RDW-CV was not. Additionally, METAVIR fibrosis stage in CHB patients was classified as F0 (43 patients; 6.0%), F1 (358 patients; 49.7%), F2 (185 patients; 25.7%), F3 (82 patients; 11.4%), and F4 (52 patients; 7.2%).
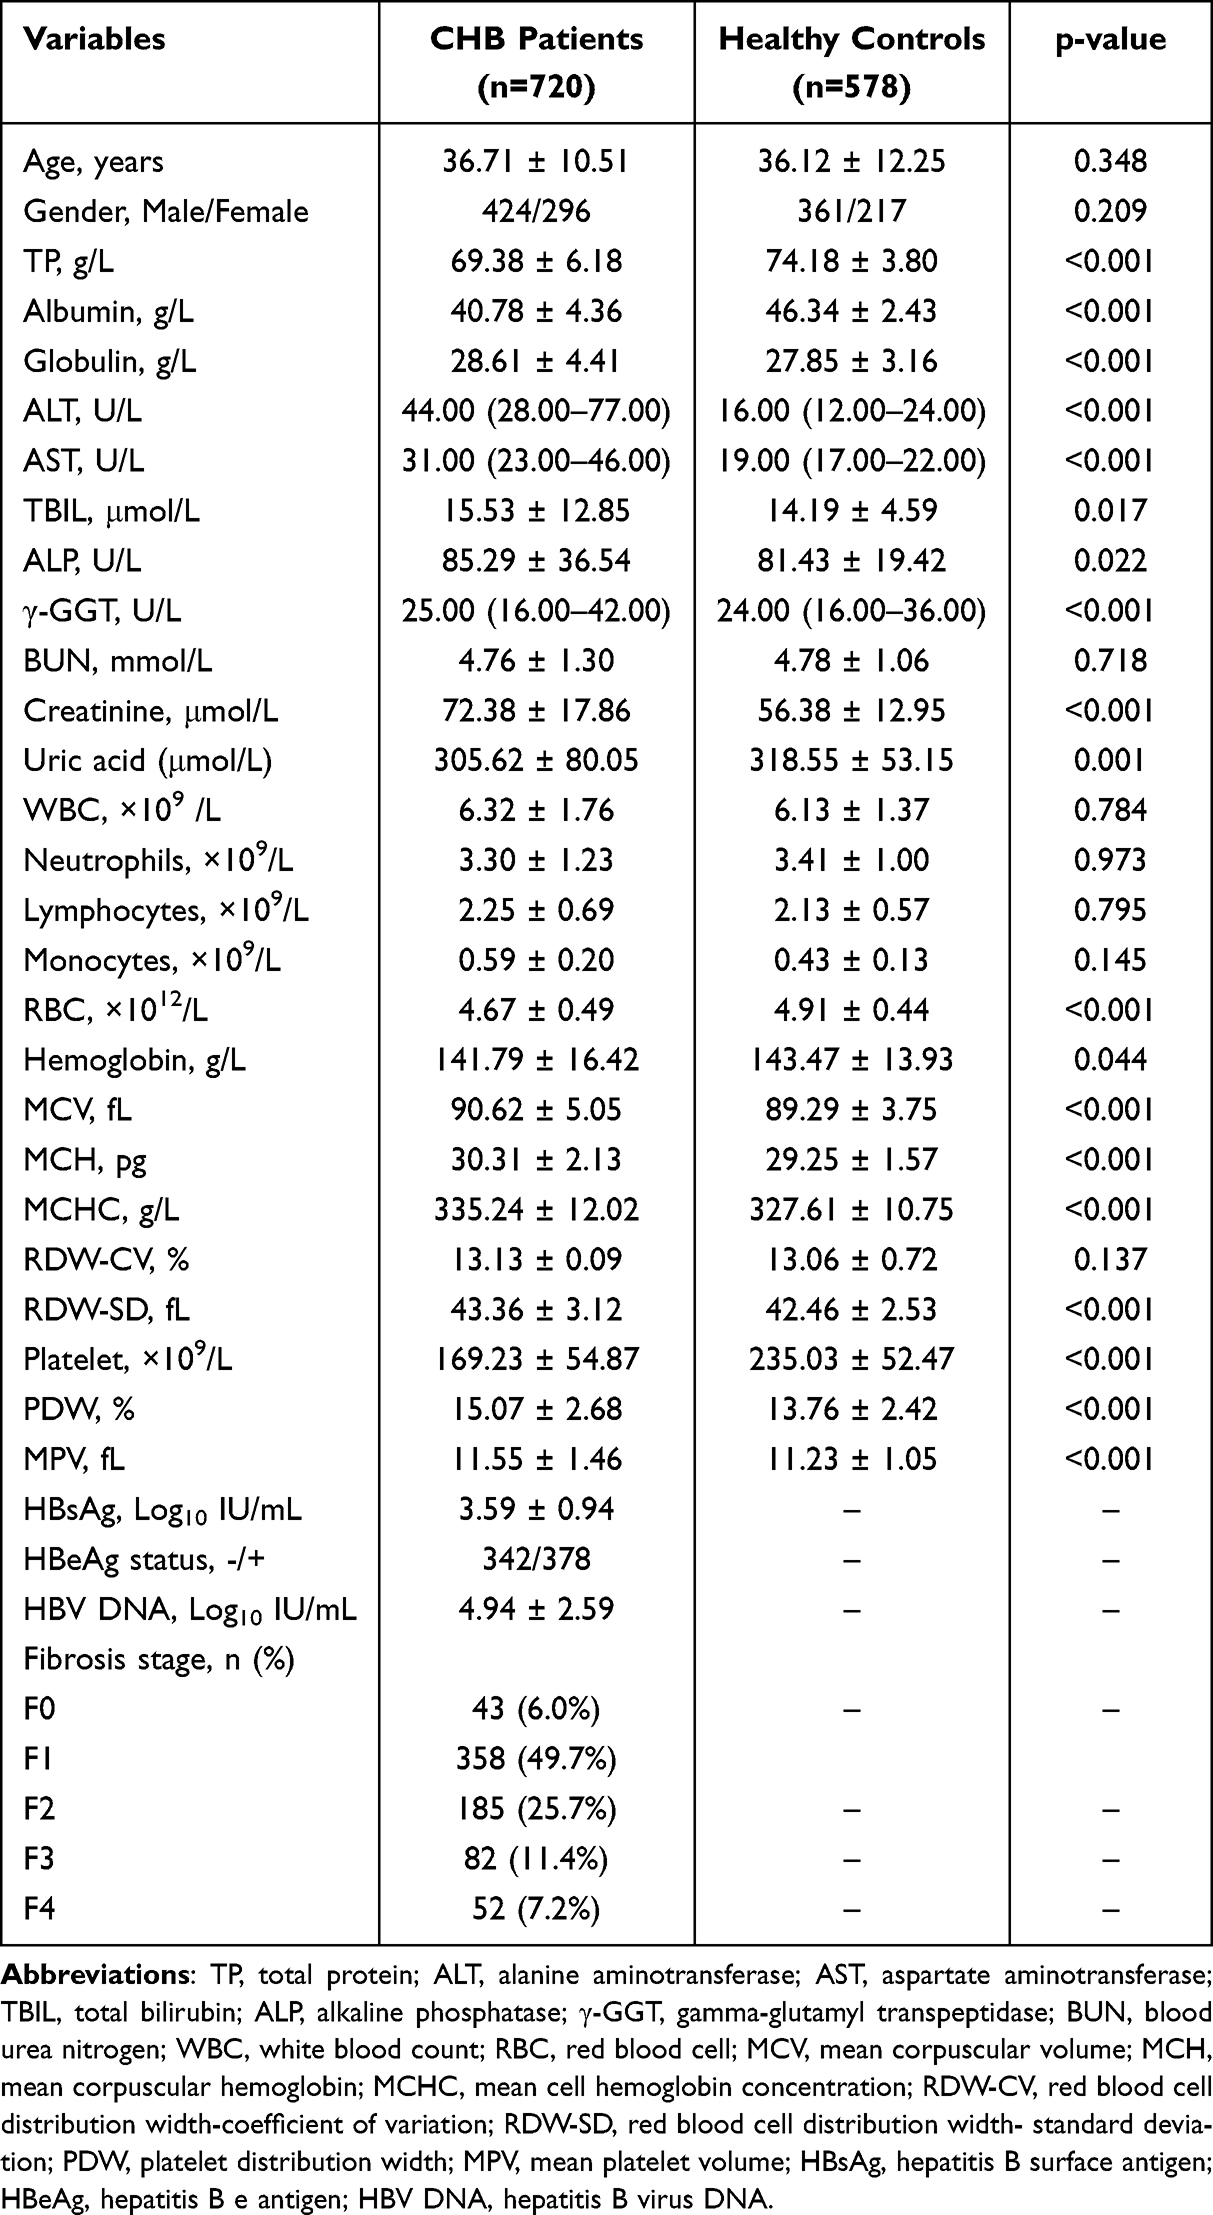 |
Table 1 The Demographic and Clinical Characteristics of CHB Patients and Healthy Controls |
Correlations Between RDW-CV, RDW-SD and Liver Fibrosis Stages
Dot plots of RDW-CV and RDW-SD in relation to the METAVIR fibrosis stage were presented in Figure 1A and B, respectively. A one-way ANOVA revealed a significant increase in both RDW-CV (F=4.310, p=0.001) and RDW-SD (F=36.868, p<0.001) with the progression of liver fibrosis. Further analysis indicated that RDW-CV and RDW-SD were positively correlated with liver fibrosis stage, with a correlation coefficient of 0.159 for RDW-CV (p<0.001) and of 0.410 for RDW-SD (p<0.001), according to the Spearman’s rank correlation test, as shown in Figure 1C and D. Additionally, RDW-CV (t=3.290, p=0.001) and RDW-SD (t=10.000, p<0.001) were found to be significantly higher in CHB patients with significant fibrosis (F2-F4) compared to patients with no significant fibrosis (F0-F1), as shown in Figure 1E and F, respectively.
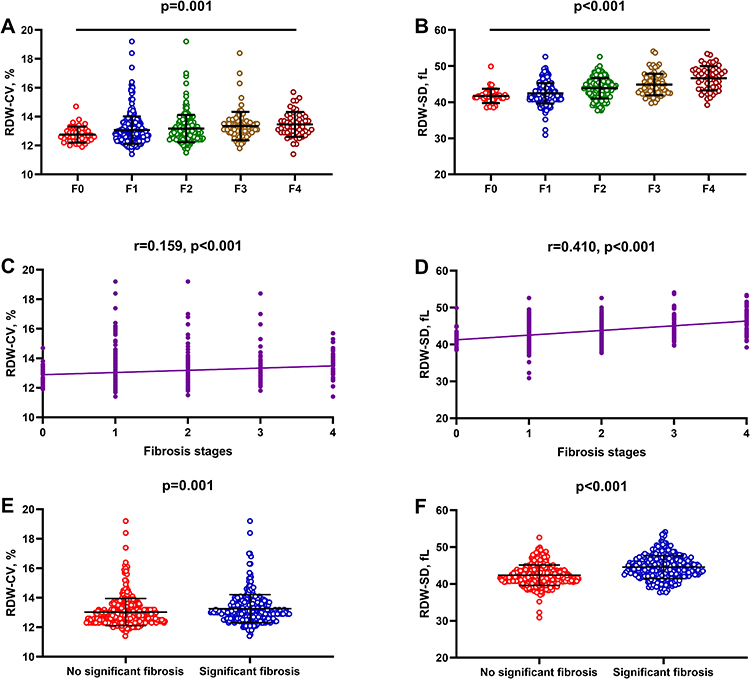 |
Figure 1 Associations between RDW-CV, RDW-SD, and liver fibrosis stages. (A) Comparisons of RDW-CV across liver fibrosis stages. (B) Comparisons of RDW-SD across liver fibrosis stages. (C) Correlations between RDW-CV and liver fibrosis stages. (D) Correlations between RDW-SD and liver fibrosis stages. (E) Comparison of RDW-CV between patients with and without significant fibrosis. (F) Comparison of RDW-SD between patients with and without significant fibrosis. |
Both RDW-CV and RDW-SD Independently Predict Significant Fibrosis
The close association of RDW-CV and RDW-SD with liver fibrosis stages prompted us to investigate whether RDW-CV and RDW-SD are independent predictors of liver fibrosis. Table 2 presents a comparison of demographic characteristics and clinical parameters between patients with and without significant fibrosis. Table 3 displays the results of the prediction study using significant fibrosis as the dependent variable, conducted through uni- and multivariate logistic regression. Since RDW-CV and RDW-SD are highly correlated parameters, we included them separately in the multivariate logistic regression analysis. In the univariate regression analysis, the following parameters were found to be associated with significant fibrosis: age (p=0.005), gender (p=0.014), albumin (p=0.004), globulin (p=0.001), ALT (p=0.001), AST (p<0.001), TBIL (p<0.001), ALP (p<0.001), GGT (p<0.001), WBC (p=0.001), neutrophils (p=0.011), lymphocytes (p<0.001), red blood cells (p=0.041), MCV (p<0.001), MCH (p<0.001), RDW-CV (p=0.001), RDW-SD (p<0.001), platelets (p<0.001), PDW (p<0.001), MPV (p=0.008), HBsAg (p<0.001), and HBV DNA (p=0.018). Subsequently, through two separate multivariate logistic regression analyses, we determined that both RDW-CV (p<0.001) and RDW-SD (p<0.001) are independent predictors of significant fibrosis in CHB patients.
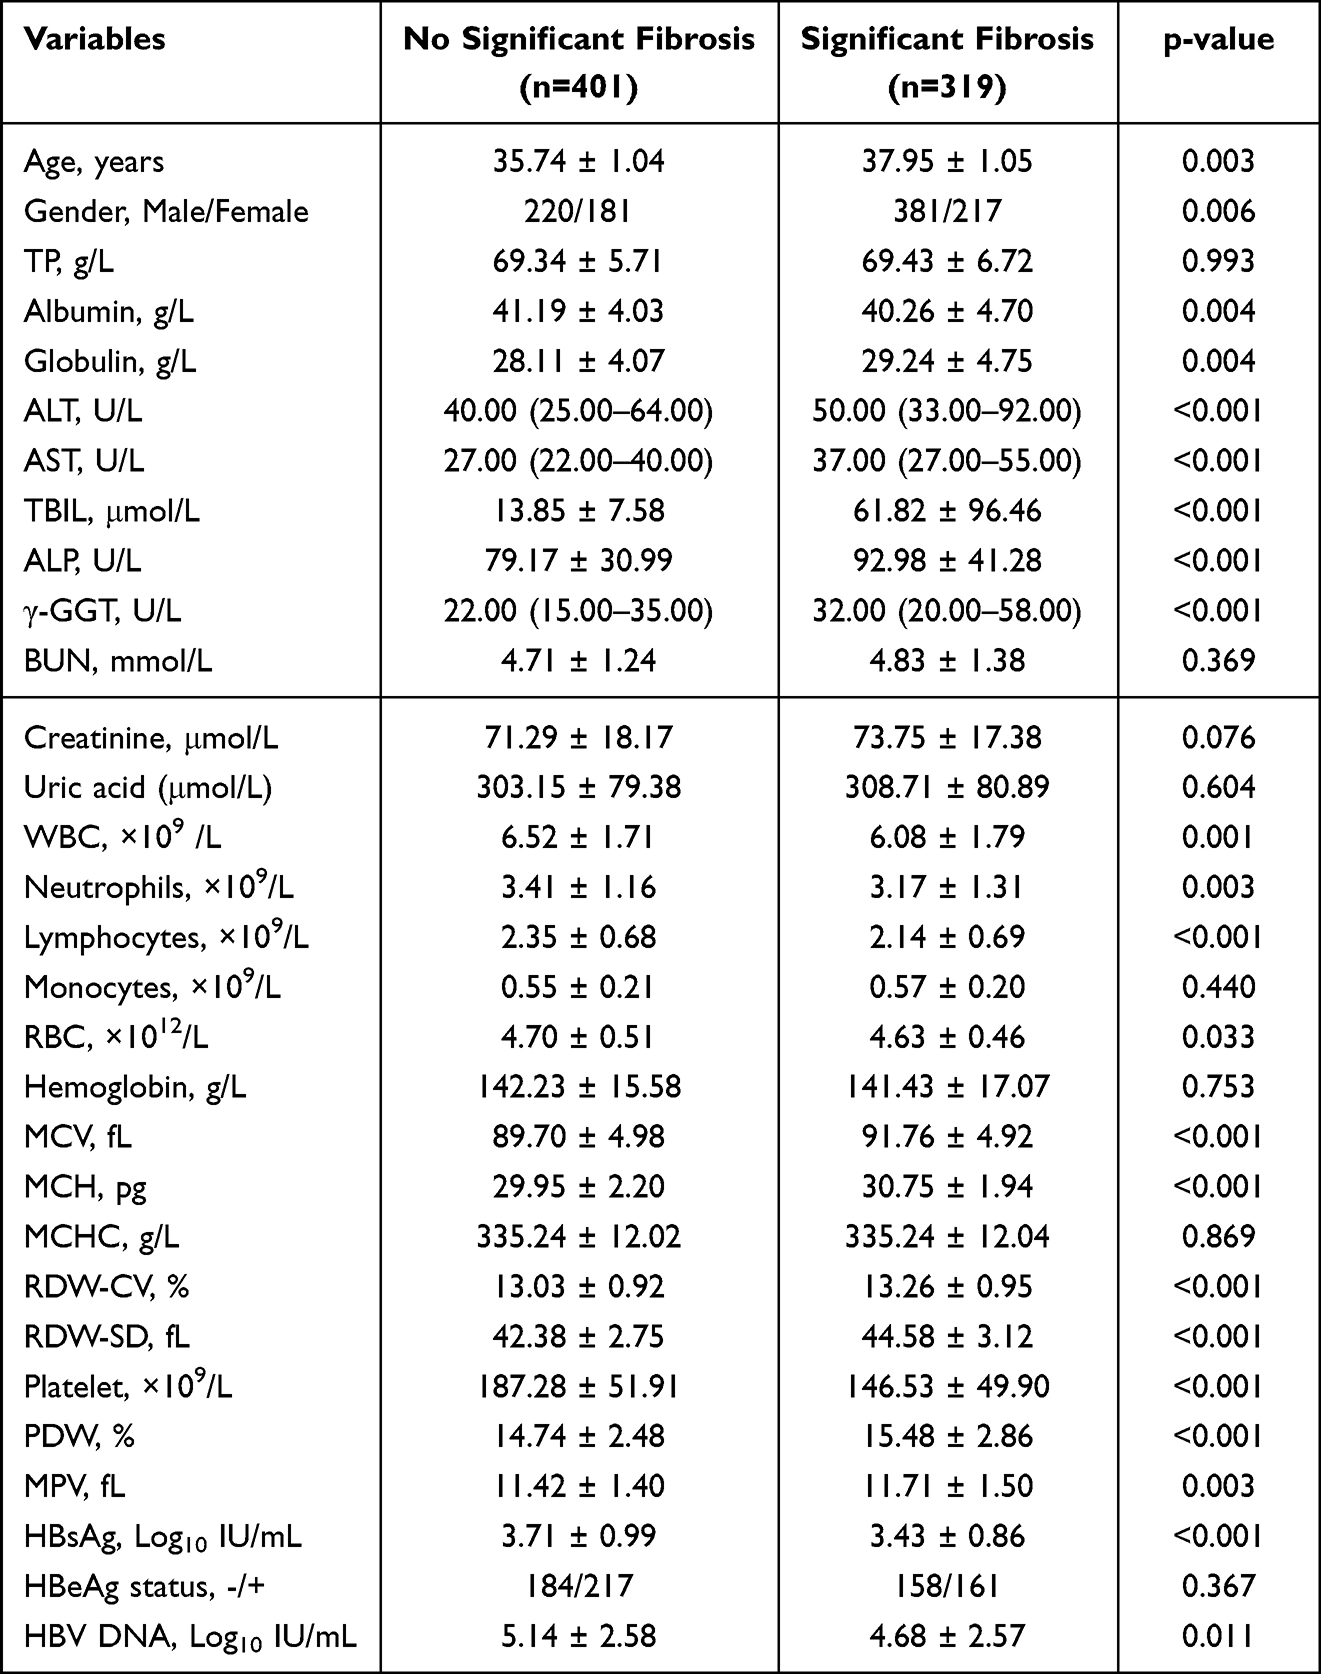 |
Table 2 The Demographic and Clinical Characteristics of CHB Patients with and without Significant Fibrosis |
 |
Table 3 Univariate and Multivariate Analysis of Clinical Parameters Associated with Significant Liver Fibrosis |
Efficacy of RDW-CV and RDW-SD for Diagnosing Significant Fibrosis
Figure 2A displays the ROC curves for diagnosing significant fibrosis, revealing AUCs of 0.599 (95% confidence interval [CI]: 0.562–0.635) for RDW-CV and 0.706 (95% CI: 0.671–0.762) for RDW-SD. A significant difference existed between the AUCs (p<0.001). The cut-off values for diagnosing significant fibrosis were determined by the maximum Youden index, resulting in 12.8% for RDW-CV (sensitivity 61.71%, specificity 50.87%) and 43.4 fL for RDW-SD (sensitivity 61.76%, specificity 71.82%). As the RPR has been established as an easily calculated index for diagnosing significant fibrosis, we investigated whether replacing RDW-CV with RDW-SD in the RPR calculation formula could improve diagnostic performance. To avoid confusion, we re-named the RPR after the replacement as RsdPR. Figure 2B demonstrates that the AUC of RsdPR (0.752, 95% CI: 0.719–0.783) significantly outperforms RPR (0.730, 95% CI: 0.696–0.762), and the DeLong test revealed a statistically significant difference in AUC between RsdPR and RPR (p<0.001, Z=5.744). We subsequently conducted subgroup analyses for the AUC of RDW-CV and RDW-SD in different populations, as shown in Figure 2C–H. In the age subgroup analysis, the AUC for diagnosing significant fibrosis in patients younger than 30 was 0.650 (95% CI: 0.584–0.713) for RDW-CV and 0.749 (95% CI: 0.687–0.805) for RDW-SD. For patients aged 30 or older, the AUC for RDW-CV was 0.571 (95% CI: 0.527–0.615), and for RDW-SD, it was 0.677 (95% CI: 0.634–0.718). In the gender subgroup analysis, the AUC for diagnosing significant fibrosis in female patients was 0.590 (95% CI: 0.531–0.646) for RDW-CV and 0.682 (95% CI: 0.626–0.735) for RDW-SD. For male patients, the AUC for RDW-CV was 0.605 (95% CI: 0.557–0.652), and for RDW-SD, it was 0.724 (95% CI: 0.678–0.766). In the HBeAg status subgroup analysis, the AUC for diagnosing significant fibrosis in HBeAg-negative patients was 0.589 (95% CI: 0.535–0.642) for RDW-CV and 0.683 (95% CI: 0.631–0.732) for RDW-SD. For HBeAg-positive patients, the AUC for RDW-CV was 0.606 (95% CI: 0.555–0.656), and for RDW-SD, it was 0.725 (95% CI: 0.677–0.770). In all of these subgroup analyses, the DeLong test revealed that the AUC for RDW-SD consistently exceeded that of RDW-CV and exhibited statistical significance.
 |
Figure 2 ROC curves of RDW-CV and RDW-SD. (A) ROC curves for diagnosing significant fibrosis using RDW-CV and RDW-SD in CHB patients. (B) ROC curves for diagnosing significant fibrosis using RPR and RsdPR in CHB patients. (C) ROC curves for diagnosing significant fibrosis using RDW-CV and RDW-SD in CHB patients younger than 30. (D) ROC curves for diagnosing significant fibrosis using RDW-CV and RDW-SD in CHB patients aged 30 or older. (E) ROC curves for diagnosing significant fibrosis using RDW-CV and RDW-SD in female CHB patients. (F) ROC curves for diagnosing significant fibrosis using RDW-CV and RDW-SD in male CHB patients. (G) ROC curves for diagnosing significant fibrosis using RDW-CV and RDW-SD in HBeAg-negative CHB patients. (H) ROC curves for diagnosing significant fibrosis using RDW-CV and RDW-SD in HBeAg-positive CHB patients. |
Discussion
The clinical significance of RDW in various diseases, especially liver disease, has been extensively studied. Liver fibrosis is a common pathway and pathological basis of chronic liver disease (CLD) that can progress to ESLD. While the association between RDW-CV and liver fibrosis is well-established, less is known about the relationship between RDW-SD and liver fibrosis, particularly in individuals infected with HBV. This study found that RDW-SD, but not RDW-CV, was significantly elevated in CHB patients compared to healthy controls. Furthermore, in CHB patients, RDW-SD displayed a significant and positive correlation with liver fibrosis staging, with a stronger correlation coefficient than RDW-CV. Importantly, although both RDW-CV and RDW-SD were independently associated with significant fibrosis in patients, RDW-SD demonstrated higher diagnostic value in discriminating significant fibrosis compared to RDW-CV. These findings provide important evidence supporting the potential applicability of RDW-SD in evaluating liver disease, where liver fibrosis is a central feature of disease progression.
RDW-SD, like RDW-CV, is a measure of the variation in RBCs size. However, compared to RDW-CV, the clinical applications of RDW-SD are limited. Recent studies have suggested that RDW-SD may provide additional diagnostic value over RDW-CV,12 as it is not influenced by MCV, which is frequently elevated in CLD patients. Therefore, when investigating the clinical value of RDW in CLD, the influence of MCV on RDW should be considered. In this study, we found that only RDW-SD was significantly elevated in CHB patients compared to healthy controls, likely due to the markedly elevated MCV observed in CHB patients. This leads to a smaller value of RDW-CV, which may be similar to that of healthy controls. Therefore, RDW-SD may offer a more accurate assessment of RBCs size heterogeneity in CHB patients.
Liver fibrosis is a precursor to cirrhosis.24 In recent years, numerous studies have shown that RDW is closely related to the progression of HBV-related liver disease, especially cirrhosis.25–27 However, it’s worth noting that most of these studies have focused on RDW-CV, rather than RDW-SD. Therefore, we next investigated the correlation of both RDW-CV and RDW-SD with liver fibrosis stage in CHB patients. Although both RDW-CV and RDW-SD significantly increased with higher fibrosis stages, the latter showed a stronger association with liver fibrosis stage than the former. To determine whether this differential correlation is influenced by MCV, we substituted RDW-SD and RDW-CV with (RDW-SD/MCV ratio) ×100 (substitution of 1SD by RDW-SD in the RDW-CV calculation) and MATH-1SD28 (calculation formula is RDW-CV × MCV/100) in the correlation analyses of liver fibrosis, respectively. In this scenario, RDW-SD/MCV ratio correlated weaker with liver fibrosis stage than RDW-SD (r=0.242 vs r=0.410) (Supplement Figure 1A), whereas MATH-1SD correlated stronger with liver fibrosis stage than RDW-CV (r=0.330 vs r=0.159) (Supplement Figure 1B). These results indicate that, unlike the RDW-CV equation which uses MCV as the denominator, RDW-SD removes the influence of MCV. Therefore, RDW-SD may be a more suitable parameter for reflecting the staging of liver fibrosis.
The determination of liver fibrosis status in CHB patients, particularly the identification of significant fibrosis, is crucial for effective clinical management.29 In this study, patients were divided into two groups based on the presence or absence of significant fibrosis. Multivariate logistic regression analysis revealed that both RDW-CV and RDW-SD were independent predictors of significant fibrosis. ROC analysis demonstrated that RDW-SD exhibited significantly superior diagnostic performance compared to RDW-CV for the diagnosis of significant fibrosis (AUC=0.706 vs AUC=0.599). RDW-SD had a higher specificity of 71.82% compared to the 50.87% specificity of RDW-CV, while their sensitivities were similar (61.76% vs 61.71%). This indicates that the diagnostic efficacy of RDW-SD over RDW-CV is mainly due to increased specificity.
The aspartate aminotransferase (AST)-to-platelet ratio index (APRI) and fibrosis-4 (FIB-4) index are commonly used non-invasive markers for predicting liver fibrosis in CHB patients. In this study, while the AUC of RDW-SD in distinguishing significant fibrosis is lower than that reported for APRI and FIB-4 in a systematic review and meta-analysis,30 RDW-SD is more convenient to use as it is a routine parameter in complete blood cell counts, in contrast to the complex calculations required for APRI and FIB-4. Recent studies have incorporated RDW-CV into a novel index named RPR for diagnosing liver fibrosis, with a meta-analysis of 13 studies reporting an AUC of 0.73 for significant fibrosis diagnosis.31 This is consistent with our findings. Interestingly, substituting RDW-CV with RDW-SD in the RPR calculation formula resulted in a significant improvement in diagnostic performance (AUC=0.752). Furthermore, upon conducting subgroup analyses for the AUC of RDW-CV and RDW-SD, we found that regardless of the age subgroup, gender subgroup, or HBeAg status subgroup, RDW-SD consistently outperformed RDW-CV in diagnosing significant fibrosis. Our findings strongly suggest that RDW-SD serves as a superior diagnostic marker for significant fibrosis in CHB patients compared to RDW-CV.
This study had a few limitations that need to be acknowledged. Firstly, it was a retrospective and single-center study. Therefore, it is essential to conduct prospective and external validation studies to substantiate the findings presented in this study. Secondly, a previous European study observed significant variability in RDW measurements across different hematological analyzers.32 This study solely utilized Sysmex XE-2100 for assessing RDW-CV and RDW-SD, necessitating the replication of our findings in other clinical laboratories employing various hematological analyzers to ensure their generalizability. Additionally, our study exclusively enrolled CHB patients; hence, it remains inconclusive whether the superiority of RDW-SD over RDW-CV in diagnosing liver fibrosis extends to other types of viral hepatitis, such as chronic hepatitis C (CHC).
In summary, the present study revealed the differential correlation between RDW-CV, RDW-SD and liver fibrosis stage, emphasizing the potential value of RDW-SD as a diagnostic index for significant fibrosis. Given that diagnosis of fibrosis within liver disease is important to evaluate the prognosis, it might also be worth testing RDW-SD as a prognostic evaluation index for other liver disease, such as liver cirrhosis, acute on chronic liver failure (ACLF) and HCC. This will be our next research direction.
Abbreviations
RDW-CV, Red blood cell distribution width-coefficient of variation; RDW-SD, Red blood cell distribution width-standard deviation; CHB, Chronic hepatitis B; RBCs, Red blood cells; MCV, Mean corpuscular volume; MCH, Mean corpuscular hemoglobin; MCHC, mean cell hemoglobin concentration; CBC, Complete blood count; RPR, Red blood cell distribution width-to-platelet ratio; HBV, Hepatitis B virus; HSCs, Hepatic stellate cells; ESLD, End-stage liver disease; HIV, Human immuno-deficiency virus; DLC, Decompensated liver cirrhosis; LF, liver failure; HCC, Hepatocellular carcinoma; TP, Total protein; ALT, Alanine aminotransferase; AST, Aspartate aminotransferase; TBIL, Total bilirubin; ALP, Alkaline phosphatase; γ-GGT, gamma-glutamyl transpeptidase; BUN, Blood urea nitrogen; Hb, hemoglobin; PDW, Platelet distribution width; MPV, Mean platelet volume; ACLF, Acute on chronic liver failure.
Data Sharing Statement
The datasets generated and/or analyzed during the current study are not publicly available due to privacy restrictions but are available from the corresponding author on reasonable request.
Ethical Statement
This study was approved by the Institutional Review Board of Anhui Medical College and the Second Hospital of Anhui Medical University (2023-LLBG-014). All participants provided written informed consent so that their clinical data could be used in this study.
Author Contributions
All authors made a significant contribution to the work reported, whether that is in the conception, study design, execution, acquisition of data, analysis and interpretation, or in all these areas; took part in drafting, revising or critically reviewing the article; gave final approval of the version to be published; have agreed on the journal to which the article has been submitted; and agree to be accountable for all aspects of the work.
Funding
This research was funded by the Project of Anhui Natural Science for Colleges and Universities (KJ2020ZD68).
Disclosure
The authors declare that they have no conflict of interest.
References
1. Dobkin J, Mangalmurti NS. Immunomodulatory roles of red blood cells. Curr Opin Hematol. 2022;29(6):306–309. doi:10.1097/MOH.0000000000000734
2. Mahdi A, Cortese-Krott MM, Kelm M, Li N, Pernow J. Novel perspectives on redox signaling in red blood cells and platelets in cardiovascular disease. Free Radic Biol Med. 2021;168:95–109. doi:10.1016/j.freeradbiomed.2021.03.020
3. Anderson HL, Brodsky IE, Mangalmurti NS. The evolving erythrocyte: red blood cells as modulators of innate immunity. J Immunol. 2018;201(5):1343–1351. doi:10.4049/jimmunol.1800565
4. Prasher VP, Uppal H, Parveen S, Adams C, Haque S. Ten year serial mean corpuscular volume--a peripheral marker for Alzheimer’s disease in Down syndrome. Int J Geriatr Psychiatry. 2013;28(10):1097–1098. doi:10.1002/gps.3956
5. Yamaguchi S, Hamano T, Oka T, et al. Mean corpuscular hemoglobin concentration: an anemia parameter predicting cardiovascular disease in incident dialysis patients. J Nephrol. 2022;35(2):535–544. doi:10.1007/s40620-021-01107-w
6. Mao W, Wu J. Haematologic indices in hepatitis B virus-related liver disease. Clin Chim Acta. 2020;500:135–142. doi:10.1016/j.cca.2019.10.007
7. Bessman JD, Gilmer PR, Gardner FH. Improved classification of anemias by MCV and RDW. Am J Clin Pathol. 1983;80(3):322–326. doi:10.1093/ajcp/80.3.322
8. Salvagno GL, Sanchis-Gomar F, Picanza A, Lippi G. Red blood cell distribution width: a simple parameter with multiple clinical applications. Crit Rev Clin Lab Sci. 2015;52(2):86–105. doi:10.3109/10408363.2014.992064
9. Fan X, Deng H, Wang X, et al. Association of red blood cell distribution width with severity of hepatitis B virus-related liver diseases. Clin Chim Acta. 2018;482:155–160. doi:10.1016/j.cca.2018.04.002
10. Chen B, Ye B, Zhang J, Ying L, Chen Y, Fung J. RDW to platelet ratio: a novel noninvasive index for predicting hepatic fibrosis and cirrhosis in chronic hepatitis B. PLoS One. 2013;8(7):e68780. doi:10.1371/journal.pone.0068780
11. Yuyun D, Zhihua T, Haijun W, et al. Predictive value of the red blood cell distribution width-to-platelet ratio for hepatic fibrosis. Scand J Gastroenterol. 2019;54(1):81–86. doi:10.1080/00365521.2018.1558786
12. Hoffmann JJML, Urrechaga E. Role of RDW in mathematical formulas aiding the differential diagnosis of microcytic anemia. Scand J Clin Lab Invest. 2020;80(6):464–469. doi:10.1080/00365513.2020.1774800
13. Remková A, Remko M. Homocysteine and endothelial markers are increased in patients with chronic liver diseases. Eur J Intern Med. 2009;20(5):482–486. doi:10.1016/j.ejim.2009.03.002
14. Hirahara N, Tajima Y, Fujii Y, et al. Comprehensive analysis of red blood cell distribution width as a preoperative prognostic predictor in gastric cancer. Anticancer Res. 2019;39(6):3121–3130. doi:10.21873/anticanres.13448
15. Ren S, Wang W, Lu J, et al. Effect of the change in antiviral therapy indication on identifying significant liver injury among chronic hepatitis B virus infections in the grey zone. Front Immunol. 2022;13:1035923. doi:10.3389/fimmu.2022.1035923
16. Khanam A, Chua JV, Kottilil S. Immunopathology of chronic hepatitis B infection: role of innate and adaptive immune response in disease progression. Int J Mol Sci. 2021;22(11):5497. doi:10.3390/ijms22115497
17. Chiale C, Marchese AM, Robek MD. Innate immunity and HBV persistence. Curr Opin Virol. 2021;49:13–20. doi:10.1016/j.coviro.2021.04.003
18. Xie X, Lv H, Liu C, et al. HBeAg mediates inflammatory functions of macrophages by TLR2 contributing to hepatic fibrosis. BMC Med. 2021;19(1):247. doi:10.1186/s12916-021-02085-3
19. Li X, Su Y, Hua X, et al. Levels of hepatic Th17 cells and regulatory T cells upregulated by hepatic stellate cells in advanced HBV-related liver fibrosis. J Transl Med. 2017;15(1):75. doi:10.1186/s12967-017-1167-y
20. Yao QY, Feng YD, Han P, Yang F, Song GQ. Hepatic microenvironment underlies fibrosis in chronic hepatitis B patients. World J Gastroenterol. 2020;26(27):3917–3928. doi:10.3748/wjg.v26.i27.3917
21. Li Y, He M, Wang Z, et al. STING signaling activation inhibits HBV replication and attenuates the severity of liver injury and HBV-induced fibrosis. Cell Mol Immunol. 2022;19(1):92–107. doi:10.1038/s41423-021-00801-w
22. Berumen J, Baglieri J, Kisseleva T, Mekeel K. Liver fibrosis: pathophysiology and clinical implications. WIREs Mech Dis. 2021;13(1):e1499. doi:10.1002/wsbm.1499
23. DeLong ER, DeLong DM, Clarke-Pearson DL. Comparing the areas under two or more correlated receiver operating characteristic curves: a nonparametric approach. Biometrics. 1988;44(3):837–845. doi:10.2307/2531595
24. Roehlen N, Crouchet E, Baumert TF. Liver fibrosis: mechanistic concepts and therapeutic perspectives. Cells. 2020;9(4):875. doi:10.3390/cells9040875
25. Huang R, Yang C, Wu K, et al. Red cell distribution width as a potential index to assess the severity of hepatitis B virus-related liver diseases. Hepatol Res. 2014;44(14):E464–E470. doi:10.1111/hepr.12342
26. Zhu M, Han M, Xiao X, et al. Dynamic differences of red cell distribution width levels contribute to the differential diagnosis of hepatitis B virus-related chronic liver diseases: a case-control study. Int J Med Sci. 2019;16(5):720–728. doi:10.7150/ijms.31826
27. Zhang M, Chen S, Zhu X, et al. Value of red cell distribution width in assessing the severity of hepatitis B virus-related decompensated cirrhosis. Clin Lab. 2017;63(9):1467–1474. doi:10.7754/Clin.Lab.2017.170331
28. Caporal FA, Comar SR. Evaluation of RDW-CV, RDW-SD, and MATH-1SD for the detection of erythrocyte anisocytosis observed by optical microscopy. J Bras Patol E Med Lab. 2013;49:324–331. doi:10.1590/S1676-24442013000500005
29. Liao B, Wang Z, Lin S, et al. Significant fibrosis is not rare in Chinese chronic hepatitis B patients with persistent normal ALT. PLoS One. 2013;8(10):e78672. doi:10.1371/journal.pone.0078672
30. Xiao G, Yang J, Yan L. Comparison of diagnostic accuracy of aspartate aminotransferase to platelet ratio index and fibrosis-4 index for detecting liver fibrosis in adult patients with chronic hepatitis B virus infection: a systemic review and meta-analysis. Hepatology. 2015;61(1):292–302. doi:10.1002/hep.27382
31. Chen M, Wu Z, Du Z, Sun S, Wu J, Luo J. Diagnostic accuracy of red blood cell distribution width to platelet ratio for predicting liver fibrosis in patients with chronic hepatitis B: a meta-analysis. Gastroenterol Hepatol. 2022;45(5):361–372. doi:10.1016/j.gastrohep.2021.10.001
32. Lippi G, Pavesi F, Bardi M, Pipitone S. Lack of harmonization of red blood cell distribution width (RDW). Evaluation of four hematological analyzers. Clin Biochem. 2014;47(12):1100–1103. doi:10.1016/j.clinbiochem.2014.06.003
 © 2023 The Author(s). This work is published and licensed by Dove Medical Press Limited. The full terms of this license are available at https://www.dovepress.com/terms.php and incorporate the Creative Commons Attribution - Non Commercial (unported, v3.0) License.
By accessing the work you hereby accept the Terms. Non-commercial uses of the work are permitted without any further permission from Dove Medical Press Limited, provided the work is properly attributed. For permission for commercial use of this work, please see paragraphs 4.2 and 5 of our Terms.
© 2023 The Author(s). This work is published and licensed by Dove Medical Press Limited. The full terms of this license are available at https://www.dovepress.com/terms.php and incorporate the Creative Commons Attribution - Non Commercial (unported, v3.0) License.
By accessing the work you hereby accept the Terms. Non-commercial uses of the work are permitted without any further permission from Dove Medical Press Limited, provided the work is properly attributed. For permission for commercial use of this work, please see paragraphs 4.2 and 5 of our Terms.