Back to Journals » Clinical Ophthalmology » Volume 20
Rapid Macular Thinning as a Biomarker for Geographical Atrophy
Authors Cukurova F ![]() , Ramsey DJ
, Ramsey DJ ![]()
Received 11 February 2026
Accepted for publication 30 April 2026
Published 20 May 2026 Volume 2026:20 602755
DOI https://doi.org/10.2147/OPTH.S602755
Checked for plagiarism Yes
Review by Single anonymous peer review
Peer reviewer comments 2
Editor who approved publication: Dr Yousef Fouad
Feyza Cukurova,1,2,* David J Ramsey1,3,*
1Division of Ophthalmology, Department of Surgery, UMass Chan – Lahey School of Medicine, Burlington, MA, 01805, USA; 2Department of Ophthalmology, Beyoglu Eye Training and Research Hospital, Istanbul, 34421, Turkey; 3Department of Ophthalmology, Tufts University School of Medicine, Boston, MA, 02111, USA
*These authors contributed equally to this work
Correspondence: David J Ramsey, Department of Surgery, UMass Chan – Lahey School of Medicine, Burlington, MA, 01805, USA, Email [email protected]
Purpose: To assess the rate of retinal thinning as a biomarker for incident late-stage age-related macular degeneration (AMD).
Methods: This retrospective cohort study included patients (aged ≥ 50 years) with ≥ 3 optical coherence tomography (OCT) macular scans ≥ 6 months apart. Eyes that developed ≥ 250 μm of complete retinal pigment epithelium (RPE) and outer retinal atrophy (cRORA) with associated hypertransmission through Bruch’s membrane on OCT were considered to have developed geographic atrophy (GA). The spatial pattern of macular thinning was assessed using the ETDRS rings centered on the foveola, calculated as a percentage change relative to its baseline value by eye.
Results: A total of 201 eyes met inclusion criteria. At last follow-up, 17 eyes developed GA (8.5%) at a median observation of 5.2 (2.4) years. The central subfield (1-mm) and inner ring (3-mm ETDRS subfield) thinned faster in eyes that developed incipient GA (central subfield thickness [CST]: − 1.59% vs. − 0.47% per year, p=0.007; inner ring: − 1.48% vs. − 0.65% per year, p< 0.001), while the outer ring (6-mm ETDRS subfield) thinned less rapidly (− 0.75% vs. − 0.30% per year, p=0.003). Linear regression identified the rate of inner ring thinning as the most significant predictor of GA, with a receiver operating characteristic curve demonstrating a high predictive accuracy (area under the curve [AUC], 0.821; 95% CI, 0.746– 0.896; p< 0.001).
Conclusion: Rapid thinning of the inner ETDRS ring is associated with incipient GA. Identifying eyes at risk of late AMD using serial OCT scans would permit personalized monitoring and treatment strategies critical for safeguarding vision.
Keywords: biomarker, disease progression, geographic atrophy, macular degeneration, optical coherence tomography, macula lutea
Introduction
Age-related macular degeneration (AMD) is a leading cause of progressive visual impairment among individuals aged 60 years of age and older in high-income countries.1,2 Regular monitoring of patients with AMD for evidence of progression to advanced stages of the disease is critical to provide treatments that safeguard vision.3 Early detection of advanced AMD makes it possible to begin treatment at less advanced stages of the disease, when eyes often have better vision and there is greater potential for achieving better long-term visual outcomes.4,5
Geographic atrophy (GA), an advanced form of non-neovascular (dry) AMD, is a chronic, progressive degeneration of the macula characterized by localized sharply demarcated loss of outer retinal tissue, retinal pigment epithelium (RPE), and the associated choriocapillaris. On average, it takes only 2.5 years from the initial identification of GA for central visual function to decline.6 Adoption of a healthy lifestyle, including not smoking and use of nutritional supplements have been shown to reduce the risk of advanced AMD.7–9 Although GA is traditionally identified on color fundus photographs and fundus autofluorescence (FAF) imaging, retinal thinning and other structural changes that develop prior to the development of GA are not easily observed with these techniques. Imaging by means of Spectral-Domain Optical Coherence Tomography (OCT), routinely performed to monitor patients with AMD, provides an opportunity to identify retinal changes associated with progression to advanced AMD.10–12
The aim of our study was to determine if retinal thickness data available in spectral-domain OCT scans of the macula routinely obtained to monitor patients with AMD could identify longitudinal patterns of thinning associated with the onset of GA or decreased visual acuity. Identifying eyes with rapid macular thinning would aid in personalizing monitoring schedules and inform therapeutic decision-making.
Methods
The research followed the tenets of the Declaration of Helsinki and the STROBE reporting guidelines (https://www.equator-network.org/reporting-guidelines/strobe/).13 The requirement for informed consent was waived because of the retrospective nature of the study, and a waiver was granted by the Institutional Review Board of the Lahey Hospital & Medical Center, Burlington, MA. Data were gathered and secured in compliance with the Health Insurance Portability and Accountability Act.
Study Participants
The study comprised a retrospective, longitudinal cohort study of eyes from patients aged 50 years or older who received eye care at an academic medical center between June 1, 2012, and November 1, 2023. The stage of nonexudative AMD was determined based on the Beckman Classification and was validated through clinical examination and multimodal imaging.14 A customized reporting tool within the electronic health record (EHR) system (EPIC systems Inc., Verona, WI) was employed to identify patients by using International Classification of Diseases, Tenth Revision, Clinical Modification (ICD-10-CM) codes for early (H35.311x) or intermediate (H35.312x) nonexudative AMD.15
A retina specialist (DJR) reviewed the demographic (age, sex, race and ethnicity) and clinical data (visual acuity, slit-lamp biomicroscopy, imaging data, smoking history, and past medical history, including use of Age-Related Eye Disease Study [AREDS] vitamins) recorded in the EHR. All patients had at least three OCT scans of the macula (512 × 128) performed at least six months apart. Patients whose eyes had other eye diseases, such as diabetic retinopathy, high myopia (≤ –6.00 D) or high hypermetropia (≥ +6.00 D), retinal vascular diseases, central serous chorioretinopathy, uveitis, or were affected by an epiretinal membrane that impacted the central 1 mm Early Treatment Diabetic Retinopathy Study (ETDRS) subfield were excluded. Also excluded were eyes with a history of ocular surgery, other than cataract surgery performed at least three months prior to study inclusion. No patients had any history of exposure to medications or other agents known or suspected to be retinotoxic, such as hydroxychloroquine, tamoxifen, or pentosan polysulfate. Finally, patients whose eyes developed neovascular AMD were also excluded because of the potential impact of incipient macular neovascularization on retinal thickness measurements.16
Image Acquisition and Evaluation
Retinal thickness map measurements were obtained from each spectral-domain OCT macular cube scans (512 × 128) by using the built-in software (Cirrus, software version 11.5.2.54532; Carl Zeiss Meditec, Inc). Retinal thickness was calculated automatically as the distance between the vitreoretinal interface and RPE, based on reflectivity characteristics.
The average retinal thickness for the central 1-mm ETDRS subfield and inner (3-mm ETDRS) and outer (6-mm ETDRS) rings were measured in microns (µm) (Figure 1). At the time of inclusion, the index OCT scan was reviewed to confirm the absence of features indicative of advanced AMD. Linear measurements were performed on OCT B-scans in accordance with consensus definitions for complete RPE and outer retinal atrophy (cRORA) with associated hypertransmission through Bruch’s membrane.10–12 Progression to GA was defined as the development of cRORA with a linear extent ≥250 μm on OCT B-scans, accompanied by hypertransmission through Bruch’s membrane,17 the study endpoint. The location of incident GA was classified as subfoveal (ICD-10-CM H35.314x: advanced atrophic age-related macular degeneration with subfoveal involvement) or non-subfoveal (ICD-10-CM H35.313x: advanced atrophic age-related macular degeneration without subfoveal involvement).12
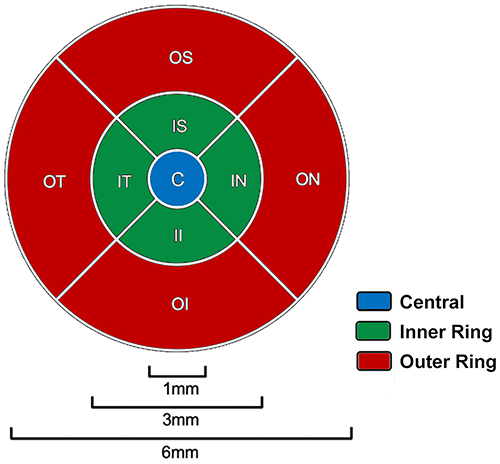 |
Figure 1 ETDRS grid map of the macula. The ETDRS grid consists of three concentric regions: the central subfield (blue, a circle centered on the foveola 1 mm in diameter used to define CST), the inner 3-mm ETDRS ring (green, 3 mm in outer diameter), and the outer 6-mm ETRDS ring (red, 6 mm in outer diameter). Each ring is further divided into four quadrants: superior (S), inferior (I), nasal (N), and temporal (T). Abbreviations: ETDRS, Early Treatment Diabetic Retinopathy Study; CST, central subfield thickness. |
Change in retinal thickness for each subfield was calculated by using the follow-up reference scan function to align subsequent scans with the baseline image. Rate of change is presented as a percentage change in thickness per year relative to its baseline value to control for the effects of age, sex, and eye-specific factors such as axial length and refractive error on macular thickness, calculated as: Δ subfield thickness (µm/year) ÷ baseline subfield thickness (µm) × 100.18,19 (Garcia-Valenzuela E et al IOVS 2002;43:ARVO E-Abstract 2574). This normalization reduces variability related to baseline differences in macular thickness across eyes. Images were excluded from analysis if there was low signal strength index (<5), blink artifacts, poor fixation resulting in motion or image doubling artifacts, localized loss of signal from media opacities, or major segmentation errors. Minor segmentation errors were manually corrected by using the built-in machine software. The uneven quality of longitudinal imaging data available for the eyes included in our study precluded reliable, automated segmentation of individual retinal layers.
Statistical Analysis
Data were analyzed using SPSS (Version 28.0, IBM, Armonk, NY). Data are reported as mean (±SD) for continuous variables that follow a normal distribution. For non-normally distributed variables and categorical data, the median, interquartile range (IQR), minimum, and maximum are provided for frequency (count), along with relative frequency (percentage). Student’s t-test was used to compare normally distributed quantitative variables, while nonparametric Wilcoxon signed rank test was used for non-normally distributed quantitative variables. Pearson’s correlation coefficient and Spearman rank correlation were used to evaluate the linear relationship between continuous and ordinal variables, respectively. Binary logistic regression models were utilized to determine the risk of developing GA based on various factors, including age and visual acuity. All tests were 2-sided and p-values below 0.05 were regarded as statistically significant.
Results
A total of 201 eyes from 142 patients were included in the study. The median (IQR) baseline age was 77 (interquartile range [IQR] 71 to 83) years and 65.5% of patients were female. Central subfield thickness (CST, 1 mm ETDRS subfield) demonstrated a modest age-related decline, with inner and outer rings showing a faster reduction with age (Figure 2). A weighted linear regression using the median age of each five-year bin as the predictor demonstrated a significant negative association between age and average retinal thickness within each ETDRS ring. Mean CST thickness decreased with age across five-year age bins (β = −0.278 µm/year, SE = 0.070, t(6) = −3.99, p = 0.007; R2 = 0.73). Similarly, the inner (ETDRS 3-mm) and outer (ETDRS 6-mm) rings showed a strong inverse associations between mean thickness and age across five-year age bins (outer ring: β = −0.55 µm/year, t(6) = −12.7, p < 0.001; R2 = 0.96; inner ring: β = −0.690 µm/year, SE = 0.058, t(6) = −11.80, p < 0.001; R2 = 0.96). Both the inner ring (p = 0.001) and outer ring (p = 0.014) thinned faster than the CST. By contrast, the rate of inner to outer ring thinning was similar (p = 0.406).
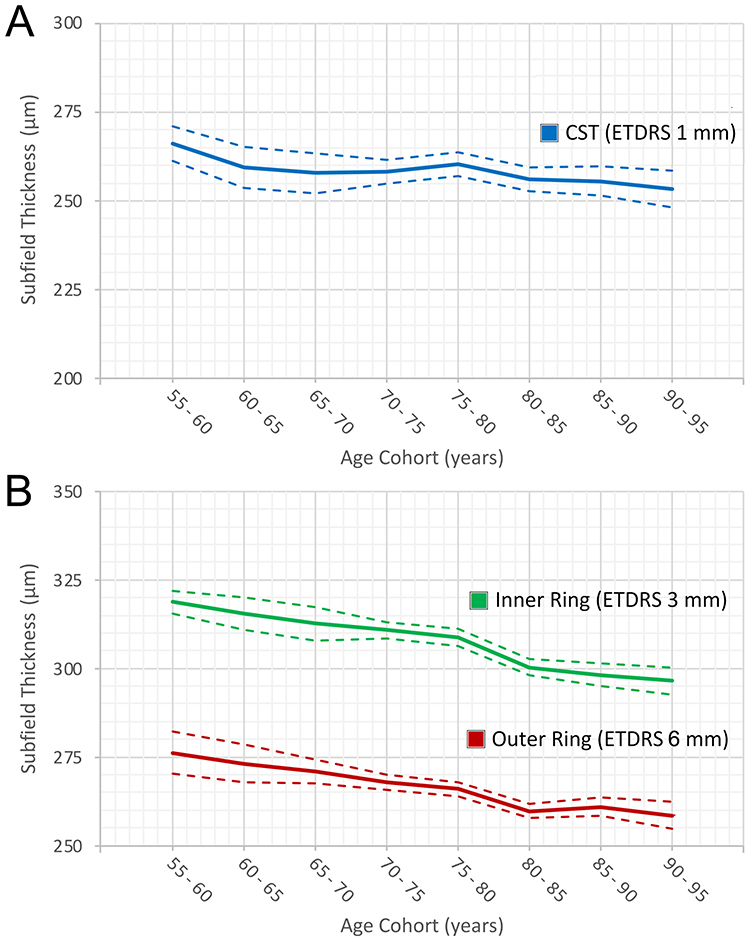 |
Figure 2 Age-related macular thickness by ETDRS grid region. (A) Central subfield thickness (CST; 1 mm ETDRS subfield) shows a modest decline across 5-year age cohorts (linear fit: y = −1.3 x + 264). (B) Inner (ETDRS 3-mm ring) and outer (ETDRS 6-mm ring) rings demonstrate steeper age-associated thinning, greater in the inner ring (y = −3.3 x + 323) than the outer ring (y = −2.6 x + 279). Dashed lines indicate the 95% confidence bands around the fitted regression lines. Abbreviations: ETDRS, Early Treatment Diabetic Retinopathy Study; CST, central subfield thickness. |
Development of GA
At last follow-up, 17 eyes from eight patients developed GA (8.5%) at a median age of
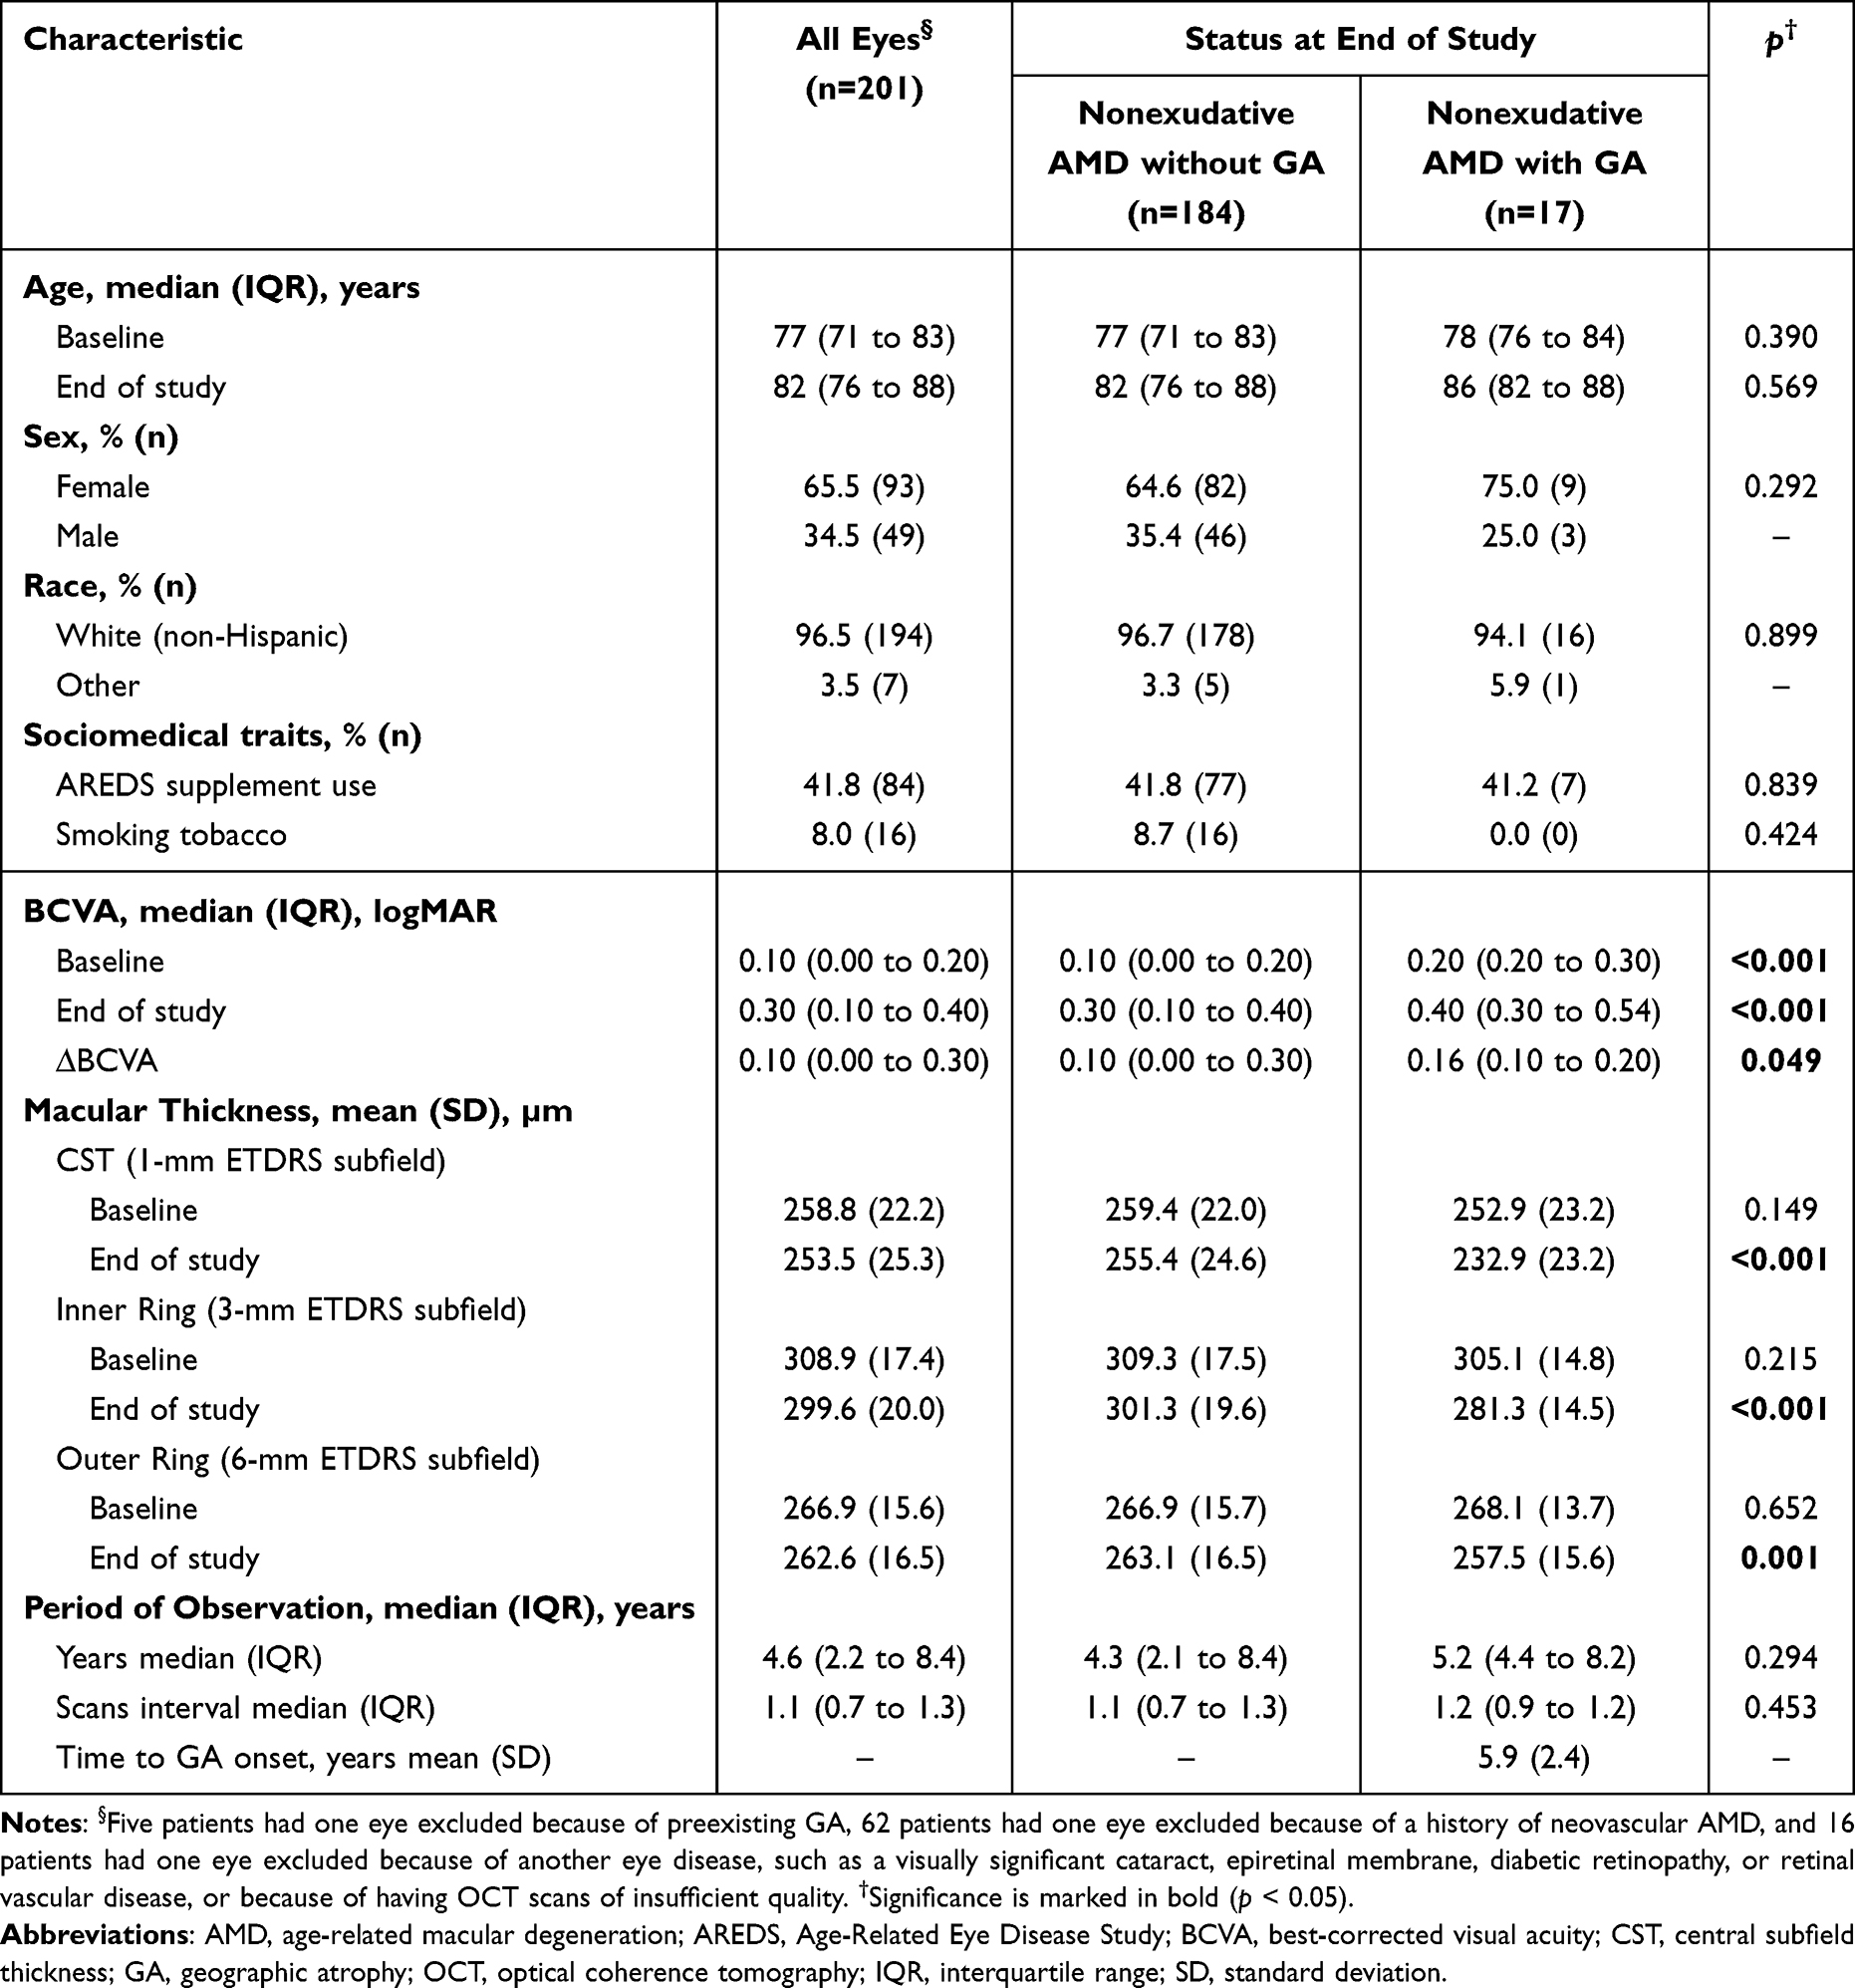 |
Table 1 Demographic and Clinical Characteristics of Study Eyes |
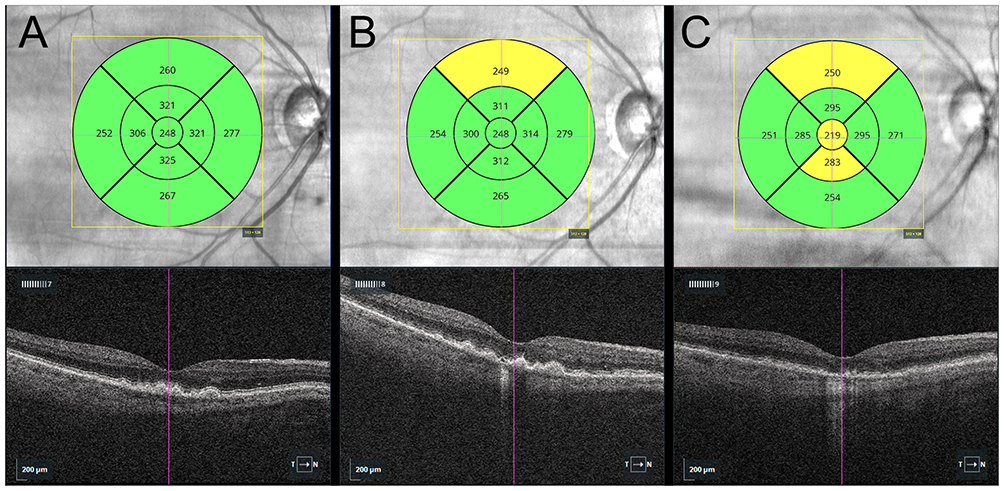 |
Figure 3 Longitudinal OCT of the right eye of a 75-year-old woman with intermediate AMD demonstrating progressive macular thinning over five years. Near-infrared reflectance (NIR) fundus image with ETDRS grid overlays display subfield thicknesses relative to an age- and sex-matched normative data (green = within 1 SD; yellow = 1–2 SDs; red = ≥ 2 SD). Corresponding B-scans are shown below each panel. (A) Baseline: no significant thinning is observed in any of the ETDRS subfields. (B) Year 3: borderline thinning is noted in the superior outer ETDRS subfield. (C) Year 5: resorption of drusen was associated with overlying cRORA (horizontal diameter 290 µm), illustrating incipient subfoveal GA. Scale bar 200 µm. Arrow indicates the direction of the scan from temporal to nasal (T→N). Abbreviations: OCT, optical coherence tomography; AMD, age-related macular degeneration; ETDRS, Early Treatment Diabetic Retinopathy Study; SD, standard deviation; cRORA: complete retinal pigment epithelium and outer retinal atrophy. |
Macular Change Analysis
Eyes that developed incipient GA demonstrated retinal thinning at a significantly faster rate compared with eyes with less advanced stages of nonexudative AMD (Figure 4). Measured as a percent change in retinal thickness, CST thinned at a rate of −1.59% ± 1.08% per year for eyes that developed GA, compared with −0.47% ± 1.65% per year for eyes that did not reach this stage (p = 0.007; (Table 2). Similarly, the inner ring (−1.48% ± 0.63% per year vs. −0.65% ± 0.99% per year, p < 0.001) and outer rings (−0.75% ± 0.37% per year vs. −0.30% ± 0.61% per year, p = 0.003) thinned faster in eyes that developed GA. When a single eye from each subject was selected at random, the rate of inner ring thinning remained statistically significant (−1.34% ± 0.58% per year vs. −0.69% ± 1.09% per year, p = 0.043).
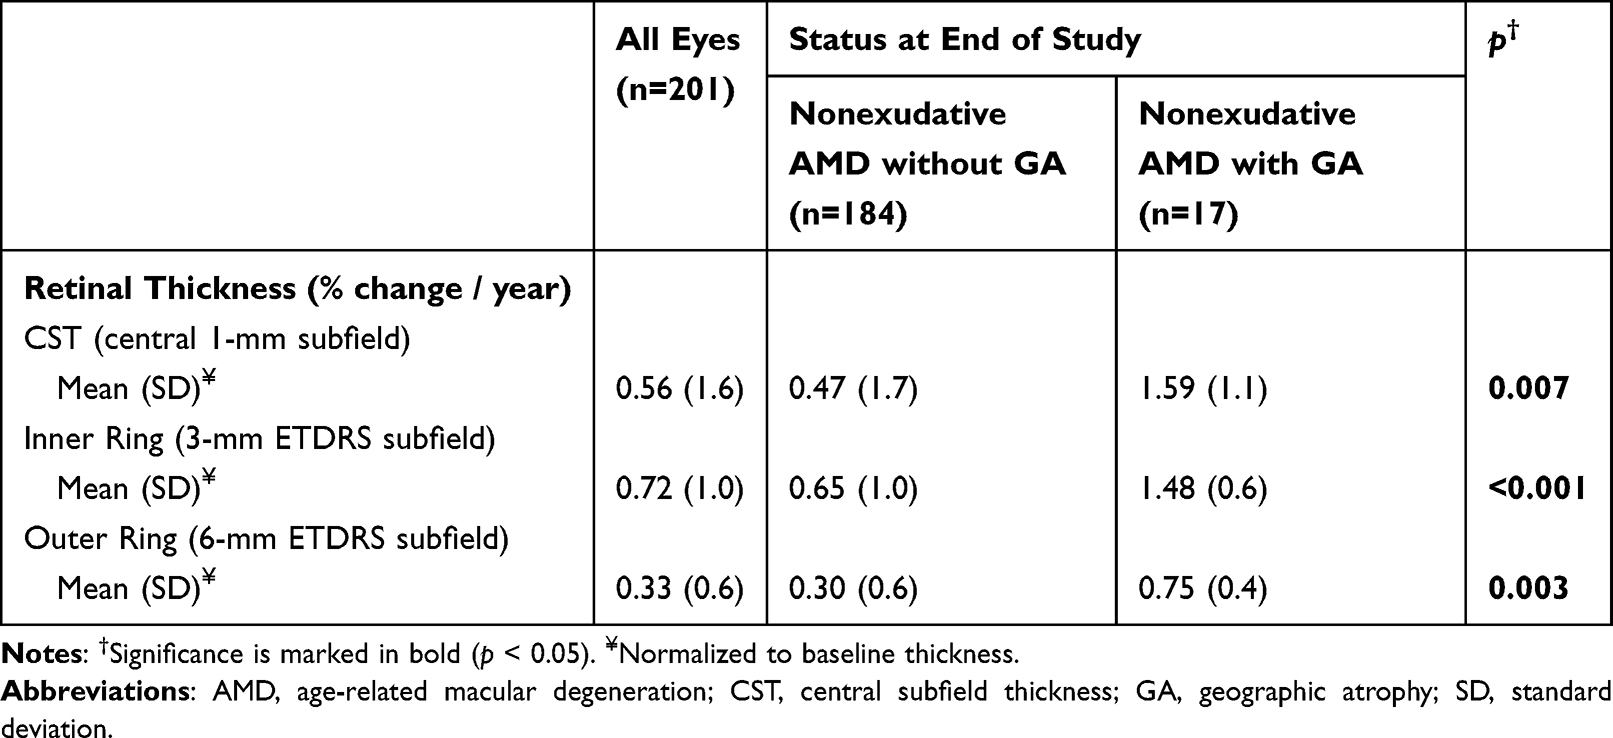 |
Table 2 Rate of Macular Thinning in Eyes by GA Status |
 |
Figure 4 Thinning of the ETDRS grid region on the macular OCT. Percentage change per year in retinal thickness analysis performed using the ETDRS grid centered on the fovea for eyes with non-exudative AMD without GA (solid bars) and advanced AMD with GA (hatched bars). Values are expressed as mean % / year (SD), normalized to the respective baseline macular OCT ETDRS grid region thickness. GA eyes show greater thinning across all regions, with the CST (blue) the most pronounced, followed by the inner (green) and outer (red) rings. Significance: ** = p < 0.01; *** = p < 0.001. Abbreviations: ETDRS, Early Treatment Diabetic Retinopathy Study; OCT, optical coherence tomography; AMD, age-related macular degeneration; GA, geographic atrophy; SD, standard deviation; CST, central subretinal thickness. |
Across all eyes, the rate of thinning was weakly correlated with age for the CST (r = −0.084, p = 0.022) and inner ring (r = −0.127, p < 0.001), but not for the outer ring (r = −0.017, p = 0.663). By contrast, BCVA did not correlate with the rate of macular thinning. After controlling for age, the rate of thinning showed a significant correlation with the risk of developing GA (CST: adjusted odds ratio [aOR], 1.11; 95% CI, 1.01–1.23, p = 0.035; inner ring: aOR, 1.23; 95% CI, 1.05–1.43, p = 0.008; outer ring: aOR, 1.47; 95% CI, 1.11–1.96, p = 0.007). Stepwise linear regression identified the rate of inner ring thinning as the factor most strongly associated with incipient GA, with a receiver operating characteristic curve (ROC) demonstrating a high predictive accuracy (area under the curve [AUC], 0.821; 95% CI, 0.746–0.896; p < 0.001).
Discussion
Our study establishes that the rate of macular thinning is associated with the development of incipient GA. Specifically, we quantify the rate of thinning and identify ETDRS inner ring thinning as the most significant predictor associated with the development of cRORA, a finding on OCT imaging that represents GA.10–12 Given the frequency with which spectral-domain OCT macular imaging is performed, not only by providers specializing in retina care but also in routine clinical practice, our approach, which relies on automated analysis of retinal thickness on ETDRS subfield maps, should be readily accessible and familiar to most clinicians. Increasing the awareness of the association between regional thinning rates, particularly in the ETDRS inner ring, should make it possible for clinicians to better identify eyes at higher risk of progression to GA. This discovery will not only foster closer monitoring of patients at an elevated risk of late-stage AMD, but it will provide an opportunity to implement nutritional supplements and healthy lifestyle behaviors proven to reduce the risk of advanced AMD.7–9
Similar to the findings in our study, the atrophy in more than one-third of eyes with incipient GA is foveal at presentation.20 Eyes that developed incipient GA lost more visual acuity, but this decline in vision did not correlate with the spatial location of the atrophy or its rate, likely because of the limited size of our sample. This lack of a functional endpoint, despite a well-known association between GA and central vision loss,1,2 is likely partly because selecting incident GA as our study outcome did not allow sufficient time for atrophy to impair central vision, as it takes an average of 2.5 years from the initial identification of GA for central vision to decline.6 Nonetheless, eyes that developed GA exhibited comparatively worse final BCVA, suggesting that factors beyond thinning alone may contribute to visual decline in this subgroup. We also lack other functional measures of visual function known to be affected by advanced AMD, such as contrast sensitivity or dark adaptation,21 and we did not include microperimetry data, which would have allowed measurement of the size and extent of any associated scotomas.22
Recently, the US Food and Drug Administration (FDA) approved two novel complement inhibitors capable of slowing the progression of GA secondary to AMD. However, the Phase 3 clinical trials underlying their approval failed to achieve endpoints related to preserving visual function, and identified an increase in the rate of neovascular AMD with complement treatment,23–25 a side effect replicated by real-world clinical studies.26 The FDA also recently cleared photobiomodulation (PBM) as a treatment for eyes with intermediate AMD or non-central GA,27 on the basis of sham-controlled, double-blinded studies of low-level light therapy.28,29 The development of these and other emerging treatments for nonexudative AMD increases the urgency of identifying biomarkers linked to the risk of the progression to advanced nonexudative AMD. Assessing the rate of retinal thinning might also be useful for patient selection for treatment given the risks and costs of currently available interventions.30
In clinical practice, the time required to obtain serial, high-quality OCT scans that allow for automated segmentation of individual retinal layers or to manual correct segmentation, is lacking. By contrast, the approach taken in our study considered the built-in total retinal ETDRS subfield thickness is not only readily available, but it is relatively easy to apply and is likely compatible with real-world clinical practice. Notably, the change of mean thickness assessed by using semiautomated segmentation of the ETDRS subfields on OCT imaging has been proposed as a potential endpoint for clinical trials aimed at slowing disease progression in GA31 and inherited retinal degenerations (IRD).32 Recent work has introduced metrics such as the Macular Tissue Integrity Index, which quantify residual retinal tissue and may provide a more functionally relevant assessment beyond conventional thickness measures.33 The pathophysiology of GA is not yet fully understood, and it is still not known if the primary site of disease lies at the level of the RPE, photoreceptors, Bruch’s membrane, or choriocapillaris, and whether this varies from patient to patient. A single clinical snapshot of retinal anatomy by OCT fails to account for time-varying thinning that may precede visible structural collapse of the outer retina. Identifying eyes with rapid macular thinning may aid forecasting of progression of incomplete RPE and outer retinal atrophy (iRORA) to cRORA.
In our study, retinal thickness was measured by using semiautomated segmentation of the ETDRS subfields on spectral-domain OCT images from the inner limiting membrane (ILM) to the RPE (inner boundary of the RPE band). We did not assess changes in Bruch’s membrane or the choriocapillaris, or quantify ellipsoid zone (EZ) disruption, which often precedes or accompanies outer retinal atrophy.17 We also did not assess the eyes in our study for other features that have been proposed to serve as biomarkers for late AMD, including drusen type, the height of drusenoid pigment epithelial detachments, the presence of intraretinal hyperreflective foci, and a thin double-layer sign.34,35 Notably, rapid macular thinning has been identified as an important, early sign of hydroxychloroquine-associated retinal toxicity. Melles et al showed that conventional signs of toxicity on spectral-domain OCT or the 10–2 visual field became apparent with as little as 20 to 30 µm of retinal thinning in the ETDRS inner ring.36 This suggests that this region may be more sensitive to identifying retinal degeneration because of anatomical or functional aspects. It is therefore critical for any eyes that show abnormally fast retinal thinning to be monitored for other causes of retina disease such as IRD,32 central serous retinopathy,37 myopic degeneration,38 and drug toxicities,36 all of which were excluded as causes for the patients in our study.
Traditional color photographs and fundus FAF images were not available for all of the eyes included in our study.39 In clinical research, GA is often delineated by centering an ETDRS grid on the foveola, using these modalities.31 However, compared to spectral-domain OCT imaging, these modalities are less commonly performed in a routine retina practice and are less sensitive for detecting macular neovascularization.16 They are also limited in their ability to delineate other structural details that develop in advance of GA such as photoreceptor degradation, RPE thinning, and choriocapillaris deterioration (ie., iRORA) prior to the development of GA.17,40 Importantly, signs of cRORA on spectral-domain OCT demonstrate near-perfect agreement with a first-order agreement coefficient of 0.99.41 In the future, the introduction of high-resolution, swept-source OCT is likely to increase iRORA detection.42,43 Recent studies have also highlighted the potential of OCT angiography as a tool for monitoring the risk of progression to late nonexudative AMD.40,44
Limitations
We acknowledge the limitations of this study, including its retrospective design and modest size of the sample drawn from a single academic retina center. The study population was also limited in its racial and ethnic diversity, which, although not unexpected for patients diagnosed with AMD,2 may nonetheless have the consequence that the results of our study may not be capable of being generalized to other populations. Our study was also underpowered to assess the impact of AREDS supplements, the smoking of tobacco, or other sociodemographic factors. Real-world clinical studies like ours also result in incomplete data collected at irregular intervals. Although all patients underwent clinical retinal examination and spectral-domain OCT imaging, uneven quality of imaging obtained in a clinical practice limited our ability to segment individual retinal layers. Using longer scanning protocols that incorporate signal averaging or enhanced depth protocols would have permitted quantitative assessment of individual retinal layers or choroidal thickness that may serve as important biomarkers.44,45 Finally, future OCT imaging software will likely integrate artificial intelligence-based decision-support tools that may aid recognizing features linked to GA progression.46
Conclusion
Our study reveals that monitoring the rate of macula thinning, particularly in the ETDRS inner ring on spectral-domain OCT imaging, may help identify eyes at greater risk of progression to incipient GA. Determining which patients are at a greater risk of progression to late-stage nonexudative AMD could aid in the selection of patients who have the most potential to benefit from emerging interventions, or the use of AREDS nutritional supplements known to slow disease progression. The recognition of the relationship between macular thinning and development of cRORA may also guide the selection of patients for inclusion in future clinical trials assessing new interventions designed to slow or prevent GA. Finally, because our study relies upon readily available clinical imaging tools familiar to most clinicians that provide care to patients with AMD, it can potentially be rapidly and widely adopted. This should allow patients with AMD to be referred to retina specialists before central visual function is compromised and when vision-sparing therapies are likely to be the most effective.
Abbreviations
AMD, age-related macular degeneration; AREDS, Age-Related Eye Diseases Study; AUC, area under the curve; CI, confidence interval; CST, central subfield thickness; CNV, choroidal neovascularization; EHR, electronic health record; ETDRS, Early Treatment Diabetic Retinopathy Study; EZ, ellipsoid zone; GA, geographic atrophy; ICD-10-CM, International Classification of Diseases, Tenth Revision, Clinical Modification; IQR, interquartile range; logMAR, logarithm of the minimum angle of resolution; OCT, optical coherence tomography; aOR, adjusted Odds Ratio; RPE, retinal pigment epithelium; SD, standard deviation; VA, visual acuity.
Ethics Statement
Human subjects were included in this study. The study was exempt from the Lahey Hospital Institutional Review Board review, and the requirement for informed consent was waived. The study adhered to the Declaration of Helsinki and is reported according to STROBE guidelines and, where applicable, the RECORD statement. No animal subjects were used in this study.
Ethical Approval
This case series was conducted in accordance with the Declaration of Helsinki. The collection and evaluation of all protected patient health information was performed in a HIPAA (Health Insurance Portability and Accountability Act)-compliant manner. This study was approved by the institutional review board of the Lahey Hospital & Medical Center (Burlington, Massachusetts, USA): Role of Frequency of Monitoring on the Successful Diagnosis of New Wet Age-related Macular Degeneration (2021-3094, 23 July 2021).
Acknowledgments
The authors thank Dr. Shiyoung Roh, Dr. Haohua Qian, Dr. Michael Cooper, Dr. Kathryn Moynihan Ramsey, as well as Carol Spencer, Lahey Hospital Librarian, for research support. The abstract of this paper was presented at the Association for Research in Vision and Ophthalmology (ARVO) Annual Meeting, Salt Lake City, UT, May 4, 2025, with interim findings. The poster’s abstract was published in Investigative Ophthalmology & Visual Science (ARVO Annual Meeting Abstract), June 2025;66(8):685, “Rapid Macular Thinning Is an Early Indicator of Geographical Atrophy.” https://iovs.arvojournals.org/article.aspx?articleid=2805324
Funding
F.C.: Supported by a grant from Office of Medical Education, Lahey Hospital & Medical Center, Beth Israel Lahey Health.
Disclosure
D.J.R. is a consultant for Regeneron Pharmaceuticals Inc and Beaver-Visitec International, Inc. The other author has no proprietary or commercial interest in any materials discussed in this article.
References
1. Rein DB, Wittenborn JS, Burke-Conte Z, et al. Prevalence of age-related macular degeneration in the US in 2019. JAMA Ophthalmol. 2022;140(12):1202–11. doi:10.1001/jamaophthalmol.2022.4401
2. Wong WL, Su X, Li X, et al. Global prevalence of age-related macular degeneration and disease burden projection for 2020 and 2040: a systematic review and meta-analysis. Lancet Glob Health. 2014;2(2):e106–e116. doi:10.1016/S2214-109X(13)70145-1
3. Flaxel CJ, Adelman RA, Bailey ST, et al. Age-related macular degeneration preferred practice pattern.®. Ophthalmology. 2020;127(1):P1–P65. doi:10.1016/j.ophtha.2019.09.024
4. Chew JK, Zhu M, Broadhead GK, Luo K, Hond T, Chang AA. Bilateral neovascular age-related macular degeneration: comparisons between first and second eyes. Ophthalmologica. 2017;238(1–2):23–30. doi:10.1159/000469652
5. Fasler K, Fu DJ, Moraes G, et al. Moorfields AMD database report 2: fellow eye involvement with neovascular age-related macular degeneration. Br J Ophthalmol. 2020;104(5):684–690. doi:10.1136/bjophthalmol-2019-314446
6. Regillo CD, Nijm LM, Shechtman DL, et al. Considerations for the identification and management of geographic atrophy: recommendations from an expert panel. Clin Ophthalmol. 2024;18:325–335. doi:10.2147/OPTH.S445755
7. Age-Related Eye Disease Study Research Group. A randomized, placebo-controlled, clinical trial of high-dose supplementation with vitamins C and E, beta carotene, and zinc for age-related macular degeneration and vision loss: AREDS report no. 8. Arch Ophthalmol. 2001;119(10):1417–1436. doi:10.1001/archopht.119.10.1417
8. Keenan TDL, Agrón E, Keane PA, et al. Oral antioxidant and lutein/zeaxanthin supplements slow geographic atrophy progression to the fovea in age-related macular degeneration. Ophthalmology. 2025;132(1):14–29. doi:10.1016/j.ophtha.2024.07.014
9. Seddon JM, De D, Rosner B. Quantifying effects of diet and lifestyle changes on progression to advanced age and related macular degeneration in high genetic risk individuals. Ophthalmology. 2025. doi:10.1016/j.ophtha.2025.09.030
10. Spaide RF, Jaffe GJ, Sarraf D, et al. Consensus nomenclature for reporting neovascular age-related macular degeneration data: consensus on neovascular age-related macular degeneration nomenclature study group. Ophthalmology. 2020;127(5):616–636. doi:10.1016/j.ophtha.2019.11.004
11. Savastano MC, Falsini B, Cozzupoli GM, et al. Retinal pigment epithelial and outer retinal atrophy in age-related macular degeneration: correlation with macular function. J Clin Med. 2020;9(9):2973. doi:10.3390/jcm9092973
12. Sadda SR, Guymer R, Holz FG, et al. Consensus definition for atrophy associated with age-related macular degeneration on OCT: classification of atrophy report 3. Ophthalmology. 2018;125(4):537–548. doi:10.1016/j.ophtha.2017.09.028
13. Von Elm E, Altman DG, Egger M, et al. The Strengthening the Reporting of Observational Studies in Epidemiology (STROBE) statement: guidelines for reporting observational studies. Lancet. 2007;370(9596):1453–1457. doi:10.1016/S0140-6736(07)61602-X
14. Ferris FL, Wilkinson CP, Bird A, et al. Clinical classification of age-related macular degeneration. Ophthalmology. 2013;120(4):844–851. doi:10.1016/j.ophtha.2012.10.036
15. Robbins CC, Anjum S, Alwreikat AM, et al. An initiative to improve follow-up of patients with glaucoma. Ophthalmol Sci. 2021;1(4):100059. doi:10.1016/j.xops.2021.100059
16. Invernizzi A, Parrulli S, Monteduro D, et al. Outer retinal layer thickening predicts the onset of exudative neovascular age-related macular degeneration. Am J Ophthalmol. 2021;231:19–27. doi:10.1016/j.ajo.2021.05.015
17. Guymer RH, Rosenfeld PJ, Curcio CA, et al. Incomplete retinal pigment epithelial and outer retinal atrophy in age-related macular degeneration: classification of atrophy meeting report 4. Ophthalmology. 2020;127(3):394–409. doi:10.1016/j.ophtha.2019.09.035
18. Chauhan BC, Vianna JR, Sharpe GP, et al. Differential effects of aging in the macular retinal layers, neuroretinal rim, and peripapillary retinal nerve fiber layer. Ophthalmology. 2020;127(2):177–185. doi:10.1016/j.ophtha.2019.09.013
19. Liew SH, Gilbert CE, Spector TD, Marshall J, Hammond J. The role of heredity in determining central retinal thickness. Br J Ophthalmol. 2007;91(9):1143–1147. doi:10.1136/bjo.2007.114215
20. Colijn JM, Liefers B, Joachim N, et al. Enlargement of geographic atrophy from first diagnosis to end of life. JAMA Ophthalmol. 2021;139(7):743–750. doi:10.1001/jamaophthalmol.2021.1407
21. Verghese AP, Lasalle CC, Ramsey DJ. Dark adaptometry kinetics differentiates age-related macular degeneration from central serous chorioretinopathy. Ophthalmol Sci. 2025;5(6):100835. doi:10.1016/j.xops.2025.100835
22. Meleth AD, Mettu P, Agrón E, et al. Changes in retinal sensitivity in geographic atrophy progression as measured by microperimetry. Invest Ophthalmol Vis Sci. 2011;52(2):1119–1126. doi:10.1167/iovs.10-6075
23. Khanani AM, Patel SS, Staurenghi G, et al. Efficacy and safety of avacincaptad pegol in patients with geographic atrophy (GATHER2): 12-month results from a randomised, double-masked, phase 3 trial. Lancet. 2023;402(10411):1449–1458. doi:10.1016/S0140-6736(23)01583-0
24. Patel SS, Lally DR, Hsu J, et al. Correction: avacincaptad pegol for geographic atrophy secondary to age-related macular degeneration: 18-month findings from the GATHER1 trial. Eye. 2023;37(17):3705. doi:10.1038/s41433-023-02548-2
25. Wykoff CC, Holz FG, Chiang A, et al. Pegcetacoplan treatment for geographic atrophy in age-related macular degeneration over 36 months: data from OAKS, DERBY and GALE. Am J Ophthalmol. 2025;276:350–364. doi:10.1016/j.ajo.2025.04.016
26. Rush RB, Klein W, Reinauer RM. Real-world outcomes with complement inhibitorsfor geographic atrophy: a comparative study of pegacetacoplan versus avacincaptad pegol. Clin Ophthalmol. 2025;19:1167–1174. doi:10.2147/OPTH.S518398
27. Boyer D, Hu A, Warrow D, et al. LIGHTSITE III: 13-month efficacy and safety evaluation of multiwavelength photobiomodulation in nonexudative (dry) age-related macular degeneration using the lumithera valeda light delivery system. Retina. 2024;44(3):487–497. doi:10.1097/IAE.0000000000003980
28. Markowitz SN, Devenyi RG, Munk MR, et al. A double-masked, randomized, sham-controlled, single-center study with photobiomodulation for the treatment of dry age-related macular degeneration. Retina. 2020;40(8):1471–1482. doi:10.1097/IAE.0000000000002632
29. U.S. Food & Drug Administration. Valeda Light Delivery System Class II Approval. Available from: https://www.accessdata.fda.gov/cdrh_docs/reviews/DEN230083.pdf.
30. Patel NA, Al-Khersan H, Yannuzzi NA, Lin J, Smiddy WE. A cost-effectiveness analysis of pegcetacoplan for the treatment of geographic atrophy. Ophthalmol Retina. 2024;8(1):25–31. doi:10.1016/j.oret.2023.08.003
31. Romano F, Cozzi M, Monteduro D, et al. Natural course and classification of extensive macular atrophy with pseudodrusen-like appearance. Retina. 2023;43(3):402–411. doi:10.1097/IAE.0000000000003683
32. Strauss RW, Lang L, Ho A, et al. The progression of Stargardt disease as determined by spectral-domain optical coherence tomography over a 24-month period (ProgStar Report No. 18). Ophthalmic Res. 2024;67(1):435–447. doi:10.1159/000540028
33. Erb BM, Botros E, Saunders TF, et al. Investigating macular tissue integrity index as a novel biomarker in geographic atrophy. Ophthalmol Sci. 2025;5(6):100871. doi:10.1016/j.xops.2025.100871
34. Manafi N, Mahmoudi A, Emamverdi M, et al. Topographic analysis of local OCT biomarkers which predict progression to atrophy in age-related macular degeneration. Graefes Arch Clin Exp Ophthalmol. 2024;262(7):2083–2091. doi:10.1007/s00417-024-06389-x
35. Hollaus M, Iby J, Brugger J, et al. Influence of drusenoid pigment epithelial detachments on the progression of age-related macular degeneration and visual acuity. Can J Ophthalmol. 2024;59(6):417–423. doi:10.1016/j.jcjo.2023.12.007
36. Melles RB, Marmor MF. Rapid macular thinning is an early indicator of hydroxychloroquine retinal toxicity. Ophthalmology. 2022;129(9):1004–1013. doi:10.1016/j.ophtha.2022.05.002
37. Ghezzo B, Ghilardi A, Marena MC, et al. Postreceptor neural loss in patients with chronic central serous chorioretinopathy. Am J Ophthalmol. 2025;277:26–32. doi:10.1016/j.ajo.2025.04.040
38. Jonas JB, Jonas RA, Panda-Jonas S. Clinical and histological aspects of the anatomy of myopia, myopic macular degeneration and myopia-associated optic neuropathy. Prog Retin Eye Res. 2025;109:101402. doi:10.1016/j.preteyeres.2025.101402
39. Dmalpally A, Danis R, Agron E, et al. Evaluation of geographic atrophy from color photographs and fundus autofluorescence images: age-related eye disease study 2 report number 11. Ophthalmology. 2016;123(11):2401–2407. doi:10.1016/j.ophtha.2016.06.025
40. Vallino V, Berni A, Coletto A, et al. Structural OCT and OCT angiography biomarkers associated with the development and progression of geographic atrophy in AMD. Graefes Arch Clin Exp Ophthalmol. 2024;262(11):3421–3436. doi:10.1007/s00417-024-06497-8
41. Carvajal N, Yang D, Nava K, et al. Intergrader agreement in grading optical coherence tomography morphologic features in eyes with intermediate nonexudative age-related macular degeneration. Transl Vis Sci Technol. 2024;13(8):3. doi:10.1167/tvst.13.8.3
42. Mahmoudi A, Corradetti G, Emamverdi M, et al. Atrophic lesions associated with age-related macular degeneration: high-resolution versus standard OCT. Ophthalmol Retina. 2024;8(4):367–375. doi:10.1016/j.oret.2023.10.011
43. Heckenlaible NJ, Toomey CB, Handa JT. OCT changes observed during the progression of early age-related macular degeneration. Ophthalmol Sci. 2025;5(1):100615. doi:10.1016/j.xops.2024.100615
44. Romano F, Ding X, Yuan M, et al. Progressive choriocapillaris changes on optical coherence tomography angiography correlate with stage progression in AMD. Invest Ophthalmol Vis Sci. 2024;65(8):21. doi:10.1167/iovs.65.8.21
45. Bennett C, Romano F, Vingopoulos F, et al. Associations between contrast sensitivity, optical coherence tomography features and progression from intermediate to late age-related macular degeneration. Am J Ophthalmol. 2025;271:175–187. doi:10.1016/j.ajo.2024.11.006
46. Vogl WD, Riedl S, Mai J, et al. Predicting topographic disease progression and treatment response of pegcetacoplan in geographic atrophy quantified by deep learning. Ophthalmol Retina. 2023;7(1):4–13. doi:10.1016/j.oret.2022.08.003
 © 2026 The Author(s). This work is published and licensed by Dove Medical Press Limited. The
full terms of this license are available at https://www.dovepress.com/terms
and incorporate the Creative Commons Attribution
- Non Commercial (unported, 4.0) License.
By accessing the work you hereby accept the Terms. Non-commercial uses of the work are permitted
without any further permission from Dove Medical Press Limited, provided the work is properly
attributed. For permission for commercial use of this work, please see paragraphs 4.2 and 5 of our Terms.
© 2026 The Author(s). This work is published and licensed by Dove Medical Press Limited. The
full terms of this license are available at https://www.dovepress.com/terms
and incorporate the Creative Commons Attribution
- Non Commercial (unported, 4.0) License.
By accessing the work you hereby accept the Terms. Non-commercial uses of the work are permitted
without any further permission from Dove Medical Press Limited, provided the work is properly
attributed. For permission for commercial use of this work, please see paragraphs 4.2 and 5 of our Terms.
Recommended articles
Predicting the Progression of Very Early Systemic Sclerosis: Current Insights
Bellocchi C, Chung A, Volkmann ER
Open Access Rheumatology: Research and Reviews 2022, 14:171-186
Published Date: 15 September 2022
Characterizing Patient Perceptions of Living with Geographic Atrophy: The Global Geographic Atrophy Insights Survey
Bakri SJ, Brinkmann CK, Mulvey A, Steinberg K, Katz R, Vatsyayan P, Sarda SP, Holekamp NM
Clinical Ophthalmology 2024, 18:3725-3737
Published Date: 13 December 2024
Analysis of OCT-Based Biomarkers and Recurrence in Eyes with Diabetic Macular Edema Following Anti-VEGF Therapy
Zhu T, Wang Y, Hua Y, Zha X, Xu T
International Journal of General Medicine 2025, 18:6941-6948
Published Date: 13 November 2025