Back to Journals » International Journal of Nanomedicine » Volume 17
Rapid Fluorescence Sensor Guided Detection of Urinary Tract Bacterial Infections
Authors Zhang L, Wang B, Yin G, Wang J, He M, Yang Y, Wang T, Tang T ![]() , Yu XA
, Yu XA ![]() , Tian J
, Tian J
Received 6 June 2022
Accepted for publication 21 August 2022
Published 26 August 2022 Volume 2022:17 Pages 3723—3733
DOI https://doi.org/10.2147/IJN.S377575
Checked for plagiarism Yes
Review by Single anonymous peer review
Peer reviewer comments 4
Editor who approved publication: Professor Farooq A. Shiekh
Lei Zhang,1,* Bing Wang,2,* Guo Yin,2 Jue Wang,2 Ming He,3 Yuqi Yang,4 Tiejie Wang,2 Ting Tang,3 Xie-An Yu,2 Jiangwei Tian1
1State Key Laboratory of Natural Medicines, Jiangsu Key Laboratory of TCM Evaluation and Translational Research, School of Traditional Chinese Pharmacy, China Pharmaceutical University, Nanjing, Jiangsu Province, 211198, People’s Republic of China; 2NMPA Key Laboratory for Bioequivalence Research of Generic Drug Evaluation, Shenzhen Institute for Drug Control, Shenzhen, Guangdong Province, 518057, People’s Republic of China; 3Dermatology Department, The First Affiliated Hospital of Guizhou University of Traditional Chinese Medicine, Guiyang, Guizhou Province, 550002, People’s Republic of China; 4School of Basic Medicine, Guizhou University of Traditional Chinese Medicine, Guiyang, Guizhou Province, 550002, People’s Republic of China
*These authors contributed equally to this work
Correspondence: Xie-An Yu; Jiangwei Tian, Email [email protected]; [email protected]
Introduction: Urinary tract infections (UTI) are one of the most serious human bacterial infections affecting millions of people every year. Therefore, simple and reliable identification of the urinary tract pathogenic bacteria within a few minutes would be of great significance for diagnosis and treatment of clinical patients with UTIs. In this study, the fluorescence sensor was reported to guide the detection of urinary tract bacterial infections rapidly.
Methods: The Ami-AuNPs-DNAs sensor was fabricated by the amino-modified Au nanoparticles (Ami-AuNPs) and six DNAs signal molecules, which bound to the urinary tract pathogenic bacteria and generated corresponding response signals. Further, based on the collected response signals, identification was performed by principal component analysis (PCA) and linear discriminant analysis (LDA). The Ami-AuNPs and Ami-AuNPs-DNAs were characterized by transmission electron microscopy, UV−vis absorption spectrum, Fourier transform infrared spectrum, dynamic light scattering and zeta potentials. Thereafter, the Ami-AuNPs-DNAs sensor was used to discriminate and identify five kinds of urinary tract pathogenic bacteria. Moreover, the quantitative analysis performance towards individual bacteria at different concentrations were also evaluated.
Results: The Ami-AuNPs-DNAs sensor were synthesized successfully in terms of spherical, well-dispersed and uniform in size, which could well discriminate five main urinary tract pathogenic bacteria with unique fingerprint-like patterns and was sufficiently sensitive to determine individual bacteria with a detection limit to 1× 10⁷ cfu/mL. Furthermore, the sensor had also been successfully applied to identify bacteria in urine samples collected from clinical UTIs.
Conclusion: The developed fluorescence sensor could be applied to rapid and accurate discrimination of urinary tract pathogenic bacteria and holds great promise for the diagnosis of the disease caused by bacterial infection.
Keywords: fluorescence sensor, rapid and accurate identification, point-of-care testing, bacterial infection, urinary tract infections
Introduction
Urinary tract infections (UTIs) are one of the prevalent common human bacterial infections especially in females where more than 50% of women would experience UTIs at least once in their lifetime,1–4 resulting in a serious health concern worldwide and a huge financial burden for healthcare systems.5,6 According to the results of the China Bacterial drug resistance monitoring network (CHINET), 62374 strains of isolated bacteria in urinary tract specimens mainly included Escherichia coli, Enterococcus faecium, Klebsiella pneumoniae, Enterococcus faecalis, Pseudomonas aeruginosa and so on.7–10 Clinically, most UTIs are initiated by urinary tract pathogenic bacteria that pass through the urinary meatus into the urinary tract and ascend into the bladder cavity subsequently.11–14 Once reaching the bladder, the bacteria replicate quickly in the urine and infect the bladder in large numbers.15,16 It was called cystitis when the infection was confined to the bladder while it was called pyelonephritis when the infection spread to the kidney.17–19 The bacteria would spread from the kidney into the bloodstream if treated inappropriately, which could lead to sepsis if accompanied by systemic inflammation.20,21 Consequently, it is of great significance to develop rapid, simple and accurate methods to identify different urinary tract pathogenic bacteria for the accurate diagnosis and treatment of UTIs.
Preliminary diagnosis of UTIs was based on clinical symptoms which commonly include dysuria, urinary frequency and urgency.22,23 Urine dipsticks were employed to test nitrite and leucocyte esterase, indicating bacterial urine and pyuria, respectively.24,25 However, urine dipsticks may take false-negative results in the presence of non-nitrite-producing pathogens such as Enterococcus.26 The acknowledged gold standard for diagnosis of bacterial UTI was in vitro urine culture.27,28 Unfortunately, it usually takes 18–48 hours to produce results.29,30 As a result of this delay, patients are susceptible to undertreatment or overtreatment, which may lead to sepsis without treatment timely or may develop antibiotic resistance with unnecessary treatment.31,32 Molecular and proteomic technologies including mass spectrometry, fluorescence in situ hybridization (FISH) and polymerase chain reaction (PCR) have improved detection efficiency and clinical outcome over existing urine culture methods.33–38 Nevertheless, these technologies require complex sample pretreatment to separate bacteria from urine before analysis, delaying bacterial identification at least 12 hours, which hinder the implementation of point-of-care rapid bacterial infection testing.39,40 As a consequence, in the consideration of simple preparation, low cost, rapid and accurate detection and high specificity, it was still a strong need to develop a novel method for bacteria identification in urine samples from patients with UTIs.
Fluorescence sensor, featured with fast response, high sensitivity, good selectivity and information-rich output, has been widely used to detect various biological samples such as proteins,41–43 bacteria44–46 and cells.47–49 It was worth noting that the fluorescence sensor as a promising tool for identifying pathogens has been developed for pathogens identification widely owing to its rich advantages, such as fast response, superior sensitivity, simplicity, and so on.50–52 More importantly, fluorescence sensor was good at distinguishing subtle changes in complex mixtures, not only identifying single substances, but also adapting to distinguish complex biological samples including blood and urine.53–56 As we all know, Au nanoparticles (AuNPs) had eminent advantages such as unique optical and electronic properties, high surface area/volume ratio and excellent stability and biocompatibility, which made it become one of the most commonly used carriers in fluorescence sensor.57–59 At the same time, DNA was an eximious choice for signal molecules because it had eminent stability and could be prepared and modified easily.60–62 Consequently, AuNPs and DNAs were selected as the carriers and signal molecules to construct fluorescence sensor.
Herein, a fluorescence sensor was successfully developed based on the Amino-modified Au nanoparticles (Ami-AuNPs) and different length of DNAs labelled with multiwavelength fluorophore, which could be used to rapidly and accurately identify the urinary tract pathogenic bacteria during the UTIs. As was illustrated in Scheme 1, Ami-AuNPs with positive charge and different lengths of DNAs labelled with six fluorophores with negative charge combined with each other via noncovalent conjugations such as electrostatic and π–π stacking. The six DNA signal molecules were AAAAA-VIC (5A-VIC), AAAAAAAAAA-Carboxytetramethylrhodamine (10A-TAMRA), AAAAAAAAAAAAAAAAAAAA-Texas Red (20A-Texas Red), AAAAAAAAAAAAAAAAAAAAAAAAAAAAAA-Cyanine5 (30A-Cy5), AAAAAAAAAAAAAAAAAAAAAAAAAAAAAAAAAAAAAAAA-Cyanine5.5 (40A-Cy5.5), AAAAAAAAAAAAAAAAAAAAAAAAAAAAAAAAAAAAAAAAAAAAAAAAAA-Cyanine7 (50A-Cy7), respectively, which could generate reproducible fluorescent responses with well-separated excitation and emission spectra. In addition, with an increasing number of DNA base, the binding capacity to Ami-AuNPs was also improved, providing the information-rich output signals. The fluorophore-labeled DNAs were adsorbed on the surface of Ami-AuNPs through electrostatic interaction, forming an Ami-AuNPs-DNAs fluorescence sensor and leading to the quenching state due to the excellent fluorescence quenching ability of Ami-AuNPs. The binding balance between Ami-AuNPs and DNAs would be broken due to the rapid competitive noncovalent combination or displacement in the presence of urinary tract pathogenic bacteria with negative charges, leading to the different degrees and types of recovery of fluorescence signals and generating corresponding unique fluorescent response patterns. Subsequently, the specific fluorescence intensity of six DNAs signal molecules was quantitatively analyzed via principal component analysis (PCA) and linear discriminant analysis (LDA). Consequently, five distinct clusters arising from urinary tract pathogenic bacteria was revealed according to the different charges of bacteria. Interestingly, the fabricated sensor was sufficiently sensitive to determine individual bacteria with a detection limit to 1×10⁷ cfu/mL. Furthermore, the sensor had also been successfully achieved to classify bacteria isolated from urine samples of clinical UTIs, which would expand bright perspectives of transformation and application in point-of-care rapid bacterial infection testing. Significantly, the constructed fluorescence sensor could effectively increase its sensitivity and accuracy for urinary tract pathogenic bacteria detection, which offered a promising strategy for rapid identification the bacteria during the UTIs in clinic.
 |
Scheme 1 Schematic illustration of (A) the construction of the Ami-AuNPs-DNAs sensor (B) the application of the Ami-AuNPs-DNAs sensor in identifying the urinary tract pathogenic bacteria. |
Materials and Methods
Synthesis of the Ami-AuNPs-DNAs Sensor
Ami-AuNPs were constructed according to our previous work.63 Briefly, 330 μL of 1% gold acid chloride trihydrate (HAuCl4·3H2O) was diluted to 6 mL and 6 mg thiol polyethyleneglycol amine (NH2-PEG-SH, Mw = 2000) was dissolved in 600 μL ultraportable water to form a mixture. Then, the mixture was stirred on a magnetic stirrer for 20 min at room temperature without light. At the same time, 1 mM sodium borohydride (NaBH4) was prepared. Following, 15 μL NaBH4 solution was added into the mixture quickly and then the mixed solution was stirred for additional 30 min vigorously. Finally, Ami-AuNPs were obtained by filtration with a 0.45 μm cellulose ester membrane. The Ami-AuNPs and six fluorophore-labelled DNAs were mixed adequately to construct the Ami-AuNPs-DNAs sensor.
The Fluorescence Examination of Six DNAs Signal Molecules by Ami-AuNPs
The fluorescence titration experiment was employed to analyze the optimal binding ratio of Ami-AuNPs and DNAs. The fluorescence intensity of 5A-VIC, 10A-TAMRA, 20A-Texas Red, 30A-Cy5, 40A-Cy5.5 and 50A-Cy7 after the adding of a series of concentrations of Ami-AuNPs were recorded at the optimal excitation/emission wavelengths, respectively. Subsequently, nonlinear least-squares curve fitting analysis was carried out to calculate the binding constant (Ka) between Ami-AuNPs and each DNA. The Ka was calculated according to Stern-Volmer equation
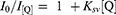
I0 and I[Q] represented the fluorescence intensity of the system with and without Ami-AuNPs respectively, Ksv is the binding constant between Ami-AuNPs and each DNA and [Q] is the concentration of Ami-AuNPs.
The Bacterial Cultivation
Escherichia coli, Klebsiella pneumoniae and Pseudomonas aeruginosa were cultured in LB (10.0 g tryptone, 5.0 g yeast extract and 10.0 g NaCl per liter H2O, pH 7.0±0.1) overnight at 37°C. Enterococcus faecium and Enterococcus faecalis were cultured in Enterococcus Broth (17.0 g tryptone, 3.0 g beef extract, 5.0 g yeast extract, 10.0 g dehydrated ox bile, 5.0 g sodium chloride, 1.0 g sodium citrate, 1.0 g esculin, 0.5 g ferric ammonium citrate, 0.25 g sodium azide per liter H2O, pH 7.0±0.2) overnight at 37°C. The bacterial cells were collected by centrifugation (4000 rpm for 10 min) and resuspended in phosphate buffer saline buffer solution (10 mM, pH 7.4). This washing process was repeated for three times to ensure that metabolism products on the surface were washed away. Finally, the bacterial cells were diluted to an absorbance of 0.1 at 600 nm for use in subsequent experiments.
The Collection of Clinical Urinary Tract Pathogenic Bacteria
Five kinds of clinical urinary tract pathogenic bacteria were isolated and identified from two hundreds of urinary biological samples submitted by inpatients in the First Affiliated Hospital of Guizhou University of Traditional Chinese Medicine. All procedures were approved by the medical ethics committee of the First Affiliated Hospital of Guizhou University of Traditional Chinese Medicine (No. K2022-006) and followed the tenets of the Declaration of Helsinki. We confirm that all patients who have provided urine samples have signed the written informed consent.
Bacterial Identification Based on Fluorescence Sensor
Generally, 190 μL of the Ami-AuNPs-DNAs complex solutions were loaded into a well on a 96-well plate. Subsequently, 10 μL of different bacterial solutions were added. Then the fluorescence intensity at the peak was recorded on a Varioskan Flash with the optimal excitation/emission wavelengths. All measurements were repeated to generate six replicates for each analyte, so that 6 channels × 5 bacteria × 6 replicates data matrix could be generated. Finally, the obtained data were processed using PCA and LDA with SIMCAP and SPSS software to receive bacteria identification results.
Statistical Analysis
All measurements were repeated at least six times. GraphPad Prism and Origin software were used for statistical analysis. SPSS and SIMCAP software were used to carry out the PCA and LDA.
Results and Discussion
Characterization of Ami-AuNPs and Ami-AuNPs-DNAs Sensor
The Ami-AuNPs were successfully synthesized by reducing HAuCl4·3H2O with NaBH4.63,64 The TEM images (Figure 1A and B) showed that AuNPs were spherical, well-dispersed and uniform, while the Ami-AuNPs were also spherical and distributed evenly, indicating that AuNPs and Ami-AuNPs were synthesized successfully. The UV−vis absorption spectrum displayed that the absorption peaks of AuNPs and Ami-AuNPs were at 518 and 530 nm (Figure 1C). Comparing to the maximum absorption peaks of AuNPs, the Ami-AuNPs had a red shift due to the modification of NH2-PEG-SH, which further verified the successful preparation of Ami-AuNPs. Subsequently, the Fourier transform infrared (FTIR) spectrum (Figure 1D) illustrated that the characteristic signals of NH2-PEG-SH appeared in the Ami-AuNPs, including νC-H stretching vibrations at 2875 cm−1 and νC-O stretching vibrations at 1107 cm−1 of PEG, which proved the successful synthesis of Ami-AuNPs. Meanwhile, the average hydrodynamic diameters measured by dynamic light scattering (DLS) of Ami-AuNPs and Ami-AuNPs-DNAs were about 46.81 nm (Figure S1) and 66.18 nm (Figure S2), indirectly demonstrating DNAs binding on the surface of Ami-AuNPs. In addition, the zeta potentials of the AuNPs, Ami-AuNPs and the Ami-AuNPs-DNAs were −34.02 mV (Figure S3), 20.11 mV (Figure S4) and −10.02 mV (Figure S5), respectively, revealing the feasibility of DNAs binding to the Ami-AuNPs through electrostatic interaction. In order to evaluate the stability of fluorescence sensor, the average hydrodynamic diameters and zeta potentials of Ami-AuNPs and Ami-AuNPs-DNAs were also measured during 7 days, implying high stability of Ami-AuNPs (Figures S6 and S7) and Ami-AuNPs-DNAs sensor (Figures S8 and S9). Taken together, the above results demonstrated the successful construction of Ami-AuNPs and Ami-AuNPs-DNAs sensor from various perspectives.
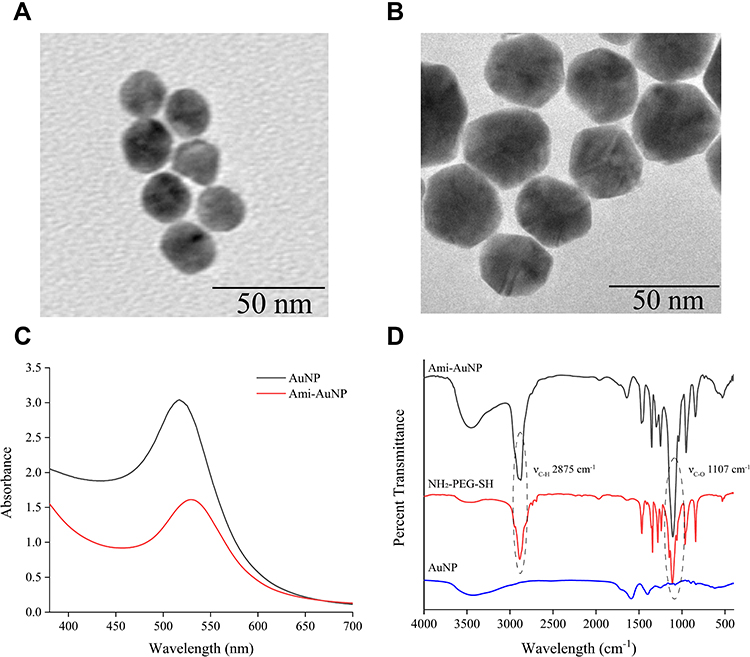 |
Figure 1 TEM image of (A) AuNPs and (B) Ami-AuNPs. (C) UV−vis absorption spectrum of AuNPs and Ami-AuNPs. (D) FTIR spectrum of AuNPs, NH2-PEG-SH and Ami-AuNPs. |
The Fluorescence Examination of Six DNAs Signal Molecules by Ami-AuNPs
Fluorescence spectrum of DNAs manifested that the optimal excitation/emission wavelengths of 5A-VIC, 10A-TAMRA, 20A-Texas Red, 30A-Cy5, 40A-Cy5.5 and 50A-Cy7 were 526/546, 562/582, 595/615, 644/664, 686/710 and 750/768 nm respectively, providing an independent fluorescent response for every signal channel without mutual interference (Figure 2A). The fluorescence titration experiment was employed to analyze the binding ratio of Ami-AuNPs and DNAs. Obviously, with an increasing volume of Ami-AuNPs, the fluorescence intensity of DNAs was gradually decreased and eventually tended to be stable (Figure 2B). Subsequently, fluorescence lifetime was measured to explore the fluorescence quenching mechanism between Ami-AuNPs and DNAs. As shown in Figure S10, the lifetime of the DNAs decreased from 4.16 ns to 2.87 ns after interacting with Ami-AuNPs, indicating that the quenching mechanism of the DNAs and Ami-AuNPs was dynamic quenching. The nonlinear least square fitting curve was carried out to calculate the binding constant (Ka) between Ami-AuNPs and each DNA. Owing to the increasing number of the DNA bases, the affinity varied significantly with the order of 50A-Cy7 > 40A-Cy5.5 > 30A-Cy5 > 20A- Texas Red > 10A-TAMRA > 5A-VIC (Figure 2C), suggesting that the unique fluorescence signals pattern could be generated attributed to the selective binding between the Ami-AuNPs-DNAs sensor and target analytes. The specific binding constants and fitting correlation coefficients were shown in Figure 2D. What’s more, the fluorescence titration experiment exhibited that the fluorescence quenching was saturated when the volume of Ami-AuNPs reached to 150 μL. To eliminate interactions between Ami-AuNPs and different DNA signaling molecules, 150 μL Ami-AuNPs were selected as the inflection point observed in the fitting curve.
 |
Figure 2 (A) Excitation and emission wavelengths of six DNAs. The black, red, blue, green, purple and yellow lines represent the fluorescence spectrum of 5A-VIC, 10A-TAMRA, 20A-Texas Red, 30A-Cy5, 40A-Cy5.5 and 50A-Cy7, respectively. The dotted line represents the excitation spectrum and the solid line represents the emission spectrum. (B) Fluorescence titration of 5A-VIC, 10A-TAMRA, 20A-Texas Red, 30A-Cy5, 40A-Cy5.5 and 50A-Cy7 by Ami-AuNPs. (C) The affinity order of six DNAs. It is 5A-VIC, 10A-TAMRA, 20A-Texas Red, 30A-Cy5, 40A-Cy5.5 and 50A-Cy7 from the top to down. (D) The specific binding constants and fitting correlation coefficients of six DNAs. |
The Bacterial Detection and Discrimination via Fluorescence Sensor
The zeta potentials of the five kinds of bacteria were detected, corresponding to their different charge properties (Table S1). Consequently, the change of the charge on the bacteria surface resulted in the variation of their affinities to the Ami-AuNPs-DNAs sensor, thus making it feasible for the discrimination and identification of these bacteria. Since Ami-AuNPs-DNAs sensor bonded diversely with different kinds of bacteria, we further explored the fluorescent response pattern of Ami-AuNPs-DNAs sensor towards these urinary tract pathogenic bacteria. The suspensions of five kinds of bacteria (OD600 = 0.1) were incubated with Ami-AuNPs-DNAs sensor for six times in parallel, so that 6 channels × 5 bacteria × 6 replicates data matrix could be generated (Table S2). It was noticed that there were various binding forces between bacteria and the sensor, which made the sensor exhibit the significant fluorescence response towards each kind of bacterium (Figure 3A). Therefore, these fluorescence responses with significant differences can be used as a basis for identifying different species of bacteria. PCA was employed to convert fluorescence response to a two-dimensional and three-dimensional plot. As shown in Figures 3B and S11, five kinds of bacteria were well-clustered without any overlap and thoroughly identified from each other in the 2D and 3D canonical score plot under the 95% confidence ellipses. In addition, the fitting parameters of PCA model were R2=0.973, Q2=0.856, respectively. The closer R2 was to 1, the more stable the model was. Q2>0.5 indicated the higher prediction accuracy of the model. Subsequently, the data matrix was further classified by LDA using the analysis software SPSS (version 22.0), which was a powerful statistical method to identify multiple analysts simultaneously. LDA analysis transforms the matrix into three canonical factors (85.9%, 10.5%, 3.6%) and exhibits 5 separated clusters clearly (Figure S12), which further confirmed that the sensor could be used in the discrimination and identification of five kinds of bacteria. Besides, the 100% classification accuracy for each bacterium was confirmed according to Jackknife classification,65,66 suggesting the extraordinary properties of the six-channel sensor in discrimination of bacteria (Table S3).
 |
Figure 3 (A) Fluorescence response patterns generated by Ami-AuNPs-DNAs sensor array for identifying the different bacteria. The normalized fluorescence intensity represents the ratio of the fluorescence intensity of DNAs after the addition of bacteria to that before the addition of bacteria. (B) Two-dimensional canonical score plot for the response patterns of five kinds of bacteria (OD600=0.1) by PCA. Each point represents the response pattern for single bacteria species to the sensor. |
Quantitative Analysis of Bacteria via Fluorescence Sensor
To further evaluate the discriminative capability of the sensor, five kinds of bacteria were selected to explore the quantitative analysis performance of the fluorescent sensor via LDA and PCA (6 channels × 7 concentrations × 6 replicates, OD600 from 0.1 to 0.005, Tables S4–S8). The 2D LDA plot and 3D PCA plot results (Figures S13–S17) showed that all of the seven concentrations of bacteria could be discriminated with 100% accuracy, even at the lowest concentration of 1×10⁷ cfu/mL, indicating that the present fluorescent sensor array had good differentiation capability for bacteria in broad concentration ranges.
The Detection and Discrimination of Clinical Urinary Tract Pathogenic Bacteria
As the discrimination of bacteria in urine was significant in clinical settings, the sensor array system was further applied in clinical samples for the discrimination of urinary tract pathogenic bacteria. Five kinds of urinary tract pathogenic bacteria were obtained by plate culture of clinical urine samples from patients with UTIs. The variations of the fluorescence intensity of the Ami-AuNP-DNAs sensor after incubation with bacteria isolated from clinical urine samples were recorded (6 channels × 5 bacteria × 40 samples, Table S9). Then the response patterns were subjected to LDA analysis to convert the training matrix into three canonical scores, and the first two most important discrimination factors were used to generate 2D canonical score plots. As was shown in Figure 4A, five kinds of bacteria isolated from clinical urine samples were clustered into 5 groups, and all the groups were separated entirely from each other with no errors or misclassifications. Furthermore, 100.0% of cross-validated grouped cases correctly classified. LDA model performance was measured in terms of precision, sensitivity, specificity and accuracy of calibration model, indicating that the sensor had good discriminative power (Table S10). Meanwhile, the training data matrix was subjected to produce three discrimination factors (35.8, 30.7, and 2.7 variation) through PCA. The first two foremost discrimination factors were used to generate a 3D plot (Figure 4B) and 2D plot (Figure S18) with 95% confidence ellipses. Intuitively, the canonical response plot showed a unique fingerprint for each type of bacteria, where the five kinds of bacteria isolated from clinical urine samples were clearly separated from each other, further demonstrating the excellent discriminating capability of the proposed fluorescent sensor array for bacteria isolated from clinical urine samples. Importantly, with access to timely and reliable pathogen information for clinical decisions, point-of-care treatment decisions were made by the prescription of an optimal antibiotic, which reduced the risk of antibiotic-resistant infections significantly.
 |
Figure 4 (A) Two-dimensional canonical score plot for the response patterns of five kinds of bacteria isolated from clinical urine samples (OD600=0.1) by LDA. Each point represents the response pattern for single bacteria species to the sensor. (B) Three-dimensional canonical score plot for the response patterns of five kinds of bacteria isolated from clinical urine samples (OD600=0.1) by PCA. Each point represents the response pattern for single bacteria species to the sensor. |
Conclusion
In summary, a fluorescence sensor was successfully constructed to rapidly discriminate urinary tract pathogenic bacteria. This developed strategy had the advantages of simple operation, rapid detection, low cost and high sensitivity for the detection of urinary tract pathogenic bacteria, which made up for the deficiency of the traditional methods for the identification of urinary tract pathogenic bacteria in clinic. Besides, the successful discrimination and classification of different kinds of urinary tract pathogenic bacteria based on the difference of bacterial surface charge has approved that bacterial surface charge could be used as novel markers for the diagnosis bacterial infectious disease. However, the application of the developed fluorescence sensor should be further expanded to demonstrate the feasibility of point-of-care rapid bacterial infection testing, which holds great promise for the diagnosis of the disease caused by bacterial infection.
Acknowledgment
This research was supported by National Natural Science Foundation of China (82104357 and 21775166), Natural Science Foundation for Distinguished Young Scholars of Jiangsu Province (BK20180026).
Disclosure
The authors declare that they have no known competing financial interests or personal relationships that could have appeared to influence the work reported in this paper.
References
1. Terlizzi ME, Gribaudo G, Maffei ME. UroPathogenic Escherichia coli (UPEC) infections: virulence factors, bladder responses, antibiotic, and non-antibiotic antimicrobial strategies. Front Microbiol. 2017;8:1566. doi:10.3389/fmicb.2017.01566
2. Foxman B. Urinary tract infection syndromes: occurrence, recurrence, bacteriology, risk factors, and disease burden. Infect Dis Clin North Am. 2014;28(1):1–13. doi:10.1016/j.idc.2013.09.003
3. Scribano D, Sarshar M, Prezioso C, et al. d-mannose treatment neither affects uropathogenic Escherichia coli properties nor induces stable FimH modifications. Molecules. 2020;25(2):316. doi:10.3390/molecules25020316
4. Shea AE, Marzoa J, Himpsl SD, et al. Escherichia coli CFT073 fitness factors during urinary tract infection: identification using an ordered transposon library. Appl Environ Microbiol. 2020;86(13):e00691–20. doi:10.1128/AEM.00691-20
5. Gaitonde S, Malik RD, Zimmern PE. Financial burden of recurrent urinary tract infections in women: a time-driven activity-based cost analysis. Urology. 2019;128:47–54. doi:10.1016/j.urology.2019.01.031
6. Ou Q, Fang JQ, Zhang ZS, et al. TcpC inhibits neutrophil extracellular trap formation by enhancing ubiquitination mediated degradation of peptidylarginine deiminase 4. Nat Commun. 2021;12(1):3481. doi:10.1038/s41467-021-23881-8
7. Govindarajan DK, Kandaswamy K. Virulence factors of uropathogens and their role in host pathogen interactions. Cell Surf. 2022;8:100075. doi:10.1016/j.tcsw.2022.100075
8. Kline KA, Fälker S, Dahlberg S, et al. Bacterial adhesins in host-microbe interactions. Cell Host Microbe. 2009;5(6):580–592. doi:10.1016/j.chom.2009.05.011
9. Govindarajan DK, Viswalingam N, Meganathan Y, et al. Adherence patterns of Escherichia coli in the intestine and its role in pathogenesis. Med Microecol. 2020;5:2590–2978. doi:10.1016/j.medmic.2020.100025
10. Kline KA, Lewis AL, Mulvey MA, Stapleton AE, Klumpp DJ. Gram-positive uropathogens, polymicrobial urinary tract infection, and the emerging microbiota of the urinary tract. Microbiol Spectr. 2016;4(2):10. doi:10.1128/microbiolspec.UTI-0012-2012
11. Shanmugasundarasamy T, Karaiyagowder Govindarajan D, Kandaswamy K. A review on pilus assembly mechanisms in Gram-positive and Gram-negative bacteria. Cell Surf. 2022;8:100077. doi:10.1016/j.tcsw.2022.100077
12. Kline KA, Kau AL, Chen SL, et al. Mechanism for sortase localization and the role of sortase localization in efficient pilus assembly in Enterococcus faecalis. J Bacteriol. 2009;191(10):3237–3247. doi:10.1128/JB.01837-08
13. Dietz BM, Hajirahimkhan A, Dunlap TL, et al. Botanicals and their bioactive phytochemicals for women’s health. Pharmacol Rev. 2016;68(4):1026–1073. doi:10.1124/pr.115.010843
14. Little P, Moore MV, Turner S, et al. Effectiveness of five different approaches in management of urinary tract infection: randomised controlled trial. BMJ. 2010;340:c199. doi:10.1136/bmj.c199
15. Wu J, Hayes BW, Phoenix C, et al. A highly polarized TH2 bladder response to infection promotes epithelial repair at the expense of preventing new infections. Nat Immunol. 2020;21(6):671–683. doi:10.1038/s41590-020-0688-3
16. Allsopp LP, Beloin C, Moriel DG, et al. Functional heterogeneity of the UpaH autotransporter protein from uropathogenic Escherichia coli. J Bacteriol. 2012;194(21):5769–5782. doi:10.1128/JB.01264-12
17. Flores-Mireles AL, Walker JN, Caparon M, et al. Urinary tract infections: epidemiology, mechanisms of infection and treatment options. Nat Rev Microbiol. 2015;13(5):269–284. doi:10.1038/nrmicro3432
18. Chan CY, St John AL, Abraham SN. Mast cell interleukin-10 drives localized tolerance in chronic bladder infection. Immunity. 2013;38(2):349–359. doi:10.1016/j.immuni.2012.10.019
19. Pokharel P, Díaz JM, Bessaiah H, et al. The serine protease autotransporters TagB, TagC, and Sha from extraintestinal pathogenic Escherichia coli are internalized by human bladder epithelial cells and cause actin cytoskeletal disruption. Int J Mol Sci. 2020;21(9):3047. doi:10.3390/ijms21093047
20. Klein RD, Hultgren SJ. Urinary tract infections: microbial pathogenesis, host-pathogen interactions and new treatment strategies. Nat Rev Microbiol. 2020;18(4):211–226. doi:10.1038/s41579-020-0324-0
21. Reitzer L, Zimmern P. Rapid growth and metabolism of uropathogenic Escherichia coli in relation to urine composition. Clin Microbiol Rev. 2019;33(1):e00101–19. doi:10.1128/CMR.00101-19
22. Lussu M, Camboni T, Piras C, et al. 1H NMR spectroscopy-based metabolomics analysis for the diagnosis of symptomatic E. coli-associated urinary tract infection (UTI). BMC Microbiol. 2017;17(1):201. doi:10.1186/s12866-017-1108-1
23. Mehnert-Kay SA. Diagnosis and management of uncomplicated urinary tract infections. Am Fam Physician. 2005;72(3):451–456.
24. Lammers RL, Gibson S, Kovacs D, et al. Comparison of test characteristics of urine dipstick and urinalysis at various test cutoff points. Ann Emerg Med. 2001;38(5):505–512. doi:10.1067/mem.2001.119427
25. Devillé WL, Yzermans JC, van Duijn NP, et al. The urine dipstick test useful to rule out infections. A meta-analysis of the accuracy. BMC Urol. 2004;4:4. doi:10.1186/1471-2490-4-4
26. Davenport M, Mach KE, Shortliffe LMD, et al. New and developing diagnostic technologies for urinary tract infections. Nat Rev Urol. 2017;14(5):296–310. doi:10.1038/nrurol.2017.20
27. Burnham P, Dadhania D, Heyang M, et al. Urinary cell-free DNA is a versatile analyte for monitoring infections of the urinary tract. Nat Commun. 2018;9(1):2412. doi:10.1038/s41467-018-04745-0
28. Schmiemann G, Kniehl E, Gebhardt K, et al. The diagnosis of urinary tract infection: a systematic review. Dtsch Arztebl Int. 2010;107(21):361–367. doi:10.3238/arztebl.2010.0361
29. Powless AJ, Prieto SP, Gramling MR, et al. Evaluation of acridine orange staining for a semi-automated urinalysis microscopic examination at the point-of-care. Diagnostics. 2019;9(3):122. doi:10.3390/diagnostics9030122
30. Luciano R, Piga S, Federico L, et al. Development of a score based on urinalysis to improve the management of urinary tract infection in children. Clin Chim Acta. 2012;413(3–4):478–482. doi:10.1016/j.cca.2011.11.005
31. Kalra OP, Raizada A. Approach to a patient with urosepsis. J Glob Infect Dis. 2009;1(1):57–63. doi:10.4103/0974-777X.52984
32. Mayo S, Acevedo D, Quiñones-Torrelo C, et al. Clinical laboratory automated urinalysis: comparison among automated microscopy, flow cytometry, two test strips analyzers, and manual microscopic examination of the urine sediments. J Clin Lab Anal. 2008;22(4):262–270. doi:10.1002/jcla.20257
33. Fairfax MR, Salimnia H. Diagnostic molecular microbiology: a 2013 snapshot. Clin Lab Med. 2013;33(4):787–803. doi:10.1016/j.cll.2013.08.003
34. Tang YW, Procop GW, Persing DH. Molecular diagnostics of infectious diseases. Clin Chem. 1997;43(11):2021–2038. doi:10.1093/clinchem/43.11.2021
35. Kothari A, Morgan M, Haake DA. Emerging technologies for rapid identification of bloodstream pathogens. Clin Infect Dis. 2014;59(2):272–278. doi:10.1093/cid/ciu292
36. Seng P, Drancourt M, Gouriet F, et al. Ongoing revolution in bacteriology: routine identification of bacteria by matrix-assisted laser desorption ionization time-of-flight mass spectrometry. Clin Infect Dis. 2009;49(4):543–551. doi:10.1086/600885
37. Kunze-Szikszay N, Euler M, Perl T. Identification of volatile compounds from bacteria by spectrometric methods in medicine diagnostic and other areas: current state and perspectives. Appl Microbiol Biotechnol. 2021;05(16–17):6245–6255. doi:10.1007/s00253-021-11469-7
38. Roux-Dalvai F, Gotti C, Leclercq M, et al. Fast and accurate bacterial species identification in urine specimens using LC-MS/MS mass spectrometry and machine learning. Mol Cell Proteomics. 2019;18(12):2492–2505. doi:10.1074/mcp.TIR119.001559
39. Veron L, Mailler S, Girard V, et al. Rapid urine preparation prior to identification of uropathogens by MALDI-TOF MS. Eur J Clin Microbiol Infect Dis. 2015;34(9):1787–1795. doi:10.1007/s10096-015-2413-y
40. Wu Q, Li Y, Wang M, et al. Fluorescence in situ hybridization rapidly detects three different pathogenic bacteria in urinary tract infection samples. J Microbiol Methods. 2010;83(2):175–178. doi:10.1016/j.mimet.2010.08.015
41. Zhao X, Gao Y, Wang J, et al. Aggregation-induced emission based one-step ”lighting up” sensor array for rapid protein identification. Chem Commun. 2020;56(89):13828–13831. doi:10.1039/D0CC05749E
42. Tomita S, Ishihara S, Kurita R. Biomimicry recognition of proteins and cells using a small array of block copolymers appended with amino acids and fluorophores. ACS Appl Mater Interfaces. 2019;11(7):6751–6758. doi:10.1021/acsami.8b18118
43. Behera P, De M. Nano-graphene oxide based multichannel sensor arrays towards sensing of protein mixtures. Chem Asian J. 2019;14(4):553–560. doi:10.1002/asia.201801756
44. Han J, Cheng H, Wang B, et al. A polymer/peptide complex-based sensor array that discriminates bacteria in urine. Angew Chem Int Ed Engl. 2017;56(48):15246–15251. doi:10.1002/anie.201706101
45. Chen W, Li Q, Zheng W, et al. Identification of bacteria in water by a fluorescent array. Angew Chem Int Ed Engl. 2014;53(50):13734–13739. doi:10.1002/anie.201407606
46. Yin M, Jing C, Li H, et al. Surface chemistry modified upconversion nanoparticles as fluorescent sensor array for discrimination of foodborne pathogenic bacteria. J Nanobiotechnology. 2020;18(1):41. doi:10.1186/s12951-020-00596-4
47. Bajaj A, Miranda OR, Kim IB, et al. Detection and differentiation of normal, cancerous, and metastatic cells using nanoparticle-polymer sensor arrays. Proc Natl Acad Sci U S A. 2009;106(27):10912–10916. doi:10.1073/pnas.0900975106
48. Le NDB, Yesilbag tonga G, Mout R, et al. Cancer cell discrimination using host-guest ”doubled” arrays. J Am Chem Soc. 2017;139(23):8008–8012. doi:10.1021/jacs.7b03657
49. Rana S, Le ND, Mout R, et al. A multichannel biosensor for rapid determination of cell surface glycomic signatures. ACS Cent Sci. 2015;1(4):191–197. doi:10.1021/acscentsci.5b00126
50. Li Z, Xu L, Yuan H, et al. Fluorescent sensor array based on aggregation-induced emission luminogens for pathogen discrimination. Analyst. 2022;147(13):2930–2935. doi:10.1039/D2AN00643J
51. Laliwala A, Svechkarev D, Sadykov MR, et al. Simpler procedure and improved performance for pathogenic bacteria analysis with a paper-based ratiometric fluorescent sensor array. Anal Chem. 2022;94(5):2615–2624. doi:10.1021/acs.analchem.1c05021
52. Svechkarev D, Sadykov MR, Bayles KW, et al. Ratiometric fluorescent sensor array as a versatile tool for bacterial pathogen identification and analysis. ACS Sens. 2018;3(3):700–708. doi:10.1021/acssensors.8b00025
53. Peveler WJ, Algar WR. More than a light switch: engineering unconventional fluorescent configurations for biological sensing. ACS Chem Biol. 2018;13(7):1752–1766. doi:10.1021/acschembio.7b01022
54. Albert KJ, Lewis NS, Schauer CL, et al. Cross-reactive chemical sensor arrays. Chem Rev. 2000;100(7):2595–2626. doi:10.1021/cr980102w
55. Peveler WJ, Yazdani M, Rotello VM. Selectivity and specificity: pros and cons in sensing. ACS Sens. 2016;1(11):1282–1285. doi:10.1021/acssensors.6b00564
56. Tomita S, Niwa O, Kurita R. Artificial modification of an enzyme for construction of cross-reactive polyion complexes to fingerprint signatures of proteins and mammalian cells. Anal Chem. 2016;88(18):9079–9086. doi:10.1021/acs.analchem.6b02010
57. Saha K, Agasti SS, Kim C, et al. Gold nanoparticles in chemical and biological sensing. Chem Rev. 2012;112(5):2739–2779. doi:10.1021/cr2001178
58. Boisselier E, Astruc D. Gold nanoparticles in nanomedicine: preparations, imaging, diagnostics, therapies and toxicity. Chem Soc Rev. 2009;38(6):1759–1782. doi:10.1039/b806051g
59. Daniel MC, Astruc D. Gold nanoparticles: assembly, supramolecular chemistry, quantum-size-related properties, and applications toward biology, catalysis, and nanotechnology. Chem Rev. 2004;104(1):293–346.
60. Yang X, Li J, Pei H, et al. DNA-gold nanoparticle conjugates-based nanoplasmonic probe for specific differentiation of cell types. Anal Chem. 2014;86(6):3227–3231. doi:10.1021/ac500381e
61. Jia F, Liu Q, Wei W, et al. Colorimetric sensor assay for discrimination of proteins based on exonuclease I-triggered aggregation of DNA-functionalized gold nanoparticles. Analyst. 2019;144(16):4865–4870. doi:10.1039/C9AN00918C
62. Tomita S, Ishihara S, Kurita R, A Multi-fluorescent DNA/graphene oxide conjugate sensor for signature-based protein discrimination. Sensors. 2017;17(10):2194. doi:10.3390/s17102194
63. Bai XF, Yu XA, Zhang R, et al. Protein/gold nanoparticle-based sensors for monitoring the progression of adriamycin nephropathy. ACS Appl Nano Mater. 2021;4(5):4919–4929. doi:10.1021/acsanm.1c00468
64. Haiss W, Thanh NT, Aveyard J, et al. Determination of size and concentration of gold nanoparticles from UV-vis spectra. Anal Chem. 2007;79(11):4215–4221. doi:10.1021/ac0702084
65. Farid DM, Zhang L, Rahman CM, et al. Hybrid decision tree and naïve Bayes classifiers for multi-class classification tasks. Expert Syst Appl. 2014;41(4):1937–1946. doi:10.1016/j.eswa.2013.08.089
66. Cuadros-Rodríguez L, Pérez-Castaño E, Ruiz-Samblás C. Quality performance metrics in multivariate classification methods for qualitative analysis. Trends Analyt Chem. 2016;80:612–624. doi:10.1016/j.trac.2016.04.021
 © 2022 The Author(s). This work is published and licensed by Dove Medical Press Limited. The
full terms of this license are available at https://www.dovepress.com/terms
and incorporate the Creative Commons Attribution
- Non Commercial (unported, 3.0) License.
By accessing the work you hereby accept the Terms. Non-commercial uses of the work are permitted
without any further permission from Dove Medical Press Limited, provided the work is properly
attributed. For permission for commercial use of this work, please see paragraphs 4.2 and 5 of our Terms.
© 2022 The Author(s). This work is published and licensed by Dove Medical Press Limited. The
full terms of this license are available at https://www.dovepress.com/terms
and incorporate the Creative Commons Attribution
- Non Commercial (unported, 3.0) License.
By accessing the work you hereby accept the Terms. Non-commercial uses of the work are permitted
without any further permission from Dove Medical Press Limited, provided the work is properly
attributed. For permission for commercial use of this work, please see paragraphs 4.2 and 5 of our Terms.