Back to Journals » Infection and Drug Resistance » Volume 16
Raman-Based Antimicrobial Susceptibility Testing on Antibiotics of Last Resort
Authors Xiao Z, Qu L, Chen H, Liu W, Zhan Y ![]() , Ling J, Shen H, Yang L, Chen D
, Ling J, Shen H, Yang L, Chen D
Received 29 January 2023
Accepted for publication 28 June 2023
Published 21 August 2023 Volume 2023:16 Pages 5485—5500
DOI https://doi.org/10.2147/IDR.S404732
Checked for plagiarism Yes
Review by Single anonymous peer review
Peer reviewer comments 2
Editor who approved publication: Prof. Dr. Héctor Mora-Montes
Zhirou Xiao,1,* Liping Qu,2,* Haijun Chen,1 Wanting Liu,2 Yi Zhan,2 Jiahui Ling,2 Hongwei Shen,3 Ling Yang,1 Dingqiang Chen2
1Department of Laboratory Medicine, The First Affiliated Hospital of Guangzhou Medical University, Guangzhou, Guangdong, People’s Republic of China; 2Microbiome Medicine Center, Department of Laboratory Medicine, Zhujiang Hospital, Southern Medical University, Guangzhou, Guangdong, People’s Republic of China; 3Department of Clinical Laboratory, Shenzhen Hospital of Southern Medical University, Guangzhou, Guangdong, People’s Republic of China
*These authors contributed equally to this work
Correspondence: Ling Yang, Department of Laboratory Medicine, The First Affiliated Hospital of Guangzhou Medical University, Guangzhou, Guangdong, 510120, People’s Republic of China, Tel/Fax +86-20-83062158, Email [email protected] Dingqiang Chen, Microbiome Medicine Center, Department of Laboratory Medicine, Zhujiang Hospital, Southern Medical University, Guangzhou, Guangdong, 510282, People’s Republic of China, Tel/Fax +86-20-62783335, Email [email protected]
Background: Antibiotic resistance represents a serious global health challenge, particularly with the emergence of strains resistant to last-resort antibiotics such as tigecycline, polymyxin B, and vancomycin. Urgent measures are required to alleviate this situation. To facilitate the judicious use of antibiotics, rapid and precise antimicrobial susceptibility testing (AST) is essential. Heavy water (deuterium oxide, D2O)-labeled Raman spectroscopy has emerged as a promising time-saving tool for microbiological testing.
Methods: Deuterium incorporation and experimental conditions were examined to develop and apply a Raman-based AST method to evaluate the efficacy of last-resort antibiotics, including tigecycline, polymyxin B, and vancomycin, against Escherichia coli, Klebsiella pneumoniae, Pseudomonas aeruginosa, and Enterococcus faecium. Essential agreement and categorical agreement were used to assess the metabolism inactivation concentration based on Raman spectroscopy (R-MIC)–a new metric developed in this study—and minimum inhibitory concentration (MIC) determined via the traditional microdilution broth method. Spearman’s rank correlation coefficient was employed to measure the association between R-MIC and MIC values.
Results: The Raman-based AST method achieved a 100% categorical agreement (92/92) with the traditional microdilution broth method within five hours, while the traditional method required approximately 24 h. The R-MIC values shared 68.5% (63/92) consistency with the MIC values. In addition, the R-MIC and MIC values were highly correlated (Spearman’s r=0.96), resulting in an essential agreement of 100%.
Conclusion: Our optimized experimental method and conditions indicate that Raman-based AST holds great promise as a solution to overcome the time-consuming challenges of traditional AST methods.
Keywords: Raman spectroscopy, tigecycline resistant, polymyxin B resistant, vancomycin resistant, antimicrobial susceptibility testing
Introduction
The global spread of antimicrobial resistance genes and the resultant emergence of drug-resistant bacterial strains has become a major concern in recent decades.1 In 2017, the World Health Organization (WHO) compiled a list of priority pathogens,2 designating Pseudomonas aeruginosa (P. aeruginosa), Enterobacteriaceae, and Enterococcus faecium as critical or high priority tiers. Current treatment options for these antimicrobial-resistant pathogens are limited to last-resort antibiotics, including polymyxin B,3 tigecycline,4 and vancomycin.5 Fast and accurate antimicrobial susceptibility testing (AST) results are needed to prescribe appropriate antibiotics that can deal with the infection problem and ease the drug-resistant struggle; misuse of antibiotics may worsen the current situation. Moreover, early identification of “superbugs” that are non-susceptible to last-resort antibiotics is crucial for prevention and control. However, the culture-dependent AST method currently in use is time consuming and labor intensive. In addition, although the VITEK-2 COMPACT system—an automated AST instrument—can facilitate the process, it is not suitable for all clinically used antimicrobials, such as tigecycline6 and polymyxin B.7
Several rapid identification methods based on genotype have been developed, which offer the advantages of being culture-independent and capable of revealing drug-resistant mechanisms. However, these methods do exhibit certain limitations. For instance, despite the occurrence of genotype-phenotype discrepancies,8 genotypic approaches overlook the complex interaction between bacteria and antibiotics.9 Moreover, our limited understanding of numerous drug resistance genes and mutations10 presents a major obstacle to their clinical application. In recent years, vibrational spectroscopy-based methods, particularly Raman spectroscopy, have emerged as a promising approach in microbiology, with the potential to provide detailed biochemical information11 (eg, nucleic acid, protein, lipid) of individual cells in situ, which is unique for different species.12 Raman spectroscopy involves the measurement of scattering spectra, wherein incident light interacts with particles and generates scattered light with different wavelengths, resulting in the formation of the Raman spectrum. Raman spectroscopy offers several advantages, including that it is non-destructive,13 time saving, and can investigate individual cells.14
Single-cell Raman spectra consist of a specific number of Raman peaks, with different peaks representing distinct wavelength positions and corresponding intensities. The vibration of particular molecular bonds or groups is associated with specific spectral peaks. Thus, the Raman spectrum serves as a unique “fingerprint” of a specific sample, providing a clear insight into the biological macromolecules such as lipids, proteins, and nucleic acids within cells at the single-cell level. The fingerprint region of Raman spectra has been utilized in combination with machine learning to identify microorganisms cultured from various samples, including urine,11 blood,15 and environmental samples.16 The Ramansilent region (1800–2800 cm−1) shows no detectable band, while the C-H band region displays an exclusive band that reflects the presence of C-Hx. The addition of isotope labeling has rendered Raman-based technology more versatile and less complex, and deuterium is a popular choice of isotope owing to its availability, stability, and cost-effectiveness. The process of heavy water (deuterium oxide, D2O) labeling17 is straightforward, as active microbial cells can incorporate deuterium from D2O, leading to the synthesis of deuterium-labeled macromolecules and the appearance of a significantly broad band in the silent region of Raman spectra, reflecting the substitution of C-Hx by C-Dx.18
In the past few years, extensive research on the combination of deuterium labeling and Raman spectroscopy has led to increasing reports on D2O-labeled Raman-based methods for AST. The tracking of the incorporation of D2O19 showed that it was possible to study metabolism in active microorganisms using D2O as a probe. After only 20 minutes of incubation in D2O-containing media, a visible carbon-deuterium (C-D) characteristic band appeared on the Raman spectrum (2040–2300 cm−1). In terms of AST, when exposed to antibiotics, susceptible strains experience inhibited metabolism and cannot incorporate deuterium. The D2O-Raman method has been used to measure the metabolic activity of five different types of oral bacteria in response to sodium fluoride (NaF), chlorhexidine (CHX), and ampicillin.20 Additionally, a new concept called MIC-MA (Minimum Inhibitory Concentration based on Metabolic Activity) has been proposed to distinguish Raman-based AST from the traditional MIC. The MIC-MA varies significantly from the MIC. A more formal protocol for the determination of single-cell metabolism inactivation concentration (SC-MIC) within 2.5 h was reported in 2020.21 The SC-MIC, obtained from this Raman-based AST protocol, shared 94.6% categorical agreement with the MIC obtained from the traditional AST method. Despite the insufficiency of antibiotics selected for each strain in the study, the findings represented a significant breakthrough in Raman-based AST research. Subsequent studies have continued to build on this progress. A fast Raman-assisted antibiotic susceptibility test (FRAST)22 could directly obtain MICs (for various common antibiotics) from urine or blood samples within 3 hours and 21 hours, respectively, with an overall agreement of 88%. However, although D2O-Raman has demonstrated its practicality, it is rarely used in systematic AST for polymyxin B, tigecycline, and vancomycin.
This study focused on last-resort antibiotics and aimed to establish a protocol for Raman-based AST. A new metric—the minimum metabolism inactivation concentration based on the Raman spectra (R-MIC)—was developed to quantify strain susceptibility. R-MIC is defined as the minimum concentration of antibiotic required to inactivate metabolism of a strain. Several clinically isolated strains with varying susceptibilities to polymyxin B, tigecycline, and vancomycin were collected to verify the reliability of this method for discriminating susceptible and non-susceptible strains. Compared with traditional AST, our Raman-based AST using R-MIC could identify strains that were non-susceptible to tigecycline and vancomycin and strains non-resistant to polymyxin B, after only 4 h of incubation, with 100% categorical agreement. The R-MIC results were in 100% essential agreement with conventional MIC results.
Materials and Methods
Isolates Collection
Strains were obtained from clinical specimens, including blood, urine, feces, and swab samples, from patients at The First Affiliate Hospital of Guangzhou Medical University and Zhujiang Hospital of Southern Medical University. In addition, for reference strains, E. coli ATCC 25922, E. coli ATCC 35218, P. aeruginosa ATCC 27853, and Enterococcus faecalis ATCC 29212, were included in this research. The collected strains were identified by matrix-assisted laser desorption ionization time-of-flight mass spectrometry (MALDI-TOF-MS) and stored in 15% glycerol at −80 °C. MIC results for each strain regarding tigecycline (Macklin, Shanghai, China), polymyxin B (Sigma-Aldrich, St. Louis, MO, USA), and vancomycin (Shyuanye, Shanghai, China) were acquired using the microdilution broth method. AST was performed in accordance with the international standard ISO20776-1. The interpretation of the AST results was based on the US Food and Drug Administration (FDA)-defined breakpoints, European Committee on Antimicrobial Susceptibility Testing (EUCAST) breakpoints, or Clinical Laboratory Standards Institute (CLSI) breakpoints (Table 1).
 |
Table 1 The Pathogen-Antibiotic Groups |
Antibiotic-induced resistant strains were also included in the study to enrich the non-susceptible groups. Tigecycline-resistant and polymyxin B-resistant strains of Klebsiella pneumoniae were induced using antibiotics with increasing concentrations of 8×MIC, 8×MIC, 64×MIC, 200×MIC, and 200×MIC from day 1 to day 5, respectively.23 P. aeruginosa treated with polymyxin B showed no growth; therefore, a milder induction procedure was performed. On day 1, 3–5 colonies from overnight culture on Columbia blood plate culture medium were added to 10 mL of cation-adjusted MHB medium containing 2×MIC of polymyxin B. The incubation broth was changed daily, and the concentration of polymyxin B was doubled until visible growth was observed. Using this method, one polymyxin B-resistant strain of P. aeruginosa (Pa-InR389) was induced. The exact treatment for induction of Pa-InR389 was 2 mg/L, 2 mg/L, 4 mg/L, 8 mg/L, 8 mg/L, 8 mg/L, 8 mg/L, 8 mg/L, and 16 mg/L from day 1 to day 9, respectively.
Overnight culture on Columbia blood plate culture medium was required to prepare the frozen storage (−20 °C) of strains for Raman-based AST.
Pretreatment of Liquid Cultures and Acquisition of Raman Spectra
Pretreatment of liquid cultures and acquisition of Raman spectra involved several steps. After incubation, the liquid cultures were centrifuged at 10,000 rpm for 5 minutes. The sediment was washed with sterile deionized water and then centrifuged again at 10,000 rpm for 3 minutes. This washing step was repeated at least three times. The resulting sediment was resuspended in sterile deionized water and spotted onto a CaF2 slide to form a monolayer of bacteria. At least 50 Raman spectra were collected for each sample. This step was completed within 1 hour.
All Raman measurements were conducted using the Clinical Antimicrobial Susceptibility Test Ramanometry (CAST-R) instrument (Qingdao Single‐cell Biotech, CN) with a grating of 600 g/mm and an acquisition time of 3 seconds.; the laser power was set to 60 mW.
Preprocessing and Analysis of Raman Spectra Data
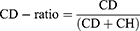
The raw Raman spectra data were preprocessed using several steps. Background subtraction, correction, normalization of the baseline, and the calculation of CD-ratio and signal-to-noise ratio (SNR) were all performed using RStudio (Boston, MA, USA). The intensity of the C-D band (2050–2300 cm−1) and C-H band (2800–3050 cm−1) were used to calculate the CD-ratio. CD-ratio is an indicator that quantifies the absorption of D2O and has been reported in previous studies.19,20
Excel, SPSS software (version 25.0), and Graphpad Prism (version 8) were used for statistical analysis and data visualization.
Determination of Deuterium-Labeling Parameters
High concentrations of D2O were reported to have an inhibitory effect on the growth of bacteria.24 To investigate the impact of D2O (Sigma-Aldrich) on bacterial growth, cation-adjusted MHB (CAMHB) was prepared with different concentrations of D2O (0–50%) and growth of the reference strain Escherichia coli (E. coli) ATCC 25922 in the media was monitored by measuring the optical density at 600 nm (OD600) every hour. CD-ratios of Escherichia coli ATCC 25922 under different concentrations of deuterium were also analyzed to further investigate the relationship between incubation time, deuterium concentration, and D2O absorption. Violin plots and ROC curves were used to visualize the CD-ratios of different groups.
Owing to the slow growth pattern of Enterococcus, as exemplified by Enterococcus faecalis ATCC 29212 in CAMHB, a more nutritive medium, Brain Heart infusion (BHI) broth, was used for the incubation of Enterococcus strains.
Incubation Conditions and Scheme Setting
The incubation was performed at 37°C and 180 rpm in CAMHB medium, except for Enterococcus strains, which were incubated in BHI to improve growth and avoid slow absorption of D2O. CD-ratio was used as an indicator to quantify deuterium incorporation. Schemes with different deuterium incubation times were tested on tigecycline-susceptible Escherichia coli ATCC 25922 and tigecycline-resistant E. coli R4.
To determine the cutoff value of CD-ratio when bacterial metabolism is inactivated, antibiotics (eg, tigecycline and vancomycin) at concentrations over 10×MIC were used to treat 12 strains of Escherichia coli and 6 strains of Enterococcus.
R-MIC Measurement on Five Sets of Samples
The Raman-based AST method was applied to five sets of pathogen-antibiotic samples, including Escherichia coli, K. pneumoniae, P. aeruginosa, and Enterococcus faecium, with commonly considered antibiotics of last resort (tigecycline, polymyxin B, and vancomycin). The strains were treated with antibiotics at gradient concentrations, and the R-MIC was determined based on Raman spectroscopy. The consistency between R-MIC and MIC was evaluated by calculating essential agreement (EA), categorical agreement (CA), very major error (VME), and major error (ME). EA was defined as the percentage of strains where the R-MICs were within 1 log2 dilution of the MIC. CA was calculated by determining the number of isolates where susceptibility yield from R-MIC was the same as that from MIC. Disagreement was defined as VME if the strain was identified as susceptible by R-MIC but resistant by MIC, whereas the reverse disagreement was defined as ME. Spearman’s rank correlation coefficient was calculated to examine the correlation between MIC and R-MIC.
Results
Strain Collection and AST
A total of 80 strains isolated from clinical samples were collected, along with 3 laboratory-induced drug-resistant strains—a tigecycline-resistant strain of K. pneumoniae (Kp-InR48), a polymyxin B-resistant strain of K. pneumoniae (Kp-InR37), and a polymyxin B-resistant strain of P. aeruginosa (Pa-InR389). Five sets of pathogen-antibiotic samples (Table 1) that have marked clinical significance were examined. Strains were obtained from urine, feces, sputum, blood, or other samples. Clinical information of the collected strains and their corresponding MIC results are detailed in Table S1.
The study included 19 strains that were non-susceptible to tigecycline, 4 strains that were resistant to polymyxin B, and 6 strains that were non-susceptible to vancomycin.
Factors Affecting Deuterium Incorporation
The microscopic images and Raman spectra of Escherichia coli ATCC 25922, with and without tigecycline stress, are presented in Figure 1. The morphological characteristics of the strain did not show significant changes under the effect of tigecycline stress. However, there was a noticeable difference in Raman intensity between the two groups (with and without tigecycline stress). The control group of bacteria, which was incubated without tigecycline, obtained sufficient D2O and displayed a clear C-D band on the Raman spectra, while the bacteria cultured with tigecycline showed no detectable band in the silent region, indicating the suppression of metabolic activity.
 |
Figure 1 The Raman spectrum at C-D band and the corresponding images of Escherichia coli after D2O incubation for 3 hours under 0.5mg/L tigecycline. (A) Image of strain R4 under 0.5mg/L tigecycline. (B) Image of strain ATCC 25922 under 0.5mg/L tigecycline pressure. (C) The Raman spectrum at C-D band. The blue triangle represents the C-D band of strain R4. |
To determine the optimal concentration of D2O for this study, the growth of Escherichia coli ATCC 25922 was monitored in incubation media containing different concentrations of D2O (0–50%) using OD600. The growth curves indicated that growth of the strain was significantly inhibited in incubation media containing 40% and 50% D2O (Figure 2A). In addition, different concentrations of D2O had a certain degree of influence on the growth of Escherichia coli ATCC 25922 when the D2O incubation time was extended, suggesting that there are limitations to the culture time for this research. As shown in Figure 2B, the CD-ratio increased as the incubation time in 30% D2O increased within the first 4 hours. Thus, 30% D2O was selected as the optimal concentration for subsequent bacterial experiments in this study. The specific D2O incubation time, combined with antibiotic pretreatment time, requires further testing on both susceptible and resistant strains.
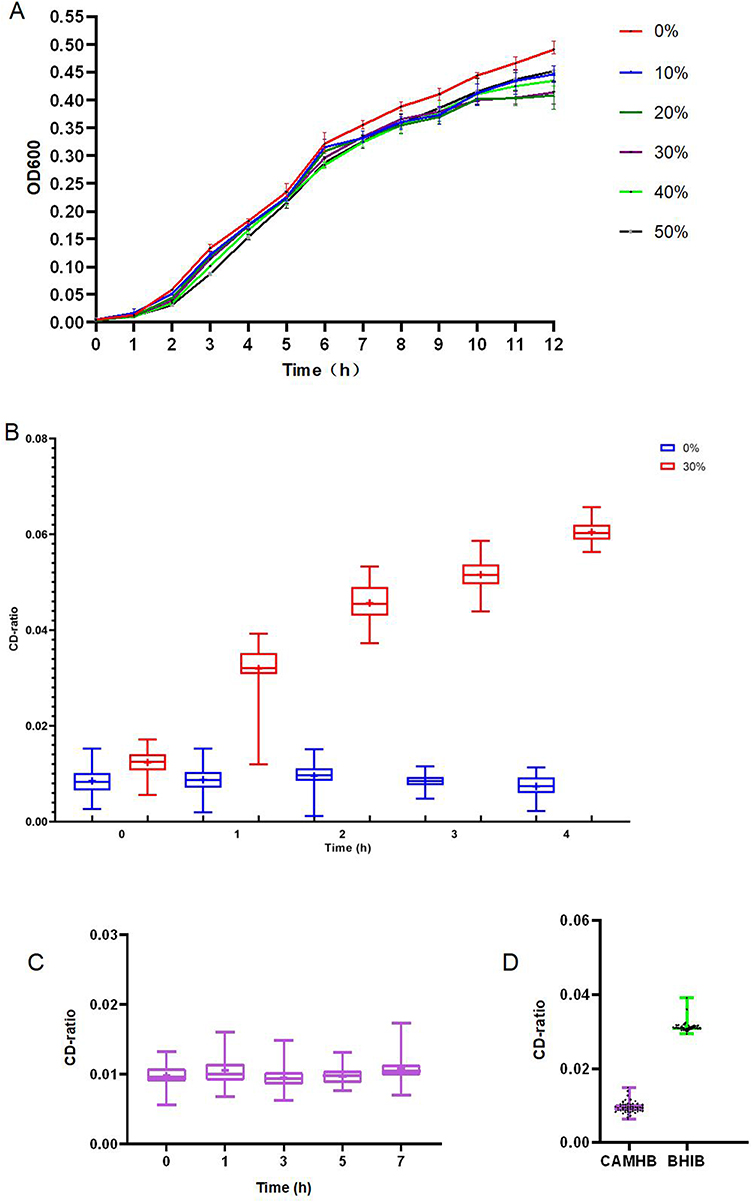 |
Figure 2 Deuterium labeling in the Raman-based AST method. (A) Growth curve of E. coli ATCC 25922 with and without deuterium. (B) CD-ratio of E. coli ATCC 25922 incubated in medium containing 0% (blue boxes) and medium containing 30% D2O(red boxes) for 4 h. (C) CD-ratio of ATCC 29212 incubated in cation-adjusted MHB medium (CAMHB) for 7 h. (D) CD-ratio of ATCC 29212 incubated in CAMHB and brain heart infusion (BHI) broth, respectively. |
The growth pattern of Enterococcus was studied separately as there was no detectable deuterium signal when Enterococcus faecalis ATCC 29212 was incubated in CAMHB, with a mean CD-ratio under 0.02, which was similar to the 0% D2O group of Escherichia coli ATCC 25922 (Figure 2C). BHI broth is a nutritional medium for microorganism enrichment. We found that Enterococcus faecalis incubated in BHI broth could absorb D2O and exhibit a detectable C-D peak. The CD-ratio of Enterococcus faecalis ATCC 29212 cultured in BHI broth showed a significant increase compared with that of the CAMHB culture (Figure 2D).
Establishment of a Protocol for Raman-Based AST
Based on the results regarding factors affecting deuterium incorporation, four experimental schemes were designed with different preincubation times and D2O incubation times to optimize the Raman-based AST protocol. A tigecycline concentration of 0.5 mg/L was used for the Raman-based AST to identify tigecycline-resistant strains of Escherichia coli according to the EUCAST Clinical Breakpoint Table v.12.0. Antibiotics were added 1 or 2 hours prior to the addition of D2O to establish an optimal protocol for Raman-based AST. This preincubation step was performed to allow the antibiotics to work before the addition of D2O, thereby helping distinguish the antibiotic-resistant and antibiotic-susceptible strains.
As shown in Figure 3A, when the deuterium incubation time was increased, Escherichia coli absorbed more deuterium and showed a higher CD-ratio if the metabolism activity was not inhibited after preincubation. The CD-ratio violin plot and the receiver operating characteristic (ROC) curves (Figure 3B–E) demonstrated that scheme D, with deuterium incubation for 3 hours after preincubation for 1 hour, was most effective for distinguishing between bacteria with different phenotypes. The susceptible groups exhibited a limited increase in CD-ratio when the deuterium incubation time was prolonged because the bacteria inside were metabolic-inhibited. Considering the time cost and possible variations of clinical strains, scheme D (area under the ROC curve (AUC) = 1) was selected as the optimized protocol. The experimental procedure is described in Figure 4A.
 |
Figure 3 Raman testing on four different preincubation-incubation time combinations with Escherichia coli. (A) CD-ratio comparison of tigecycline-susceptible strain (ATCC 25922) and tigecycline-resistant strain (R4) incubated with 0.5 mg/L tigecycline using different preincubation-incubation combinations. Incubation methods A, B, and D were preincubation for 1 h, followed by D2O incubation for 1, 2, and 3 h, respectively. Incubation method C consisted of preincubation for 2 h followed by D2O incubation for 2 h. (B–E) ROC curves of schemes A–D, respectively. |
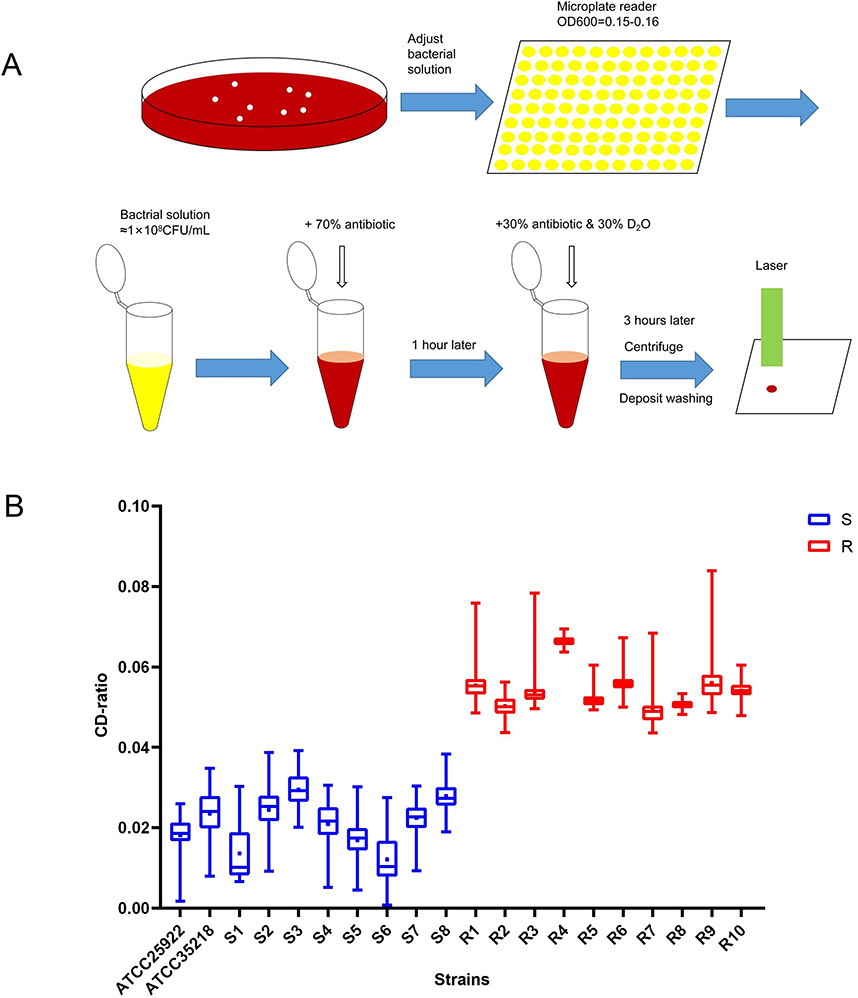 |
Figure 4 Establishment of a Raman-based antimicrobial susceptibility testing (AST) method. (A) Workflow of the Raman-based AST. (B) CD-ratio of 20 strains of Escherichia coli. Blue boxes indicate strains identified as susceptible, and the red boxes indicate otherwise. |
Using scheme D, we treated 12 strains of Escherichia coli and 6 strains of Enterococcus faecium with antibiotics at a concentration of at least 10×MIC. After incubation, Raman spectra of the samples were collected and an upper limit of 99% reference interval and 90% confidence intervals (CI) of CD-ratio were calculated. A cutoff value of 0.030 (90% CI: 0.0159–0.0199) was set for fast-growing bacteria like Escherichia coli, K. pneumoniae, and P. aeruginosa, while slow-growing bacteria like Enterococcus faecium were assigned a cutoff value of 0.016 (90% CI: 0.009–0.011).
R-MIC Measurement on Five Sets of Samples
A total of 92 pathogen-antibiotic combinations were examined, including 3 reference strains (ATCC 25922, ATCC 35218, ATCC 27853), 3 laboratory-induced drug-resistant strains (Kp-InR48, Kp-InR37, and Pa-InR389), and 80 clinically isolated strains, with 6 of them used in the K. pneumoniae-Tigecycline group and the K. pneumoniae-Polymyxin B group. The values of MIC and R-MIC across all 92 combinations showed a high correlation, with a Spearman’s rank correlation coefficient of 0.96 (P < 0.0001).
CD-ratio results for some strains of Escherichia coli under 0.5 mg/L tigecycline are shown in Figure 4B. Generally, resistant strains absorbed more D2O and had higher CD-ratio values, whereas the susceptible strains showed CD-ratio values below the cutoff value, indicating the susceptible strains were metabolically inhibited. The R-MIC determination of these 20 strains towards tigecycline is shown in Table 2. With increasing concentrations of tigecycline, the CD-ratio values exhibited a downward trend, and the minimum concentration where the CD-ratio was ≤ 0.030 was determined as the R-MIC (bold black frame in Table 2).
 |
Table 2 CD-Ratios of the 20 E. coli Strains Under Different Concentrations of Tigecycline |
As illustrated in Figure 5, the CD-ratios of the tested bacteria varied with increasing concentrations of antibiotics. Using the previously determined cutoff value, the R-MICs of the tested Escherichia coli, K. pneumoniae, P. aeruginosa, and Enterococcus faecium were estimated to be 8, 0.25, 1, and 0.5 mg/L, respectively.
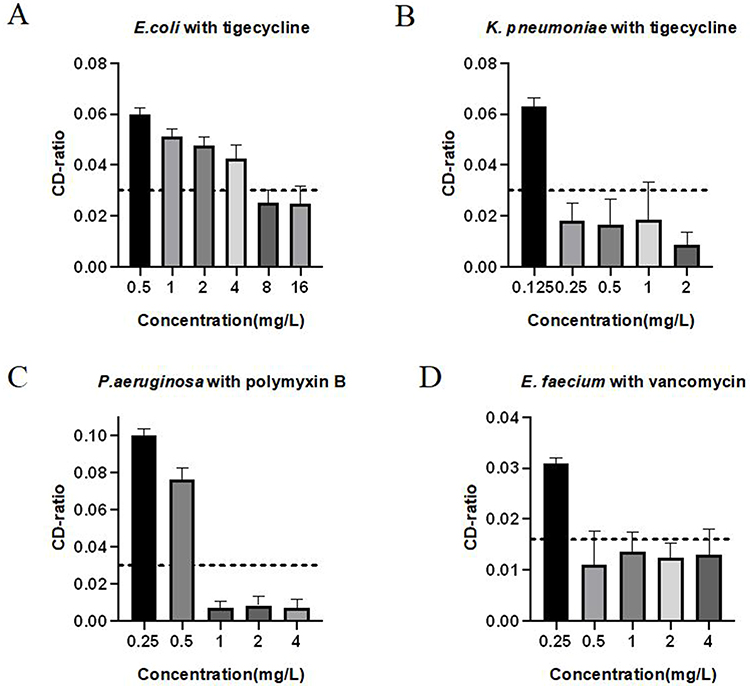 |
Figure 5 R-MIC determination from Raman-based AST method. (A) CD-ratio of Escherichia coli Ec764 treated with different concentrations of tigecycline. (B) CD-ratio of K. pneumoniae Kp302 treated with different concentrations of tigecycline. (C) CD-ratio of P. aeruginosa Pa555 treated with different concentrations of polymyxin B. (D) CD-ratio of Enterococcus faecium Ef11 treated with different concentrations of vancomycin. Dotted lines represent the cutoff values (upper limit of 99% reference interval). |
Overall, the consistency between MIC and R-MIC measurements was 68.5% (63/92), with 100% (92/92) EA and 100% CA. No VME or ME were observed. The results met the FDA requirement.21 The P. aeruginosa-Polymyxin B group had the highest consistency of 85.7% (12/14), followed by the K. pneumoniae-Tigecycline group with 83.3% (10/12) consistency, and the Enterococcus faecium-Vancomycin group with 80% (12/15) consistency. The K. pneumoniae-Polymyxin B group had the lowest consistency with 30.7%. The agreement between MIC and R-MIC is summarized in Tables 3–8 show the agreement of R-MIC and MIC for each of the five sets of pathogen-antibiotic combinations. All of the results fell within the grey shading, yielding high EA. The categorical results were calculated in Table 9 and 10 based on the referenced breakpoints.
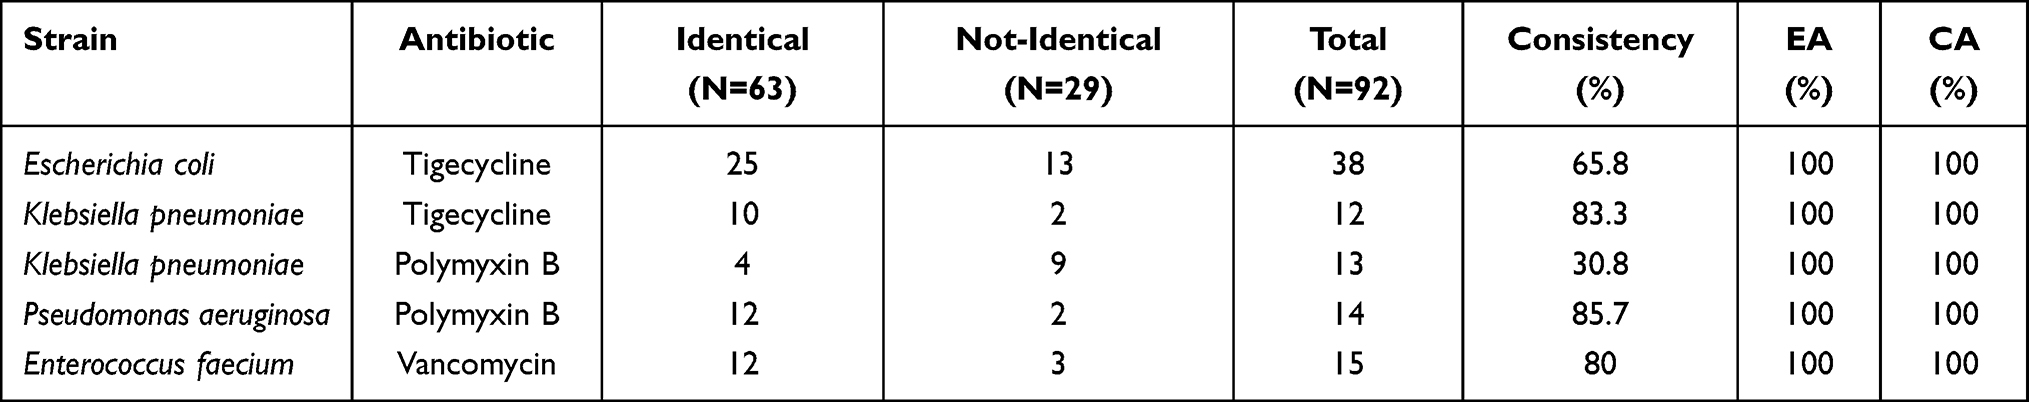 |
Table 3 Statistics for the Consistency of MIC and R-MIC |
 |
Table 4 Agreement of MIC and R-MIC of the Escherichia coli-Tigecycline Group |
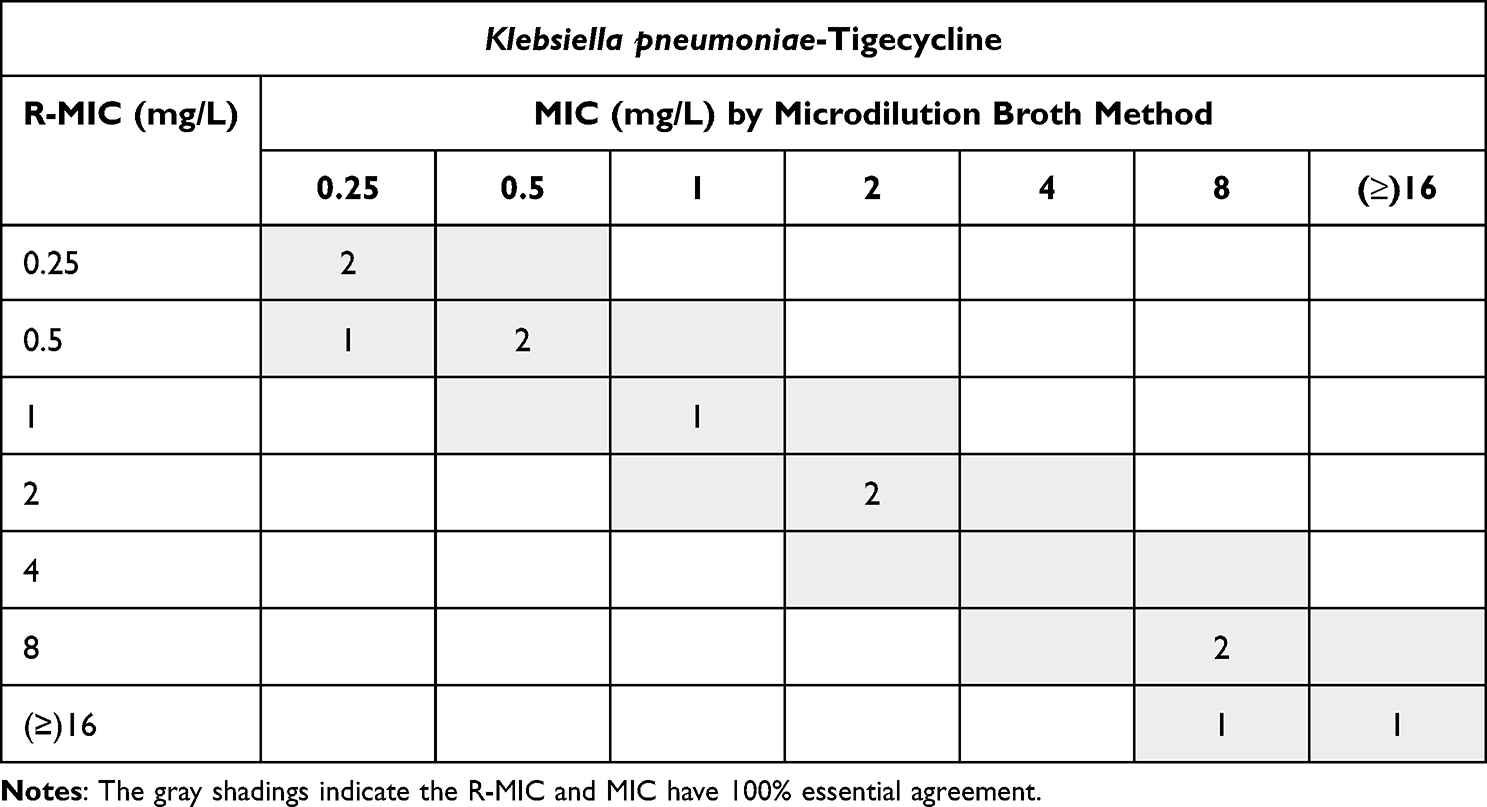 |
Table 5 Agreement of MIC and R-MIC of the Klebsiella pneumoniae-Tigecycline Group |
 |
Table 6 Agreement of MIC and R-MIC of the Klebsiella pneumoniae-Polymyxin B Group |
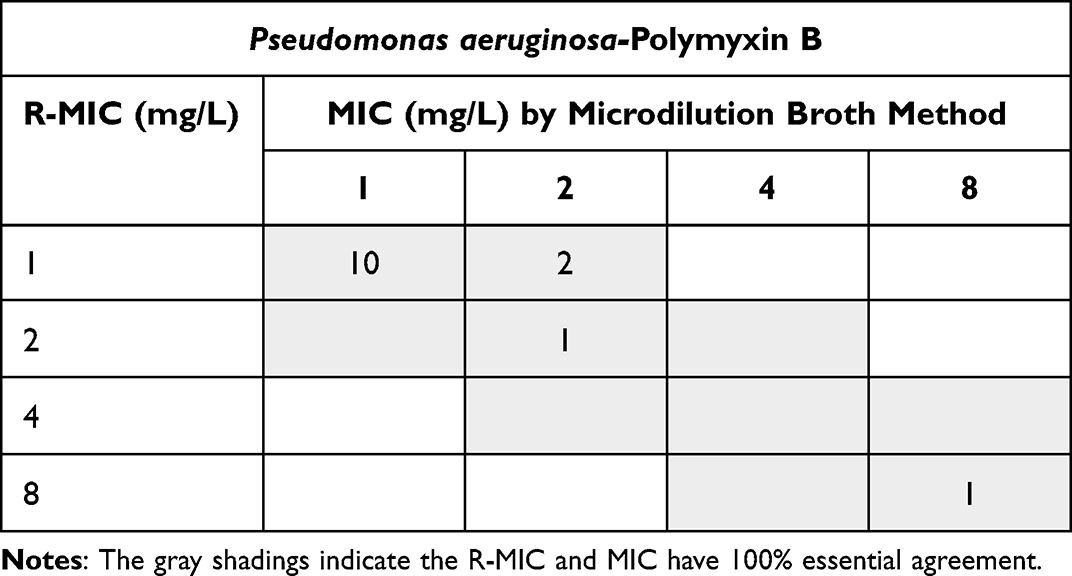 |
Table 7 Agreement of MIC and R-MIC of the Pseudomonas aeruginosa-Polymyxin B Group |
 |
Table 8 Agreement of MIC and R-MIC of the Enterococcus faecium-Vancomycin Group |
 |
Table 9 Comparison of Susceptibility Test Results of Tigecycline and Vancomycin Groups |
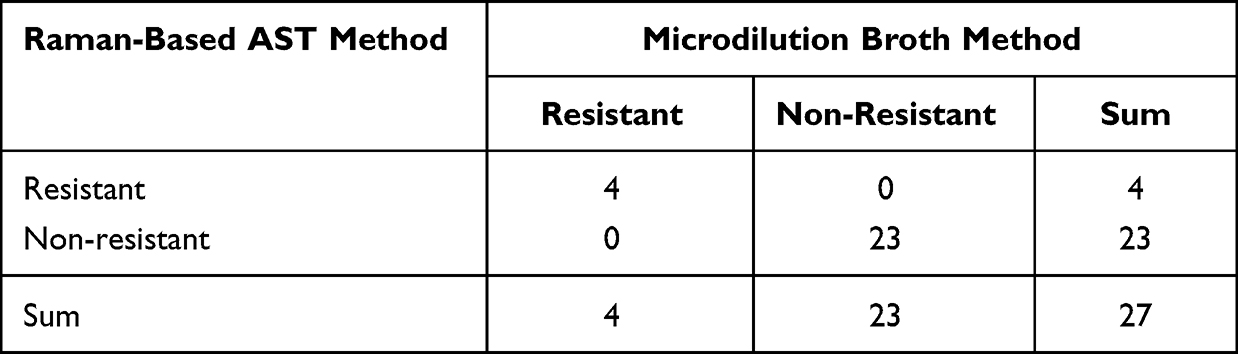 |
Table 10 Comparison of Susceptibility Test Results of the Polymyxin B Group |
Discussion
The emergence of strains that are resistant to last-resort antibiotics is a major global concern in healthcare.25–28 These resistant strains often carry genes that can be transferred between different species, leading to large-scale outbreaks and increased prevalence of antibiotic resistance.29 It is critical to identify this type of resistant strain from the outset when treating a clinical infection. In this study, we investigated the characteristics of deuterium incorporation and developed a rapid and accurate approach to identify the antibiotic susceptibility of bacterial strains. Our Raman-based AST method yielded results in just 5 hours (incubation for 4 hours and 1 hour of sediment washing and spectrum collection). Importantly, the method showed 100% CA with traditional AST, but was significantly faster, reducing the time needed by 79.2%. Furthermore, there is potential to apply this Raman-based AST directly to clinical specimens, such as urine or blood.19 In comparison, traditional AST is limited in its ability to identify persistent30 or heteroresistant31 cells.
Despite the widespread attention and applications of Raman-based detection methods, particularly in combination with deuterium labeling, antibiotics of last resort have not been thoroughly investigated, mainly owing to limitations in access to resistant strains. However, the isolation of strains that are resistant to these antibiotics, and even pandrug-resistant bacteria, is increasing globally.32 The selection of tigecycline, polymyxin B, and vancomycin in this study was based on several factors. First, these antibiotics have different mechanisms of action. Second, resistance to these antibiotics is increasing in drug resistance surveillance. Finally, it is critical to promptly detect pathogens that are non-susceptible to these drugs in clinical practice. This study included 29 strains resistant to tigecycline, polymyxin B, or vancomycin, supplementing the current vacancy of the establishment of the Raman-based AST method, especially for tigecycline. The study encompassed not only clinically isolated strains, but also tigecycline-resistant K. pneumoniae, polymyxin B-resistant K. pneumoniae, and polymyxin B-resistant P. aeruginosa strains that were induced in the laboratory.
Two different culture media were employed in this study, namely CAMHB and BHI broth, with CAMHB being recommended by CLSI for AST. However, owing to the slow growth and metabolism-dependent characteristics of Enterococcus strains, deuterium incorporation was inadequate in this medium. Consequently, BHI broth was employed for Enterococcus strains and although these strains absorbed less D2O than other strains included in this study, a detectable C-D vibrational band was still evident in the Raman spectra. There are no published studies comparing the impact of different culture media, such as CAMHB and BHI broth, on Raman spectra, but previous research has shown that the growth medium and growth phase can affect Raman spectra when analyzed by machine learning.33 The D2O-labeling technology enables us to focus on the C-D and C-H bands, and the calculation of CD-ratio using RStudio provides a simple means to quantify the incorporation of deuterium. Moreover, given that the growth patterns of microorganisms may differ between CAMHB and BHI broth, we separated the groups according to the culture medium used and established different cutoff values. Our findings indicate that BHI broth could be considered for other slow-growing microorganisms in future Raman research, although the relative metabolic results may not be directly comparable when culture media vary.
Our Raman-based method yielded R-MICs that exhibited only 68.5% (63/92) consistency compared with traditional MICs. However, the traditional method relies on growth, whereas the Raman-based AST method is metabolism-dependent; therefore, it is reasonable to expect some variability between the two methods. In our study, the R-MICs achieved 100% CA without any ME or VME, indicating that there were no false-susceptible or false-resistant results and every result was categorized accurately.34
The consistency of R-MIC results for different pathogen-antibacterial combinations varied when compared with the MIC results obtained by the microdilution broth method. The combinations of P. aeruginosa-polymyxin B, K. pneumoniae-tigecycline, and Enterococcus faecium-vancomycin exhibited higher consistency between R-MIC and MIC results, whereas the consistency was lower in the Escherichia coli-tigecycline and K. pneumoniae-polymyxin B combinations. In the Escherichia coli-tigecycline group, there was no significant trend in the difference between R-MIC and MIC, but in the K. pneumoniae-polymyxin B combination, the R-MIC was one gradient concentration lower than the MIC. Two discordant results were observed in the P. aeruginosa-polymyxin B combination, where the R-MIC was also one gradient concentration smaller than the MIC. This difference may be attributed to the mechanism of action of polymyxin B, which binds to lipopolysaccharide (LPS), disrupting the integrity of the bacterial outer membrane, increasing permeability, and causing cell rupture. Such a mechanism may significantly impact microorganism metabolism in a short period, causing a significant decrease in R-MIC compared to MIC. Moreover, most of the collected strains had MICs of 1 mg/L, which could also contribute to the discordance observed in the polymyxin B group.
Although the Raman-based AST method proposed in this paper shows potential, there are several limitations to our study. First, the number of included antibiotics was limited, and it is not known whether this method can be applied to other commonly used antibiotics in clinical practice. Second, the selected research strains were limited to Escherichia coli, K. pneumoniae, P. aeruginosa, and Enterococcus faecium, and several other common clinical pathogens, such as Acinetobacter baumannii, Enterococcus faecalis, and Staphylococcus aureus, were not included in this research. Third, the distribution of MIC values of the collected strains was not dispersed. For example, in the Enterococcus faecium-vancomycin group, the MIC values of strains of Enterococcus faecium were distributed in four concentrations (0.5, 1, 2, and ≥ 64 mg/L), and strains with other MIC values were missing. Future in-depth studies should include more strains and collect data to address these limitations.
Conclusion
The Raman-based AST method described in this study shows great potential in meeting the current need for rapid AST in clinical settings. Among the pathogen-antibiotic sets studied, this method demonstrated a high ability to examine the antimicrobial susceptibility within 5 hours. Moreover, the EA between MIC and R-MIC was 100%. However, further clinical investigations are required to validate and popularize this new method.
Ethics Statement
The procedure was approved by the Ethics Committee of Zhujiang Hospital of Southern Medical University (No. 2021-KY-046-01). The study focused on previously isolated bacteria and did not involve direct contact with patients or personal information. Therefore, the informed consent was waived.
Author Contributions
All authors made a significant contribution to the work reported, whether that was in the conception, study design, execution, acquisition of data, analysis and interpretation, or in all these areas; took part in drafting, revising or critically reviewing the article; gave final approval of the version to be published; agreed on the journal to which the article has been submitted; and agree to be accountable for all aspects of the work.
Funding
This work was supported by grants from the National Natural Science Foundation of China (No. 81974318), China Primary Health Care Foundation (No. MTP2022D027), Guangzhou Municipal Science and Technology Bureau (No. 202102010233), Guangdong Zhong Nanshan Medical Foundation (No. 20220015), and the Research Foundation of Shenzhen Hospital of Southern Medical University (No. PY2020YM02 and ZDXKKYTS007).
Disclosure
The authors report no conflicts of interest in this work.
References
1. Ferri M, Ranucci E, Romagnoli P, Giaccone V. Antimicrobial resistance: a global emerging threat to public health systems. Crit Rev Food Sci Nutr. 2017;57(13):2857–2876. doi:10.1080/10408398.2015.1077192
2. WHO publishes list of bacteria for which new antibiotics are urgently needed. Available from: https://www.who.int/news/item/27-02-2017-who-publishes-list-of-bacteria-for-which-new-antibiotics-are-urgently-needed.
3. Ezadi F, Ardebili A, Mirnejad R, Kraft CS. Antimicrobial susceptibility testing for polymyxins: challenges, issues, and recommendations. J Clin Microbiol. 2019;57(4):e01390–e01418. doi:10.1128/JCM.01390-18
4. Seifert H, Blondeau J, Dowzicky MJ. In vitro activity of tigecycline and comparators (2014–2016) among key WHO “priority pathogens” and longitudinal assessment (2004–2016) of antimicrobial resistance: a report from the T.E.S.T. study. Int J Antimicrob Agents. 2018;52(4):474–484. doi:10.1016/j.ijantimicag.2018.07.003
5. Jovetic S, Zhu Y, Marcone GL, Marinelli F, Tramper J. β-lactam and glycopeptide antibiotics: first and last line of defense? Trends Biotechnol. 2010;28(12):596–604. doi:10.1016/j.tibtech.2010.09.004
6. Li H, Zhou M, Chen X, et al. Comparative evaluation of seven tigecycline susceptibility testing methods for carbapenem-resistant Enterobacteriaceae. Infect Drug Resist. 2021;14:1511–1516. doi:10.2147/IDR.S289499
7. Chew KL, La MV, Lin RTP, Teo JWP. Colistin and polymyxin B susceptibility testing for carbapenem-resistant and mcr-positive Enterobacteriaceae: comparison of sensititre, MicroScan, Vitek 2, and Etest with broth microdilution. J Clin Microbiol. 2017;55(9):2609–2616. doi:10.1128/JCM.00268-17
8. Bortolaia V, Kaas RS, Ruppe E, et al. ResFinder 4.0 for predictions of phenotypes from genotypes. J Antimicrob Chemother. 2020;75(12):3491–3500. doi:10.1093/jac/dkaa345
9. Wong H, Louie L, Lo RYC, Simor AE. Characterization of Staphylococcus aureus isolates with a partial or complete absence of staphylococcal cassette chromosome elements. J Clin Microbiol. 2010;48(10):3525–3531. doi:10.1128/JCM.00775-10
10. Cerqueira GC, Earl AM, Ernst CM, et al. Multi-institute analysis of carbapenem resistance reveals remarkable diversity, unexplained mechanisms, and limited clonal outbreaks. Proc Natl Acad Sci U S A. 2017;114(5):1135–1140. doi:10.1073/pnas.1616248114
11. Kloss S, Kampe B, Sachse S, et al. Culture independent Raman spectroscopic identification of urinary tract infection pathogens: a proof of principle study. Anal Chem. 2013;85(20):9610–9616. doi:10.1021/ac401806f
12. Ho CS, Jean N, Hogan CA, et al. Rapid identification of pathogenic bacteria using Raman spectroscopy and deep learning. Nat Commun. 2019;10(1):4927. doi:10.1038/s41467-019-12898-9
13. Kanno N, Kato S, Ohkuma M, Matsui M, Iwasaki W, Shigeto S. Machine learning-assisted single-cell Raman fingerprinting for in situ and nondestructive classification of prokaryotes. iScience. 2021;24(9):102975. doi:10.1016/j.isci.2021.102975
14. Dina NE, Gherman AMR, Colniță A, Marconi D, Sârbu C. Fuzzy characterization and classification of bacteria species detected at single-cell level by surface-enhanced Raman scattering. Spectrochim Acta A Mol Biomol Spectrosc. 2021;247:119149. doi:10.1016/j.saa.2020.119149
15. Pistiki A, Ramoji A, Ryabchykov O, et al. Biochemical analysis of leukocytes after in vitro and in vivo activation with bacterial and fungal pathogens using Raman spectroscopy. Int J Mol Sci. 2021;22(19):10481. doi:10.3390/ijms221910481
16. Peng MW, Wei XY, Yu Q, Yan P, Chen YP, Guo JS. Identification of ceftazidime interaction with bacteria in wastewater treatment by Raman spectroscopic mapping. RSC Adv. 2019;9(56):32744–32752. doi:10.1039/C9RA06006E
17. Wang Y, Song Y, Tao Y, et al. Reverse and multiple stable isotope probing to study bacterial metabolism and interactions at the single cell level. Anal Chem. 2016;88(19):9443–9450. doi:10.1021/acs.analchem.6b01602
18. Azemtsop Matanfack G, Taubert M, Guo S, et al. Monitoring deuterium uptake in single bacterial cells via two-dimensional Raman correlation spectroscopy. Anal Chem. 2021;93(21):7714–7723. doi:10.1021/acs.analchem.1c01076
19. Berry D, Mader E, Lee TK, et al. Tracking heavy water (D2O) incorporation for identifying and sorting active microbial cells. Proc Natl Acad Sci U S A. 2015;112(2):E194–E203. doi:10.1073/pnas.1420406112
20. Tao Y, Wang Y, Huang S, et al. Metabolic-activity-based assessment of antimicrobial effects by D2O-labeled single-cell Raman microspectroscopy. Anal Chem. 2017;89(7):4108–4115. doi:10.1021/acs.analchem.6b05051
21. Zhang M, Hong W, Abutaleb NS, et al. Rapid determination of antimicrobial susceptibility by stimulated Raman scattering imaging of D2O metabolic incorporation in a single bacterium. Adv Sci. 2020;7(19):e2001452. doi:10.1002/advs.202001452
22. Yi X, Song Y, Xu X, et al. Development of a fast Raman-assisted antibiotic susceptibility test (FRAST) for the antibiotic resistance analysis of clinical urine and blood samples. Anal Chem. 2021;93(12):5098–5106. doi:10.1021/acs.analchem.0c04709
23. Li J, Rayner CR, Nation RL, et al. Heteroresistance to colistin in multidrug-resistant Acinetobacter baumannii. Antimicrob Agents Chemother. 2006;50(9):2946–2950. doi:10.1128/AAC.00103-06
24. Jandova J, Hua AB, Fimbres J, Wondrak GT. Deuterium oxide (D2O) induces early stress response gene expression and impairs growth and metastasis of experimental malignant melanoma. Cancers. 2021;13(4):605. doi:10.3390/cancers13040605
25. Srinivas P, Rivard K. Polymyxin resistance in gram-negative pathogens. Curr Infect Dis Rep. 2017;19(11):38. doi:10.1007/s11908-017-0596-3
26. He T, Wang R, Liu D, et al. Emergence of plasmid-mediated high-level tigecycline resistance genes in animals and humans. Nat Microbiol. 2019;4(9):1450–1456. doi:10.1038/s41564-019-0445-2
27. Hammerum AM, Justesen US, Pinholt M, et al. Surveillance of vancomycin-resistant enterococci reveals shift in dominating clones and national spread of a vancomycin-variable vanA Enterococcus faecium ST1421-CT1134 clone, Denmark, 2015 to March 2019. Euro Surveill. 2019;24(34):1900503. doi:10.2807/1560-7917.ES.2019.24.34.1900503
28. Wassilew N, Seth-Smith HM, Rolli E, et al. Outbreak of vancomycin-resistant Enterococcus faecium clone ST796, Switzerland, December 2017 to April 2018. Euro Surveill. 2018;23(29):1800351. doi:10.2807/1560-7917.ES.2018.23.29.1800351
29. Bonten MJ, Willems R, Weinstein RA. Vancomycin-resistant enterococci: why are they here, and where do they come from? Lancet Infect Dis. 2001;1(5):314–325. doi:10.1016/S1473-3099(01)00145-1
30. Fisher RA, Gollan B, Helaine S. Persistent bacterial infections and persister cells. Nature Rev Microbiol. 2017;15(8):453–464. doi:10.1038/nrmicro.2017.42
31. Dewachter L, Fauvart M, Michiels J. Bacterial heterogeneity and antibiotic survival: understanding and combatting persistence and heteroresistance. Mol Cell. 2019;76(2):255–267. doi:10.1016/j.molcel.2019.09.028
32. Karakonstantis S, Kritsotakis EI, Gikas A. Pandrug-resistant gram-negative bacteria: a systematic review of current epidemiology, prognosis and treatment options. J Antimicrob Chemother. 2020;75(2):271–282. doi:10.1093/jac/dkz401
33. Hanson C, Bishop MM, Barney JT, Vargis E. Effect of growth media and phase on Raman spectra and discrimination of mycobacteria. J Biophotonics. 2019;12(11). doi:10.1002/jbio.201900150
34. Babaei S, Haeili M. Evaluating the performance characteristics of different antimicrobial susceptibility testing methodologies for testing susceptibility of gram-negative bacteria to tigecycline. BMC Infect Dis. 2021;21(1):709. doi:10.1186/s12879-021-06338-7
 © 2023 The Author(s). This work is published and licensed by Dove Medical Press Limited. The
full terms of this license are available at https://www.dovepress.com/terms
and incorporate the Creative Commons Attribution
- Non Commercial (unported, 3.0) License.
By accessing the work you hereby accept the Terms. Non-commercial uses of the work are permitted
without any further permission from Dove Medical Press Limited, provided the work is properly
attributed. For permission for commercial use of this work, please see paragraphs 4.2 and 5 of our Terms.
© 2023 The Author(s). This work is published and licensed by Dove Medical Press Limited. The
full terms of this license are available at https://www.dovepress.com/terms
and incorporate the Creative Commons Attribution
- Non Commercial (unported, 3.0) License.
By accessing the work you hereby accept the Terms. Non-commercial uses of the work are permitted
without any further permission from Dove Medical Press Limited, provided the work is properly
attributed. For permission for commercial use of this work, please see paragraphs 4.2 and 5 of our Terms.