Back to Journals » Breast Cancer: Targets and Therapy » Volume 15
Radiomics Analysis of Breast Lesions in Combination with Coronal Plane of ABVS and Strain Elastography
Authors Ma Q ![]() , Shen C, Gao Y, Duan Y, Li W, Lu G, Qin X, Zhang C, Wang J
, Shen C, Gao Y, Duan Y, Li W, Lu G, Qin X, Zhang C, Wang J
Received 15 March 2023
Accepted for publication 23 May 2023
Published 26 May 2023 Volume 2023:15 Pages 381—390
DOI https://doi.org/10.2147/BCTT.S410356
Checked for plagiarism Yes
Review by Single anonymous peer review
Peer reviewer comments 2
Editor who approved publication: Professor Pranela Rameshwar
Qianqing Ma,1,* Chunyun Shen,2,* Yankun Gao,3,* Yayang Duan,1 Wanyan Li,4 Gensheng Lu,5 Xiachuan Qin,1 Chaoxue Zhang,1 Junli Wang2
1Department of Ultrasound, the First Affiliated Hospital of Anhui Medical University, Hefei, People’s Republic of China; 2Department of Ultrasound, Wuhu No. 2 People’s Hospital, Wuhu, People’s Republic of China; 3Department of Radiology, the First Affiliated Hospital of Anhui Medical University, Hefei, People’s Republic of China; 4Department of Ultrasound, Linquan Country People’s Hospital, Fuyang, People’s Republic of China; 5Department of Pathology, Wuhu No. 2 People’s Hospital, Wuhu, People’s Republic of China
*These authors contributed equally to this work
Correspondence: Junli Wang, Department of Ultrasound, Wuhu No. 2 People’s Hospital, No. 259 Jiuhuashan Road, Jinghu District, Wuhu, Anhui, 241001, People’s Republic of China, Tel +86 18055317022, Email [email protected] Chaoxue Zhang, Department of Ultrasound, the First Affiliated Hospital of Anhui Medical University, No. 218 Jixi Road, Shushan District, Hefei, Anhui, 230022, People’s Republic of China, Tel +86 13955158023, Email [email protected]
Background: Breast cancer is the most common tumor globally. Automated Breast Volume Scanner (ABVS) and strain elastography (SE) can provide more useful breast information. The use of radiomics combined with ABVS and SE images to predict breast cancer has become a new focus. Therefore, this study developed and validated a radiomics analysis of breast lesions in combination with coronal plane of ABVS and SE to improve the differential diagnosis of benign and malignant breast diseases.
Patients and Methods: 620 pathologically confirmed breast lesions from January 2017 to August 2021 were retrospectively analyzed and randomly divided into a training set (n=434) and a validation set (n=186). Radiomic features of the lesions were extracted from ABVS, B-ultrasound, and strain elastography (SE) images, respectively. These were then filtered by Gradient Boosted Decision Tree (GBDT) and multiple logistic regression. The ABVS model is based on coronal plane features for the breast, B+SE model is based on features of B-ultrasound and SE, and the multimodal model is based on features of three examinations. The evaluation of the predicted performance of the three models used the receiver operating characteristic (ROC) and decision curve analysis (DCA).
Results: The area under the curve, accuracy, specificity, and sensitivity of the multimodal model in the training set are 0.975 (95% CI:0.959– 0.991),93.78%, 92.02%, and 96.49%, respectively, and 0.946 (95% CI:0.913 − 0.978), 87.63%, 83.93%, and 93.24% in the validation set, respectively. The multimodal model outperformed the ABVS model and B+SE model in both the training (P < 0.001, P = 0.002, respectively) and validation sets (P < 0.001, P = 0.034, respectively).
Conclusion: Radiomics from the coronal plane of the breast lesion provide valuable information for identification. A multimodal model combination with radiomics from ABVS, B-ultrasound, and SE could improve the diagnostic efficacy of breast masses.
Keywords: radiomics, automated breast volume scanner, strain elastography, ultrasound, breast cancer
Plain Language Summary
A multimodal model combining Automated Breast Volume Scanner, B-ultrasound and strain elastography radiomics features, which showed excellent accuracy in identifying benign and malignant breast. The radiomics features from coronal plane images of the lesions are valuable for the diagnosis.
Introduction
In 2020, female breast cancer has overtaken lung cancer as the most common malignancy.1 Approximately 1.7 million new cases of breast cancer and 522,000 breast cancer-related deaths were reported each year,2 highlighting the need for accurate identification of breast cancer.
B-ultrasound is the most common methods to investigate breast lesions.3 Microcalcifications, orientation, margin, shape and echogenicity are evaluated to predict malignancy in clinical practice. However, while this method offers high sensitivity,4 it has poor specificity in characterization.5 Strain elastography (SE), a method of ultrasound assessing the stiffness or elasticity of the lesions, has been widely used for breast lesions diagnosis.6 This technique can substantially improve detection specificity without compromising sensitivity,7 thus making a significant contribution to breast cancer screening.8,9 Nevertheless, the modalities mentioned above are prone to degrees of subjectivity and considerable inter-operator discordance, making them susceptible to diagnosis misinterpretations.
Radiomics, a quantitative method that has the potential to improve the objectivity of image representation by highlighting graphic features invisible to human eye, has been extensively used in ultrasound images of breast cancer.10–15 For years, researchers around the world have used radiomics to help clinicians diagnose breast cancer. Romeo et al11 found that ultrasound-based radiomics was useful as an imaging biomarker to predict breast masses. Youk et al12 reported radiomics based on gray scale ultrasound, along with elastography could potentially enhanced the identification of breast lesions. Yet, these radiomics models were based solely on the anteroposterior orientation of the lesion. It was reported that the coronal plane of the breast could better demonstrate the overall anatomy of the breast, especially the ductal system.;16,17 this plane could provide more high-value information to diagnose benign or malignant lesions. The Automated Breast Volume Scanner (ABVS) is a new ultrasound technique that performs normalized sequential scans of the breast and reconstructs coronal images. Such standardized acquisition of images is well-suited for radiomics analysis.18
Therefore, the purpose of this study was to develop an ABVS model (coronal images of breast lesions), B+SE model [combine B-ultrasound and strain elastography (SE) images] and multimodal model (combining B-ultrasound, SE and ABVS images) to compare and verify its performance for predicting malignancy of breast masses and to assess the value of coronal images for the diagnosis of lesions.
Materials and Methods
This study was approved by the Institutional Review Boards of the First Affiliated Hospital of Anhui Medical University (2023136) and the Wuhu No. 2 People’s Hospital (2022 No.5) thus meets the standards of the Declaration of Helsinki. The Committee waived the requirement for informed consent as the study was retrospective in nature. The patients’ personal information was strictly protected.
Patients
The database of the Wuhu No. 2 People’s Hospital was searched between January 2017 and July 2021, and 4701 female patients with postoperative pathologically confirmed breast lesions were reviewed. According to the following criteria, the patients and lesions to be studied were further screened. Inclusion criteria were as follows: 1) Biopsy or surgical pathology results are obtained for the target lesion within 2 weeks of the ultrasound examination. 2) Complete ultrasound images of the target lesion are available, including B-ultrasound, SE and ABVS. 3) The analysis of patients with multifocal lesions was done by selecting only one of the largest lesions with clear pathological findings. Exclusion criteria were as follows: 1) uncertain pathological findings in the biopsy or surgical specimens, 2) patients underwent neoadjuvant chemotherapy or invasive therapy for breast cancers (biopsy, radiotherapy), 3) the images were not suitable for radiomics analysis due to artifacts, 4) cystic lesions.
Image Acquisition for Three Inspection Methods
B-ultrasound, SE and ABVS examinations were performed with a ACUSON S2000 Automated Breast Volume Scanner (ABVS; Siemens Medical Solutions, Mountain View, CA). The ABVS is equipped with a 15 cm wide linear array transducer (5–14 MHz) and an 18L6HD linear array transducer (5.5–18 MHz). The B-ultrasound scanning is conducted first, and then the SE image for the target lesion and adjacent normal parenchyma is acquired, with the operator applying the lowest possible pressure to the scan during the acquisition, to reduce artefacts. The elastography image reflects the tissue elasticity in the region of interest, with different colors from red to green to blue representing increasing stiffness. Following an ABVS scan, the data is sent to an ABVS workstation where it’s used to generate a 3D reconstruction of the breast and to produce a coronal image. Of all the coronal images reconstructed, we selected one image featuring the largest diameter of the lesion for further analysis. The technician performing the ABVS inspection has at least five years of experience in ABVS operational inspections. Images of B-ultrasound, SE were acquired by 4 sonographers (with 7 to 15 years of experience).
Imaging Analyses, Segmentation
Using the Deepwise study platform, sonographer 1 (10 years of experience) with no knowledge of pathology findings, manually defined the region of interest (ROI) for the entire lesion. ABVS and B-ultrasound images ROIs were outlined along the edges of the breast lesion and did not include the surrounding area of the lesion. SE images were divided into two sections; the left is the B-ultrasound while the right is the elastography. Due to the uncertainty of the lesion border in the elastic image, the ROI of the B-ultrasound image was applied to the corresponding elastic image (Figure 1). We randomly selected images from 200 patients and re-segmented by the sonographer 1 and sonographer 2 (with 12 years of experience) after 2 weeks, in order to calculate the intra-and interclass correlation coefficients (ICCs). The overall workflow of the image analysis is shown in Figure 2. The radiomics features within the lesion ROIs were extracted using the Deepwise Research Platform (based on the Pyradiomics tool 3.6.11).19 In addition to the original image, we also extracted features from the Wavelet, Square, SquareRoot, Logarithm, Exponential, Gradient, LBP (local binary pattern) 2D, LBP3D filter.
 |
Figure 1 Outline of the ROI for the three examinations. (A) ABVS image. (B) B-ultrasound image. (C) SE image (In the SE image, we depict the ROI based on the B-ultrasound image on the left of the image, then copy it to the SE image on the right.). |
 |
Figure 2 The methodology and process we use to build our models. (A) Outlining of areas of interest. (B) Feature extraction and filtering. (C) ABVS model, B+SE model and multimodal model were developed by multivariate logistic regression. (D) Compare and test the effectiveness of the three models. |
Feature Selection, and Radiomics Model Development
GE Healthcare’s IPMs 2.4.0 for data preparation and feature selection was employed. In a proportion of 7:3, sets of data were distributed to training and testing cohorts at random. Prior to analysis, median padding methods were used to replace zero-variance variables, and the data were normalized using z-scores. Delete features with ICC less than 0.75. The univariate correlation analysis was applied to screen features in ABVS, and B-ultrasound + SE. Then, the most useful features are further refined using Gradient Boosting Decision Tree (GBDT)20 and multivariate logistic analysis. Finally, separate radiomics models were developed using multiple logistic regression, respectively. Combining the useful features of ABVS model and B+SE model and then performing logistic regression, it is developed as multimodal model. The three models were validated internally by tenfold cross-validation. With each model, the minimum Akaike Information Criterion (AIC) is selected to determine the best model.
Next, we calculated the area under the curve (AUC), accuracy, sensitivity and specificity to estimate the performance and stability of these models. Analyses of receiver operating characteristic (ROC) curves and decision curve analysis (DCA) were used to evaluate the predictive performance for the training cohort and test cohort. The Delong test was used to evaluate the diagnostic efficacy of the three models. Calibration of the multimodal model was assessed using calibration curves and the Hosmer-Lemeshow test.
Statistical Analyses
Statistical tests were conducted using SPSS version 25.0 and R version 4.1.2. Continuous data were expressed as medians with interquartile range (IQR). Categorical variables are expressed as numbers or percentages. Kolmogorov–Smirnov test was first performed to assess whether data were normally distributed. Differences in age and maximum lesion diameter between the training and validation sets were tested using the Mann–Whitney U-test or Student’s t-test. Accuracy, sensitivity, specificity, and AUC were evaluated for the training and test sets using the three models. The Delong test and DCA evaluate the performance of the three models. P < 0.05 (two-tailed) indicated significance.
Results
Patient Characteristics
The study enrolled 620 Asian Women with 620 lesions, 375 benign lesions and 245 malignant lesions. The pathologic result of breast lesions was shown in Table 1. According to the 7:3 ratio between the training and validation sets, there were 434 patients in the training set, 263 (60.6%) benign and 171 (39.4%) malignant tumors. In the validation set, there were 186 patients with 112 (60.2%) benign and 74 (39.8%) malignant tumors. The difference between the two groups was not statistically significant (χ2 = 0.008, P = 0.929).
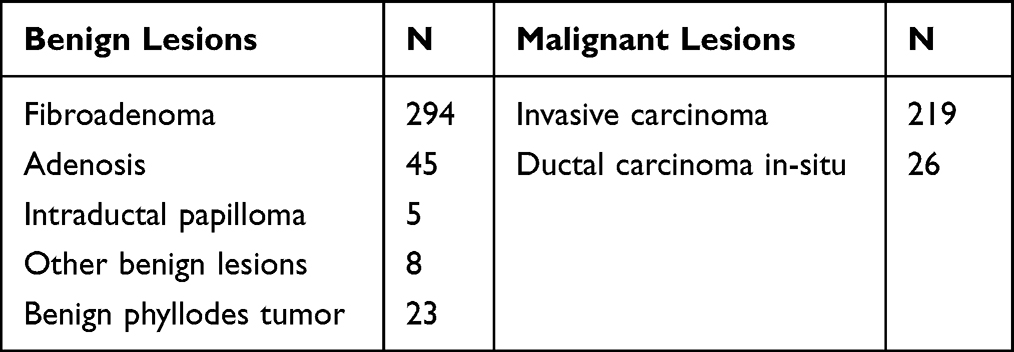 |
Table 1 Pathological Results of Breast Lesions |
The median ages of the training and validation sets were 46 (IQR,34–53), and 46 (IQR,33.25–52) respectively. The median maximum diameter of lesions in the training and validation sets were 19 (IQR,14.25–25), and 20 (IQR,15–25.75) respectively. There were no significant signs in age or maximum lesion diameter in either group (P = 0.457, P = 0.209, respectively).
Feature Selection
In each of ABVS, B-ultrasound and SE screening methods we extracted 1652 features, including 324 first-order features, 14 shape features and 1314 second order texture features [396 gray level co-occurrence matrixes (GLCMs), 252 gray level dependence matrixes (GLDMs), 288 gray level run length matrixes (GLRLMs), 288 gray level size zone matrixes (GLSZMs), 90 neighbouring gray tone difference matrixes (NGTDMs)].
ABVS features and B + SE features left 196 and 350 features after screening out features with ICCs and univariate correlation analysis, respectively. Then we used GBDT and multiple logistic regression to extract 8 features (3 GLRLMs, 2 GLSZMs, 2 GLDMs, 1 GLCM) and 17(4 GLSZMs, 6 GLRLMs, 1 GLDM, 4GLCM, 1 first-order, 1 shape) from the ABVS and B+SE features, respectively.
Construction and Assessment the Radiomics Model
The ABVS model and the B+SE model were constructed with the features of ABVS and B-ultrasound + SE respectively by multivariate logistic regression. We then combined 25 features from ABVS and B+SE, screened 14 features by multivariate logistic regression, and constructed a multimodal model. The features coefficients of the three models are shown in Figure 3. The ROC curve was used to analyze and evaluate the performance of the ABVS, the B+SE model, and multimodal model of the training set and validation set (Table 2). The ROC curve indicated that the multimodal model had good performance and applicability with an AUC of 0.975 (95% CI: 0.959–0.991) in the training set and 0.946 (95% CI: 0.913–0.978) in validation set. The ROC curve of the three models in the training set and validation set are shown in Figure 4A and Figure 4.
 |
Table 2 Performance of the ABVS Model, B+SE Model and, Multimodal Model in the Training Set and Validation Set |
 |
Figure 3 The features’ coefficient of the ABVS model, B+SE model and multimodal model. The features of the multimodal, ABVS, and B+SE models are shown in blue, red, and green. The size of the shape indicates the absolute value of the correlation coefficient of the features. |
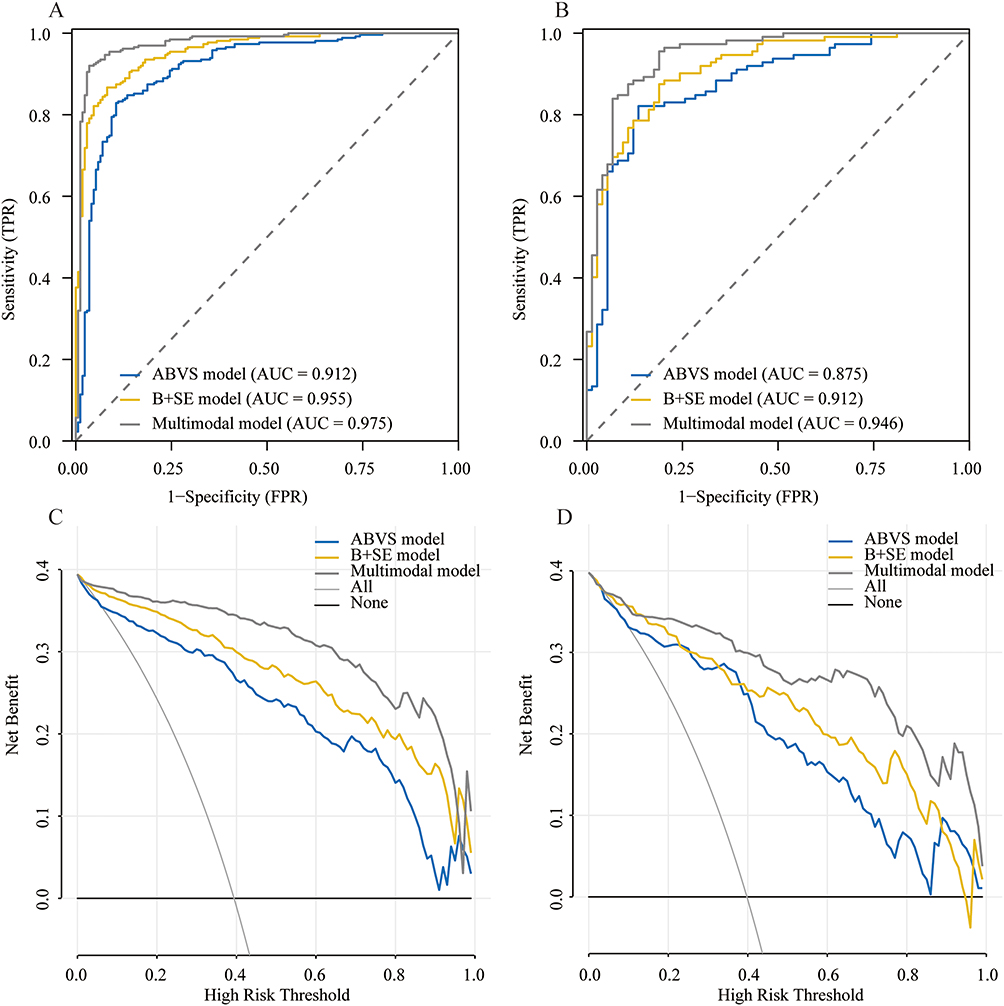 |
Figure 4 The ROC and DCA curves of the three models. (A) Three models ROC curves in the training set. (B) Three models ROC curves in the validation set. (C) Three models DCA curves in the training set. (D) Three models DCA curves in the validation set. |
The Delong test was used to compare the three models. The multimodal model outperformed the ABVS and B+SE models in both the training and validation sets, with significant differences (training set, P < 0.001, P = 0.023; validation set, P < 0.001, P = 0.034). Results from Table 2 display that Multimodal model has improved AUC, accuracy, specificity, and sensitivity than the other two models in both training and validation sets. This suggested that combining the features of ABVS with the B+SE features could further improve the diagnostic performance of breast lesions. Meanwhile, DCAs indicate that the net benefit of the multimodal model is higher than the other two models for most of the threshold probability ranges in the training and validation sets (Figures 4C and Figure 4). In addition, the Hosmer-Lemeshow test was used to assess the nomogram calibration curves, and non-significant findings (P = 0.429 and 0.811 in the training and validation sets, respectively) showed that the calibration was accurate (Figure 5).
 |
Figure 5 Calibration curves for the multimode model in training (A) and validation sets (B), respectively. |
Discussion
The ABVS model based on the coronal plane of breast lesions, the B+SE model based on B-ultrasound and SE, and the multimodal model based on the three examinations were constructed in this study. The multimodal model showed optimal diagnostic efficacy in training and validation sets. The AUCs of the training and validation sets were 0.975 (95% CI: 0.959–0.991), 0.946 (95% CI: 0.913–0.978), respectively.
Following the advent of radiomics, more studies are using it for breast disease. Both SE and B-ultrasound capture the anteroposterior direction of the lesions. B-ultrasound radiomics developed by Romeo to diagnose benign and malignant breast disease has achieved high performance, with AUCs of 0.90 (SD ± 0.06) and 0.82 (95% CI: 0.70–0.93) in the training and test sets, respectively,11 however, its specificity is low (57%).11 With the inclusion of elastography, radiomics’ ability to detect breast cancer has been significantly enhanced.21 Jiang et al22 constructed a dual-model US radiomics nomogram based on shear-wave elastography for breast lesion classification, which had a sensitivity and specificity of 83% and 88%, respectively. The theory behind it could be that benign masses are typically less rigid than malignant masses are,23–25 ultrasound elastography could thus contain additional microscopic diagnostic information associated with masses malignancy.26 The B+SE model in our study exhibited the same AUC, sensitivity and specificity as the model described by Jiang et al22 (0.912 vs 0.92, 81.1% vs 83% and 87.5% vs 88%, respectively).
When it comes to ABVS, the malignant lesion appears as hyperechoic with straight lines radiating from the surface of the lesion in the coronal plane, which are frequently linked to a retraction phenomenon represented by tumor infiltration and the desmoplastic reaction of the surrounding tissue.27,28 Micro-spherical margins of the mass generated by inconsistent growth and advancement of the margins of the breast mass,29 are independent risk factors for malignancy.27 The “white wall” sign of the ABVS in coronal plane symbolizes benign mass like simple cysts and fibroadenomas.30 Based on the difference between pathology and imaging findings mentioned above, the ABVS based radiomics model was built for this study. The eight textural features obtained from the ABVS showed better performance, with an AUC, accuracy, sensitivity and specificity of 0.875 (95% CI: 0.822–0.928), 83.9%, 82.1%, 86.5%, respectively; these were higher than those reported by Wang et al31 [(0.813±0.034, 95% CI: 0.626 −0.857), 73.7%,74.2%, 72.7%]. This result further validates that, the textural features extracted from the coronal plane could capture subtle microscopic differences between benign and malignant lesions.
Features extracted from the ABVS model to the B+SE model were added to construct a multimodal model to better promote the discrimination potentiality of radiomics for breast lesions. After merging, the multimodal model outperforms the other two models in the training and validation sets. This observation suggests that including the features coronal images of lesions can improve the predictive performance of benign and malignant lesions in the breast. In the validation set, although the ABVS model is as sensitive as the multimodal model, it is lower than the multimodal model in the training set. Besides, it also has a lower AUC, accuracy and specificity in both validation and training sets, and so is the B+SE model. The multimodal model offered greater net benefits than the others, according to DCA. In addition, the multimodal model had a similar AUC (0.921–0.955) when compared to the MRI-based radiomics model and deep learning based on multimodal and multiview ultrasound images.32–34 Therefore, the new model is an effective way to assist the clinical process and the sonographers in discrimination of breast masses.
4956 characteristics were obtained from the three imaging modalities in this study, and 14 features were selected after filtering, with majority of the selected features being higher order filter features (12/14). About one third of these features are from wavelet filtering, consistent with other studies that have added wavelet features to radiomics.35 The capacity to breakdown an image into distinct scales with varied levels of detail is the primary function of the wavelet transform in image processing,36 and that could be helpful for the investigation of tumor heterogeneity at various scales. Beyond this, we also found that among the second order features, GLRLM features were more frequent in each model, and all had a high correlation coefficient with breast cancer diagnosis for each model. This is probably because, firstly, its features are most reproducible.37 Secondly, For assessing the heterogeneity of tumor textural characteristics, GLRLM offers a significant benefit.38 Last but not least, it has a high accuracy for the classification of normal and abnormal.39
As a retrospective study, it has the following limitations. 1) It needs external validation in the future as a single-center study. 2) All of our studies have been performed on the same ultrasound device, indicating the requirement to further verify our model on other devices and protocols. We will try to overcome these limitations in future work, such as adding multicenter data.
Conclusions
In conclusion, this study constructed a multimodal model combining ABVS, B-ultrasound and SE radiomics features, which showed good predictive accuracy for aspects of breast malignancy. The role of coronal plane imaging of the breast should be acknowledged and considered in radiomics analysis of breast lesions in future studies.
Ethics Approval and Informed Consent
This study was approved by the Institutional Review Boards of the First Affiliated Hospital of Anhui Medical University (2023136) and the Wuhu No. 2 People’s Hospital (2022 No.5).
Disclosure
The authors declare that they have no conflict of interest.
References
1. Sung H, Ferlay J, Siegel RL, et al. Global Cancer Statistics 2020: GLOBOCAN Estimates of Incidence and Mortality Worldwide for 36 Cancers in 185 Countries. CA Cancer J Clin. 2021;71(3):209–249. doi:10.3322/caac.21660
2. Ferlay J, Soerjomataram I, Dikshit R, et al. Cancer incidence and mortality worldwide: sources, methods and major patterns in GLOBOCAN 2012. Int J Cancer. 2015;136(5):E359–86. doi:10.1002/ijc.29210
3. Pourasad Y, Zarouri E, Salemizadeh Parizi M, Salih Mohammed A. Presentation of Novel Architecture for Diagnosis and Identifying Breast Cancer Location Based on Ultrasound Images Using Machine Learning. Diagnostics. 2021;11(10). doi:10.3390/diagnostics11101870
4. Madjar H. Role of Breast Ultrasound for the Detection and Differentiation of Breast Lesions. Breast Care. 2010;5(2):109–114. doi:10.1159/000297775
5. Ricci P, Maggini E, Mancuso E, Lodise P, Cantisani V, Catalano C. Clinical application of breast elastography: state of the art. Eur J Radiol. 2014;83(3):429–437. doi:10.1016/j.ejrad.2013.05.007
6. Barr RG. Sonographic breast elastography: a primer. J Ultrasound Med. 2012;31(5):773–783. doi:10.7863/jum.2012.31.5.773
7. Zhao XB, Yao JY, Zhou XC, et al. Strain Elastography: a Valuable Additional Method to BI-RADS?. Ultraschall Med. 2018;39(5):526–534. doi:10.1055/s-0043-115108
8. Guo R, Lu G, Qin B, Fei B. Ultrasound Imaging Technologies for Breast Cancer Detection and Management: a Review. Ultrasound Med Biol. 2018;44(1):37–70. doi:10.1016/j.ultrasmedbio.2017.09.012
9. Wang Y, Liu Y, Zheng X, et al. Added Value of Different Types of Elastography in Evaluating Ultrasonography Detected Breast Lesions: a Compared Study With Mammography. Clin Breast Cancer. 2020;20(3):e366–e372. doi:10.1016/j.clbc.2019.11.002
10. Valdora F, Houssami N, Rossi F, Calabrese M, Tagliafico AS. Rapid review: radiomics and breast cancer. Breast Cancer Res Treat. 2018;169(2):217–229. doi:10.1007/s10549-018-4675-4
11. Romeo V, Cuocolo R, Apolito R, et al. Clinical value of radiomics and machine learning in breast ultrasound: a multicenter study for differential diagnosis of benign and malignant lesions. Eur Radiol. 2021;31(12):9511–9519. doi:10.1007/s00330-021-08009-2
12. Youk JH, Kwak JY, Lee E, Son EJ, Kim JA. Grayscale Ultrasound Radiomic Features and Shear-Wave Elastography Radiomic Features in Benign and Malignant Breast Masses. Ultraschall Med. 2020;41(4):390–396. doi:10.1055/a-0917-6825
13. Wang S, Wei Y, Li Z, Xu J, Zhou Y. Development and Validation of an MRI Radiomics-Based Signature to Predict Histological Grade in Patients with Invasive Breast Cancer. Breast Cancer. 2022;14:335–342. doi:10.2147/BCTT.S380651
14. Li N, Song C, Huang X, et al. Optimized Radiomics Nomogram Based on Automated Breast Ultrasound System: a Potential Tool for Preoperative Prediction of Metastatic Lymph Node Burden in Breast Cancer. Breast Cancer. 2023;15:121–132. doi:10.2147/BCTT.S398300
15. Ma Q, Wang J, Xu D, et al. Automatic Breast Volume Scanner and B-Ultrasound-Based Radiomics Nomogram for Clinician Management of BI-RADS 4A Lesions. Acad Radiol. 2022. doi:10.1016/j.acra.2022.11.002
16. Li N, Jiang YX, Zhu QL, et al. Accuracy of an automated breast volume ultrasound system for assessment of the pre-operative extent of pure ductal carcinoma in situ: comparison with a conventional handheld ultrasound examination. Ultrasound Med Biol. 2013;39(12):2255–2263. doi:10.1016/j.ultrasmedbio.2013.07.010
17. Wang HY, Jiang YX, Zhu QL, et al. Differentiation of benign and malignant breast lesions: a comparison between automatically generated breast volume scans and handheld ultrasound examinations. Eur J Radiol. 2012;81(11):3190–3200. doi:10.1016/j.ejrad.2012.01.034
18. Lambin P, Leijenaar RTH, Deist TM, et al. Radiomics: the bridge between medical imaging and personalized medicine. Nat Rev Clin Oncol. 2017;14(12):749–762. doi:10.1038/nrclinonc.2017.141
19. van Griethuysen JJM, Fedorov A, Parmar C, et al. Computational Radiomics System to Decode the Radiographic Phenotype. Cancer Res. 2017;77(21):e104–e107. doi:10.1158/0008-5472.CAN-17-0339
20. Li T, Yang K, Stein JD, Nallasamy N. Gradient Boosting Decision Tree Algorithm for the Prediction of Postoperative Intraocular Lens Position in Cataract Surgery. Transl Vis Sci Technol. 2020;9(13):38. doi:10.1167/tvst.9.13.38
21. Li Y, Liu Y, Zhang M, Zhang G, Wang Z, Luo J. Radiomics With Attribute Bagging for Breast Tumor Classification Using Multimodal Ultrasound Images. J Ultrasound Med. 2020;39(2):361–371. doi:10.1002/jum.15115
22. Jiang M, Li CL, Chen RX, et al. Management of breast lesions seen on US images: dual-model radiomics including shear-wave elastography may match performance of expert radiologists. Eur J Radiol. 2021;141:109781. doi:10.1016/j.ejrad.2021.109781
23. Bai M, Du L, Gu J, Li F, Jia X. Virtual touch tissue quantification using acoustic radiation force impulse technology: initial clinical experience with solid breast masses. J Ultrasound Med. 2012;31(2):289–294. doi:10.7863/jum.2012.31.2.289
24. Frey H. Realtime-Elastographie. Ein neues sonographisches Verfahren für die Darstellung der Gewebeelastizität [Realtime elastography. A new ultrasound procedure for the reconstruction of tissue elasticity]. Radiologe. 2003;43(10):850–855. doi:10.1007/s00117-003-0943-2. German.
25. Golatta M, Schweitzer-Martin M, Harcos A, et al. Normal breast tissue stiffness measured by a new ultrasound technique: virtual touch tissue imaging quantification (VTIQ). Eur J Radiol. 2013;82(11):e676–9. doi:10.1016/j.ejrad.2013.06.029
26. Ophir J, Alam SK, Garra BS, et al. Elastography: imaging the elastic properties of soft tissues with ultrasound. J Med Ultrason. 2002;29(4):155. doi:10.1007/BF02480847
27. Zheng FY, Yan LX, Huang BJ, et al. Comparison of retraction phenomenon and BI-RADS-US descriptors in differentiating benign and malignant breast masses using an automated breast volume scanner. Eur J Radiol. 2015;84(11):2123–2129. doi:10.1016/j.ejrad.2015.07.028
28. Skaane P, Gullien R, Eben EB, Sandhaug M, Schulz-Wendtland R, Stoeblen F. Interpretation of automated breast ultrasound (ABUS) with and without knowledge of mammography: a reader performance study. Acta Radiol. 2015;56(4):404–412. doi:10.1177/0284185114528835
29. Hong AS, Rosen EL, Soo MS, Baker JA. BI-RADS for sonography: positive and negative predictive values of sonographic features. AJR Am J Roentgenol. 2005;184(4):1260–1265. doi:10.2214/ajr.184.4.01841260
30. Vourtsis A, Kachulis A. The performance of 3D ABUS versus HHUS in the visualisation and BI-RADS characterisation of breast lesions in a large cohort of 1886 women. Eur Radiol. 2018;28(2):592–601. doi:10.1007/s00330-017-5011-9
31. Wang H, Yang X, Ma S, Zhu K, Guo S. An Optimized Radiomics Model Based on Automated Breast Volume Scan Images to Identify Breast Lesions: comparison of Machine Learning Methods. J Ultrasound Med. 2021. doi:10.1002/jum.15845
32. Zhao Y, Chen R, Zhang T, et al. MRI-Based Machine Learning in Differentiation Between Benign and Malignant Breast Lesions. Front Oncol. 2021;11:552634. doi:10.3389/fonc.2021.552634
33. Zhang Q, Peng Y, Liu W, et al. Radiomics Based on Multimodal MRI for the Differential Diagnosis of Benign and Malignant Breast Lesions. J Magn Reson Imaging. 2020;52(2):596–607. doi:10.1002/jmri.27098
34. Qian X, Pei J, Zheng H, et al. Prospective assessment of breast cancer risk from multimodal multiview ultrasound images via clinically applicable deep learning. Nature Biomed Eng. 2021;5(6):522–532. doi:10.1038/s41551-021-00711-2
35. Zhang R, Xu L, Wen X, et al. A nomogram based on bi-regional radiomics features from multimodal magnetic resonance imaging for preoperative prediction of microvascular invasion in hepatocellular carcinoma. Quant Imaging Med Surg. 2019;9(9):1503–1515. doi:10.21037/qims.2019.09.07
36. Savareh BA, Emami H, Hajiabadi M, Azimi SM, Ghafoori M. Wavelet-enhanced convolutional neural network: a new idea in a deep learning paradigm. Biomed Tech (Berl). 2019;64(2):195–205. doi:10.1515/bmt-2017-0178
37. Edalat-Javid M, Shiri I, Hajianfar G, et al. Cardiac SPECT radiomic features repeatability and reproducibility: a multi-scanner phantom study. J Nucl Cardiol. 2021;28(6):2730–2744. doi:10.1007/s12350-020-02109-0
38. Yu H, Meng X, Chen H, et al. Predicting the Level of Tumor-Infiltrating Lymphocytes in Patients With Breast Cancer: usefulness of Mammographic Radiomics Features. Front Oncol. 2021;11:628577. doi:10.3389/fonc.2021.628577
39. Park BE, Jang WS, Yoo SK. Texture Analysis of Supraspinatus Ultrasound Image for Computer Aided Diagnostic System. Healthc Inform Res. 2016;22(4):299–304. doi:10.4258/hir.2016.22.4.299
 © 2023 The Author(s). This work is published and licensed by Dove Medical Press Limited. The
full terms of this license are available at https://www.dovepress.com/terms
and incorporate the Creative Commons Attribution
- Non Commercial (unported, 3.0) License.
By accessing the work you hereby accept the Terms. Non-commercial uses of the work are permitted
without any further permission from Dove Medical Press Limited, provided the work is properly
attributed. For permission for commercial use of this work, please see paragraphs 4.2 and 5 of our Terms.
© 2023 The Author(s). This work is published and licensed by Dove Medical Press Limited. The
full terms of this license are available at https://www.dovepress.com/terms
and incorporate the Creative Commons Attribution
- Non Commercial (unported, 3.0) License.
By accessing the work you hereby accept the Terms. Non-commercial uses of the work are permitted
without any further permission from Dove Medical Press Limited, provided the work is properly
attributed. For permission for commercial use of this work, please see paragraphs 4.2 and 5 of our Terms.