")
Back to Journals » Diabetes, Metabolic Syndrome and Obesity » Volume 13
Radiologic Assessment of Muscle and Fat Stores in Long-Term Type I Diabetics Referred for Pancreas Transplant Compared to Healthy Controls
Authors Nagaraju S, Mangus RS , Salisbury TA, Bush WJ, Davis JP, Powelson JA, Fridell JA
Received 13 April 2020
Accepted for publication 1 July 2020
Published 24 August 2020 Volume 2020:13 Pages 2989—2995
DOI https://doi.org/10.2147/DMSO.S257992
Checked for plagiarism Yes
Review by Single anonymous peer review
Peer reviewer comments 4
Editor who approved publication: Prof. Dr. Juei-Tang Cheng
Santosh Nagaraju, Richard S Mangus, Tyra A Salisbury, Weston J Bush, Jason P Davis, John A Powelson, Jonathan A Fridell
Department of Surgery, Indiana University School of Medicine, Indianapolis, IN, USA
Correspondence: Richard S Mangus Email [email protected]
Abstract: Type 1 diabetes (DM1) is associated with loss of skeletal muscle and bone mass and may affect body fat stores. This study employs computed tomography (CT) scans to assess the body composition of DM1 patients referred for pancreas transplant compared to healthy controls. A 1:1 case–control design matched study patients with otherwise healthy patients from the trauma database. Matching criteria included age ± 5 years, gender, and body mass index (BMI) ± 2kg/m2. Nutrition variables included serum albumin and protein levels, BMI, and CT measures of muscle mass and fat stores. There were 22 subjects and 22 controls (median DM1 duration 24 years). DM1 patients had less muscle mass and less subcutaneous fat but no difference in visceral fat. Patients with the greatest muscle deficit were those with DM1 greater than 20 years and those younger than age 40. DM1 patients maintain similar BMI and protein levels compared to healthy controls but have marked deficits of muscle and subcutaneous fat. These results inform the nutritional management of DM1 patients and quantify the muscle and fat deficits present in these patients. At highest risk are young patients and those with duration of DM1 over 20 years.
Keywords: computed tomography, sarcopenia, sarcopenic obesity, nutrition, type 1 diabetes
Introduction
Diabetes mellitus (DM) is a group of metabolic diseases characterized by chronic hyperglycemia resulting from defects in insulin secretion, insulin action, or both.1 Diabetes, both type 1 (DM1) and type 2, treated with insulin therapy can lead to weight gain.2 Insulin resistance can lead to accelerated muscle loss, mainly due to metabolic and hormonal factors.3 Diabetes and other chronic disease states are known to be associated with ongoing loss of skeletal muscle (sarcopenia) and bone mass, accompanied by an increase in adipose tissue. These conditions can then result in sarcopenic obesity or osteosarcopenic obesity.4
New data is emerging in the field of sarcopenia and sarcopenic obesity in current literature. Sarcopenia is described as a loss of skeletal muscle mass and function, generally related to aging. Primary sarcopenia is caused by aging, while secondary sarcopenia is caused by disuse, long-standing diseases like organ failure, malignancy, neurodegenerative diseases, and inadequate nutrition.5 Sarcopenic obesity is described as an increase in the fat stores in the body seen concurrently with sarcopenia.6–8 Sarcopenia is associated with increased mortality in the elderly, in patients with end-stage renal disease on dialysis, and in critically ill patients.9 Sarcopenia and sarcopenic obesity are associated with poor outcomes in patients with cirrhosis including increased organ transplant wait list mortality, post-transplant infectious risk, and post-transplant mortality.10,11 These morphometric changes have also been described in children with chronic disease.12
Multiple techniques have been described to assess obesity and sarcopenia including anthropometric measurements such as body mass index (BMI), mid-arm circumference, arm skinfold thickness; handgrip strength, gait and balance assessment, assessment of appendicular skeletal muscle mass or appendicular lean mass using dual-energy X-ray absorptiometry (DXA) or bioimpedance analysis in clinical setting. Radiologic imaging with computed tomography (CT) or magnetic resonance imaging (MRI) are standardized tools for assessment of visceral and subcutaneous fat, as well as muscle mass. These imaging modalities can easily differentiate fat, muscle, and other tissues.13 Currently, CT and MRI are the gold standards for evaluation of body composition. They can also be used to analyze and trend changes in quantity and quality of muscle mass, adipose tissue, and bone.14
This study uses CT scans to objectively assess the body composition (muscle and fat stores) of a group of type DM1 patients with long-standing disease and to compare these findings to non-diabetic, healthy, matched control patients. A secondary aim was to compare these differences to more standard measures of nutrition including serum protein measures and BMI.
Research Design and Methods
Data for this study were extracted from a single-center transplant database of DM1 patients referred for pancreas transplant between 2003 and 2015. Inclusion criteria included all patients with DM1 that had CT imaging of the abdomen during their evaluation for pancreas transplant. Included cases were stratified by age, gender, BMI, and duration of diabetes to include a patient population that was representative of the population as a whole. Each study patient that met the inclusion criteria was matched to a healthy control patient. Additionally, laboratory values of total protein, albumin, and hemoglobin A1c were collected and included in the analysis.
Control patients were selected from a trauma database in order to perform a 1:1 case–control study design. Each anonymous, qualifying non-diabetic control had an injury severity score less than 10 and received a screening abdominal CT scan at presentation to the emergency department. Matching criteria included the control being age ± 5 years, BMI ± 2 kg/m2, and the same gender as the case.
Sarcopenia was assessed by measurements of total psoas muscle area and subcutaneous fat area at L2/L3 intervertebral space on CT scan. Previous studies have shown that core muscle area at approximately 5 cm above L4/L5 is the most accurate indicator of total body skeletal muscle mass.15–17 Measurements were made at L2/L3 since this was approximately 5 cm above L4/L5 and could be easily located in all cases and controls. Peri-nephric fat was measured at the hilum of the kidney. Three research assistants, who were trained in reading abdomen CT scans, made each measurement blind to the measurements of the other assistants and to the diagnosis and outcome of the patient. This was done to establish inter-rater reliability. Any measurement that differed by 15% from the mean was re-examined until a consensus was reached. This occurred in 6 patients. The mean of all measurements was used in the analysis to minimize the human error of each measurement. Total psoas area, total subcutaneous fat, and total perinephric fat were scaled for the height of the patient by dividing the measured area (in mm2) by the height (in cm) squared. This created the psoas area index, subcutaneous fat index, and the perinephric fat index used in the comparison between the case and control groups.
To make each measurement, the imaging software was set to “soft tissue” and the free hand drawing tool was used. To measure the total psoas muscle area, the left and right psoas muscles were outlined at the L2/L3 space and the areas were summed to get the total area. The subcutaneous fat area was obtained by subtracting the area of the outlined abdominal cavity from the area outlined just under the dermis. Since the level of the kidney differed for each patient, the measurements were taken at the hilum of each kidney. This was done by outlining the kidney and vasculature and subtracting this area from the area obtained by outlining Gerota’s fascia. Total perinephric fat was calculated by summing the right and left perinephric values.18
CT images were viewed and measured using Synapse picture archiving and communication system (PACS) software (FUJIFILM Holdings America Corporation, Valhalla, New York, USA). Data were analyzed using Statistical Package for the Social Sciences (IBM SPSS Statistics 26, IBM Corporation, Armonk, New York, USA). Group differences were compared using analysis of variance testing and non-parametric testing (chi-square) for continuous and categorical variables, respectively. Retrospective analysis of de-identified patient data for this study was reviewed and approved by the Institutional Review Board of the Indiana University School of Medicine. No patient consent was required by the board for retrospective analysis of previously collected data in compliance with the Declaration of Helsinki. Patient data were accessed and managed according to the data security and privacy policies of the university. All data for this study were collected prior to patient listing for organ transplantation. Therefore, this study does not involve the donation or transplantation of organs.
Results
There were 22 DM1 subjects and 22 matched controls (Table 1). The study had 12 males (54%) and 10 (46%) females in each group. Group demographics were similar. The median age of the patients was 44 years and ranged from 20 to 67 years (controls) and from 15 to 65 years (diabetics). The mean duration of DM for study patients was 24 years. The median BMI was 25.6kg/m2 (controls) and 25.1 kg/m2 (DM1), with the diabetic study patients being significantly taller (p=0.04). Laboratory measures of nutrition were similar between the study and control groups. The mean serum albumin and protein levels were 3.2g/dL and 6.6g/dL (DM1), and 3.4g/dL and 6.4g/dL (control) (p=0.53 and 0.15). DM1 patients did have lower median psoas index (4.8) compared to controls (5.7) (−18% deficit, p=0.06). Similarly, the DM patients had a lower subcutaneous fat index (57.3) compared to healthy controls (67.3) (−17% deficit, p=0.20). The visceral fat assessments done by peri-nephric index were also lower for DM1 patients but did not reach significance.
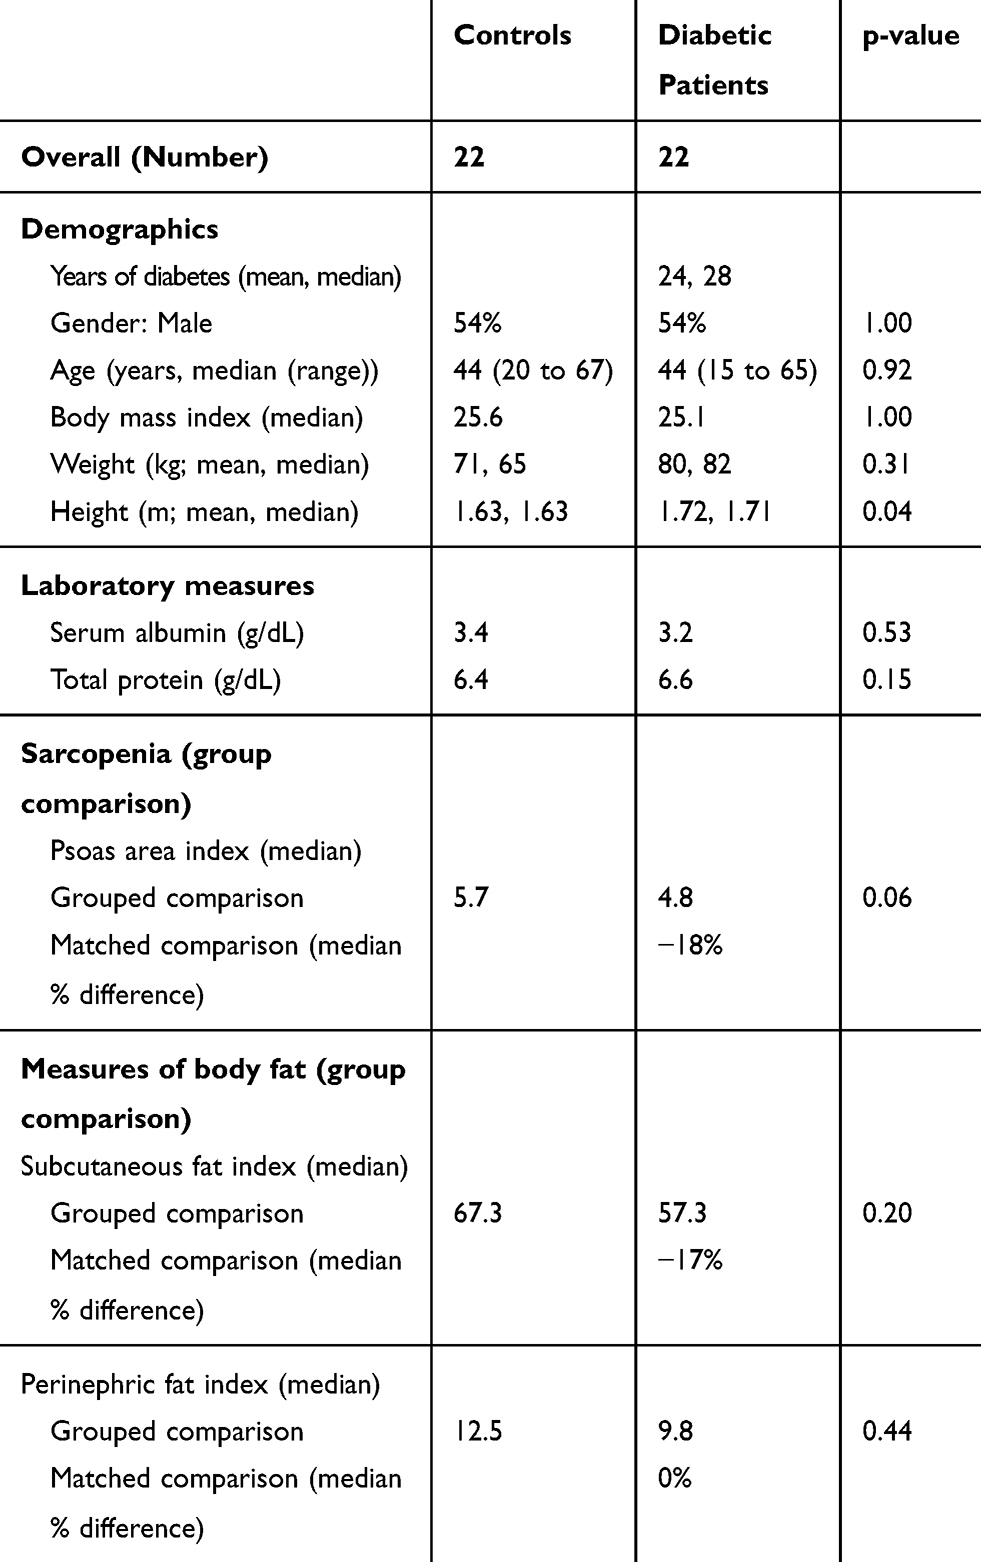 |
Table 1 Comparison of Demographics and Nutrition Measures for Patients with Type I Diabetes and Healthy Controls |
Subgroup analysis was performed by duration of DM1, gender, age, and BMI. Regarding the length of DM1 diagnosis, the DM1 patients at all disease durations had similar biochemical markers of nutrition compared to controls (Table 2). Sarcopenia was seen in the DM1 patients at all disease durations when compared to controls. Sarcopenia was markedly more severe in the DM1 patients with more than 20 years of disease duration (−16% and −12%, versus −34%). There were similar deficits in subcutaneous fat when compared to controls (−24%, −31%, and −9%, p=0.29), but not in perinephric fat. Of interest, the group with the shortest duration of DM1 had a striking 56% excess of visceral fat.
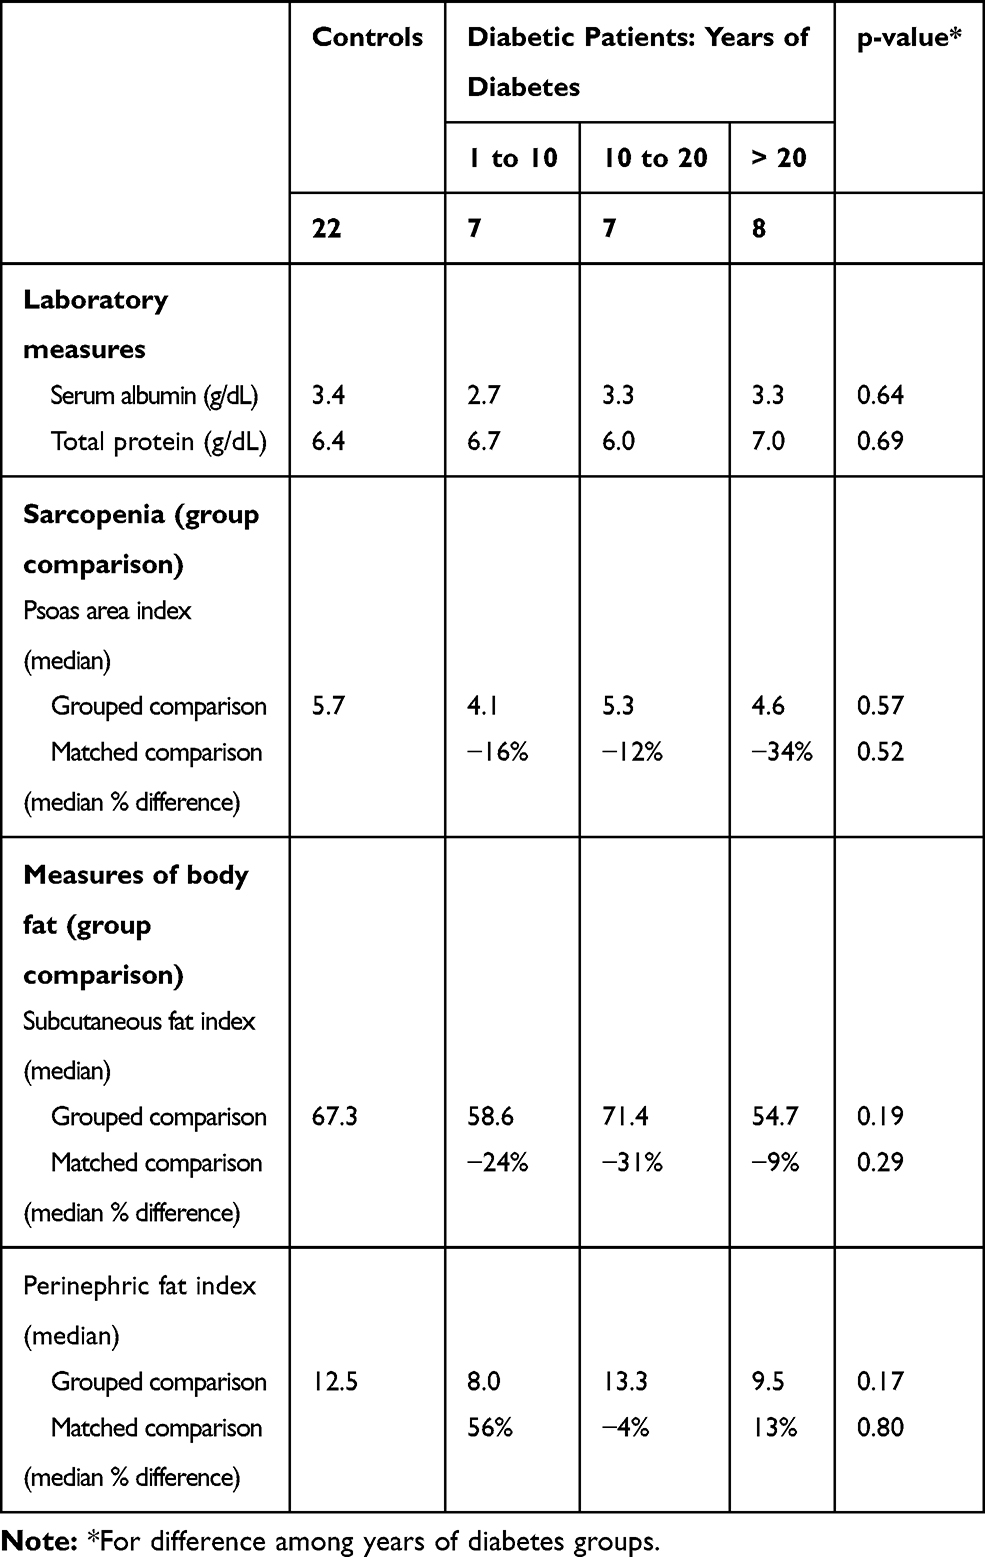 |
Table 2 Comparison of Nutrition Measures for Patients with Type I Diabetes and Healthy Controls, Stratified by Duration of Diabetes |
Males and females were next analyzed separately (Table 3). The groups did not differ for albumin and protein. These two groups had similar deficits (compared to controls) for both muscle mass and subcutaneous fat mass. In assessing visceral fat, the males had a marked deficit, while the females had a marked excess. Analysis by age showed a marked hypoalbuminemia in patients under age 40, as well as the largest deficits in muscle mass and subcutaneous fat mass for this age group (Table 4). Interestingly, these young diabetics were noted to have a 30% excess of visceral fat volume. This appears to coincide with the excess of visceral fat seen in patients with short duration of disease (+56%). The oldest patient group (over age 50 years) was quite dissimilar, with a minor muscle mass deficit, but a marked deficit in visceral fat (−36%).
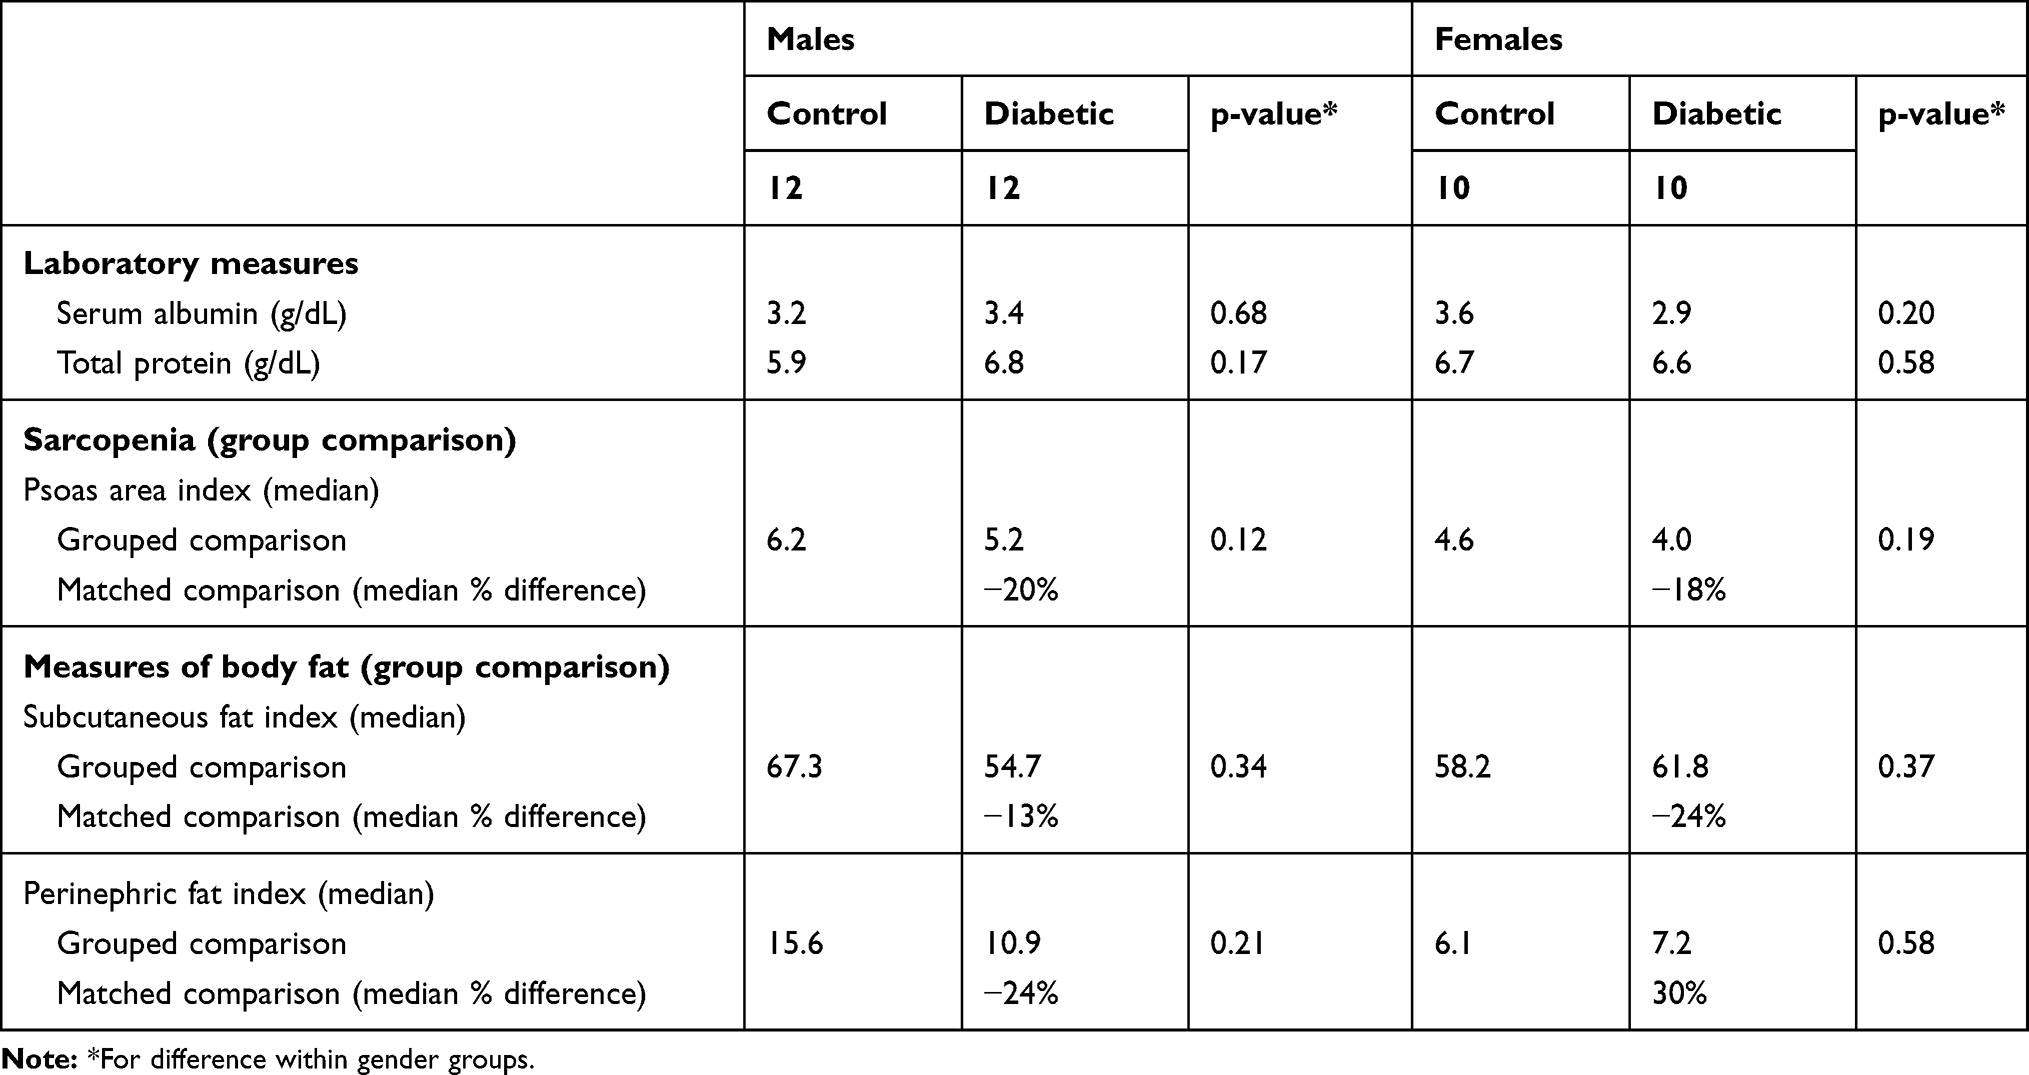 |
Table 3 Comparison of Nutrition Measures for Patients with Type I Diabetes and Healthy Control Patients, Stratified by Gender |
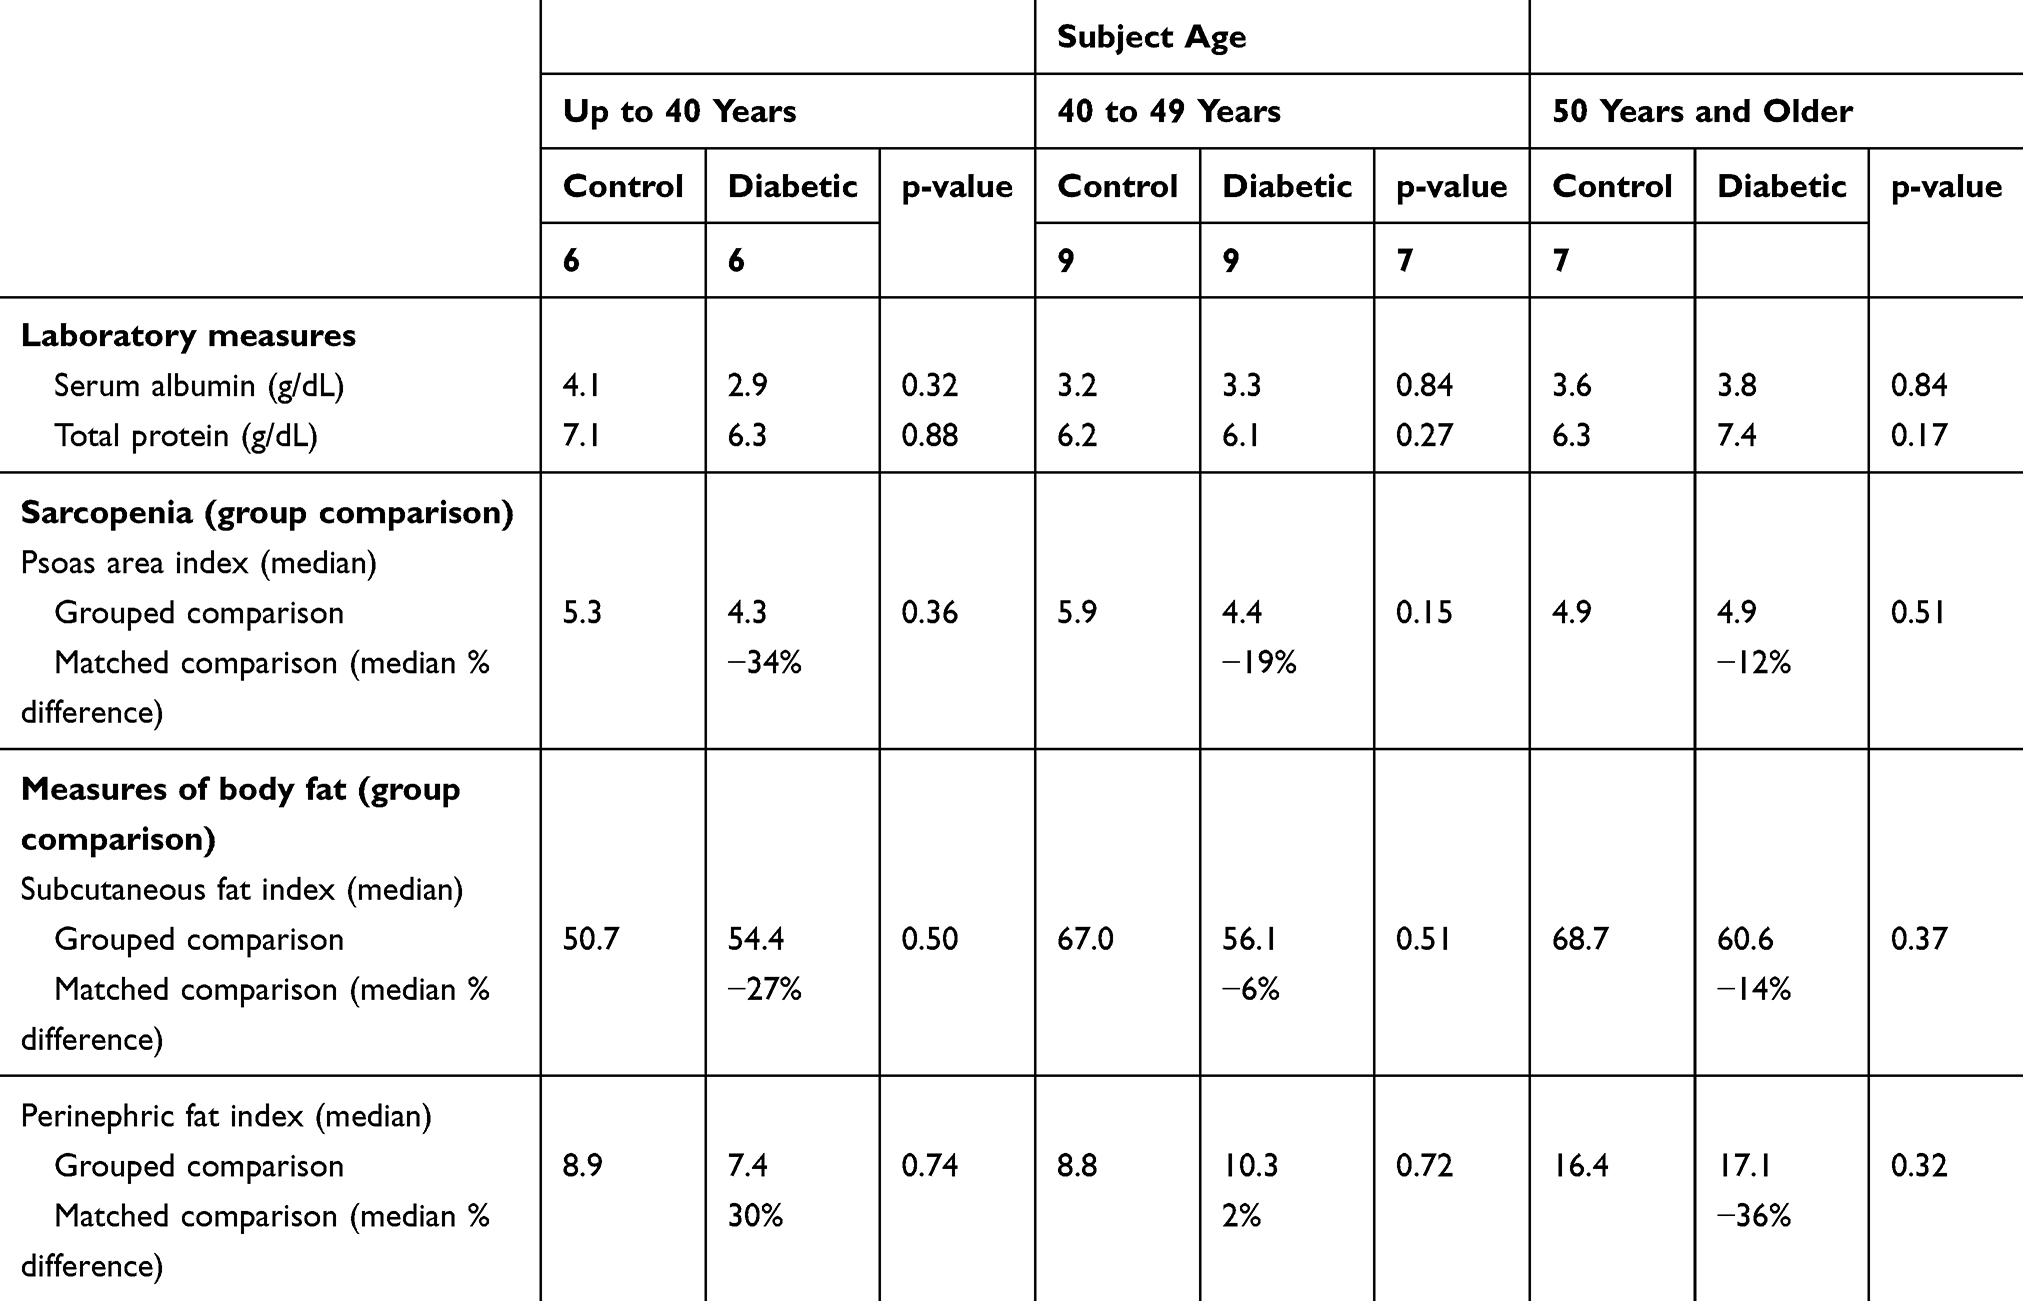 |
Table 4 Comparison of Nutrition Measures for Patients with Type I Diabetes and Healthy Controls, Stratified by Patient Age |
The final subgroup analysis is by BMI. This analysis is critical because many clinicians use BMI as a marker for nutrition. Each subgroup was similar in measured serum albumin and protein (Table 5). The BMI group ranging from 24 to 28.9kg/m2 experienced much worse sarcopenia than the lower and higher groups (−35%, compared to −4% and −5%). This group also had the greatest deficit in subcutaneous fat and in visceral fat. This group demonstrated clear evidence of severe sarcopenic obesity. The highest BMI group had marked excess of visceral fat and deficit of subcutaneous fat, providing an interesting finding as to how these obese DM1 patients store this excess fat.
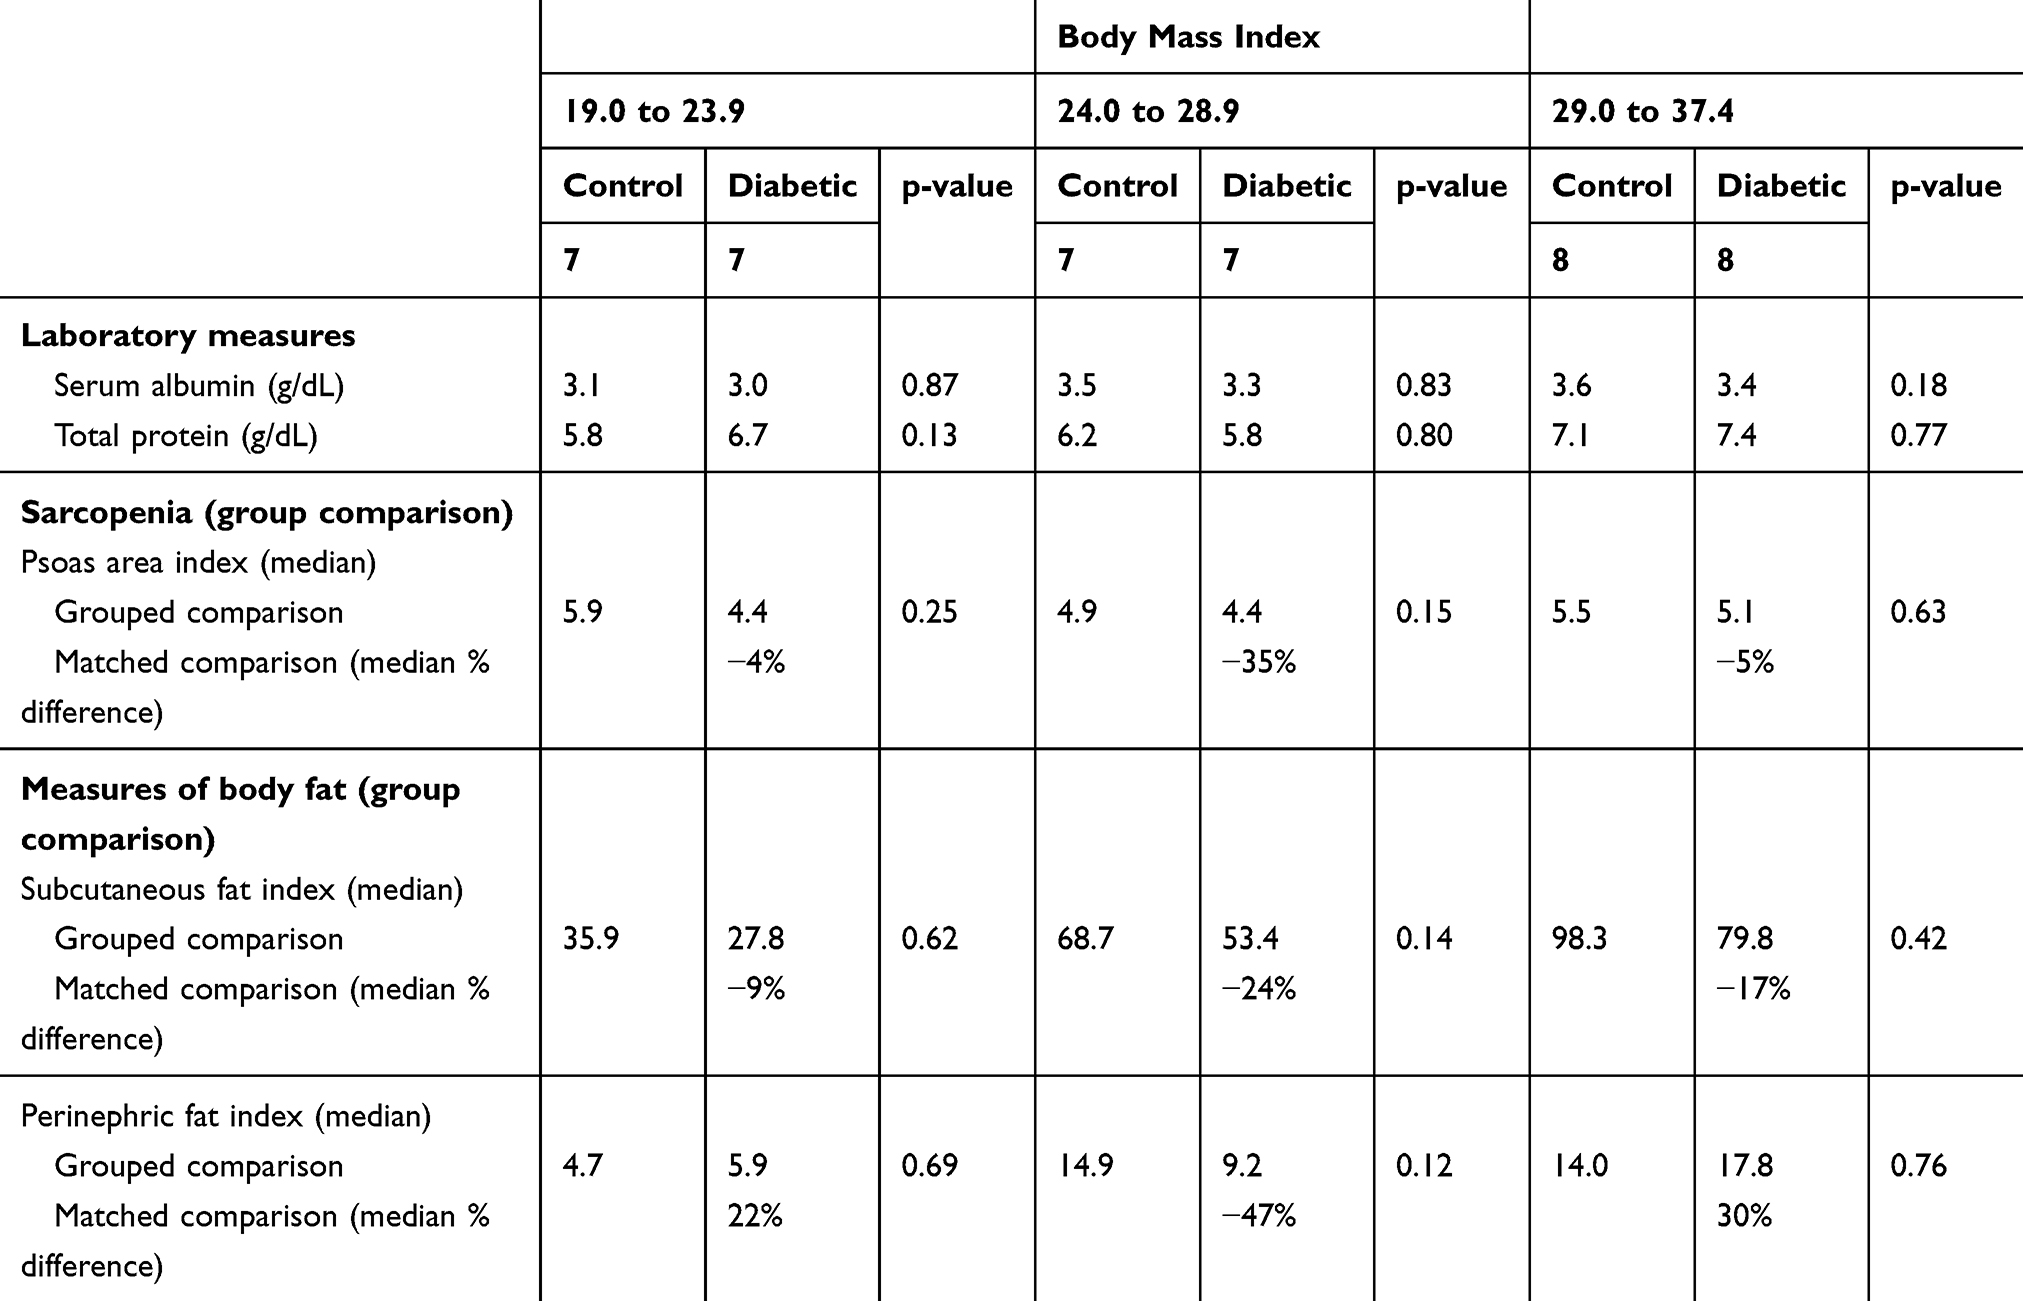 |
Table 5 Comparison of Nutrition Measures for Patients with Type I Diabetes and Healthy Controls, Stratified by Body Mass Index |
Discussion
Sarcopenia and its implications in modern medicine is an emerging field. While in general DM is associated with sarcopenia in the elderly, DM1 may cause impaired muscle function and reduced bone density in adolescents, leading to osteosarcopenia in the long term. However, there are limited studies that describe the nutritional transformation in DM1 patients. In this study, the common markers of nutrition such as BMI, serum albumin, and total protein were similar between DM1 patients and controls. This indicates that these measures alone are not reliable to assess nutritional status. DM1 patients did have lower muscle mass, as shown by the 18% deficit (p=0.06) compared to controls in their calculated psoas index. Similarly, the DM1 patients had a deficit of subcutaneous fat (p=0.20, 17% deficit), but little difference in visceral fat. To summarize, DM1 patients had similar visceral fat but reduced skeletal muscle and subcutaneous fat compared to controls. This further indicates that BMI alone cannot be used as an indicator of nutritional status as there is differential distribution of fat and muscle mass among DM1 patients compared to healthy adults.
Subgroup analysis demonstrated that the groups with the greatest muscle deficit were those patients with DM for greater than 20 years (−34%), patients younger than age 40 years (−34%), those with BMI 24.0 to 28.9 (−35%). Large deficits in subcutaneous fat were found in patients with shorter disease duration (−24%, −31%), females (−24%), young patients (−27%), and those with BMI 24.0 to 28.9 (−24%). The visceral fat was quite different, however. Young DM1 patients with a shorter duration of disease were found to have an excess of visceral fat (+30%, +56%), but not subcutaneous fat. Both men and women in this series had similar muscle deficits (−20% vs −18%); however, women had much more visceral fat than controls (+30%) whereas men did not.
The study is an attempt to quantify the changes in body composition and nutritional status that may occur in patients with DM1 using objective measures such as muscle mass and adipose tissue distribution. However, there are multiple limitations to the study including single institution, retrospective data analysis, small number of study patients, confounding factors that can affect DM1 (such as treatment of DM), exercise and lifestyle habits of patients, and coexistent medical conditions other than DM1 alone. More studies are needed to clearly understand these phenomena of sarcopenia and sarcopenic obesity in patients with DM1, but this study does demonstrate striking differences which support the need for further study.
In conclusion, DM1 is associated with loss of skeletal muscle mass and may affect body fat stores. While DM1 patients maintain similar BMI and serum protein levels when compared to healthy controls, they experience sarcopenic obesity as evidenced by reduced muscle mass and increased fat stores. These important morphologic changes in body composition are missed if the clinician simply follows the patient’s weight and body mass index. Even adding an analysis of serum albumin and protein fails to distinguish these changes in this population at high-risk for co-morbidities. Patients at highest risk for these changes appear to be those who are younger and have a longer duration of DM1.
Abbreviations
BMI, body mass index; CT, computerized tomography; DM, diabetes mellitus; DM1, type 1 diabetes mellitus; DXA, dual-energy X-ray absorptiometry; MRI, magnetic resonance imaging.
Author contributions
RSM devised the study design. TAS, WJB and JPD collected data. SN and RSM analyzed data and wrote the manuscript. JAP, JAF and RSM provided critical review. All authors made a significant contribution to the work reported, whether that is in the conception, study design, execution, acquisition of data, analysis and interpretation, or in all these areas; took part in drafting, revising or critically reviewing the article; gave final approval of the version to be published; have agreed on the journal to which the article has been submitted; and agree to be accountable for all aspects of the work.
Disclosure
The authors have no conflicts of interest or financial disclosures.
References
1. Association AD. Diagnosis and classification of diabetes mellitus. Diabetes Care. 2012;35(1):S64–S71. doi:10.2337/dc12-s064
2. Russell-Jones D, Khan R. Insulin-associated weight gain in diabetes–causes, effects and coping strategies. Diabetes Obes Metab. 2007;9(6):799–812. doi:10.1111/j.1463-1326.2006.00686.x
3. Guillet C, Boirie Y. Insulin resistance: a contributing factor to age-related muscle mass loss? Diabetes Metab. 2005;31 Spec No 2:5S20–25S26. doi:10.1016/s1262-3636(05)73648-x
4. Umegaki H. Sarcopenia and diabetes: hyperglycemia is a risk factor for age-associated muscle mass and functional reduction. J Diabetes Investig. 2015;6(6):623–624. doi:10.1111/jdi.12365
5. Cruz-Jentoft AJ, Baeyens JP, Bauer JM, et al. Sarcopenia: European consensus on definition and diagnosis: report of the European Working Group on Sarcopenia in Older People. Age Ageing. 2010;39(4):412–423. doi:10.1093/ageing/afq034
6. Cooper C, Fielding R, Visser M, et al. Tools in the assessment of sarcopenia. Calcif Tissue Int. 2013;93(3):201–210. doi:10.1007/s00223-013-9757-z
7. Lee DC, Shook RP, Drenowatz C, Blair SN. Physical activity and sarcopenic obesity: definition, assessment, prevalence and mechanism. Future Sci OA. 2016;2(3):FSO127. doi:10.4155/fsoa-2016-0028
8. Stenholm S, Harris TB, Rantanen T, Visser M, Kritchevsky SB, Ferrucci L. Sarcopenic obesity: definition, cause and consequences. Curr Opin Clin Nutr Metab Care. 2008;11(6):693–700. doi:10.1097/MCO.0b013e328312c37d
9. Honda H, Qureshi AR, Axelsson J, et al. Obese sarcopenia in patients with end-stage renal disease is associated with inflammation and increased mortality. Am J Clin Nutr. 2007;86(3):633–638. doi:10.1093/ajcn/86.3.633
10. Englesbe MJ, Patel SP, He K, et al. Sarcopenia and mortality after liver transplantation. J Am Coll Surg. 2010;211(2):271–278. doi:10.1016/j.jamcollsurg.2010.03.039
11. Krell RW, Kaul DR, Martin AR, et al. Association between sarcopenia and the risk of serious infection among adults undergoing liver transplantation. Liver Transpl. 2013;19(12):1396–1402. doi:10.1002/lt.23752
12. Mangus RS, Bush WJ, Miller C, Kubal CA. Severe sarcopenia and increased fat stores in pediatric patients with liver, kidney, or intestine failure. J Pediatr Gastroenterol Nutr. 2017;65(5):579–583. doi:10.1097/MPG.0000000000001651
13. Choi KM. Sarcopenia and sarcopenic obesity. Korean J Intern Med. 2016;31(6):1054–1060. doi:10.3904/kjim.2016.193
14. Guerri S, Mercatelli D, Aparisi Gomez MP, et al. Quantitative imaging techniques for the assessment of osteoporosis and sarcopenia. Quant Imaging Med Surg. 2018;8(1):60–85. doi:10.21037/qims.2018.01.05
15. Prado CM, Heymsfield SB. Lean tissue imaging: a new era for nutritional assessment and intervention. J Parenter Enteral Nutr. 2014;38(8):940–953. doi:10.1177/0148607114550189
16. Shen W, Punyanitya M, Wang Z, et al. Total body skeletal muscle and adipose tissue volumes: estimation from a single abdominal cross-sectional image. J Appl Physiol. 2004;97(6):2333–2338. doi:10.1152/japplphysiol.00744.2004
17. Shen W, Punyanitya M, Wang Z, et al. Visceral adipose tissue: relations between single-slice areas and total volume. Am J Clin Nutr. 2004;80(2):271–278. doi:10.1093/ajcn/80.2.271
18. Bush WJ, Davis JP, Maluccio MA, Kubal CA, Salisbury JB, Mangus RS. Computed tomography measures of nutrition in patients with end-stage liver disease provide a novel approach to characterize deficits. Transplant Proc. 2018;50(10):3501–3507. doi:10.1016/j.transproceed.2018.06.006
 © 2020 The Author(s). This work is published and licensed by Dove Medical Press Limited. The full terms of this license are available at https://www.dovepress.com/terms.php and incorporate the Creative Commons Attribution - Non Commercial (unported, v3.0) License.
By accessing the work you hereby accept the Terms. Non-commercial uses of the work are permitted without any further permission from Dove Medical Press Limited, provided the work is properly attributed. For permission for commercial use of this work, please see paragraphs 4.2 and 5 of our Terms.
© 2020 The Author(s). This work is published and licensed by Dove Medical Press Limited. The full terms of this license are available at https://www.dovepress.com/terms.php and incorporate the Creative Commons Attribution - Non Commercial (unported, v3.0) License.
By accessing the work you hereby accept the Terms. Non-commercial uses of the work are permitted without any further permission from Dove Medical Press Limited, provided the work is properly attributed. For permission for commercial use of this work, please see paragraphs 4.2 and 5 of our Terms.