")
Back to Journals » Journal of Inflammation Research » Volume 16
Quercetin is a Potential Therapy for Rheumatoid Arthritis via Targeting Caspase-8 Through Ferroptosis and Pyroptosis
Authors Zheng Q , Wang D, Lin R , Chen Y, Xu Z, Xu W
Received 9 September 2023
Accepted for publication 14 November 2023
Published 1 December 2023 Volume 2023:16 Pages 5729—5754
DOI https://doi.org/10.2147/JIR.S439494
Checked for plagiarism Yes
Review by Single anonymous peer review
Peer reviewer comments 2
Editor who approved publication: Professor Ning Quan
Qingcong Zheng,1,* Du Wang,2,* Rongjie Lin,3,* Yuchao Chen,4 Zixing Xu,1 Weihong Xu1
1Department of Orthopedics, The First Affiliated Hospital of Fujian Medical University, Fuzhou, People’s Republic of China; 2Arthritis Clinical and Research Center, Peking University People’s Hospital, Beijing, People’s Republic of China; 3Department of Orthopedic Surgery, Fujian Medical University Union Hospital, Fuzhou, People’s Republic of China; 4Department of Paediatrics, Fujian Provincial Hospital South Branch, Fuzhou, People’s Republic of China
*These authors contributed equally to this work
Correspondence: Zixing Xu; Weihong Xu, Email [email protected]; [email protected]
Background: Rheumatoid arthritis (RA) is one of the most common chronic inflammatory autoimmune diseases. However, the underlying molecular mechanisms of its pathogenesis are unknown. This study aimed to identify the common biomarkers of ferroptosis and pyroptosis in RA and screen potential drugs.
Methods: The RA-related differentially expressed genes (DEGs) in GSE55235 were screened by R software and intersected with ferroptosis and pyroptosis gene libraries to obtain differentially expressed ferroptosis-related genes (DEFRGs) and differentially expressed pyroptosis-related genes (DEPRGs). We performed Gene Ontology (GO), Kyoto Encyclopedia of the Genome (KEGG), ClueGO, and Protein-Protein Interaction (PPI) analysis for DEFRGs and DEPRGs and validated them by machine learning. The microRNA/transcription factor (TF)-hub genes regulatory network was further constructed. The key gene was validated using the GSE77298 validation set, cellular validation was performed in in vitro experiments, and immune infiltration analysis was performed using CIBERSORT. Network pharmacology was used to find key gene-targeting drugs, followed by molecular docking and molecular dynamics simulations to analyze the binding stability between small-molecule drugs and large-molecule proteins.
Results: Three hub genes (CASP8, PTGS2, and JUN) were screened via bioinformatics, and the key gene (CASP8) was validated and obtained through the validation set, and the diagnostic efficacy was verified to be excellent through the receiver operating characteristic (ROC) curves. The ferroptosis and pyroptosis phenotypes were constructed by fibroblast-like synoviocytes (FLS), and caspase-8 was detected and validated as a common biomarker for ferroptosis and pyroptosis in RA, and quercetin can reduce caspase-8 levels. Quercetin was found to be a potential target drug for caspase-8 by network pharmacology, and the stability of their binding was further verified using molecular docking and molecular dynamics simulations.
Conclusion: Caspase-8 is an important biomarker for ferroptosis and pyroptosis in RA, and quercetin is a potential therapy for RA via targeting caspase-8 through ferroptosis and pyroptosis.
Keywords: rheumatoid arthritis, ferroptosis, pyroptosis, caspase-8, quercetin
Introduction
Rheumatoid arthritis is a chronic inflammatory autoimmune disease characterized by persistent synovitis and can destroy bone and cartilage tissue, leading to joint damage, chronic disability, and a shortened life span.1–3 The global prevalence of RA is approximately 1%.4 The underlying molecular mechanism of its pathogenesis is still unknown, and the onset and progression of the disease are closely related to a variety of factors (genetic, environmental, and immunologic), among which an abnormal infiltration of immune cells has a significant impact on RA.5,6 Although significant progress has been made with several targeted immunotherapies,3 the limited therapeutic efficacy prompts us to investigate alternative pathogenic mechanisms and pathways, among which programmed cell death (PCD) is an innovative and major breakthrough. The imbalance of cell death in FLS and immune cell populations and the release of inflammatory cytokines ultimately promote synovitis, contributing to the RA’s deterioration.7 Apoptosis,8 autophagy,9 NETosis,10 necroptosis,11 ferroptosis,12 and pyroptosis13 are PCDs affecting the initiation and development of RA. RA may be an outcome of the interaction of multiple PCDs, and few studies have examined how ferroptosis and pyroptosis interact to exacerbate the course of RA. Thus, our study is looking for common disease targets.
Ferroptosis is an iron-dependent PCD14 characterized by the interaction between iron and lipid peroxides to produce reactive oxygen species (ROS).15 Studies have shown that RA disrupts iron metabolism and has iron deposits in the synovial tissue absent in healthy synovium.16 Oxidative stress and lipid peroxidation reduce Fe3+ to Fe2+ and the production of free radicals (-OH, RO-), leading to cellular volume expansion and plasma membrane rupture.17 It has been demonstrated that there is a significant positive correlation between the ROS level and the severity of RA.18 Additionally, immune cells that undergo ferroptosis may release proinflammatory cytokines that eventually trigger and worsen inflammatory disorders.19 Therefore, ferroptosis may be a key driver of autoimmune and inflammatory diseases.20 Pyroptosis is also a newly discovered type of PCD,21 characterized by pore formation, cell enlargement, and plasma membrane rupture.22 Pyroptosis exacerbates the disorders by inducing plasma membrane rupture and release of inflammatory cytokines in cells with RA via the inflammasome signaling pathway,23 in which caspase proteins play a crucial role.24
Quercetin is a natural flavonoid with potent antioxidant and anti-inflammatory activity.25 In both human and animal models of rheumatoid arthritis, studies have demonstrated that quercetin reduces symptoms and delays disease progression.26 Additionally, quercetin can alleviate seizures,27 acute kidney injury,28 liver injury,29 and intestinal injury30 by inhibiting ferroptosis. Quercetin also attenuates atherosclerosis,31 cardiomyopathy,32 lung injury,33 and kidney injury34 by inhibiting pyroptosis. Therefore, quercetin might be an ideal drug for RA by targeting ferroptosis and pyroptosis. Our study identified a common biomarker of ferroptosis and pyroptosis in RA through bioinformatics, in vitro experimental validation, and a potential drug targeting ferroptosis and pyroptosis by network pharmacology and computer-aided drug design (CADD), which will provide new insights for experimental study and clinical diagnosis and treatment.
Methodology
Data Collection and Processing
Two datasets for RA were included, GSE5523535 and GSE77298,36 which were screened using the National Center for Biotechnology Information (NCBI) Gene Expression Omnibus (GEO) (https://www.ncbi.nlm.nih.gov/geo/) as shown in Table 1. The GSE55235 dataset contains synovial tissue samples from 10 patients with rheumatoid arthritis and 10 normal subjects for deg identification. The GSE77298 dataset contains synovial tissue samples from 16 rheumatoid arthritis patients and 7 normal subjects to validate the hub genes. From the FerrDb database (http://www.zhounan.org/ferrdb/current/),37 382 ferroptosis-related genes (FRGs) were obtained, including 150 driver genes, 109 suppressor genes, and 123 marker genes. In addition (Table S1), 442 genes associated with ferroptosis were searched in the genecards database (https://www.genecards.org/) (Table S2).38 The integration of these two gene banks screened 592 FRGs. The GeneCards database was applied to acquire the 254 pyroptosis-related genes (PRGs) (Table S3).
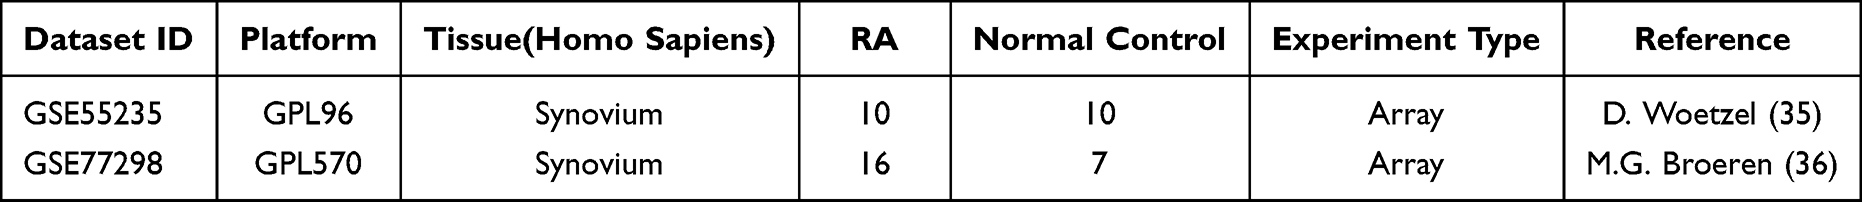 |
Table 1 Basic Information of Selected Datasets |
Identification of DEGs, DEFRGs, and DEPRGs
The empirical Bayesian approach of the limma R package (http://www.bioconductor.org/packages/release/bioc/html/limma.html)39 was used to normalize GSE55235 and GSE77298 after standardization and setting |log2 FC| > 0.5 and P<0.05 to obtain DEGs of synovial tissues from RA in the 2 datasets. The ggplot2 package was used to plot the volcano map for both datasets.40 DEFRGs were created by intersecting RA-DEGs and FRGs, and DEPRGs were created by intersecting RA-DEGs and PRGs. DEFRGs and DEPRGs in GSE55235 were expressed using a clustered heat map. The data were analyzed by three methods: Principal Component Analysis (PCA), Uniform Manifold Approximation and Projection (UMAP), and t-distributed Stochastic Neighbour Embedding (t-SNE) dimensionality reduction using unsupervised clustering methods of the stats package, UMAP package, and Rtsne package in R software.
GO, KEGG, and ClueGO Enrichment Analyses
The “clusterProfiler” R package was used to run GO and KEGG enrichment analyses for DEFRGs and DEPRGs to investigate the found genes’ route and function (P < 0.05 and FDR < 0.25).41 ClueGO, a commonly used enrichment tool in Cytoscape software, employs the kappa method to visualize functional pathways in gene sets, enabling the construction of interactive gene network maps and the analysis of the potential functions of DEFRGs and DEPRGs.
PPI Network and CytoHubba Analysis
The STRING database (https://string-db.org/)42 was utilized to develop a PPI network, and the Cytoscape platform43 was used to construct and view it. The MCODE plug-in was applied for the PPI network module analysis. The DEFRGs and DEPRGs were computed using the Degree algorithm in the CytoHubba tool to find the top 10 high-scoring genes and visualize them by Cytoscape mapping.
Identification of Hub Genes and Machine Learning Validation
The top 10 genes of each of the DEFRGs and DEPRGs were taken to intersect to get the hub genes, and the expression of the hub genes was verified in GSE55235 using the joy plot and violin plot. In the ANN training model, the expression data of hub genes were transformed into “gene scores” using the min-max normalization method, and the neural network was constructed by the “NeuralNetTools” and “neuralnet” packages in R software.44 The ANN consists of an input layer (gene scores of candidate genes), a hidden layer (creating 5 hidden nodes and using modified linear units as activation functions), and an output layer (2 nodes: HC and RA). The gene weights in the hidden layer are multiplied by the corresponding gene expression to obtain the sum of the disease classification scores. Constructing ANN models for hub genes to determine phenotypic accuracy.
Construction of microRNA/TF-Hub Genes Regulatory Network
MicroRNA/TF-hub genes networks were constructed utilizing NetworkAnalyst (https://www.networkanalyst.ca/).45 The computational background of microRNA for hub genes was performed using the miRTarBase v8.0 and TarBase v8.0 databases, while the ENCODE and JASPAR databases were used for TF. The output is processed and plotted using Cytoscape for first-order and minimum networks.
Pathway Enrichment Analysis of Hub Genes
Metascape (https://metascape.org/gp/index.html#/main/step1)46 is a gene function enrichment platform that brings together 40 databases and sets P < 0.01, a minimum count of 3, and an enrichment factor > 1.5 to group genes into clusters to capture potential relationships between clusters further. GeneMANIA (http://www.genemania.org)47 integrates multiple databases from BioGRID and Pathway Commons and can predict the functional pathways by which hub genes interconnect with the most relevant genes. SPEED2 (https://speed2.sys-bio.net/)48 was able to probe the upstream relevant signaling pathways of hub genes; the genetic background was from human cell line pathway perturbation experiments, and the crosstalk of hub genes with 16 classical signaling pathways was assessed based on the magnitude of the P-value.
Validation of Hub Genes and Identification of Key Gene
The key gene was obtained by intersecting DEGs (GSE77298), DEFRGs, and DEPRGs, and the expression of the key gene in the validation set is shown in a box plot. ROC curves were used to validate diagnostic efficacy and verify the sensitivity and specificity of key genes, with AUC > 0.70 being diagnostically significant.
In vitro Experiments and Treatments
Immortalization of Synovial Fibroblasts in Human Rheumatic Joints (iCell-008a) was purchased from iCell Bioscience Inc., Shanghai. The iCell primary fibroblast culture system (priMed-iCell-003) was used as the medium for culturing FLS in vitro. The culture flasks were placed in a humidified incubator at 37°C, 5% CO2 for static incubation, and the medium was changed every 2 days until the cells reached the desired adherent growth state. We took logarithmic growth phase cells, adjusted the cell density, inoculated them into 6-well cell culture plates, and cultured them in a normal incubator with 5% CO2 for 24 h. The cells were treated in the following groupings. Control group: cultivation with complete medium; Ferroptosis group: pre-treatment with 1 μm RSL3 (MCE, HY-100218A) was added for 8 h, and incubation was continued for 24 h. Pyroptosis group: incubation was performed with 4 μm Polyphyllin VI (MCE, HY-N0816) for 24 h. Ferroptosis+pyroptosis group: After adding 1 μm RSL3 for 8 h of pre-treatment, 4 μm Polyphyllin VI was added for 24 h of incubation. Ferroptosis+quercetin group: after adding 1 μm RSL3 pre-treatment for 8h, continue to add 100 μm quercetin (MCE, HY-18085) and incubate for 24h. Pyroptosis+quercetin group: incubation was performed with 4 μm Polyphyllin VI and 100 μm quercetin for 24 h. Ferroptosis+pyroptosis+quercetin group: After adding 1 μm RSL3 for 8 h of pre-treatment, 4 μm Polyphyllin VI and 100 μm quercetin were added for 24 h of incubation. To ensure the reliability of the results, we tested the Control group and Ferroptosis+pyroptosis group in corresponding concurrent periods according to the time of phenotype formation in the Ferroptosis group and Pyroptosis group. In the quercetin-related studies, we re-experimented with the seven groups mentioned above: Control, Ferroptosis, Ferroptosis+quercetin, Pyroptosis, Pyroptosis+quercetin, Ferroptosis+pyroptosis and Ferroptosis+pyroptosis+quercetin groups.
Reverse Transcription-Quantitative PCR (RT-qPCR)
(1) RNA extraction. The four groups were rinsed with 1 mL, 4°C of pre-cooled PBS solution, added 1 mL of TRIpure Total RNA Extraction Reagent (EP013) and a series of other treatments, and then added 10 μL of RNase-Free Water to dissolve the RNA fully. (2) First-strand cDNA synthesis. The M-MLV Reverse Transcriptase kit (ELK Biotechnology, EQ002) was used. (3) RT-qPCR. Primers H-GAPDH and H-caspase-8 are shown in Table 2. A StepOne™ Real-Time PCR instrument was used with the QuFast SYBR Green PCR Master Mix kit. A total reaction volume of 10 µL was prepared prior to amplification, which included 5.0 μL 2× Master Mix, 1.0 μL Primer Working Solution (2.5 μm), 1.0 μL Template, 2.0 μL ddH2O, and 1.0 μL Rox. After pre-denaturation at 95°C for 1 min, 40 thermal cycles were performed, and melting curves were recorded. Quantification was performed using the 2−ΔΔCT method.49
 |
Table 2 Primer Sequences Used for Reverse Transcription-Quantitative PCR |
Analysis of Immune Cell Infiltration
The CIBERSORT algorithm (http://CIBERSORT.stanford.edu/)50 is a linear support vector regression-based method for assessing the composition and number of immune cells in the RA and HC groups. The ggplot2 package was used to illustrate the distribution of LM22, while the corrplot package was used to exhibit the correlation of LM22. Person correlation coefficients were used to analyze the relationship between key genes and immune cell abundance.
Quercetin-Related Targets
We used The Comparative Toxicogenomics Database (CTD, http://ctdbase.org/),51 the TCMSP database (https://old.tcmsp-e.com/tcmsp.php),52 the GeneCards database, and the CHEMBL database (https://www.ebi.ac.uk/chembl/)53 to find potentially relevant genes for quercetin (Supplementary Material has been uploaded to GitHub). The quercetin and key genes were further analyzed using molecular docking and molecular dynamics simulations.
Molecular Docking
The crystal structure of quercetin was downloaded from the PubChem database (https://pubchem.ncbi.nlm.nih.gov/)54 as a docking ligand, and the crystal structure of the key gene-expressed protein was downloaded from the PDB database (https://www.rcsb.org/)55 as a docking acceptor. The Maestro software from the Schrödinger 2022–3 software package was used for this molecular docking. The charge state and the energy minimum conformation of quercetin in the physiological environment were calculated by the LigPrep module. The target proteins were optimized using the Protein Preparation Wizard in Maestro, and the eutectic complexes and the complex systems of target molecules and proteins were finely prepared using the protein-preparation workflow module. The lattice files defining the docking pockets were generated by the Receptor Grid Generation module in Maestro, and the center of mass of the eutectic ligand of the crystal structure was selected as the center of the active pocket and calculated to generate the lattice files. Finally, molecular docking was performed by the SP precision algorithm of the Glide docking module. The complexes obtained by docking were used as initial conformations for subsequent molecular dynamics simulations.
Molecular Dynamics Simulation
MDS of quercetin-target protein complexes was performed using the Desmond program. First, each complex system was dissolved separately in an SPC solvent box with a period boundary size of 10*10*10Å using the System Builder module to form the complex-solvent system. Second, adding a certain amount of Na+/Cl− balances the system charge. Finally, OPLS4 was chosen to simulate the force field. After completing the setup of the simulation system, we used the Molecular Dynamics module for formal simulations. Before the simulation, the simulation temperature was set to 300 K, and the pressure to 1.01325 bar, and a 100 ns NPT simulation was performed (energy was recorded every 1.0 ps, orbital atomic coordinates were monitored every 20 ps, and a total of 5000 frames of conformation were output). The behavior of quercetin and target proteins was analyzed using the Simulation Interaction Diagram tool in Desmond software, and root-mean-square deviation (RMSD) and root-mean-square fluctuation (RMSF) calculations throughout the simulation were output.
The flowchart of this study is shown in Figure 1, and all raw data has been uploaded to GitHub, which is HTTPS (https://github.com/zheng5862/zheng5862.git).
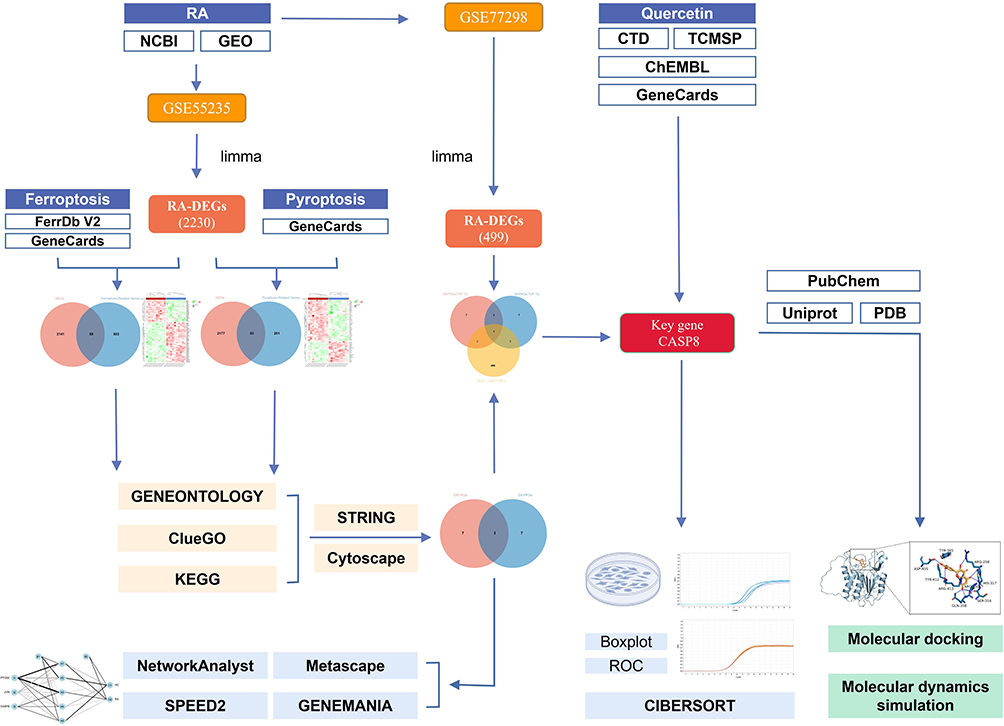 |
Figure 1 Schematic diagram of the workflow of this study. |
Results
Processing of Datasets and Identification of DEGs
The GSE55235 dataset includes 2230 DEGs, comprising 1279 upregulated genes and 951 downregulated genes. The GSE77298 dataset contains 499 DEGs, comprising 233 upregulated genes and 266 downregulated genes. The DEGs of the 2 datasets were presented using volcano plots (Figure 2). The RA-DEGs intersected with 592 FRGs to obtain 89 DEFRGs (Figure 3A). The RA-DEGs intersected with 254 PRGs to obtain 53 DEPRGs (Figure 3B). In the DEFRGs of GSE55235, 27 genes were upregulated, and 62 genes were downregulated. In the DEPRGs of GSE55235, 35 genes were upregulated, and 18 were downregulated. Using the clustering heat map, the distribution of up and down-regulated genes for 89 DEFRGs and 53 DEPRGs was readily visible (Figure 3C and D). PCA analysis of DEFRGs in GSE55235 showed PC1 (58.19%) and PC2 (7.02%), UMAP and tSNE plots showed significant classification of RA and control groups; PCA analysis of DEPRGs in GSE55235 showed PC1 (58.42%) and PC2 (8.27%), UMAP and tSNE plots showed significant categorization of RA and control groups (Figure 4A and B).
 |
Figure 2 Identification of RA-DEGs. Yellow dots indicate genes expressed in synovial tissues of RA and HC groups that were not significantly different (P > 0.05); red triangles represent genes upregulated in RA (P < 0.05); and blue triangles represent genes down-regulated in RA (P < 0.05). |
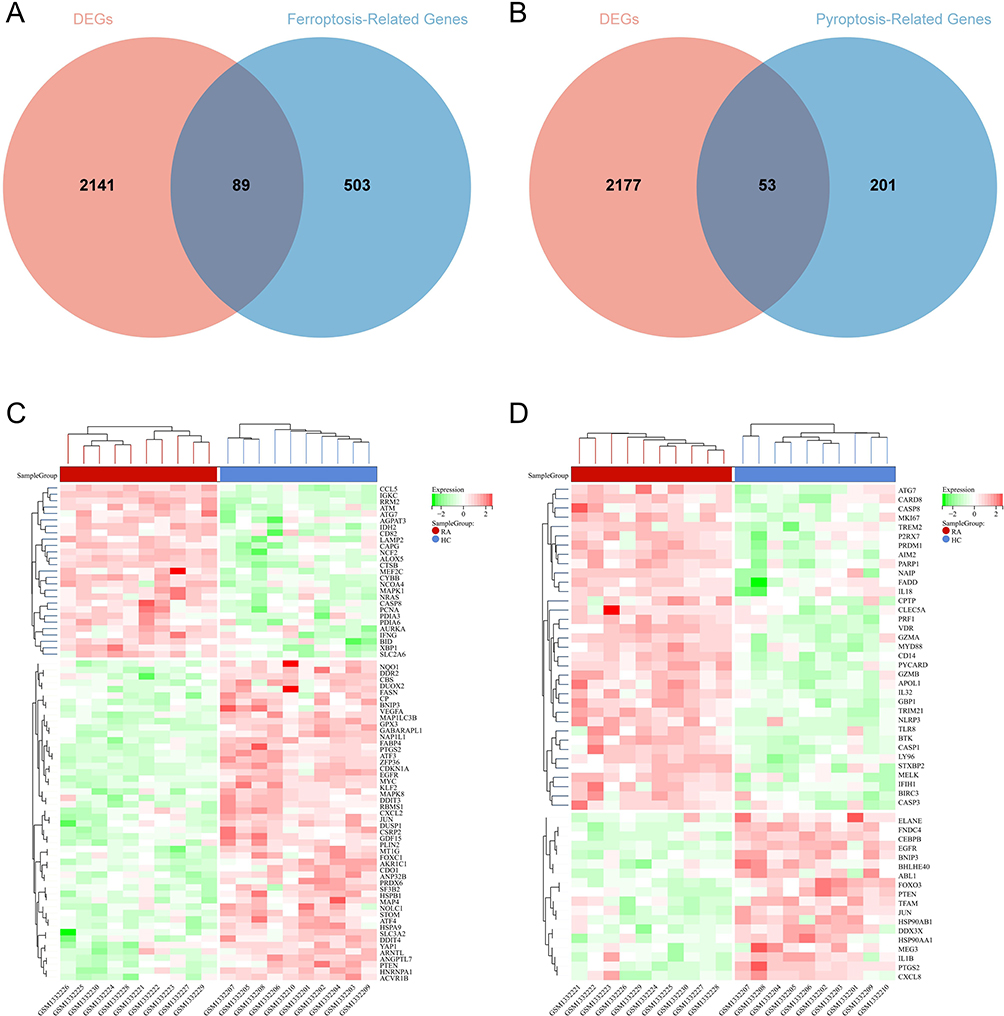 |
Figure 3 Screening of DEFRGs and DEPRGs. (A) Venn diagram of RA-DEGs of GSE55235 with ferroptosis-related genes; (B) Venn diagram of RA-DEGs of GSE55235 with pyroptosis-related genes; (C and D) Aggregated heat map distribution of 89 DEFRGs and 53 DEFRGs in GSE55235. The RA group is in red, the HC group is in blue, and the expression profiles from green to red indicate elevated gene expression, with green being down-regulated genes and red being upregulated genes. |
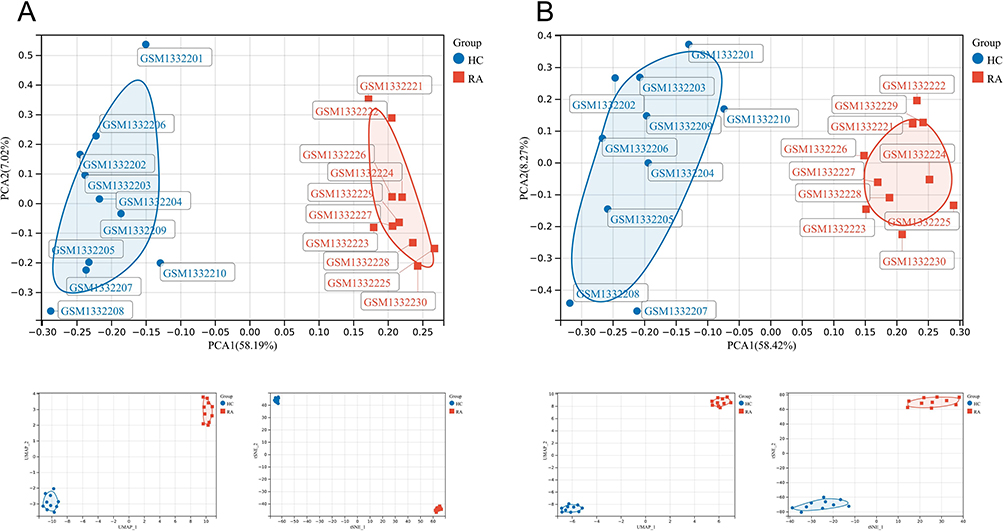 |
Figure 4 (A and B) shows the PCA, UMAP, and tSNE 3 data downscaling analyses for DEFRGs and DEPRGs, respectively. |
Functional Enrichment Analyses of DEFRGs and DEPRGs
In the GO analysis of DEFRGs, the biological process class (BP) was enriched in response to oxidative stress (Figure 5A); the cell formation class (CC) was enriched in a vesicle (Figure 5B); and the molecular function class (MF) was enriched in enzyme binding, oxidoreductase activity (Figure 5C). In the GO analysis of DEPRGs, BP was enriched in response to stress, immune system processes, and cytokine production (Figure 5D); CC was enriched in inflammasome complex, NLRP3, AIM2 inflammasome complex, and death-inducing signaling complex (Figure 5E); and MF was enriched in enzyme binding, cytokine receptor binding, death receptor binding, and cytokine-type endopeptidase regulator involved in apoptotic activities (Figure 5F). In the KEGG analysis, DEFRGs were enriched in ferroptosis, autophagy, mitophagy, apoptosis, and the FoxO signaling pathway (Figure 5G); DEPRGs were enriched in the NOD-like receptor signaling pathway, the IL-17 signaling pathway, the NF-kB signaling pathway, and the Toll-like receptor signaling pathway (Figure 5H). From the ClueGO analysis, it can be seen that DEFRGs were enriched in rheumatoid arthritis, ferroptosis, autophagy, mitophagy, the TNF signaling pathway, and the IL-17 signaling pathway (Figure 5I); DEPRGs were enriched in programmed cell death, pyroptosis, inflammasomes, NLR signaling pathways, the NLRP3 inflammasome, the AIM2 inflammasome, NF-κB activation through the FADD/RIP-1 pathway mediated by caspase-8 and −10, caspase activation via death receptors in the presence of ligand, caspase activation via extrinsic apoptotic signaling pathway and interleukin signaling (Figure 5J).
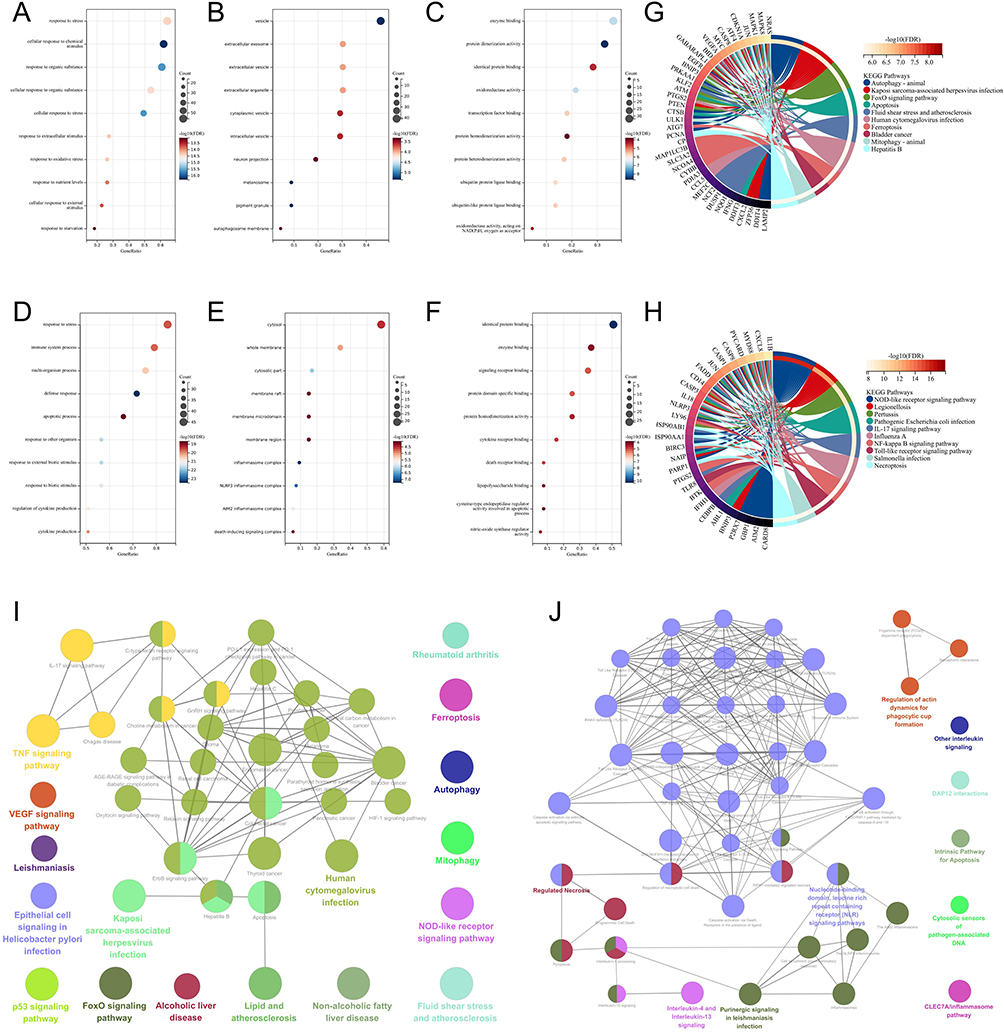 |
Figure 5 Pathway enrichment analysis of DEFRGs and DEPRGs. (A-C) show BP, CC, and MF analyses in GO for DEFRGs, respectively; (D-F) show BP, CC, and MF analyses in GO for DEPRGs, respectively; (G and H) shows KEGG analyses for DEFRGs and DEPRGs, respectively; and (I and J) below are ClueGO analyses for DEFRGs and DEPRGs, respectively. |
Identification of Hub Genes
The PPI network of DEFRGs has 88 nodes and 356 edges (Figure 6A). CytoHubba identified the top 10 genes, including JUN, MYC, PTEN, EGFR, VEGFA, MAPK8, CASP8, MAPK1, PTGS2, and ATM (Figure 6B, Table 3). 52 nodes and 332 edges made up the PPI network of DEPRGs (Figure 6C). CytoHubba identified the top 10 genes as IL1B, CASP8, JUN, MYD88, CXCL8, CASP1, PTGS2, NLRP3, CASP3, and IL18 (Figure 6D, Table 4). These 2 sets of top 10 genes intersect as hub genes (CASP8, PTGS2, and JUN) (Figure 7A). We visualized the expression distribution and expression level of hub genes by joy plot and split-face violin plot (Figure 7B and C). CASP8 was substantially more expressed in RA than in the HC group, but the opposite was true for JUN and PTGS2 (P < 0.05). Our validation of hub genes in GSE55235 using ANN found that the model test was excellent (Figure 7D).
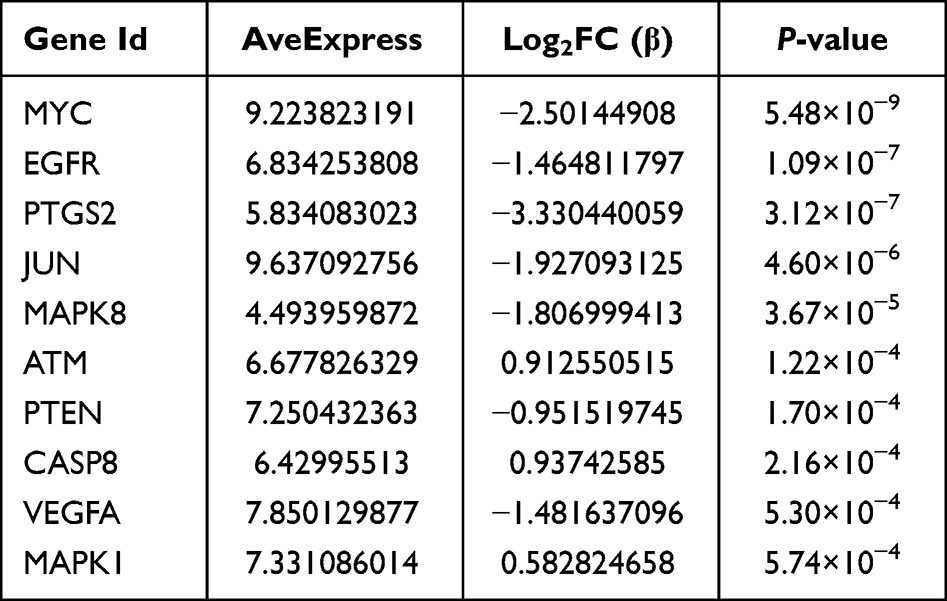 |
Table 3 Information of the 10 Hub Genes (DEFRGs) |
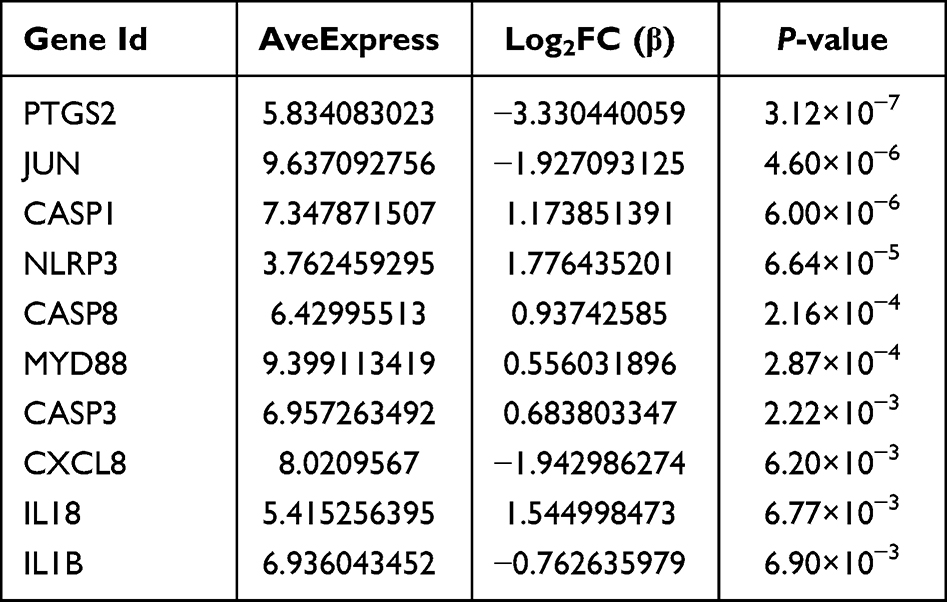 |
Table 4 Information of the 10 Hub Genes (DEPRGs) |
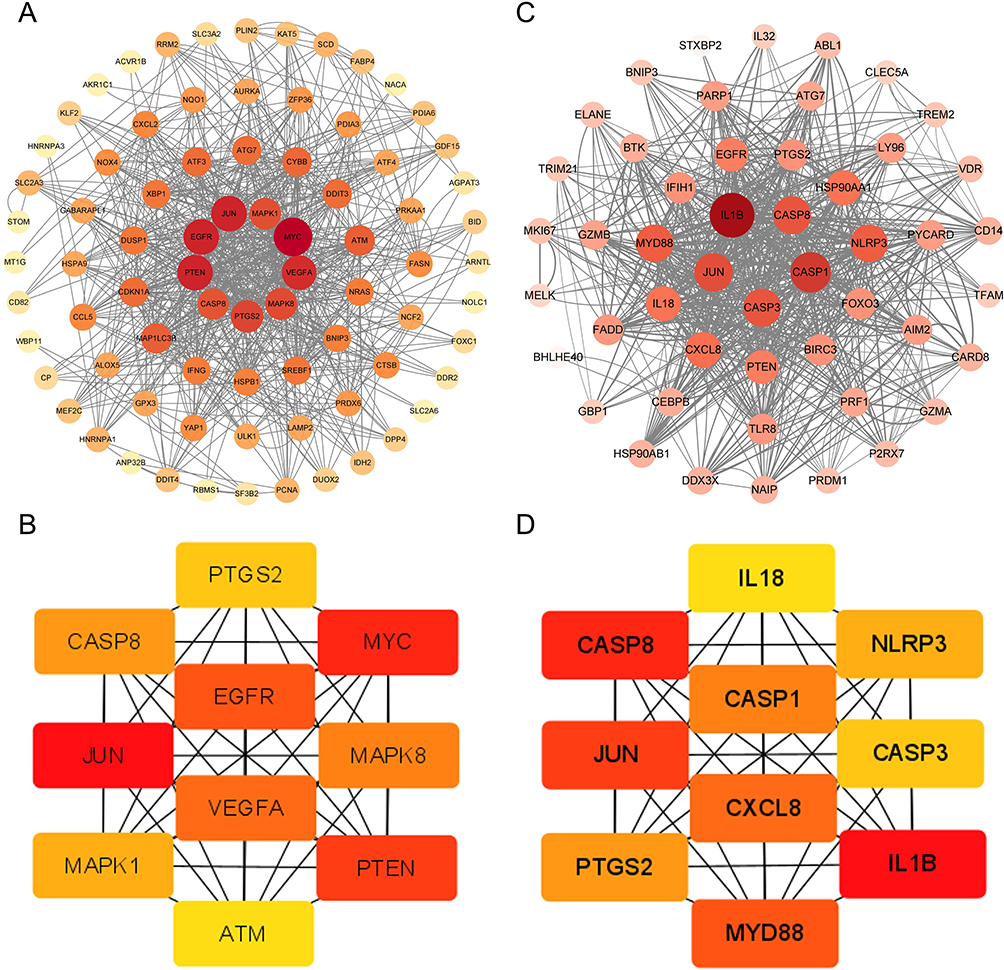 |
Figure 6 Screening of candidate hub genes. (A) The PPI network of DEFRGs has 88 nodes and 356 edges. (B) DEFRGs screened the top 10 candidate hub genes by Degree algorithm. (C) The PPI network of DEPRGs has 52 nodes and 332 edges. (D) DEPRGs screened the top 10 candidate hub genes by Degree algorithm. |
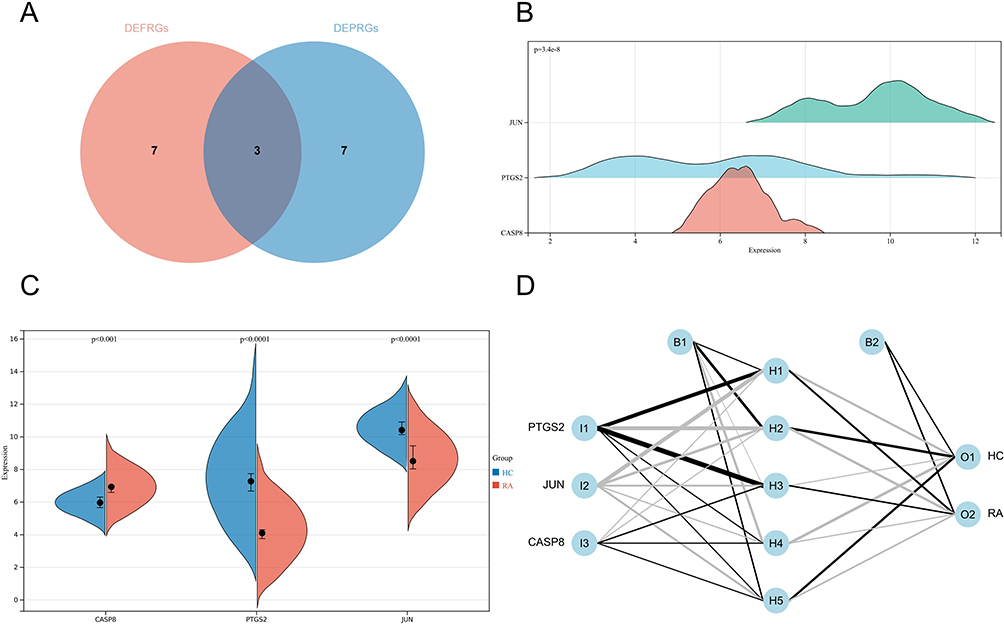 |
Figure 7 (A) Screening of hub genes; (B) Expression distribution of hub genes in the RA group of GSE55235; (C) Differential expression of hub genes in the RA and HC groups of GSE55235 is shown by split-face violin plot, with red representing the RA group and blue representing the HC group; (D) ANN model showing the input layer, hidden layer, and output layer separately. |
MicroRNA/TF-Hub Genes Regulatory Network
The miRNA-hub genes network graph obtained from the miRTarBase database includes 101 nodes, 103 edges, and 3 seeds, and the streamlined minimum network includes 5 nodes, 5 edges, and 3 seeds (Figure 8A), which shows that hsa-mir-26b-5p is closely related to CASP8, PTGS2, and JUN. The miRNA-hub genes network graph obtained from the TarBase database includes 184 nodes, 230 edges, and 3 seeds, and the minimum network includes 4 nodes, 3 edges, and 3 seeds (Figure 8B), which shows that hsa-mir-16-5p is tightly linked to CASP8, PTGS2, and JUN. The network diagram of TF-hub genes obtained from the ENCODE database includes 90 nodes, 93 edges, and 3 seeds, and the minimum network includes 5 nodes, 4 edges, and 3 seeds (Figure 8C), which shows that SP3 is closely related to CASP8, JUN, and SAP30 is closely related to PTGS2, JUN. The network diagram of TF-hub genes obtained from the JASPAR database includes 30 nodes, 32 edges, and 3 seeds, and the minimum network includes 4 nodes, 3 edges, and 3 seeds (Figure 8D), which shows that GATA2 is associated with CASP8, PTGS2. Thus, 2 microRNAs (hsa-mir-26b-5p and hsa-mir-16-5p) and 3 TFs (SP3, SAP30, and GATA2) may play important roles in the expression of hub genes.
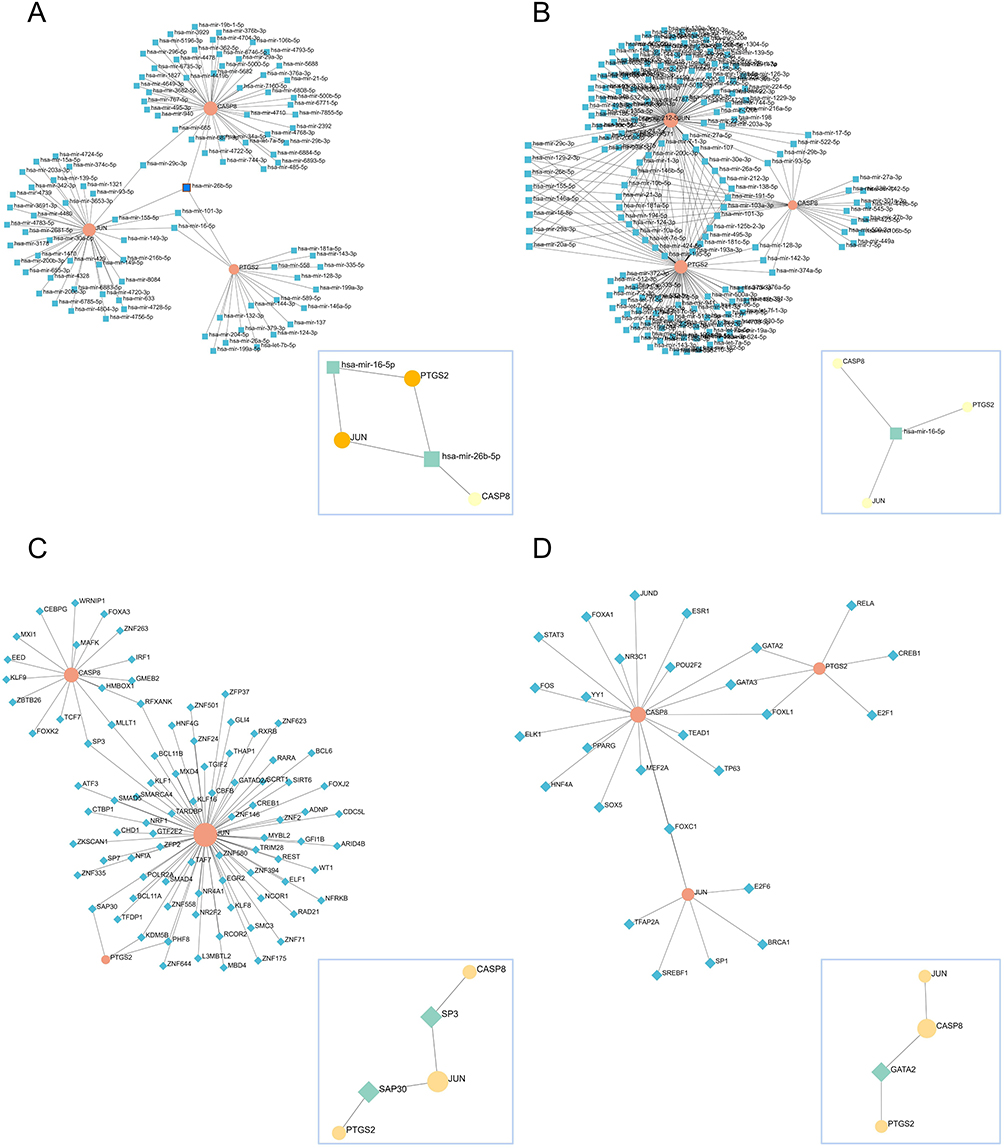 |
Figure 8 MicroRNA/TF regulatory network of hub genes. (A and B) MicroRNA: first-order network obtained from hub genes in the miRTarBase and TarBase databases, respectively, with the minimum network in the lower right corner; (C and D) TF: first-order network obtained from hub genes in the ENCODE and JASPAR databases, respectively, with the minimum network in the lower right corner. |
Pathway Enrichment Analysis of Hub Genes
Metascape analysis showed that hub genes were enriched in the IL-17 signaling pathway and visualized using network diagrams (Figure 9A). In GeneMANIA, the pathways between hub genes and the 20 most relevant genes were enriched in the regulation of apoptotic signaling pathway, positive regulation of cysteine-type endopeptidase activity, programmed necrotic cell death, mitochondrial outer membrane permeabilization involved in programmed cell death, IκB kinase/ NF-κB signaling, positive regulation of proteolysis, and regulation of cytokine-mediated signaling pathway (Figure 9B). Positive regulation of hub genes by Hypoxia and the MAPK+PI3K signaling pathways can be seen in SPEED2 (Figure 9C).
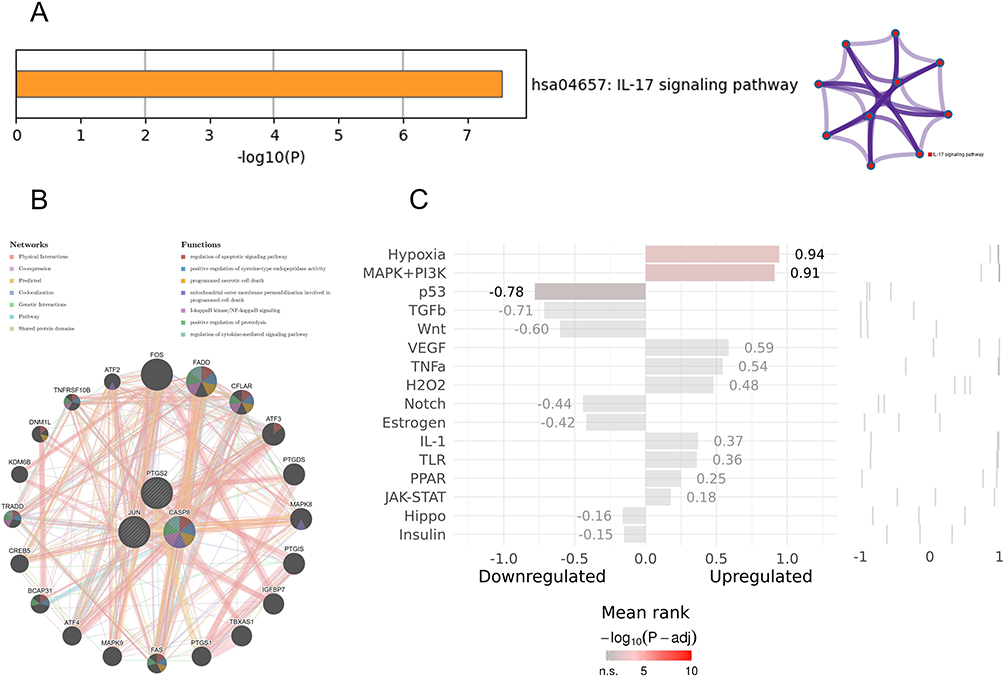 |
Figure 9 Enrichment analysis of hub genes. (A) Pathway and process richness analysis by Metascape and the corresponding network diagram; (B) Gene-gene interaction network of hub genes and the 20 most relevant genes detected by GeneMANIA database; (C) SPEED2 analysis of hub genes, with gray to red in the scale indicating elevated correlation. |
Identification of Key Gene
CASP8 was identified as a key gene by intersecting RA-DEGs of GSE77298 with the top 10 genes of DEFRGs/DEPRGs (Figure 10A). CASP8 was significantly higher expressed in the RA group compared to healthy controls in the GSE77298 dataset (P < 0.01) (Figure 10B). With excellent sensitivity and specificity, the AUC values of CASP8 in the GSE55235 and GSE77298 datasets were 0.94 (95% CI 0.84–1.00) and 0.86 (95% CI 0.69–1.00), respectively (Figure 10C).
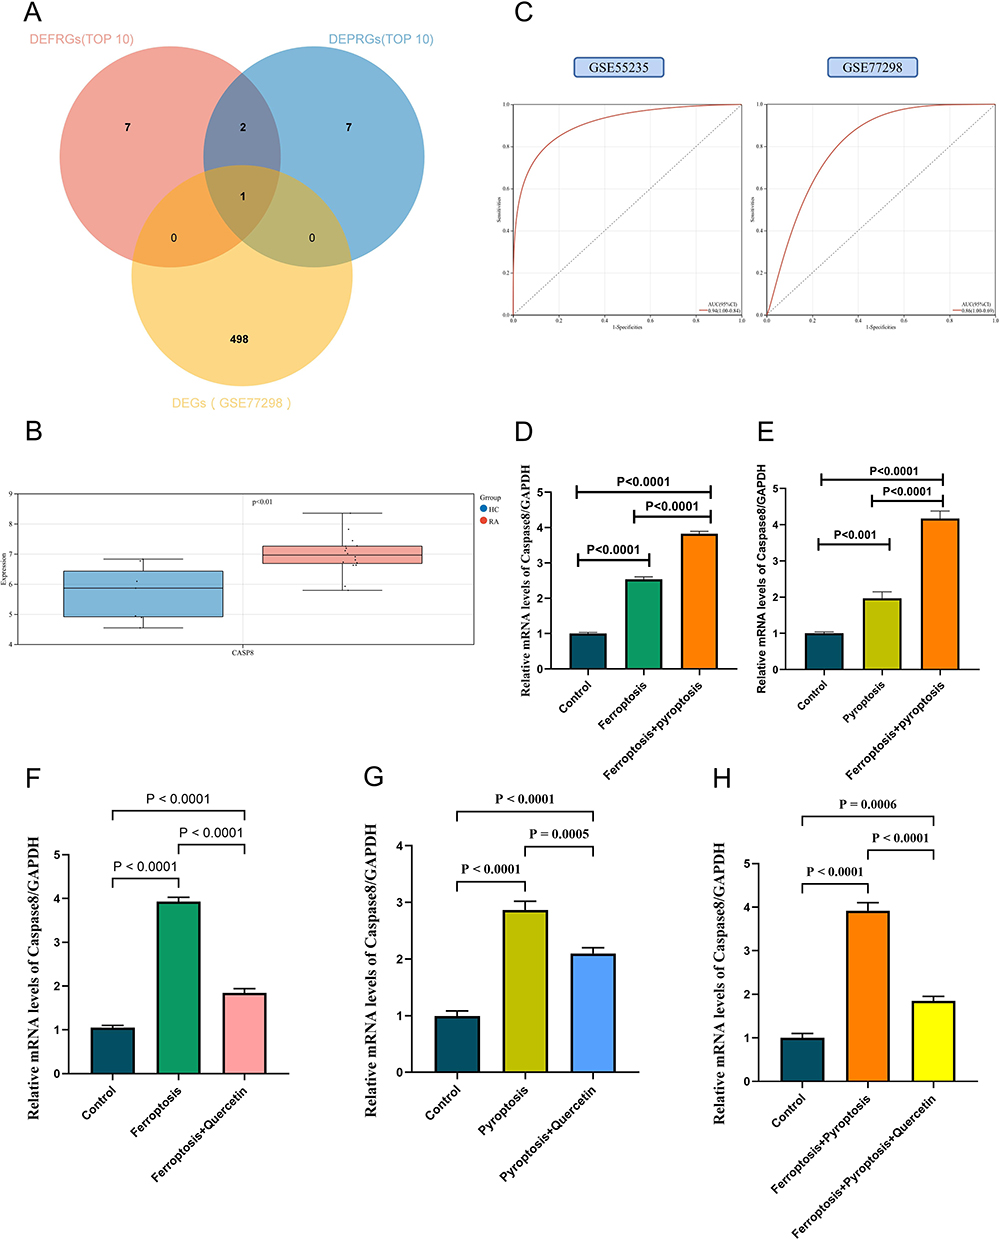 |
Figure 10 Identification and validation of key genes. (A) Further screening of key gene by GSE77298; (B) Expression of CASP8 in the validation set of GSE77298; red indicates the RA group, blue indicates the HC group; (C) Diagnostic validity of CASP8 was verified by ROC curve in GSE55235 and GSE77298; (D-H) In vitro experiments and RT-qPCR validation. In these bar plots, (D) the horizontal coordinates are control group, ferroptosis group, and ferroptosis+pyroptosis group; (E) the horizontal coordinates are control group, pyroptosis group, and ferroptosis+pyroptosis group; (F) the horizontal coordinates are control group, ferroptosis group and ferroptosis+quercetin group; (G) the horizontal coordinates are control group, pyroptosis group and pyroptosis+quercetin group; (H) the horizontal coordinates are control group, ferroptosis+pyroptosis group and ferroptosis+pyroptosis+quercetin group. The vertical coordinate is the relative mRNA levels of caspase-8/GAPDH. |
In vitro Validation of Key Gene
PCR-Amplification curves were attached to Figures S1-S5. The results of Figure 10D showed that in the ferroptosis phenotype constructed by adding RSL3 to FLS, caspase-8 level was significantly higher than that in the control group (P < 0.0001); in the ferroptosis+pyroptosis phenotypes constructed by adding RSL3 and Polyphyllin VI to FLS, caspase-8 level was significantly higher than that in the control group (P < 0.0001) and ferroptosis group (P < 0.0001) (Figure S1). Figure 10E shows that the level of caspase-8 in the pyroptosis phenotype constructed by adding Polyphyllin VI to FLS was significantly higher than that in the control group (P < 0.0001); in the ferroptosis+pyroptosis phenotypes constructed by adding RSL3 and Polyphyllin VI to FLS, caspase-8 level was significantly higher than that in the control group (P < 0.0001) and pyroptosis group (P < 0.0001) (Figure S2). These results suggest that caspase-8 is significantly more expressed than normal FLS in both the ferroptosis and pyroptosis phenotypes present. When both ferroptosis and pyroptosis phenotypes co-occur, caspase-8 is also more highly expressed than the ferroptosis alone or pyroptosis alone phenotypes. The possible reason for this is that caspase-8 is the common hub center of ferroptosis and pyroptosis, and the superposition of the two phenotypes is positively correlated with the expression of caspase-8. Figure 10F shows that the caspase-8 level was significantly reduced in the ferroptosis treatment model constructed by adding RSL3 and quercetin to FLS compared to the ferroptosis group (P < 0.0001) (Figure S3). Figure 10G shows that caspase-8 levels were significantly reduced in the pyroptosis treatment model constructed by adding Polyphyllin VI and quercetin to FLS compared to the pyroptosis group (P = 0.0005) (Figure S4). Figure 10H shows that caspase-8 levels were also significantly reduced in the ferroptosis+pyroptosis treatment model constructed with the addition of RSL3, Polyphyllin VI, and quercetin to FLS compared to ferroptosis+pyroptosis group (P < 0.0001) (Figure S5). Thus, quercetin can reduce caspase-8 levels in ferroptosis, pyroptosis, and ferroptosis+pyroptosis phenotypes constructed in FLS. Quercetin is a potential therapy for RA via targeting caspase-8 through ferroptosis and pyroptosis.
Immune Infiltration Analysis
We used the CIBERSORT method to map the proportions of 22 immune cells in RA samples in GSE55235 (Figure 11A). Differences in immune cell infiltration between the RA and HC groups were analyzed using a box plot (Figure 11B). The results demonstrated that 4 kinds of immune cells were enriched in RA: plasma cells, CD8+ T cells, memory-activated CD4+ T cells, and follicular helper T cells (Tfh) (P < 0.05). The relationship between the degree of LM22 infiltration in RA samples was further investigated by correlation matrix analysis (Figure 11C), and it was found that all 4 types of immune cells (plasma cells, CD8+ T cells, memory-activated CD4+ T cells, and Tfh) were positively correlated in RA (P < 0.05). According to the analysis of the Person correlation coefficient, only memory-activated CD4+ T cells (R=0.85, P=0.0018) and Tfh (R=0.69, P=0.03) among the above 4 types of immune cells were found to be correlated and positively correlated with CASP8 (Figure 11D). Memory-activated CD4+ T cells and Tfh were significantly higher expressed in RA with statistically significant results (P < 0.05). These results imply that CASP8 may be implicated in the pathogenesis of RA via modulating immune cell infiltration and that memory-activated CD4+ T cells and Tfh may play a significant role in this regard.
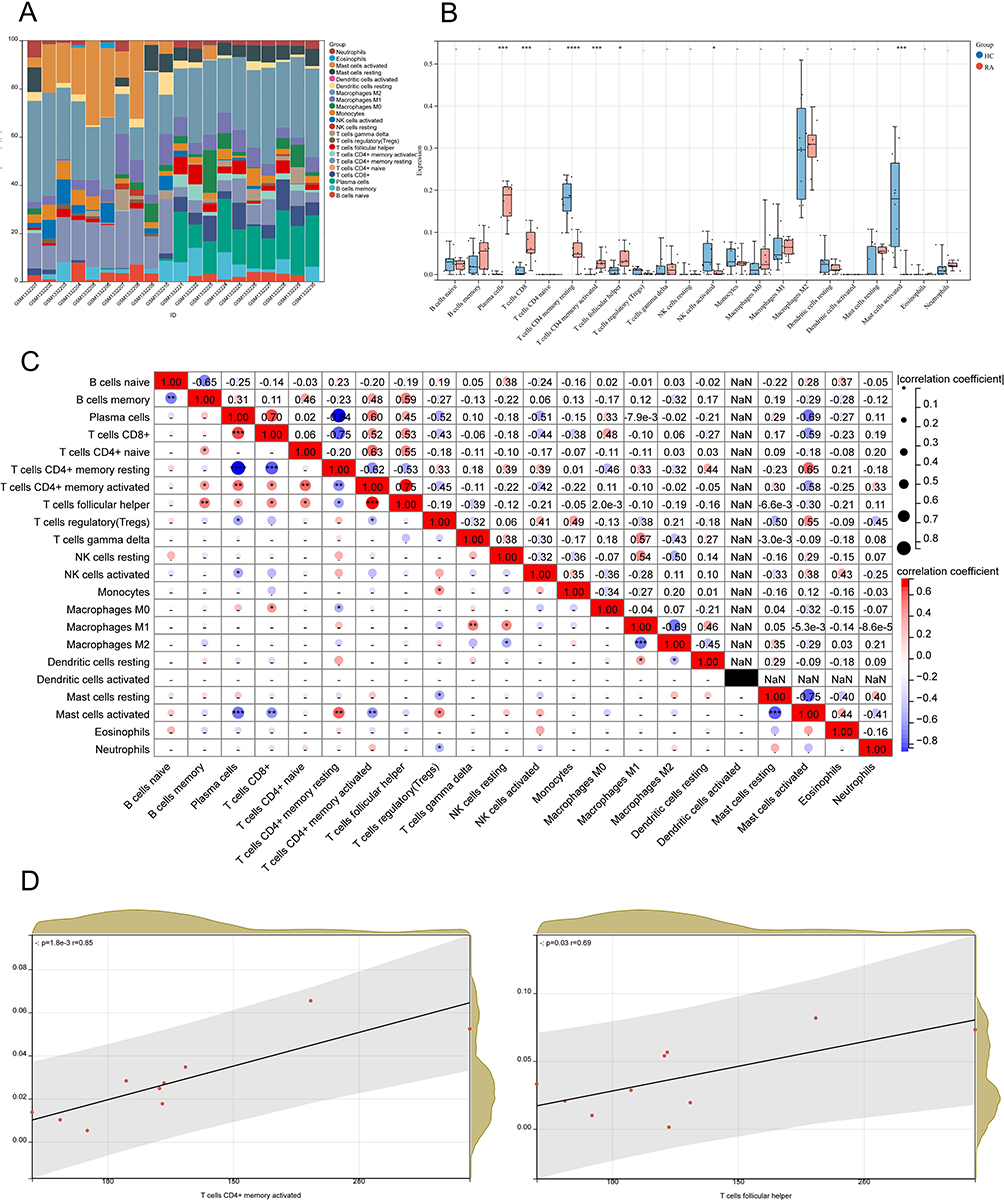 |
Figure 11 Analysis of immune cell infiltration. (A) The plot of the percentage of LM22 in RA samples using the CIBERSORT algorithm, where the horizontal coordinate is the sample and the vertical coordinate is the percentage of immune cells, and the legend shows the LM22 species; (B) Box plots of immuno-infiltrating cells in the RA versus HC groups, with the RA group in red and the HC group in blue (*P < 0.05,**P < 0.01,***P < 0.001, ****P < 0.0001); (C) Correlation matrix analysis between immune cells in RA groups. Both horizontal and vertical coordinates are LM22, with positive correlations in red and negative correlations in blue (*P < 0.05,**P < 0.01,***P < 0.001, ****P < 0.0001); (D) Correlation analysis of CASP8 expression with memory-activated CD4+ T cells and Tfh. |
Quercetin-Related Targets
Our results of extracting quercetin-related target genes from CTD, TCMSP, GeneCards, and CHEMBL databases and taking intersections with hub genes were only CASP8 and were in the top 34, 66, 76, and 122 of the four databases, respectively (Table S4).
Molecular Docking
Molecular docking predicts the conformation of quercetin within the caspase-8 target binding site and assesses binding affinity. We obtained quercetin’s 2D and 3D structures and the protein structure caspase-8 (PDB ID: 4JJ7) (Figure 12A-C). As seen in the interaction diagram of quercetin with caspase-8 (Figure 12D), quercetin binds in the internal cavity of the caspase-8 protein. We can see from the detailed diagram on the right that quercetin interacts with SER-316, ARG-260, ASP-455, ARG-258, ARG-413, GLY-318, HIS-317, GLN-358 on the caspase-8 in a hydrogen-bonding-related manner and with TYR-412, TYR-365 on the caspase-8 in a hydrophobic manner. These interactions underlie the maintenance of quercetin and caspase-8 binding. In addition, docking scoring showed −7.17 kcal/mol, implying that quercetin binds closely to caspase-8 protein.
 |
Figure 12 (A) 2D structure of quercetin molecule; (B) 3D structure of quercetin molecule; (C) 3D structure of caspase-8 protein; (D) Binding mode of quercetin and caspase-8 protein obtained based on molecular docking. The left figure shows the overall view, and the right figure shows the partial view, in which the Orange stick is the small molecule, the blue cartoon is the protein, the blue solid line indicates the hydrogen bonding interaction, and the gray dashed line indicates the hydrophobic interaction. |
Molecular Dynamics Simulation (100 Ns)
Considering that the complexes obtained by molecular docking can only observe the binding static information, MDS can further explore the dynamic nature, stability, and protein structural flexibility of quercetin-caspase-8 complexes, a deepening experiment in molecular docking technology. From the RMSD (Figure 13A), it can be observed that caspase-8 gradually converges and stabilizes within 15 ns. It is worth mentioning that the RMSD of the protein after convergence is around 3.5–4 Å. The high RMSD is due to the excessive loop regions in the structure of caspase-8 itself. The RMSD of quercetin was within 2 Å, indicating that quercetin did not break away from the active pocket of the protein, and the fluctuation of quercetin implied that there was a conformational change of the small molecule in the active pocket, but the fluctuation was within 1.5 Å. Therefore, we believe this fluctuation did not affect the overall binding conformation. From Figure 13B, it can be observed that the overall RMSF of caspase-8 is within 2 Å, implying that the protein is low in flexibility, and although the protein has a high number of loop regions (white areas), quercetin binds to the loop-enriched region, and this binding region is also within 1.5 Å. This result implies that the proteins in the binding region of the small molecule did not undergo large conformational changes and could exhibit dynamic stable binding. The intrinsic RMSF fluctuation of quercetin can be seen in Figure 13C. It is noteworthy that the RMSF of the dihydroxybenzene region is larger, implying that the flexibility of this part is greater, probably due to the presence of large variations in the dihedral angles 12-10-11-19 during the molecular dynamics simulations.
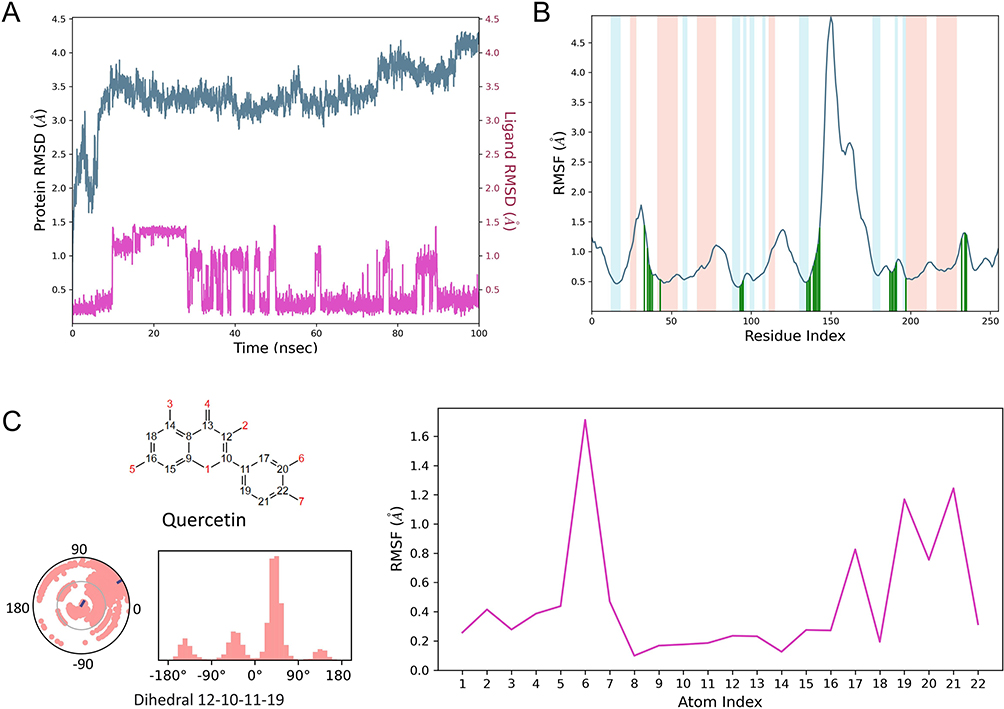 |
Figure 13 (A) RMSD of quercetin and caspase-8 during the simulation; (B) RMSF of caspase-8, with light red indicating the helix region, blue indicating the beta-sheet region, white indicating the loop region, and dark green indicating the small-molecule binding site (amino acid numbers in the horizontal coordinate plus 222 is the actual amino acid number); (C) RMSF plot of heavy atoms on Quercetin with a distribution of dihedral angles 12–10-11-19. |
Small molecules and proteins are motile in physiological environments, and we used MDS to simulate this dynamic pattern and observe amino acid interactions in the active pockets of quercetin and caspase-8 during movement. High-frequency water-bridging interactions between quercetin and GLY-318 and CYS-360 on caspase-8, as well as hydrogen-bonding interactions with ARG-260, ARG-413, TYR-365, and ASP-455, and cation-Pi interactions with ARG-413, can be observed from Figure 14A. In addition, we counted more detailed interaction forces and the amino acids with which the interactions occur. Quercetin interacts with SER-256, ARG-258, ASP-259, ARG-260, ASN-261, ASP-266, SER-316, HIS-317, GLY-318, GLN-358, ALA-359, CYS-360, GLY-362, ASP-363, ASN-364, TYR-365, GLN-366, VAL-410, SER-411, TYR-412, ARG-413, ASN-414, TRP-420, ASP-455, ASN-458 on caspase-8, forming around 8 stable interactions during the simulation, with a high frequency of interactions with amino acids ARG-258, TRP-420, ARG-260, TYR-365, ARG-413, and ASP-455 (above 0.4) (Figure 14B and C). Hydrogen bonding and water bridging are the main interaction forces between small molecules and amino acids in the pocket. These interactions suggest that quercetin and caspase-8 can bind dynamically and stably.
 |
Figure 14 (A) 3D/2D plot of quercetin and caspase-8 interaction during MDS. Purple lines indicate hydrogen-bonding interactions and red lines indicate water-bridging interactions; (B) Histogram of the percentage of quercetin and caspase-8 interactions during MDS. The cyan color indicates hydrogen bonding, the blue color indicates water-bridging, and the lavender color indicates hydrophobicity; (C) Heat map analysis of quercetin and caspase-8 interactions during MDS. |
We calculated the radius of gyration (rGyr), intramolecular HBs (intraHB), molecular surface area (MolSA), solvent accessible surface area (SASA), and polar surface area (PSA) of quercetin with time using kinetic simulation trajectories (Figure 15). The fluctuations in these properties are relatively stable, indicating that quercetin can maintain its basic physicochemical properties in the caspase-8 protein binding pocket and undergoes its active action with relatively consistent properties. In addition, the intraHB data show that small molecules can form an intramolecular hydrogen bonding interaction during the 100 ns simulation, contributing to the conformational stabilization of small molecules.
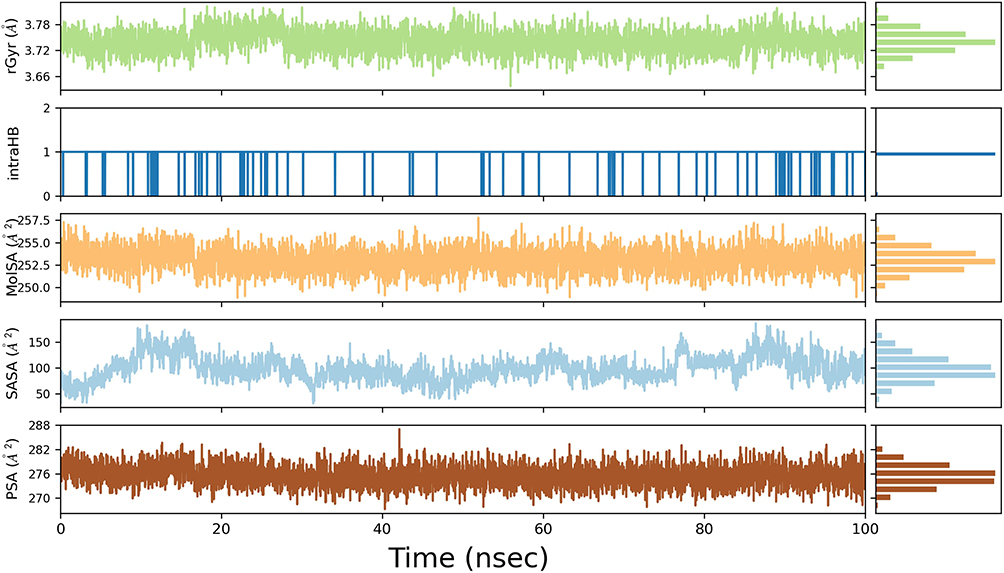 |
Figure 15 RGyr, intraHB, MolSA, SASA, PSA of quercetin/caspase-8 system over time during MDS. |
Discussion
The Relationship Between RA and Ferroptosis
Ferroptosis has a crucial regulatory function in autoimmune and chronic inflammatory disorders.19,20 Luo et al found that RSL3 (ferroptosis activator) induced synoviocyte ferroptosis and exacerbated synovitis.56 First, high iron ions inhibit the growth and activity of osteoblasts57 and activate the differentiation of osteoclasts, resulting in bone destruction.58 High iron ions also promote the aberrant proliferation of synovial cells and the establishment and progression of pannus and vascular synovitis in the synovium,59 consistent with iron deposits in RA synovial tissue.60 Second, ROS, as a product of oxidative stress, plays an important role in the pathogenesis of RA,61 and there is a significant positive association between ROS levels and RA severity.18 The ROS-activated NF-κB signaling pathway produces TNF-α, further accelerating RA via the p38/JNK pathway.62 ROS can also activate NLRP3, crosstalking with the pyroptosis pathway. Third, ferroptosis exacerbates inflammatory responses by stimulating the immune system to release inflammatory cytokines.29 Iron accumulation, ferroptosis activation, and their associated signaling pathways cause a vicious cycle of hemorrhage-inflammation-re-hemorrhage-re-inflammation in the synovium, destroying bone and cartilage in the joints of RA patients (Figure 16).
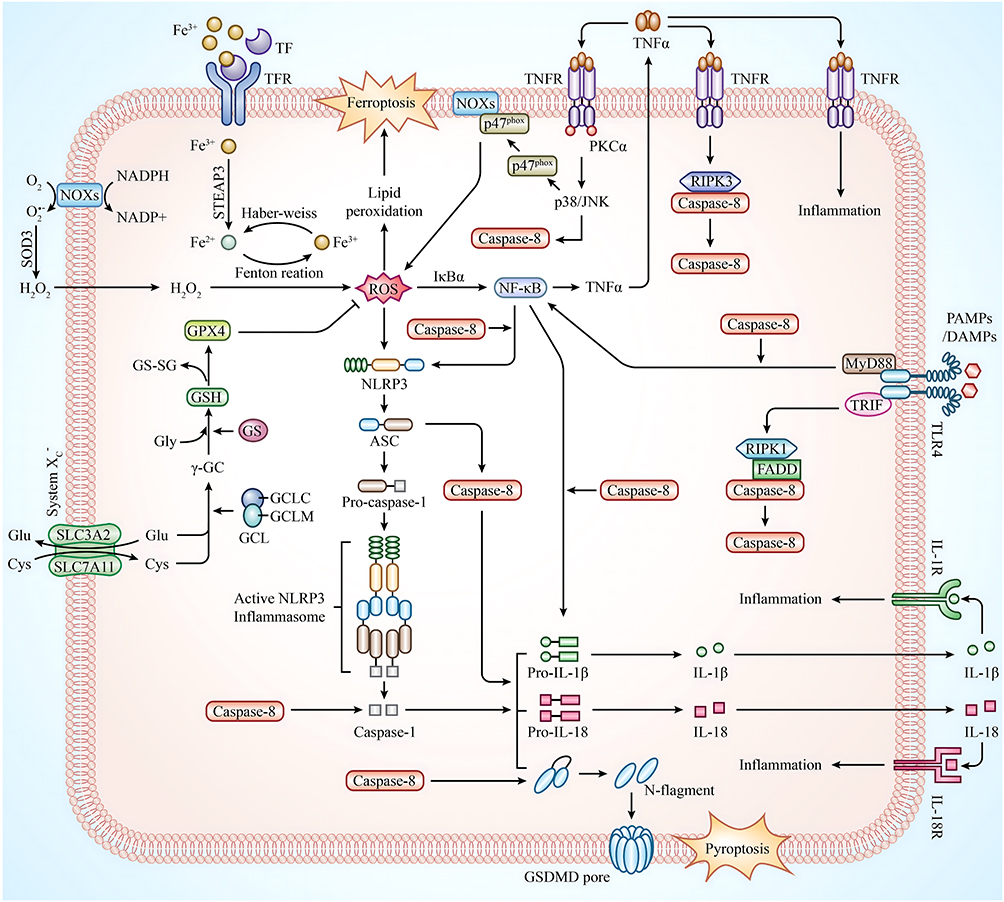 |
Figure 16 Diagram of the proposed mechanism for the involvement of caspase-8 in the ferroptosis, pyroptosis pathway in RA. |
The Relationship Between RA and Pyroptosis
It is now known that pyroptosis primarily works through the NLRP3 inflammasome, which consists of NLRP3, ASC, caspase-1, caspase-8, GSDMD, IL-1β, and IL-18 effector molecules, to exacerbate the progression of RA.63,64 The inflammasome is an intracellular multiprotein complex mediating immune responses to cellular damage,65 where important pyroptosis effector molecules include NLRP3 inflammasomes, which are divided into two phases of initiation and activation.66 The ROS-NF-κB-NLRP3 axis is the initiation phase.67 The activation phase is the NLRP3/ASC/procaspase-1/caspase-1 axis. NLRP3 binds to the adaptor ASC and recruits procaspase-1 to form the classical inflammasome, ultimately driving caspase-1 activation.68 The following effect phase is divided into two independent routes. First, the cleavage of GSDMD by activated caspase-169 results in a GSDMD-N structural domain, triggering a breach in the cell membrane and initiating pyroptosis.70,71 Second, the cleavage of pro-IL-1β and pro-IL-18 by activated caspase-1 releases IL-1β and IL-18 to initiate inflammatory responses (Figure 16).72
Caspase-8 is a Biomarker of Ferroptosis and Pyroptosis in RA
Our study identified a key gene, CASP8, associated with ferroptosis and pyroptosis in RA, which may be an important biomarker and a therapeutic target. Caspase is a class of cysteine-dependent endonucleases that cleave and activate themselves and other caspases by hydrolyzing their targets.73 Effector caspases must be cleaved by initiating caspases to activate pyroptosis and release inflammatory factors.74,75 Caspase-1 was originally assumed to be involved in pyroptosis, but as research progressed, other caspases (such as caspase-3, −4, −5, and −8) were also found to be involved.76–78 Within the family of caspases, caspase-8 functions as both an initiator and an apical activator, comprising two N-terminal death effector domains (DED), a large (p18) and a small (p10) subunit at its C-terminus, and was originally recognized for its role in apoptosis.79 A subsequent genetic investigation showed that caspase-8 is a molecular switch for apoptosis, necroptosis, and pyroptosis.80 Several investigations also demonstrated that while apoptosis and necroptosis are suppressed, NLRP3/caspase-1 axis-mediated pyroptosis continues to be induced by caspase-8.81,82 Caspase-8 can function as both an initiating and an effector caspase and play essential roles in distinct signaling pathways (such as cell death, inflammasome, and inflammatory cytokine production).83–85
First, caspase-8 was an upstream regulator of classical and non-classical NLRP3 inflammasome initiation and activation.86,87 Second, caspase-8 acts as an initiating caspase that activates caspase-1 and its downstream signaling pathways.88,89 Third, caspase-8 can substitute caspase-1 as an effector caspase to induce pyroptosis and IL-1β production.78 In the inflammasome pathway, the PYD region of the ASC binds to the DED of caspase-8 and thus recruits and activates caspase-8,89 which completes the pyroptosis process by cleaving the substrate at the same amino acid D276 as caspase-1 in the GSDMD.24 Fourth, GSDMD-driven pyroptosis may be triggered by caspase-8 via regulating direct channels of GSDMD.90 Fifth, caspase-8 enhances IL-1β production by directly regulating the NF-κB signaling pathway.91 Non-apoptotic caspase-8 is involved in pyroptosis and inflammatory cytokine release and is a facilitator and reinforcer of the NLRP3 inflammasome signaling pathway.78,92 Thus, caspase-8 is essential for pyroptosis-related pathways (Figure 16).
Another investigation has demonstrated that caspase-8 activation occurs concurrently with ROS generation.93 During ferroptosis, ROS generated by excessive intracellular Fe2+ and H2O2 via the Fenton reaction activates the NF-κB pathway to generate TNF-α, which in turn can trigger caspase-8 via the p38/JNK pathway and further accumulate ROS.12,17,62,94 In the NLRP3 inflammasome pathway activated via the TLR4/MyD88/NF-κB axis, caspase-8 is an upstream regulator of NF-κB and promotes TNF-α production, indirectly promoting ROS synthesis and ferroptosis (Figure 16).95,96 Caspase-8 promotes ferroptosis and pyroptosis, acts as an upstream positive regulator of the production and secretion of inflammatory cytokines such as TNF-α, IL-1β, and IL-18, and plays an important role in the positive feedback loop of RA progression. Therefore, Caspase-8 is a potentially important therapeutic target.
Cells in RA
(1) Fibroblast-like synoviocytes. In RA, FLS exhibited a distinct aggressive tendency.97 FLS can induce chronic synovitis, pannus development, bone degradation, and cartilage damage through the production of inflammatory factors, proangiogenic factors, and matrix-degrading enzymes.98 FLS plays an important role in the development and progression of RA, in which TNF-α is a key trigger in the proinflammatory process of FLS.99 The NF-κB/TNF-α pathway generates ROS in response to NOX activation100 and induces caspase-8 activation,101 then ROS enhances TNF-mediated activation of the NF-κB pathway,102 generating a positive loop of accumulating ROS that drives ferroptosis and pyroptosis. (2) Immune cells. The immune-infiltrating environment of the synovium consists mainly of immune cells such as T cells, B cells, and macrophages.103 Studies have shown that memory-activated CD4+ T cells accumulate in RA joints and are important immune cells promoting inflammation.104,105 Tfh can further assist B cells in promoting antibody production.106 Th17 cells can secrete IL-17, IL-1β, and IL-6 multiple proinflammatory cytokines.107 Th17 cells play an important proinflammatory role in autoimmune diseases through the ASC-NLRP3-caspase-8 inflammasome signaling pathway.108
Quercetin
The ability of quercetin to significantly reduce the levels of pro-inflammatory factors in RA and improve clinical symptoms was demonstrated in a randomized, double-blind, controlled clinical study.109 In a mouse model of RA, quercetin inhibited inflammatory cell infiltration and reduced inflammatory cytokines (TNF-α, IL-1β, IL-17), improved arthritis scores, and alleviated symptoms.110,111 Quercetin exerts anti-inflammatory effects by decreasing IL-17 expression and inhibiting NF-κB activator (RANKL) induced by IL-17 in RA-FLS.112 Additionally, quercetin showed an antioxidant role in RA mice by reducing ROS.113 Quercetin is considered a good antioxidant for treating iron overload and an inhibitor of ferroptosis.28 Quercetin reduces NLRP3 and caspase-1 expression in RA rats, showing anti-inflammatory effects.110 Our results suggest that quercetin can bind stably to caspase-8 to exert pharmacological effects, suggesting that it could treat RA by inhibiting ferroptosis and pyroptosis. However, these findings need to be verified by in vivo and in vitro investigations.
Conclusion
Our study identified the common biomarker gene CASP8 for RA, ferroptosis, and pyroptosis by bioinformatics analysis, machine learning, and in vitro studies. Quercetin was found to reduce caspase-8 levels in ferroptosis and pyroptosis phenotypes in vitro experiments. We also demonstrated that quercetin might interact with caspase-8 via network pharmacology and confirmed their stable binding by molecular docking and molecular dynamics simulation, which provides a theoretical foundation for quercetin targeting caspase-8 through ferroptosis and pyroptosis to treat RA.
Abbreviations
DEGs, Differentially expressed genes; FRGs, Ferroptosis-related genes; PRGs, Pyroptosis-related genes; DEFRGs, Differentially expressed ferroptosis-related genes; DEPRGs, Differentially expressed pyroptosis-related genes; RA, Rheumatoid arthritis; HC, Healthy controls; PCD, programmed cell death; ROS, Reactive oxygen species; GO, Gene ontology; KEGG, Kyoto encyclopedia of genes and genomes; PPI, Protein-protein interaction; TF, Transcription factor; ROC, Receiver operating characteristic curve; AUC, Area under the curve; NLR, NOD-like receptor; NLRP3, NOD-like receptor family pyrin domain containing 3; ASC, Apoptosis-associated speck-like protein; GSDMD, Gasdermin-D; PAMP, Pathogen-associated molecular pattern; DAMP, Damage-associated molecular pattern; STAT, Signal transducer and activator of transcription; NF-κB, Nuclear factor-kappa B; Tfh, Follicular helper T cells; FLS, Fibroblast-like synoviocytes; GPX4, Glutathione peroxidase 4; DED, Death effector domain; SLC7A11, Solute carrier family 7 member 11; GCLC, Glutamate-cysteine ligase catalytic subunit; GCLM, Glutamate cysteine ligase-modifier subunit.
Data Sharing Statement
Publicly available datasets (GSE55235, GSE77298) were analyzed in this study. All data were available from public databases and can be found in the GEO database (https://wwwncbinmnihgov/geo/), FerrDb database (http://www.zhounan.org/ferrdb/current/), Genecards database (https://www.genecards.org/). All the raw data is contained in Supplementary Material and uploaded to GitHub, which is HTTPS (https://github.com/zheng5862/zheng5862.git).
Acknowledgments
We acknowledge the GEO, FerrDb, and Genecards databases for providing their platforms and contributors for uploading meaningful datasets.
Author Contributions
Each author significantly contributed to various aspects of the reported work, including conception, study design, execution, data acquisition, analysis and interpretation, drafting, revising, and critical review of the article. All authors provided final approval for the submitted version and the selected journal, demonstrating their commitment to the complete research process and assuming accountability.
Funding
The Natural Science Foundation of Fujian Province (No. 2020J01947, No. 2021J02035) and Fujian Provincial Health Technology Project (No. 2020CXA039, No. 2021CXA019) supported the study.
Disclosure
The authors declare that the research was conducted without commercial or financial relationships construed as a potential conflict of interest.
References
1. Smolen JS, Aletaha D, Bijlsma JW, et al. Treating rheumatoid arthritis to target: recommendations of an international task force. Ann Rheum Dis. 2010;69(4):631–637. doi:10.1136/ard.2009.123919
2. Aletaha D, Neogi T, Silman AJ, et al. 2010 Rheumatoid arthritis classification criteria: an American College of Rheumatology/European League Against Rheumatism collaborative initiative. Arthritis Rheum. 2010;62(9):2569–2581. doi:10.1002/art.27584
3. McInnes IB, Schett G. Pathogenetic insights from the treatment of rheumatoid arthritis. Lancet. 2017;389(10086):2328–2337. doi:10.1016/s0140-6736(17)31472-1
4. van der Woude D, van der Helm-van Mil AHM. Update on the epidemiology, risk factors, and disease outcomes of rheumatoid arthritis. Best Pract Res Clin Rheumatol. 2018;32(2):174–187. doi:10.1016/j.berh.2018.10.005
5. Firestein GS, McInnes IB. Immunopathogenesis of Rheumatoid Arthritis. Immunity. 2017;46(2):183–196. doi:10.1016/j.immuni.2017.02.006
6. Farrugia M, Baron B. The role of TNF-α in rheumatoid arthritis: a focus on regulatory T cells. J Clin Trans Res. 2016;2(3):84–90.
7. Zhao J, Jiang P, Guo S, et al. Apoptosis, Autophagy, NETosis, Necroptosis, and Pyroptosis Mediated Programmed Cell Death as Targets for Innovative Therapy in Rheumatoid Arthritis. Front Immunol. 2021;12:809806. doi:10.3389/fimmu.2021.809806
8. Matsumura T, Saito Y, Suzuki T, et al. Phosphorylated Platelet-Derived Growth Factor Receptor-Positive Cells With Anti-apoptotic Properties Accumulate in the Synovium of Patients With Rheumatoid Arthritis. Front Immunol. 2019;10:241. doi:10.3389/fimmu.2019.00241
9. Zhu L, Wang H, Wu Y, et al. The Autophagy Level Is Increased in the Synovial Tissues of Patients with Active Rheumatoid Arthritis and Is Correlated with Disease Severity. Mediators Inflamm. 2017;2017:7623145. doi:10.1155/2017/7623145
10. Zhou Y, Chen B, Mittereder N, et al. Spontaneous Secretion of the Citrullination Enzyme PAD2 and Cell Surface Exposure of PAD4 by Neutrophils. Front Immunol. 2017;8:1200. doi:10.3389/fimmu.2017.01200
11. Zhang DW, Shao J, Lin J, et al. RIP3, an energy metabolism regulator that switches TNF-induced cell death from apoptosis to necrosis. Science. 2009;325(5938):332–336. doi:10.1126/science.1172308
12. Zhao T, Yang Q, Xi Y, et al. Ferroptosis in Rheumatoid Arthritis: a Potential Therapeutic Strategy. Front Immunol. 2022;13:779585. doi:10.3389/fimmu.2022.779585
13. Wu XY, Li KT, Yang HX, et al. Complement C1q synergizes with PTX3 in promoting NLRP3 inflammasome over-activation and pyroptosis in rheumatoid arthritis. J Autoimmun. 2020;106:102336. doi:10.1016/j.jaut.2019.102336
14. Dixon SJ, Lemberg KM, Lamprecht MR, et al. Ferroptosis: an iron-dependent form of nonapoptotic cell death. Cell. 2012;149(5):1060–1072. doi:10.1016/j.cell.2012.03.042
15. Stockwell BR, Friedmann Angeli JP, Bayir H, et al. Ferroptosis: a Regulated Cell Death Nexus Linking Metabolism, Redox Biology, and Disease. Cell. 2017;171(2):273–285. doi:10.1016/j.cell.2017.09.021
16. Tański W, Chabowski M, Jankowska-Polańska B, et al. Iron metabolism in patients with rheumatoid arthritis. Eur Rev Med Pharmacol Sci. 2021;25(12):4325–4335. doi:10.26355/eurrev_202106_26140
17. Su LJ, Zhang JH, Gomez H, et al. Reactive Oxygen Species-Induced Lipid Peroxidation in Apoptosis, Autophagy, and Ferroptosis. Oxid Med Cell Longev. 2019;2019:5080843. doi:10.1155/2019/5080843
18. Quiñonez-Flores CM, González-Chávez SA, Del Río Nájera D, et al. Oxidative Stress Relevance in the Pathogenesis of the Rheumatoid Arthritis: a Systematic Review. Biomed Res Int. 2016;2016:6097417. doi:10.1155/2016/6097417
19. Mao H, Zhao Y, Li H, et al. Ferroptosis as an emerging target in inflammatory diseases. Prog Biophys Mol Biol. 2020;155:20–28. doi:10.1016/j.pbiomolbio.2020.04.001
20. Li P, Jiang M, Li K, et al. Glutathione peroxidase 4-regulated neutrophil ferroptosis induces systemic autoimmunity. Nat Immunol. 2021;22(9):1107–1117. doi:10.1038/s41590-021-00993-3
21. Galluzzi L, Vitale I, Aaronson SA, et al. Molecular mechanisms of cell death: recommendations of the Nomenclature Committee on Cell Death 2018. Cell Death Differ. 2018;25(3):486–541. doi:10.1038/s41418-017-0012-4
22. Kovacs SB, Miao EA. Gasdermins: effectors of Pyroptosis. Trends Cell Biol. 2017;27(9):673–684. doi:10.1016/j.tcb.2017.05.005
23. Chadha S, Behl T, Bungau S, et al. Mechanistic insights into the role of pyroptosis in rheumatoid arthritis. Curr Res Transl Med. 2020;68(4):151–158. doi:10.1016/j.retram.2020.07.003
24. Chen KW, Demarco B, Heilig R, et al. Extrinsic and intrinsic apoptosis activate pannexin-1 to drive NLRP3 inflammasome assembly. EMBO j. 2019;38(10). doi:10.15252/embj.2019101638
25. Carullo G, Cappello AR, Frattaruolo L, et al. Quercetin and derivatives: useful tools in inflammation and pain management. Future Med Chem. 2017;9(1):79–93. doi:10.4155/fmc-2016-0186
26. Shen P, Lin W, Deng X, et al. Potential Implications of Quercetin in Autoimmune Diseases. Front Immunol. 2021;12:689044. doi:10.3389/fimmu.2021.689044
27. Xie R, Zhao W, Lowe S, et al. Quercetin alleviates kainic acid-induced seizure by inhibiting the Nrf2-mediated ferroptosis pathway. Free Radic Biol Med. 2022;191:212–226. doi:10.1016/j.freeradbiomed.2022.09.001
28. Wang Y, Quan F, Cao Q, et al. Quercetin alleviates acute kidney injury by inhibiting ferroptosis. J Adv Res. 2021;28:231–243. doi:10.1016/j.jare.2020.07.007
29. Huang T, Zhang K, Wang J, et al. Quercetin Alleviates Acrylamide-Induced Liver Injury by Inhibiting Autophagy-Dependent Ferroptosis. J Agric Food Chem. 2023;71(19):7427–7439. doi:10.1021/acs.jafc.3c01378
30. Ye Y, Jiang M, Hong X, et al. Quercetin Alleviates Deoxynivalenol-Induced Intestinal Damage by Suppressing Inflammation and Ferroptosis in Mice. J Agric Food Chem. 2023. doi:10.1021/acs.jafc.3c02027
31. Luo X, Weng X, Bao X, et al. A novel anti-atherosclerotic mechanism of quercetin: competitive binding to KEAP1 via Arg483 to inhibit macrophage pyroptosis. Redox Biol. 2022;57:102511. doi:10.1016/j.redox.2022.102511
32. Wei Z, Jing Z, Pinfang K, et al. Quercetin Inhibits Pyroptosis in Diabetic Cardiomyopathy through the Nrf2 Pathway. J Diabetes Res. 2022;2022:9723632. doi:10.1155/2022/9723632
33. Chen LL, Song C, Zhang Y, et al. Quercetin protects against LPS-induced lung injury in mice via SIRT1-mediated suppression of PKM2 nuclear accumulation. Eur J Pharmacol. 2022;936:175352. doi:10.1016/j.ejphar.2022.175352
34. Chen HY, Chiang YF, Hong YH, et al. Quercetin Ameliorates Renal Injury and Pyroptosis in Lupus Nephritis through Inhibiting IL-33/ST2 Pathway In Vitro and In Vivo. Antioxidants (Basel). 2022;11(11). doi:10.3390/antiox11112238
35. Woetzel D, Huber R, Kupfer P, et al. Identification of rheumatoid arthritis and osteoarthritis patients by transcriptome-based rule set generation. Arthritis Res Ther. 2014;16(2):R84. doi:10.1186/ar4526
36. Broeren MG, de Vries M, Bennink MB, et al. Disease-Regulated Gene Therapy with Anti-Inflammatory Interleukin-10 Under the Control of the CXCL10 Promoter for the Treatment of Rheumatoid Arthritis. Hum Gene Ther. 2016;27(3):244–254. doi:10.1089/hum.2015.127
37. Zhou N, Bao J. FerrDb: a manually curated resource for regulators and markers of ferroptosis and ferroptosis-disease associations. Database. 2020;2020. doi:10.1093/database/baaa021
38. Safran M, Dalah I, Alexander J, et al. GeneCards Version 3: the human gene integrator. Database. 2010;2010:baq020. doi:10.1093/database/baq020
39. Ritchie ME, Phipson B, Wu D, et al. limma powers differential expression analyses for RNA-sequencing and microarray studies. Nucleic Acids Res. 2015;43(7):e47. doi:10.1093/nar/gkv007
40. Wickham H. Ggplot2: elegant Graphics for Data Analysis: ggplot2: elegant Graphics for Data Analysis. Int J Med. 2009;1:567.
41. Yu G, Wang LG, Han Y, et al. clusterProfiler: an R package for comparing biological themes among gene clusters. Omics. 2012;16(5):284–287. doi:10.1089/omi.2011.0118
42. Szklarczyk D, Gable AL, Lyon D, et al. STRING v11: protein-protein association networks with increased coverage, supporting functional discovery in genome-wide experimental datasets. Nucleic Acids Res. 2019;47(D1):D607–d13. doi:10.1093/nar/gky1131
43. Shannon P, Markiel A, Ozier O, et al. Cytoscape: a software environment for integrated models of biomolecular interaction networks. Genome Res. 2003;13(11):2498–2504. doi:10.1101/gr.1239303
44. Beck MW. NeuralNetTools: visualization and Analysis Tools for Neural Networks. J Stat Softw. 2018;85(11):1–20. doi:10.18637/jss.v085.i11
45. Zhou G, Soufan O, Ewald J, et al. NetworkAnalyst 3.0: a visual analytics platform for comprehensive gene expression profiling and meta-analysis. Nucleic Acids Res. 2019:47(W1):W234–w41. doi:10.1093/nar/gkz240
46. Zhou Y, Zhou B, Pache L, et al. Metascape provides a biologist-oriented resource for the analysis of systems-level datasets. Nat Commun. 2019;10(1):1523. doi:10.1038/s41467-019-09234-6
47. Warde-Farley D, Donaldson SL, Comes O, et al. The GeneMANIA prediction server: biological network integration for gene prioritization and predicting gene function. Nucleic Acids Res. 2010;38:W214–20. doi:10.1093/nar/gkq537
48. Rydenfelt M, Klinger B, Klünemann M, et al. SPEED2: inferring upstream pathway activity from differential gene expression. Nucleic Acids Res. 2020;48(W1):W307–w12. doi:10.1093/nar/gkaa236
49. Livak KJ, Schmittgen TD. Analysis of relative gene expression data using real-time quantitative PCR and the 2(-Delta Delta C(T)) Method. Methods. 2001;25(4):402–408. doi:10.1006/meth.2001.1262
50. Newman AM, Liu CL, Green MR, et al. Robust enumeration of cell subsets from tissue expression profiles. Nat Methods. 2015;12(5):453–457. doi:10.1038/nmeth.3337
51. Davis AP, Grondin CJ, Johnson RJ, et al. Comparative Toxicogenomics Database (CTD): update 2021. Nucleic Acids Res. 2021;49(D1):D1138–d43. doi:10.1093/nar/gkaa891
52. Ru J, Li P, Wang J, et al. TCMSP: a database of systems pharmacology for drug discovery from herbal medicines. J Cheminform. 2014;6:13. doi:10.1186/1758-2946-6-13
53. Nowotka MM, Gaulton A, Mendez D, et al. Using ChEMBL web services for building applications and data processing workflows relevant to drug discovery. Expert Opin Drug Discov. 2017;12(8):757–767. doi:10.1080/17460441.2017.1339032
54. Li Q, Cheng T, Wang Y, et al. PubChem as a public resource for drug discovery. Drug Discov Today. 2010;15(23–24):1052–1057. doi:10.1016/j.drudis.2010.10.003
55. Berman HM, Westbrook J, Feng Z, et al. The Protein Data Bank. Nucleic Acids Res. 2000;28(1):235–242. doi:10.1093/nar/28.1.235
56. Luo H, Zhang R. Icariin enhances cell survival in lipopolysaccharide-induced synoviocytes by suppressing ferroptosis via the Xc-/GPX4 axis. Exp Ther Med. 2021;21(1):72. doi:10.3892/etm.2020.9504
57. Cen WJ, Feng Y, Li SS, et al. Iron overload induces G1 phase arrest and autophagy in murine preosteoblast cells. J Cell Physiol. 2018;233(9):6779–6789. doi:10.1002/jcp.26405
58. Xiao W, Beibei F, Guangsi S, et al. Iron overload increases osteoclastogenesis and aggravates the effects of ovariectomy on bone mass. J Endocrinol. 2015;226(3):121–134. doi:10.1530/joe-14-0657
59. Hakobyan N, Kazarian T, Jabbar AA, et al. Pathobiology of hemophilic synovitis I: overexpression of mdm2 oncogene. Blood. 2004;104(7):2060–2064. doi:10.1182/blood-2003-12-4231
60. Ogilvie-Harris DJ, Fornaiser VL. Synovial iron deposition in osteoarthritis and rheumatoid arthritis. J Rheumatol. 1980;7(1):30–36.
61. Datta S, Kundu S, Ghosh P, et al. Correlation of oxidant status with oxidative tissue damage in patients with rheumatoid arthritis. Clin Rheumatol. 2014;33(11):1557–1564. doi:10.1007/s10067-014-2597-z
62. Xie Z, Hou H, Luo D, et al. ROS-Dependent Lipid Peroxidation and Reliant Antioxidant Ferroptosis-Suppressor-Protein 1 in Rheumatoid Arthritis: a Covert Clue for Potential Therapy. Inflammation. 2021;44(1):35–47. doi:10.1007/s10753-020-01338-2
63. Vande Walle L, Lamkanfi M. Pyroptosis. Curr Biol. 2016;26(13):R568–r72. doi:10.1016/j.cub.2016.02.019
64. He Y, Hara H, Núñez G. Mechanism and Regulation of NLRP3 Inflammasome Activation. Trends Biochem Sci. 2016;41(12):1012–1021. doi:10.1016/j.tibs.2016.09.002
65. Franchi L, Muñoz-Planillo R, Núñez G. Sensing and reacting to microbes through the inflammasomes. Nat Immunol. 2012;13(4):325–332. doi:10.1038/ni.2231
66. Lang T, Lee JPW, Elgass K, et al. Macrophage migration inhibitory factor is required for NLRP3 inflammasome activation. Nat Commun. 2018;9(1):2223. doi:10.1038/s41467-018-04581-2
67. Bauernfeind FG, Horvath G, Stutz A, et al. Cutting edge: NF-kappaB activating pattern recognition and cytokine receptors license NLRP3 inflammasome activation by regulating NLRP3 expression. J Immunol. 2009;183(2):787–791. doi:10.4049/jimmunol.0901363
68. Franchi L, Eigenbrod T, Muñoz-Planillo R, et al. The inflammasome: a caspase-1-activation platform that regulates immune responses and disease pathogenesis. Nat Immunol. 2009;10(3):241–247. doi:10.1038/ni.1703
69. Shi J, Zhao Y, Wang K, et al. Cleavage of GSDMD by inflammatory caspases determines pyroptotic cell death. Nature. 2015;526(7575):660–665. doi:10.1038/nature15514
70. Ding J, Wang K, Liu W, et al. Pore-forming activity and structural autoinhibition of the gasdermin family. Nature. 2016;535(7610):111–116. doi:10.1038/nature18590
71. Liu X, Zhang Z, Ruan J, et al. Inflammasome-activated gasdermin D causes pyroptosis by forming membrane pores. Nature. 2016;535(7610):153–158. doi:10.1038/nature18629
72. Boucher D, Monteleone M, Coll RC, et al. Caspase-1 self-cleavage is an intrinsic mechanism to terminate inflammasome activity. J Exp Med. 2018;215(3):827–840. doi:10.1084/jem.20172222
73. Lamkanfi M, Declercq W, Kalai M, et al. Alice in caspase land. A phylogenetic analysis of caspases from worm to man. Cell Death Differ. 2002;9(4):358–361. doi:10.1038/sj.cdd.4400989
74. Ramirez MLG, Salvesen GS. A primer on caspase mechanisms. Semin Cell Dev Biol. 2018;82:79–85. doi:10.1016/j.semcdb.2018.01.002
75. Van Opdenbosch N, Lamkanfi M. Caspases in Cell Death, Inflammation, and Disease. Immunity. 2019;50(6):1352–1364. doi:10.1016/j.immuni.2019.05.020
76. Shi J, Zhao Y, Wang Y, et al. Inflammatory caspases are innate immune receptors for intracellular LPS. Nature. 2014;514(7521):187–192. doi:10.1038/nature13683
77. Wang Y, Gao W, Shi X, et al. Chemotherapy drugs induce pyroptosis through caspase-3 cleavage of a gasdermin. Nature. 2017;547(7661):99–103. doi:10.1038/nature22393
78. Antonopoulos C, Russo HM, El Sanadi C, et al. Caspase-8 as an Effector and Regulator of NLRP3 Inflammasome Signaling. J Biol Chem. 2015;290(33):20167–20184. doi:10.1074/jbc.M115.652321
79. Tummers B, Green DR. Caspase-8: regulating life and death. Immunol Rev. 2017;277(1):76–89. doi:10.1111/imr.12541
80. Fritsch M, Günther SD, Schwarzer R, et al. Caspase-8 is the molecular switch for apoptosis, necroptosis and pyroptosis. Nature. 2019;575(7784):683–687. doi:10.1038/s41586-019-1770-6
81. Mandal R, Barrón JC, Kostova I, et al. Caspase-8: the double-edged sword. Biochim Biophys Acta Rev Cancer. 2020;1873(2):188357. doi:10.1016/j.bbcan.2020.188357
82. Newton K, Wickliffe KE, Maltzman A, et al. Activity of caspase-8 determines plasticity between cell death pathways. Nature. 2019;575(7784):679–682. doi:10.1038/s41586-019-1752-8
83. Gurung P, Kanneganti TD. Novel roles for caspase-8 in IL-1β and inflammasome regulation. Am J Pathol. 2015;185(1):17–25. doi:10.1016/j.ajpath.2014.08.025
84. Monie TP, Bryant CE. Caspase-8 functions as a key mediator of inflammation and pro-IL-1β processing via both canonical and non-canonical pathways. Immunol Rev. 2015;265(1):181–193. doi:10.1111/imr.12284
85. Han JH, Park J, Kang TB, et al. Regulation of Caspase-8 Activity at the Crossroads of Pro-Inflammation and Anti-Inflammation. Int J Mol Sci. 2021;22(7). doi:10.3390/ijms22073318
86. Ganesan S, Rathinam VAK, Bossaller L, et al. Caspase-8 modulates dectin-1 and complement receptor 3-driven IL-1β production in response to β-glucans and the fungal pathogen, Candida albicans. J Immunol. 2014;193(5):2519–2530. doi:10.4049/jimmunol.1400276
87. Lawlor KE, Khan N, Mildenhall A, et al. RIPK3 promotes cell death and NLRP3 inflammasome activation in the absence of MLKL. Nat Commun. 2015;6:6282. doi:10.1038/ncomms7282
88. Maelfait J, Vercammen E, Janssens S, et al. Stimulation of Toll-like receptor 3 and 4 induces interleukin-1beta maturation by caspase-8. J Exp Med. 2008;205(9):1967–1973. doi:10.1084/jem.20071632
89. Sagulenko V, Thygesen SJ, Sester DP, et al. AIM2 and NLRP3 inflammasomes activate both apoptotic and pyroptotic death pathways via ASC. Cell Death Differ. 2013;20(9):1149–1160. doi:10.1038/cdd.2013.37
90. Schwarzer R, Jiao H, Wachsmuth L, et al. FADD and Caspase-8 Regulate Gut Homeostasis and Inflammation by Controlling MLKL- and GSDMD-Mediated Death of Intestinal Epithelial Cells. Immunity. 2020;52(6):978–93.e6. doi:10.1016/j.immuni.2020.04.002
91. Gurung P, Anand PK, Malireddi RK, et al. FADD and caspase-8 mediate priming and activation of the canonical and noncanonical Nlrp3 inflammasomes. J Immunol. 2014;192(4):1835–1846. doi:10.4049/jimmunol.1302839
92. Allam R, Lawlor KE, Yu EC, et al. Mitochondrial apoptosis is dispensable for NLRP3 inflammasome activation but non-apoptotic caspase-8 is required for inflammasome priming. EMBO Rep. 2014;15(9):982–990. doi:10.15252/embr.201438463
93. Kim WS, Lee KS, Kim JH, et al. The caspase-8/Bid/cytochrome c axis links signals from death receptors to mitochondrial reactive oxygen species production. Free Radic Biol Med. 2017;112:567–577. doi:10.1016/j.freeradbiomed.2017.09.001
94. Yao X, Li W, Fang D, et al. Emerging Roles of Energy Metabolism in Ferroptosis Regulation of Tumor Cells. Adv Sci. 2021;8(22):e2100997. doi:10.1002/advs.202100997
95. Lawlor KE, Feltham R, Yabal M, et al. XIAP Loss Triggers RIPK3- and Caspase-8-Driven IL-1β Activation and Cell Death as a Consequence of TLR-MyD88-Induced cIAP1-TRAF2 Degradation. Cell Rep. 2017;20(3):668–682. doi:10.1016/j.celrep.2017.06.073
96. Xia J, Zhang J, Wang L, et al. Non-apoptotic function of caspase-8 confers prostate cancer enzalutamide resistance via NF-κB activation. Cell Death Dis. 2021;12(9):833. doi:10.1038/s41419-021-04126-4
97. Bartok B, Firestein GS. Fibroblast-like synoviocytes: key effector cells in rheumatoid arthritis. Immunol Rev. 2010;233(1):233–255. doi:10.1111/j.0105-2896.2009.00859.x
98. Masoumi M, Bashiri H, Khorramdelazad H, et al. Destructive Roles of Fibroblast-like Synoviocytes in Chronic Inflammation and Joint Damage in Rheumatoid Arthritis. Inflammation. 2021;44(2):466–479. doi:10.1007/s10753-020-01371-1
99. McInnes IB, Schett G. Cytokines in the pathogenesis of rheumatoid arthritis. Nat Rev Immunol. 2007;7(6):429–442. doi:10.1038/nri2094
100. Chi PL, Liu CJ, Lee IT, et al. HO-1 induction by CO-RM2 attenuates TNF-α-induced cytosolic phospholipase A2 expression via inhibition of PKCα-dependent NADPH oxidase/ROS and NF-κB. Mediators Inflamm. 2014;2014:279171. doi:10.1155/2014/279171
101. Roberge S, Roussel J, Andersson DC, et al. TNF-α-mediated caspase-8 activation induces ROS production and TRPM2 activation in adult ventricular myocytes. Cardiovasc Res. 2014;103(1):90–99. doi:10.1093/cvr/cvu112
102. Morgan MJ, Liu ZG. Crosstalk of reactive oxygen species and NF-κB signaling. Cell Res. 2011;21(1):103–115. doi:10.1038/cr.2010.178
103. Chemin K, Gerstner C, Malmström V. Effector Functions of CD4+ T Cells at the Site of Local Autoimmune Inflammation-Lessons From Rheumatoid Arthritis. Front Immunol. 2019;10:353. doi:10.3389/fimmu.2019.00353
104. Murakami M, Hirano T. A four-step model for the IL-6 amplifier, a regulator of chronic inflammations in tissue-specific MHC class II-associated autoimmune diseases. Front Immunol. 2011;2:22. doi:10.3389/fimmu.2011.00022
105. Carbone G, Wilson A, Diehl SA, et al. Interleukin-6 receptor blockade selectively reduces IL-21 production by CD4 T cells and IgG4 autoantibodies in rheumatoid arthritis. Int J Biol Sci. 2013;9(3):279–288. doi:10.7150/ijbs.5996
106. Zhou S, Lu H, Xiong M. Identifying Immune Cell Infiltration and Effective Diagnostic Biomarkers in Rheumatoid Arthritis by Bioinformatics Analysis. Front Immunol. 2021;12:726747. doi:10.3389/fimmu.2021.726747
107. Cascão R, Moura RA, Perpétuo I, et al. Identification of a cytokine network sustaining neutrophil and Th17 activation in untreated early rheumatoid arthritis. Arthritis Res Ther. 2010;12(5):R196. doi:10.1186/ar3168
108. Martin BN, Wang C, Zhang CJ, et al. T cell-intrinsic ASC critically promotes T(H)17-mediated experimental autoimmune encephalomyelitis. Nat Immunol. 2016;17(5):583–592. doi:10.1038/ni.3389
109. Javadi F, Ahmadzadeh A, Eghtesadi S, et al. The Effect of Quercetin on Inflammatory Factors and Clinical Symptoms in Women with Rheumatoid Arthritis: a Double-Blind, Randomized Controlled Trial. J Am Coll Nutr. 2017;36(1):9–15. doi:10.1080/07315724.2016.1140093
110. Yang Y, Zhang X, Xu M, et al. Quercetin attenuates collagen-induced arthritis by restoration of Th17/Treg balance and activation of Heme Oxygenase 1-mediated anti-inflammatory effect. Int Immunopharmacol. 2018;54:153–162. doi:10.1016/j.intimp.2017.11.013
111. Kawaguchi K, Kaneko M, Miyake R, et al. Potent Inhibitory Effects of Quercetin on Inflammatory Responses of Collagen-Induced Arthritis in Mice. Endocr Metab Immune Disord Drug Targets. 2019;19(3):308–315. doi:10.2174/1871530319666190206225034
112. Kim HR, Kim BM, Won JY, et al. Quercetin, a Plant Polyphenol, Has Potential for the Prevention of Bone Destruction in Rheumatoid Arthritis. J Med Food. 2019;22(2):152–161. doi:10.1089/jmf.2018.4259
113. Saccol R, da Silveira KL, Manzoni AG, et al. Antioxidant, hepatoprotective, genoprotective, and cytoprotective effects of quercetin in a murine model of arthritis. J Cell Biochem. 2020;121(4):2792–2801. doi:10.1002/jcb.29502
 © 2023 The Author(s). This work is published and licensed by Dove Medical Press Limited. The full terms of this license are available at https://www.dovepress.com/terms.php and incorporate the Creative Commons Attribution - Non Commercial (unported, v3.0) License.
By accessing the work you hereby accept the Terms. Non-commercial uses of the work are permitted without any further permission from Dove Medical Press Limited, provided the work is properly attributed. For permission for commercial use of this work, please see paragraphs 4.2 and 5 of our Terms.
© 2023 The Author(s). This work is published and licensed by Dove Medical Press Limited. The full terms of this license are available at https://www.dovepress.com/terms.php and incorporate the Creative Commons Attribution - Non Commercial (unported, v3.0) License.
By accessing the work you hereby accept the Terms. Non-commercial uses of the work are permitted without any further permission from Dove Medical Press Limited, provided the work is properly attributed. For permission for commercial use of this work, please see paragraphs 4.2 and 5 of our Terms.