Back to Journals » Nature and Science of Sleep » Volume 15
Quantitative Network Comparisons of REM Sleep Without Atonia Across the α-Synucleinopathy Spectrum: A Systematic Review
Authors Byun JI ![]() , Yang TW, Sunwoo JS
, Yang TW, Sunwoo JS ![]() , Shin WC, Kwon OY, Jung KY
, Shin WC, Kwon OY, Jung KY
Received 2 June 2023
Accepted for publication 19 August 2023
Published 31 August 2023 Volume 2023:15 Pages 691—703
DOI https://doi.org/10.2147/NSS.S423878
Checked for plagiarism Yes
Review by Single anonymous peer review
Peer reviewer comments 2
Editor who approved publication: Professor Valentina Alfonsi
Jung-Ick Byun,1 Tae-Won Yang,2– 4 Jun-Sang Sunwoo,5 Won Chul Shin,1,6 Oh-Young Kwon,2,4,7,* Ki-Young Jung8,*
1Department of Neurology, Kyung Hee University Hospital at Gangdong, Kyung Hee University School of Medicine, Seoul, Republic of Korea; 2Department of Neurology, Gyeongsang National University College of Medicine, Jinju, Republic of Korea; 3Department of Neurology, Gyeongsang National University Changwon Hospital, Changwon, Republic of Korea; 4Institute of Science, Gyeongsang National University College of Medicine, Jinju, Republic of Korea; 5Department of Neurology, Kangbuk Samsung Hospital, Seoul, Republic of Korea; 6Department of Medicine, AgeTech-service Convergence Major, Kyung Hee University, Seoul, Republic of Korea; 7Department of Neurology, Gyeongsang National University Hospital, Jinju, Republic of Korea; 8Department of Neurology, Seoul National University Hospital, Seoul, Republic of Korea
*These authors contributed equally to this work
Correspondence: Oh-Young Kwon, Department of Neurology, Gyeongsang National University College of Medicine, 15, Jinjudae-ro 816beon-gil, Jinju, 52727, Republic of Korea, Tel +82-55-750-8288, Email [email protected] Ki-Young Jung, Department of Neurology, Seoul National University Hospital, Neuroscience Research Institute, Seoul National University College of Medicine, 101 Daehak-Ro, Jongno-Gu, Seoul, 110-744, Republic of Korea, Tel +82-2-920-6649, Email [email protected]
Purpose: Isolated rapid eye movement (REM) sleep behavior disorder (iRBD) is characterized by REM sleep without atonia (RWA) and is regarded as the prodromal stage of α-synucleinopathies, such as Parkinson’s disease (PD), dementia with Lewy bodies (DLB), and multiple system atrophy (MSA). RWA is also associated with neurodegeneration driven by α-synucleinopathy. However, the level of RWA across the α-synucleinopathy spectrum remains elusive. We aimed to rate the percentage of RWA across the α-synucleinopathy spectrum, encompassing prodromal and overt phenotypes.
Methods: A systematic search was conducted in the PubMed, Embase, Web of Science, and Cochrane Library databases. We included cohort, cross-sectional, and case–control studies comparing the RWA percentage during REM sleep evaluated by tonic chin activity (RWA%-T) or by phasic chin activity (RWA%-P) across the α-synucleinopathy spectrum. Bayesian network meta-analysis was used to combine both direct and indirect evidence regarding the group differences in the RWA%-T and RWA%-P. The surface under the cumulative ranking curve was used to estimate the ranked probability.
Results: Fifteen articles met the inclusion criteria. The investigations included 204 iRBD, 295 PD with RBD (PDwtRBD), 187 PD without RBD (PDwoRBD), 42 MSAwtRBD, 9 DLBwtRBD patients, and 246 controls. MSAwtRBD ranked first in RWA%-T, whereas iRBD ranked first in RWA%-P. RWA% in PDwoRBD patients was comparable to that in the controls and was lower than that in PDwtRBD patients.
Conclusion: Overt phenotypes such as MSAwtRBD and PDwtRBD ranked high in RWA%-T, whereas iRBD, a prodromal type, ranked highest in RWA%-P. Taken together, our data suggest that the percentage of neurodegeneration in RBD patients may be associated with RWA%-T rather than RWA%-P.
Prospero Registration Number: CRD42021276445.
Keywords: REM sleep behavior disorder, α-synucleinopathy, REM sleep without atonia, network meta-analysis
Introduction
Isolated rapid eye movement (REM) sleep behavior disorder (iRBD) is characterized by REM sleep without atonia (RWA) and dream enactment behavior (DEB) without any neurological disorders. According to Braak staging for Parkinson’s disease (PD), REM sleep behavior disorder (RBD) is associated with α-synuclein deposits in the medulla and pontine tegmentum before the involvement of the substantia nigra.1 Therefore, iRBD is known as a prodromal α-synucleinopathy that can precede the motor symptoms of PD.
More than 70% of iRBD patients will eventually phenoconvert to overt α-synucleinopathy phenotypes within 10–15 years after diagnosis.2–5 The overt α-synucleinopathy phenotypes include PD, dementia with Lewy bodies (DLB), and multiple system atrophy (MSA).6,7 They share common clinical features but may represent different degrees of progression of α-synuclein pathology.7 Moreover, RBD is a common symptom of these neurodegenerative disorders; the prevalence of RBD in MSA is 80 to 100%, 50 to 80% in DLB and 16 to 47% in PD.2,8
RWA is characterized by excessive tonic and/or phasic electromyography (EMG) activities during REM sleep recorded by polysomnography (PSG).9 Although criteria for amplitude and duration of muscle activity differ among the methods, they have been used to rate the percentage of RWA. In iRBD, the percentage of RWA (RWA%) during REM sleep increased over time,10,11 and RWA increments predicted future conversion to neurodegenerative disorder.12–14 Moreover, the severity or duration of PD was linked to the quantity of RWA.15 Therefore, the percentage of RWA during REM sleep is accepted as a neurophysiological marker of neurodegeneration, especially in α-synucleinopathies.16 However, there is a lack of integrated and systematic evidence to provide information regarding the relative difference in the RWA percentage during REM sleep among the prodromal and overt α-synucleinopathy phenotypes. Only a few studies have directly compared the percentage of REM atonia loss between two or more groups.
Network meta-analysis (NMA) aims to synthesize all available direct and indirect evidence across studies17 so that the RWA can be compared within various experimental groups, including prodromal and overt α-synucleinopathies and control groups. Furthermore, the NMA allows groups to be ranked according to their probabilities of being the best or worst for a given outcome.18
In this systematic review, we adopted the NMA approach to compare group differences by combining direct and indirect evidence within a network of reported studies. To date, most studies evaluating RWA have used at least the chin muscle. Therefore, we included currently available studies evaluating RWA using either tonic or phasic muscle activities for the NMA. Information from the other studies using limb or combined muscle activities was not sufficient for the NMA. Comparison of the “RWA percentage during REM sleep evaluated by tonic chin activity” (RWA%-T) or that by phasic chin activity (RWA%-P) among the α-synucleinopathy phenotypes could be valuable to evaluate the significance of RWA according to the neurodegenerative process. The comparison may reveal different pathomechanisms among the phenotypes and confirm the diagnostic value of RWA quantification in differentiating one from another.
Materials and Methods
This study was performed in accordance with the recommendations of the Preferred Reporting Items for Systematic Reviews and Meta-Analyses 2020 (PRISMA 2020) guidelines.19 The protocol of this study was specified in advance and was registered in PROSPERO (International Prospective Register of Systematic Reviews) with the registration number CRD42021277446.
Eligibility Criteria
Inclusion Criteria
We included studies that provided information on the manual scoring of RWA%-T or RWA%-P values in two or more study groups, including prodromal or overt α-synucleinopathy phenotypes and controls. The target study groups of primary studies for this review were patients with iRBD, PD with RBD (PDwtRBD), PD without RBD (PDwoRBD), MSA with RBD (MSAwtRBD), DLB with RBD (DLBwtRBD) and controls without RBD or neurodegenerative disorders. We considered prospective and retrospective cohort, cross-sectional and case–control studies as the subject studies of this review. This review also includes longitudinal studies with baseline evaluations that were adequate for this meta-analysis. Using approximation methods, the median and interquartile range were converted to the estimated mean and standard deviation.20
Exclusion Criteria
We excluded duplicates or subcohorts of already published cohorts and studies investigating animals or pediatric populations. Studies that did not specify comorbid RBD in overt α-synucleinopathy or that did not specify comorbid overt α-synucleinopathy in RBD patients were excluded from the analysis. We did not exclude studies based on publication date or language.
Search Strategy
We established a search strategy after selecting the following words and phrases referring to key articles that evaluated the RWA in patients with prodromal or clinical α-synucleinopathy: “REM sleep behavior disorder”, “parasomnia”, “polysomnography”, “sleep monitoring”, “electromyography”, “muscle”, “quantitative”, “atonia”, “RWA”, “activity”, “tonic”, and “phasic”. We performed an initial search on November 9, 2021, using the following databases: MEDLINE, Embase, Web of Science, and the Cochrane Library. After reviewing the initial results, the authors (JI Byun, TW Yang, OY Kwon) discussed the search strategy and performed the final search on December 10, 2021. Databases were searched from inception to December 2021 for articles using keywords and Medical Subject Heading (MeSH) terms (Supplementary Table 1).
Selection Process
Two researchers (JI Byun and TW Yang) independently screened the relevant studies according to the titles and abstracts included in the search results. Subsequently, the same researchers selected studies for the meta-analysis after evaluating the full texts of the included articles to assess their eligibility. All authors discussed and came to a consensus regarding the selection criteria, and any disagreement was resolved by discussion and by the participation of an arbitrator (KY Jung) when necessary.
Data Collection Process
Data extraction was first performed by one researcher (JI Byun) and subsequently verified by the other two researchers (TW Yang and OY Kwon). RWA%-T and RWA%-P for meta-analyses were obtained using the data supplied in the included studies. For each study, the following data were also collected: study design, country, study groups, demographics, diagnostic criteria, disease duration and levodopa equivalent daily dose if applicable, REM sleep percentage, RWA criteria, and RWA%-T or RWA%-P.
Outcome
The target outcomes of this review were the mean differences (MDs) of RWA%-T and RWA%-P among α-synucleinopathy phenotypes.
Statistical Analysis
Effect sizes were obtained as the means and standard deviations from the primary studies. We first performed pairwise meta-analyses using a random-effects model for RWA%-T or RWA%-P between the study groups evaluated in three or more primary studies. Pooled estimates of MDs were calculated from each pair of groups. Heterogeneity in the pairwise comparisons was assessed using the I2 statistics for pooled MDs (0% indicating no heterogeneity, >75% indicating substantial heterogeneity).
We then performed NMAs to obtain rank probabilities for RWA%-T or RWA%-P among the α-synucleinopathy spectrum. The NMA using a Bayesian framework random-effect model was used to synthesize evidence by integrating direct and indirect estimates for each comparison into a single summary effect.21
MD along with its 95% credible interval (CrI) were calculated for each comparison using the Markov chain Monte Carlo method fitted using the Just Another Gibbs Samplers program.22 For the analysis, we used the Rjags23 and gemtc24 packages within R Statistical Software (version R i386 3.4.2, R project for Statistical Computing).
The Bayesian model was run for 4 chains with an adaptive phase of 500 and a sampling phase of 10,000 iterations, thinned such that every 5th iteration was retained. Convergence was ensured by considering the Brooks–Gelman–Rubin diagnostics.25 Bayesian model fit was performed based on the deviance information criterion (DIC), a measure of goodness of fit and complexity.26
We estimated the ranking probabilities of RWA%-T and RWA%-P using the surface under the cumulative ranking curve (SUCRA). The SUCRA score is expressed as a range of 0–1 (0 being the lowest percentage and 1 being the highest percentage of RWA). A common node splitting method of the gemtc package24 was used to evaluate the inconsistency between direct and indirect comparisons.
The physiological degeneration process could be a confounding factor for RWA%-T and RWA%-P. A significant age difference, if present, between the α-synucleinopathy phenotypes may provide a bias for NMA results. To control for age confounding, we also performed an additional NMA for the age of the phenotypes.
Quality Assessment of the Literature and Certainty of Evidence
The quality of each article was independently assessed by the two researchers (JI Byun and OY Kwon) using the Newcastle–Ottawa Scale (NOS).27 The NOS evaluates the following 8 domains: adequate case definition, representativeness of cases, selection of controls, definition of controls, comparability, ascertainment of exposure, same method and nonresponse rate. The total quality score ranged between 0 and 9. Studies assessed with ≥5 points were regarded as having a low risk of bias. Discordance between the authors was resolved by discussion with the third arbitrator (TW Yang) when necessary.
To evaluate the certainty of the evidence obtained using pooled estimates of the pairwise meta-analyses, we used the GRADE (Grading of Recommendations, Assessment, Development and Evaluations) methodology28 using GRADEpro Guideline Development Tool (GRADEpro GDT) online software.29 Two researchers (JI Byun and OY Kwon) independently assessed the quality, and any discordance was resolved by discussion with the third researcher (TW Yang).
Data Availability
Data will be shared by request from any qualified investigator.
Results
Selected Studies
The detailed steps of the article selection process are shown in a PRISMA flow diagram (Figure 1). We initially identified 1700 articles, and 1084 of them were retained after removing duplicates. A total of 41 articles were retrieved after an initial screening process that involved reviewing the titles and abstracts of the 1084 studies. The remaining 35 articles were examined in full-text form to select appropriate studies for this review. Finally, this evaluation found 15 studies that met the criteria of this review. Supplementary Table 2 lists the reasons for excluding the other 20 studies.
 |
Figure 1 Flow diagram of the selection of the relevant studies. Abbreviation: RBD, Rapid eye movement sleep behavior disorder. Notes: A total of 1700 research articles were identified by searching five databases. Of these articles, 616 duplicate studies were removed, and an additional 1043 studies that did not satisfy the selection criteria were excluded from the analyses. The full texts of the remaining 35 studies were reviewed, and 20 of these were excluded for various reasons. Thus, a total of 15 studies were ultimately selected for the meta-analysis. |
Characteristics of the Included Studies
The features and data of the included studies are shown in Table 1. Each of the 15 studies evaluated the group differences in RWA%-T or RWA%-P among the study groups, including various α-synucleinopathy phenotypes and controls. Regarding RWA%-T, one study compared it within the four groups,30 and five studies compared it among the three groups.31–35 The remaining eight studies compared it between the two groups.36–43 For each α-synucleinopathy phenotype, the number of recruited studies providing RWA%-T information was as follows: seven for iRBD (total patient number [tn]=196),30,31,33–37 seven for PDwoRBD (tn=187),30,32,38,39,41–43 ten for PDwtRBD (tn=286),30–35,40–43 two for MSAwtRBD (tn=42),32,33 and one for DLBwtRBD (tn=9).31 Eight of the included studies provided information for the controls (tn=246).30,34–40
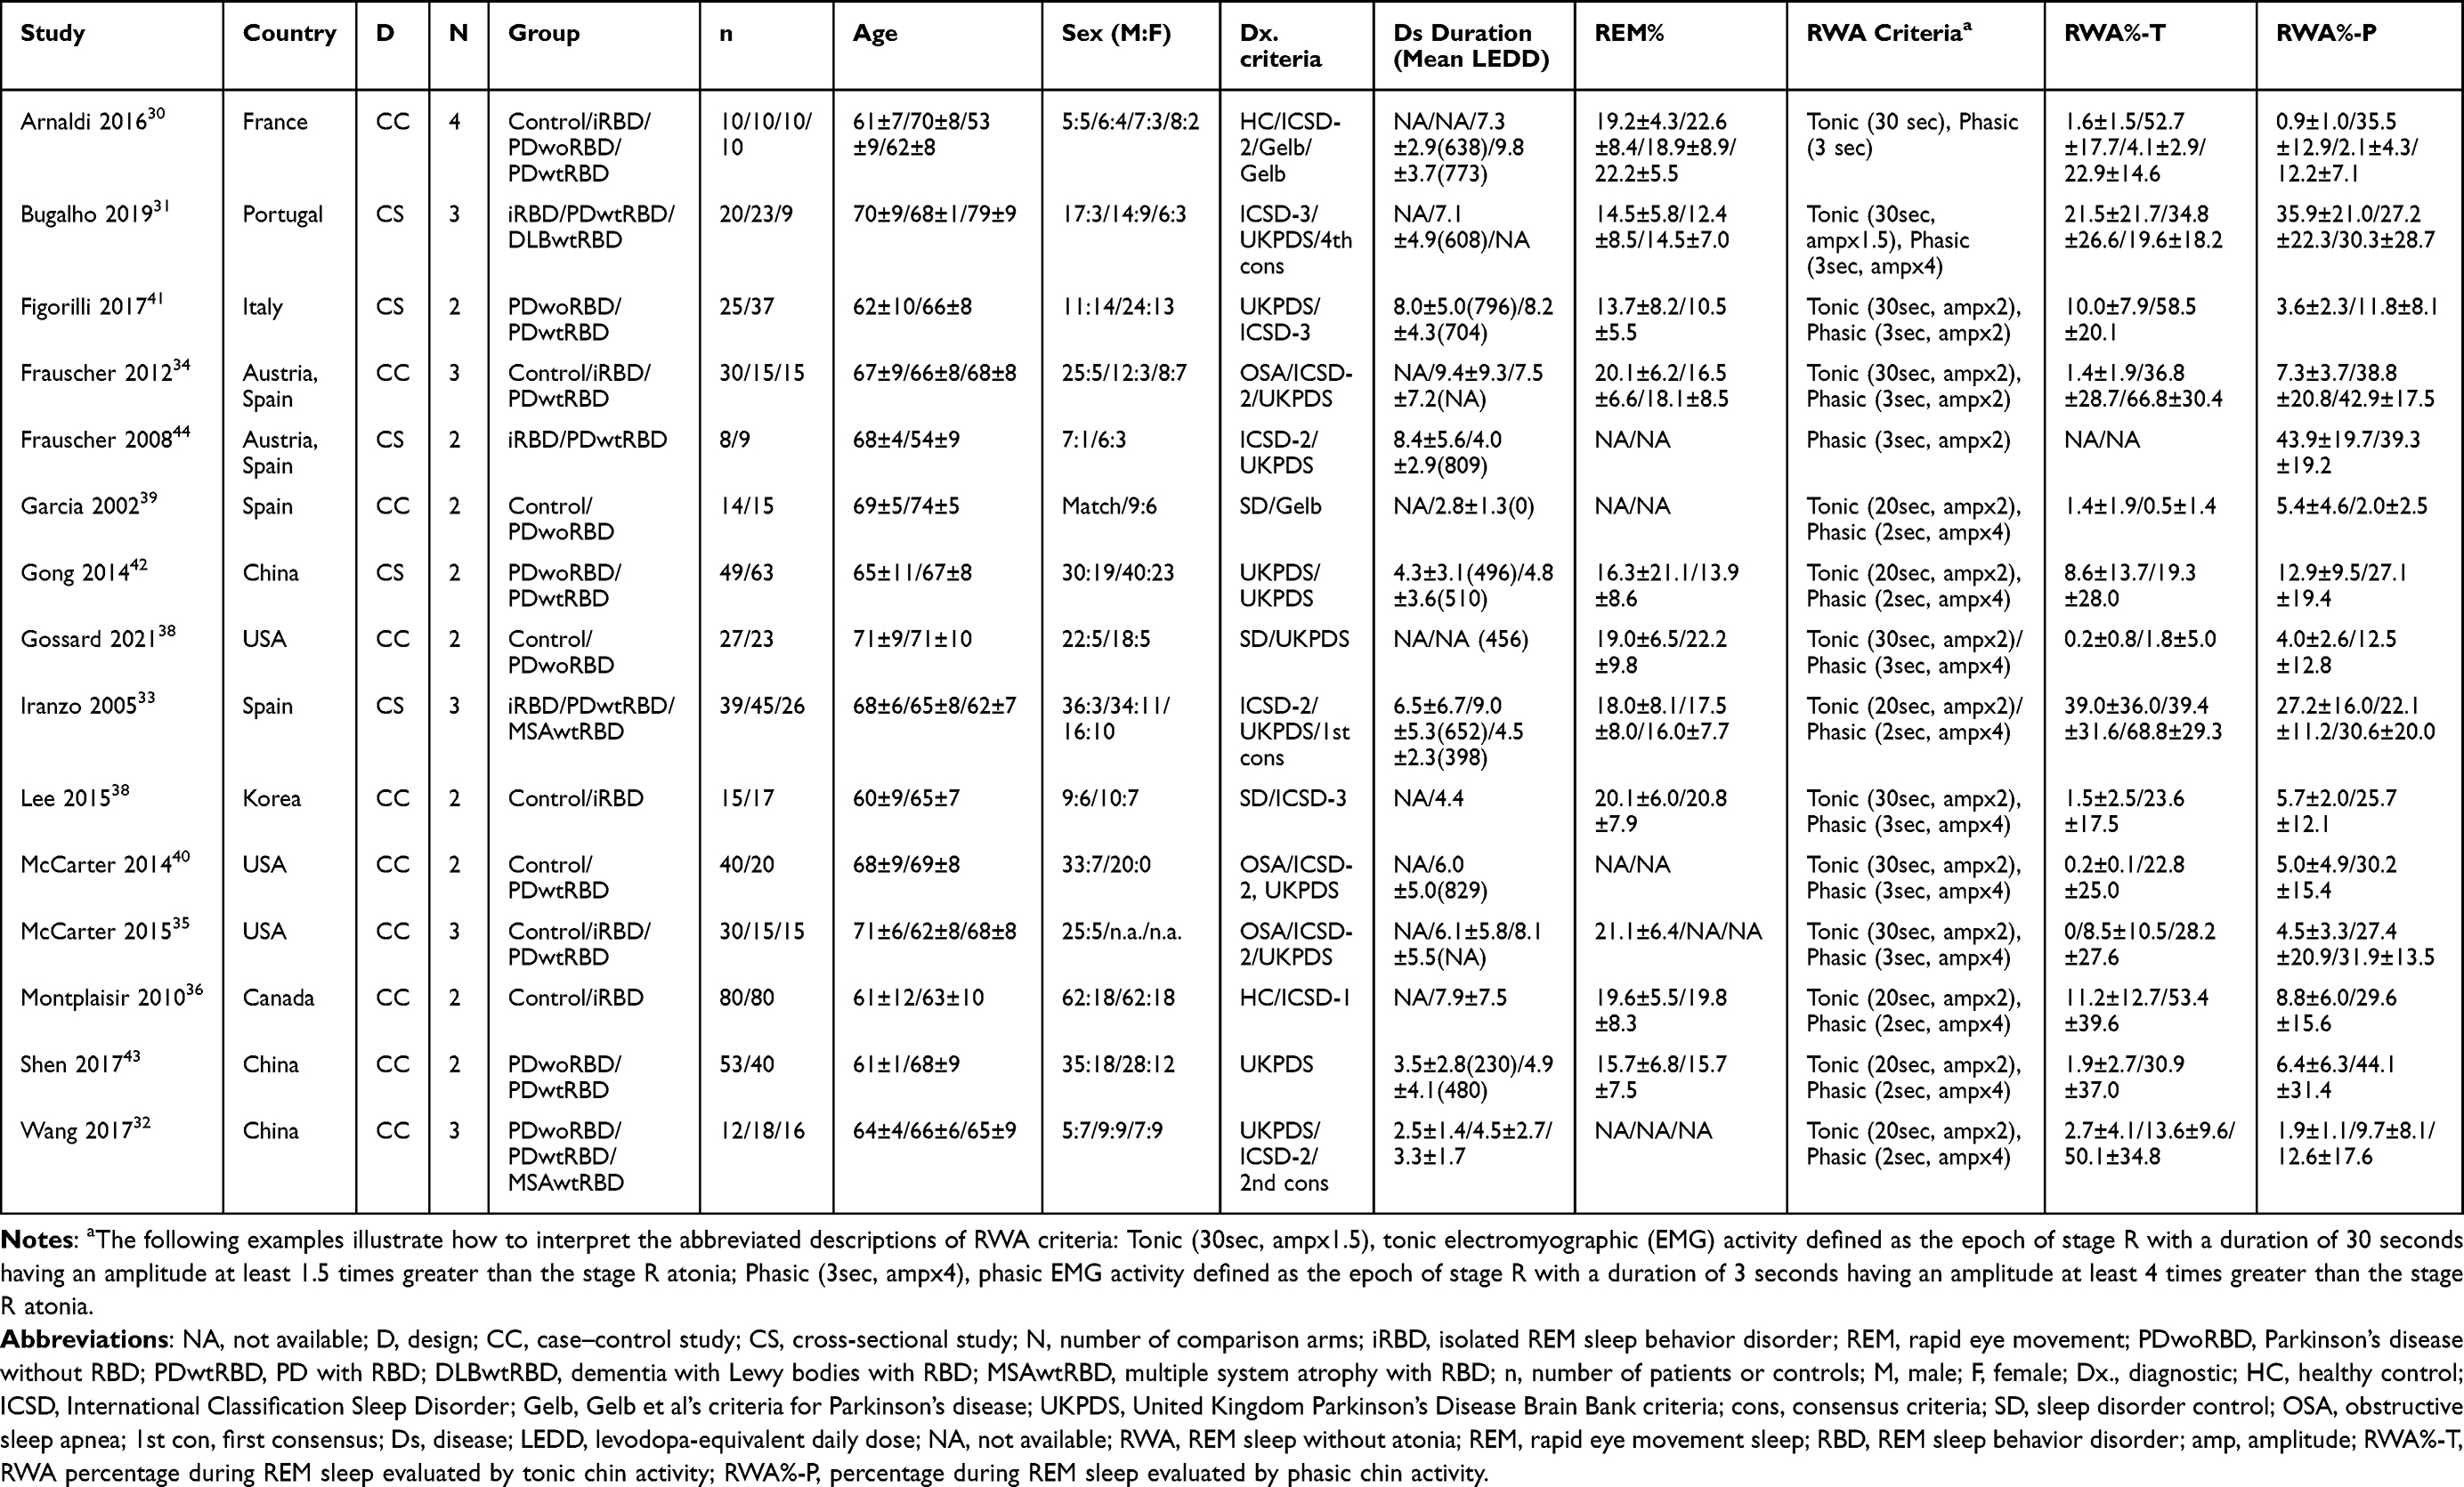 |
Table 1 Characteristics of the Studies Included in the Meta-Analysis |
Concerning RWA%-P, one study compared it among four groups,30 and five studies compared it among three groups.31–35 The remaining nine studies compared it between the two groups.36–44 The number of studies that provided information for the RWA% for each type of α-synucleinopathy phenotype was as follows: eight for iRBD (tn=204),30,31,33–37,44 seven for PDwoRBD (tn=187),30,32,38,39,41–43 eleven for PDwtRBD (tn=295),30–35,40–44 two for MSAwtRBD (tn=42),32,33 and one for DLBwtRBD (tn=9).31 Eight of the included studies provided information for the controls (tn=246).30,34–40
Figure 2 shows the network of eligible group comparisons for RWA%-T and RWA%-P. Each edge represents the presence of a direct comparison, and the thickness of the edges represents the number of direct comparisons. Groups with iRBD, PDwtRBD and PDwoRBD had at least one comparison with the control groups.
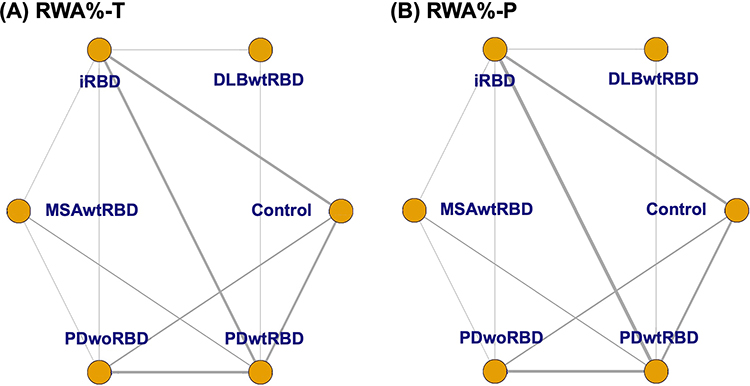 |
Figure 2 Network of eligible comparisons of REM sleep without atonia across the α-synucleinopathy spectrum. Each edge represents the presence of a direct comparison, and the thickness of the edges represents the number of direct comparisons. (A) The most frequent combinations for direct comparison in RWA%-T were iRBD vs. controls, iRBD vs. PDwtRBD, and PDwoRBD vs. PDwtRBD (each n=5), followed by PDwtRBD vs. controls (n=4), PDwoRBD vs. controls (n=3), and PDwtRBD vs. MSAwtRBD (n=2). (B) In phasic RWA, iRBD vs. PDwtRBD was the most frequent direct comparison (n=6), followed by iRBD vs. controls, PDwoRBD vs. PDwtRBD (each n=5), PDwtRBD vs. controls (n=4), PDwoRBD vs. controls (n=3), and PDwtRBD vs. MSAwtRBD (n=2). In other group pairs, only a single study or no study performed a direct comparison between the two groups. Abbreviations: RWA%-T, RWA percentage during REM sleep evaluated by tonic chin activity; RWA%-P, RWA percentage during REM sleep evaluated by phasic chin activity; RBD, REM sleep behavior disorder; iRBD, isolated RBD; DLBwtRBD, dementia with Lewy bodies with RBD; PDwtRBD, Parkinson's disease with RBD; PDwoRBD, Parkinson's disease without RBD; MSAwtRBD, multiple system atrophy with RBD. |
The most frequent direct comparisons in RWA%-T were iRBD vs controls30,34–37 and iRBD vs PDwtRBD30,31,33–35 (each n=5), followed by PDwtRBD vs controls30,34,35,40 and PDwoRBD vs PDwtRBD30,32,41,42 (each n=4), PDwoRBD vs controls (n=3),30,38,39 and PDwtRBD vs MSAwtRBD (n=2).32,33 In RWA%-P, iRBD vs PDwtRBD30,31,33–35,44 was the most frequent direct comparison (n=6), followed by iRBD vs controls (n=5),30,34–37 PDwtRBD vs controls30,34,35,40 and PDwoRBD vs PDwtRBD30,32,41,42 (each n=4), PDwoRBD vs controls (n=3),30,38,39 and PDwtRBD vs MSAwtRBD (n=2).32,33 In other group pairs, only a single study or no study performed a direct comparison between the two groups.
Outcome of Pairwise Meta-Analysis
Detailed results of the pairwise meta-analyses are presented in Table 2. Patients with iRBD and PDwtRBD had higher tonic or phasic RWA than controls. PDwtRBD showed a higher RWA%-T or RWA%-P than PDwoRBD. There was no significant difference observed during the direct comparison of the severity of REM atonia loss between PDwoRBD patients and controls or between iRBD patients and PDwtRBD patients.
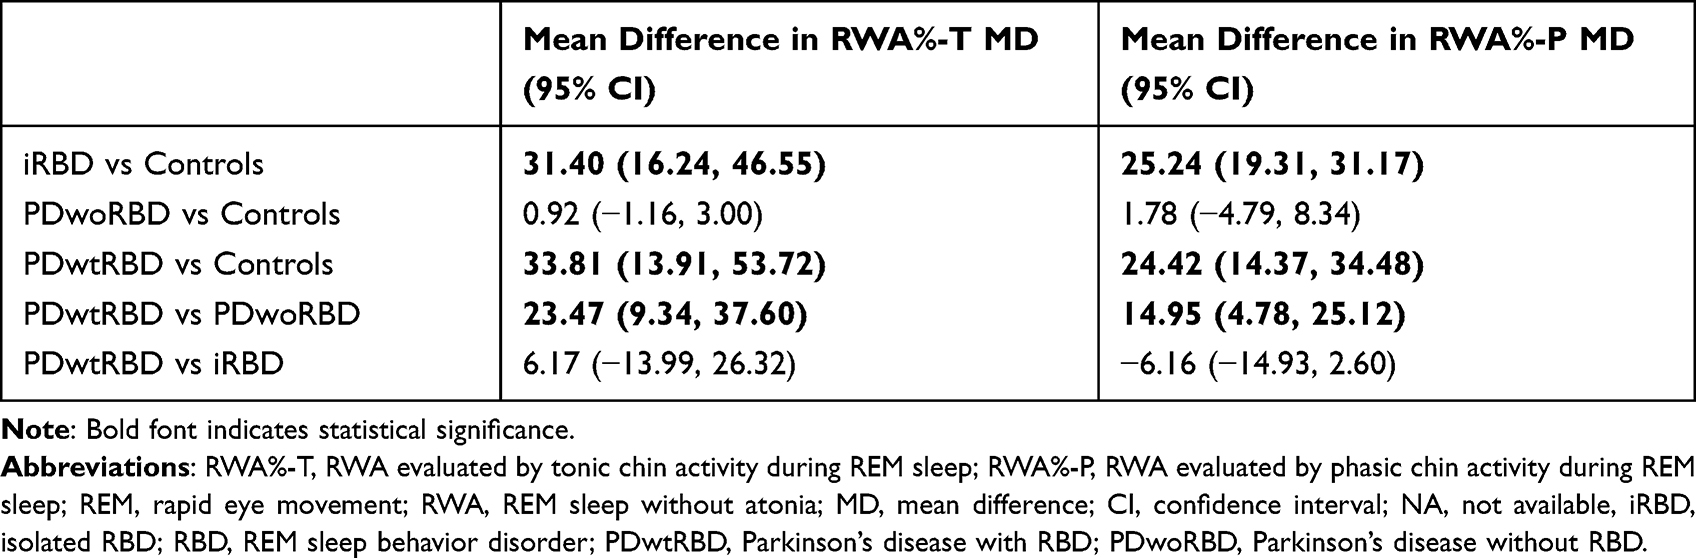 |
Table 2 Summary Estimates from Pairwise Meta-Analyses of Direct Comparisons of RWA%-T and RWA%-P |
The direct pairwise models showed substantial heterogeneity, with I2 values above 75% in all comparisons (I2 values ranging from 79.2 to 95.1%) regarding the RWA%-T (Supplementary Table 3). Except for the comparisons involving iRBD vs controls, all group comparisons in RWA%-P had I2 values above 75% (I2 values varied from 31.1 to 90.9%) (Supplementary Table 4).
Outcome of NMA
The results of the NMA for RWA%-T and RWA%-P are presented as forest plots (Figure 3) and tables (Table 3 and 4, respectively). Regarding RWA%-T, the MSAwtRBD group showed a higher percentage than all of the other groups. The RWA%-T was the second highest in the PDwtRBD group, followed by the iRBD and DLBwtRBD groups. The RWA%-T was higher in the PDwoRBD groups than in the controls, but there was no statistical significance. Regarding the RWA%-P, iRBD had the highest percentage, followed by MSAwtRBD, DLBwtRBD, and PDwtRBD.
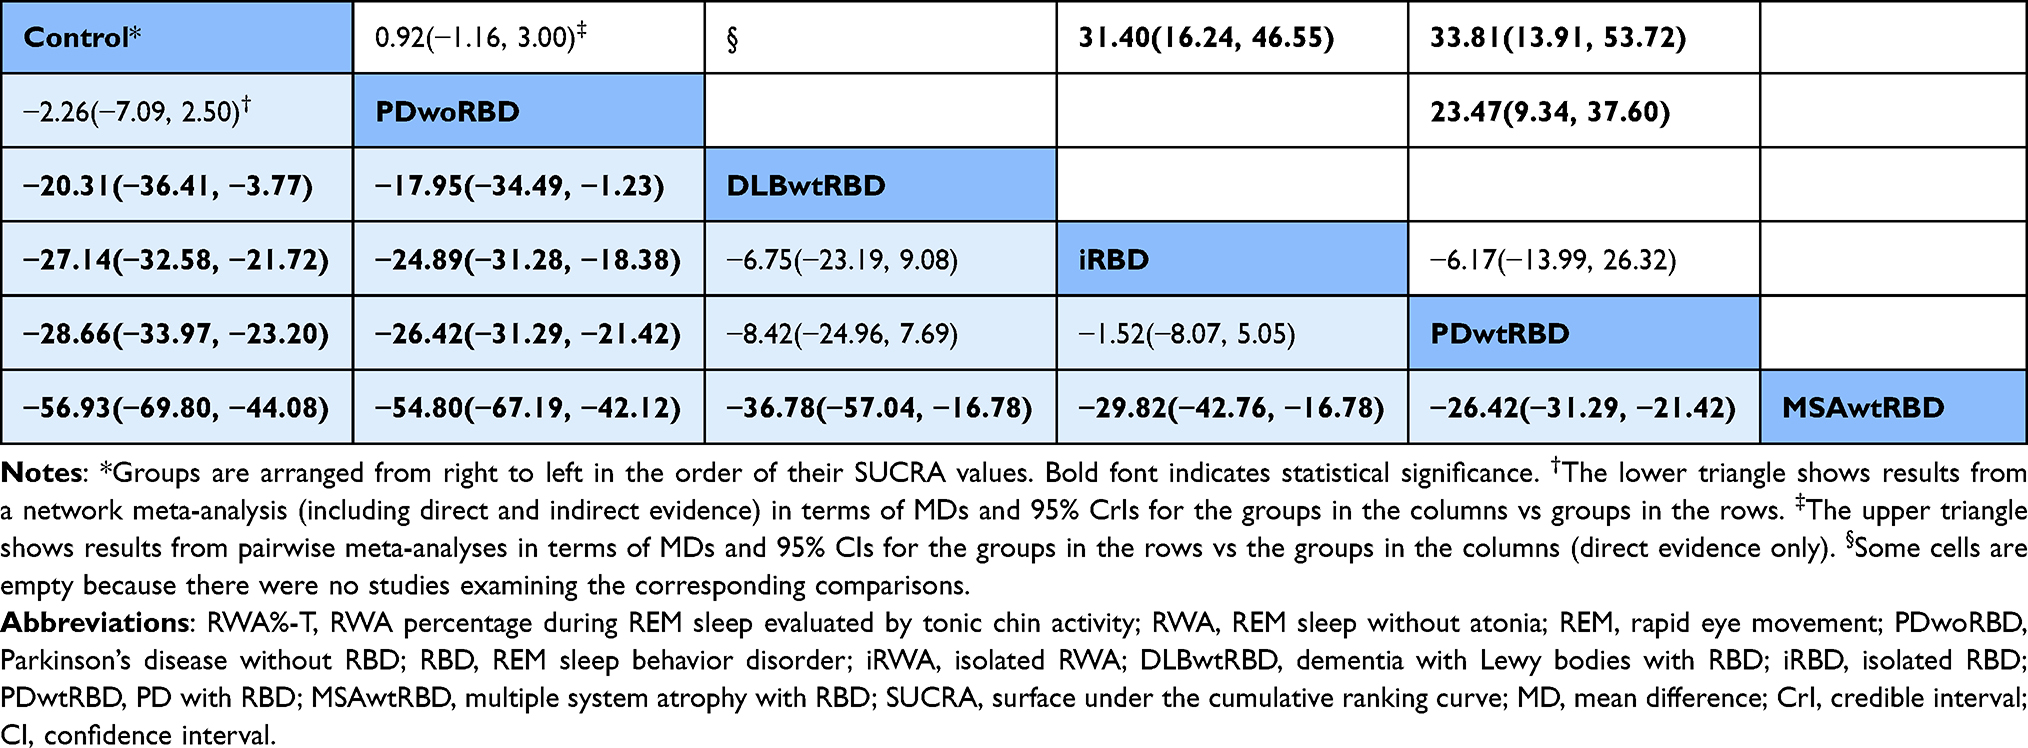 |
Table 3 Table Showing Differences in RWA%-T Across the α-Synucleinopathy Spectrum |
 |
Table 4 Table Showing Differences in RWA%-P Across the α-Synucleinopathy Spectrum |
 |
Figure 3 Forest plot of network meta-analysis for RWA percentage during REM sleep evaluated by tonic chin activity (RWA%-T) or phasic chin activity (RWA%-P) among the α-synucleinopathies spectrum. (A) Regarding RWA%-T, the MSAwtRBD group showed a higher percentage than all other groups. The RWA%-T was the second highest in the PDwtRBD group, followed by iRBD and DLBwtRBD. The RWA%-T was higher in PDwoRBD patients than in controls, but there was no statistical significance. (B) Regarding the RWA%-P, iRBD had the highest percentage, followed by MSAwtRBD, DLBwtRBD, and PDwtRBD. There was no significant difference between the DLBwtRBD patients and the controls. Abbreviations: RWA%-T, RWA percentage during REM sleep evaluated by tonic chin activity; RWA%-P, RWA percentage during REM sleep evaluated by phasic chin activity; RBD, REM sleep behavior disorder; iRBD, isolated RBD; DLBwtRBD, dementia with Lewy bodies with RBD; PDwtRBD, Parkinson's disease with RBD; PDwoRBD, Parkinson's disease without RBD; MSAwtRBD, multiple system atrophy with RBD. |
The rank probabilities of RWA%-T and RWA%-P based on SUCRA are presented in Supplementary Table 5 and Supplementary Figure 3. Regarding the RWA%-T, the MSAwtRBD group (SUCRA 1.000) had the highest rank, followed by PDwtRBD (SUCRA 0.709), iRBD (SUCRA 0.621), DLBwtRBD (SUCRA 0.465), and PDwoRBD (SUCRA 0.168). Regarding the RWA%-P, iRBD (SUCRA 0.855) had the highest rank, followed by MSAwtRBD (SUCRA 0.742), DLBwtRBD (SUCRA 0.639), PDwtRBD (SUCRA 0.543), and PDwoRBD (SUCRA 0.209).
Looking at the ranking probabilities obtained from the network meta-analysis, the ranking probabilities of RWA%-T were more than 50% in all rankings, and the ordering was distinct. On the other hand, those of RWA%-P were lower than 50% from the first to fourth ranks, and the orders were ambiguous (Supplementary Figure 1).
The mean age of each group was 65.5±10.4 for iRBD, 64.2±9.3 for PDwoRBD, 66.3±8.0 for PDwtRBD, 63.1±7.9 for MSAwtRBD, 79±9 for DLBwtRBD, and 65.6±10.4 for the controls. NMA revealed no significant age difference between controls and α-synucleinopathy phenotypes, except for DLBwtRBD, of which age was higher than the controls or PDwoRBD. However, the significance of the age difference should be further investigated because only a single study evaluated DLBwtRBD. We further performed an exploratory pairwise comparison of disease duration in studies that compared PDwtRBD and PDwoRBD. The disease duration in PDwtRBD (5.8±4.1) was longer than that in PDwoRBD (4.7±3.7, p=0.015). The MD of age between the two groups was 1.2 years with a 95% confidence interval of 0.5–1.9 years.
Quality of the Included Studies
Methodological quality was assessed using NOS scores, and the results are presented in Supplementary Table 6. All of the studies had NOS scores greater than or equal to 5, indicating that all studies had a low risk for bias. The NOS score was 8 in one study,36 7 in eight studies,30,32,34,35,37,39–42 6 in four studies,30,31 and 5 in the rest.33,44 Star was not awarded in terms of the “representativeness of cases” in two studies30,38 because of the retrospective selection of patients. Only three studies30,36,39 were awarded a star in the “Selection of Controls” because most studies included hospital controls. Regarding “comparability”, only one star was awarded in four studies,30,31,39,43 and the star was not awarded in another two studies33,44 because of group differences in age, sex or both.
Assessment of Inconsistency
We used the node-splitting model to assess the inconsistency between direct and indirect comparisons. The null hypothesis of consistency can be excluded when p<0.05 in the tests. Regarding the RWA%-T, the inconsistency test revealed no significant disagreement between any direct and indirect comparisons (Supplementary Figure 2). Regarding the RWA%-P, the test indicated no significant discrepancy in all but one pair. The pair of PDwtRBD and PDwoRBD was the only pair that showed significant inconsistency (p=0.036) (Supplementary Figure 3). The DIC values for RWA%-T and RWA%-P were 92.81 and 76.08, respectively.
Evaluation of Evidence Certainty for the Outcomes
Most of the certainty of evidence for the pooled estimates was graded as “very low” because of a serious or very serious risk for bias due to patient selection and an inconsistency between the included studies and imprecision due to wide confidence intervals (Supplementary Tables 7 and 8).
Discussion
This review evaluated 15 studies that compared RWA%-T or RWA%-P among prodromal or overt α-synucleinopathy phenotypes and controls. All other groups except PDwoRBD had higher RWA%-T than controls. RWA%-P was more elevated in the other groups, except for PDwoRBD and DLBwtRBD, than in the controls. Looking at the rank orders obtained from this review and their statistical significance, we can see this relationship. Compared with the controls, RWA%-T was higher in all groups with RBD but was comparable in PDwoRBD. The rank of RWA%-T was highest in RBD patients with MSA, followed by those with PD and iRBD patients. In contrast, the ranking probabilities and the surface under the cumulative ranking displayed the iRBD as the first for RWA%-P. Previous reports showed that RWA%-T was more closely associated with neurodegeneration than RWA%-P.12,32,39
The difference in the rank order between RWA%-T and RWA%-P may be due to the different pathomechanisms of these two forms of RWA.2 RWA%-T is associated with degeneration of the sublaterodorsal nucleus,1 which is suggested to be associated with an increased risk for PD.12 Studies have shown that increased RWA%-T in iRBD is associated with future progression to α-synucleinopathy phenotypes.11,12,45 RWA%-P, however, is related to changes in intermediate ventromedial medulla pathways.1 Moreover, RWA%-P is more readily influenced by medications, such as levodopa39 or antidepressants,46 than RWA%-T.
This review showed that MSAwtRBD had the highest RWA%-T among α-synucleinopathy phenotypes. This observation was consistent with the pathomechanism of MSA. Unlike PD, which affects neurons in selected brain regions, MSA affects oligodendroglia throughout the brain in the form of α-synuclein-positive glial cytoplasmic inclusions.47 MSA patients may have higher RWA%-T than patients with the other α-synucleinopathy phenotypes because of diffuse brainstem involvement. Due to symptom overlap, MSA is often misdiagnosed as PD.48 RWA%-T may assist in distinguishing MSAwtRBD from PDwtRBD, as suggested in a previous study.32
In this review, the RWA%-T in DLBwtRBD ranked lower than that in iRBD or PDwtRBD. Moreover, their RWA%-P increment was not statistically significant compared to the controls. Statistics might have distorted the results because a single included study evaluated a small amount of DLBwtRBD patient data. There is, however, a plausible explanation for the results. In PD, two subtypes are suggested according to the propagation of α-synucleinopathy: the brain-first and body-first subtypes.49,50 The pathologic progression of DLB may mimic the brain-first type, with pathologic alterations first appearing in the brain and then spreading to the brainstem. Consequently, in the early disease stage of DLB, dementia, rather than motor symptoms, is predominant.51 A previous study found that the severity of REM atonia loss measured by chin tonic activity was linked to the risk for PD but not for dementia.12
The loss of REM sleep atonia in PD may be related to specific neurodegenerative alterations affecting certain brainstem neurons.52 The α-synuclein pathology in some PD takes anatomic routes that differ from those described in the Braak model.53 They could be the brain-first PD patients who develop parkinsonism before losing REM sleep atonia.49 The presence of RWA is reported in 40–75% of PD patients, and DEB is reported in only 50–58% of patients with RWA.10,43,54 In this review, the loss of REM sleep atonia did not differ between PDwoRBD patients and controls. The findings might support that the RWA in PD is not an intrinsic characteristic but an epiphenomenon of specific anatomical involvement.52
PDwtRBD patients showed increased RWA%-T and RWA%-P compared to PDwoRBD patients and controls. Because excessive RWA is required for the diagnosis of RBD, the result was to be expected and was consistent with previous studies.42,43 RBD in PD is associated with more severe motor or nonmotor symptoms and a longer duration of PD.55 RWA in PD patients was also associated with disease duration and motor or nonmotor disease severity.15,56 In line with these reports, comparison of disease duration using primary studies of this review showed significantly longer disease duration in PDwtRBD than in PDwoRBD.
Several limitations should be considered when interpreting the results of our meta-analysis. We could not evaluate how the RWA% increased as neurodegeneration progressed because most included studies were cross-sectional studies rather than longitudinal studies. There was significant bias in patient selection because of the retrospective nature of the studies. Specific criteria for RWA% quantification may vary between the studies; however, they overall rate the percentage of RWA during REM sleep. Moreover, due to a lack of studies, we could not include studies providing information on MSA or DLB patients who did not have RBD. This meta-analysis did not evaluate the possible effects of confounders such as medication, comorbid sleep disorders, or ethnic differences. Future prospective and well-controlled longitudinal studies may be helpful in better understanding the relationship between RWA%-T and neurodegenerative processes.
Because most studies evaluating RWA have used tonic or phasic chin muscle activity until now, we only used the information using chin EMG for the NMA. Future research may reveal more subtle changes associated with neurodegeneration by evaluating RWA% with mixed RWA, which best predicts phenoconversion in iRBD,13 or by additionally considering upper limb muscle activity, which has higher diagnostic value than chin EMG alone.57,58 If information from other studies additionally considering mixed RWA, upper limb muscle activity or combined muscle activities becomes sufficient, a more sophisticated NMA evaluation of the relationship between RWA and the α-synucleinopathy spectrum would be conceivable.
Conclusions
In this NMA, we compared RWA%-T and RWA%-P between or among the various prodromal or overt α-synucleinopathy phenotypes. MSAwtRBD had the highest RWA%-T, followed by PDwtRBD, iRBD, and DLBwtRBD. Meanwhile, the RWA%-P was highest in iRBD, and the rank orders in RWA%-P were unclear. As a result, RWA%-T seemed to reflect the neurodegenerative process in RBD patients, but RWA%-P may not. In addition, RWA%-T and RWA%-P were lower in PDwoRBD than in PDwtRBD and comparable to controls. More research will be needed to understand the pathomechanism of REM atonia loss in PD.
Abbreviations
REM, rapid eye movement; iRBD, isolated REM sleep behavior disorder; PD, Parkinson’s disease; DLB, dementia with Lewy bodies; MSA, multiple system atrophy; RWA, REM sleep without atonia.
Data Sharing Statement
Data are available from the corresponding author upon reasonable request.
Trial Registration Information
This study was prospectively registered in PROSPERO under registration number CRD42021276445.
Author Contributions
All authors made significant contributions to the work reported, whether in the conception, study design, execution, acquisition of data, analysis and interpretation, or all these areas. Additionally, all took part in drafting, revising or critically reviewing the article; gave final approval of the version to be published; have agreed on the journal to which the article has been submitted; and agree to be accountable for all aspects of the work.
Funding
This work was supported by the National Research Foundation of Korea (NRF) (No. NRF-2020R1C1C1013160, 2022R1H1A2092329). This work was also supported by the National Research Foundation of Korea (NRF) grant funded by the Korean government (MSIP) (2017R1A2B2012280), the Brain Research Program through the National Research Foundation of Korea (NRF) funded by the Ministry of Science, ICT & Future Planning (2017M3C7A1029688).
Disclosure
The authors report no conflicts of interest in this work.
References
1. Boeve BF, Silber MH, Saper CB, et al. Pathophysiology of REM sleep behaviour disorder and relevance to neurodegenerative disease. Brain. 2007;130(11):2770–2788. doi:10.1093/brain/awm056
2. Högl B, Stefani A, Videnovic A. Idiopathic REM sleep behaviour disorder and neurodegeneration—an update. Nat Rev Neurol. 2018;14(1):40–55. doi:10.1038/nrneurol.2017.157
3. You S, Jeon SM, Cho YW. Rapid eye movement sleep behavior disorder. J Sleep Med. 2018;15(1):1–7. doi:10.13078/jsm.18001
4. Postuma RB, Iranzo A, Hu M, et al. Risk and predictors of dementia and parkinsonism in idiopathic REM sleep behaviour disorder: a multicentre study. Brain. 2019;142(3):744–759. doi:10.1093/brain/awz030
5. Galbiati A, Verga L, Giora E, Zucconi M, Ferini-Strambi L. The risk of neurodegeneration in REM sleep behavior disorder: a systematic review and meta-analysis of longitudinal studies. Sleep Med Rev. 2019;43:37–46. doi:10.1016/j.smrv.2018.09.008
6. Miglis MG, Adler CH, Antelmi E, et al. Biomarkers of conversion to alpha-synucleinopathy in isolated rapid-eye-movement sleep behaviour disorder. Lancet Neurol. 2021;20(8):671–684. doi:10.1016/S1474-4422(21)00176-9
7. McCann H, Stevens CH, Cartwright H, Halliday GM. alpha-synucleinopathy phenotypes. Parkinsonism Relat Disord. 2014;20(Suppl 1):S62–S67. doi:10.1016/S1353-8020(13)70017-8
8. Howell MJ, Schenck CH. Rapid eye movement sleep behavior disorder and neurodegenerative disease. JAMA Neurol. 2015;72(6):707–712. doi:10.1001/jamaneurol.2014.4563
9. Boeve BF. REM sleep behavior disorder: updated review of the core features, the REM sleep behavior disorder-neurodegenerative disease association, evolving concepts, controversies, and future directions. Ann N Y Acad Sci. 2010;1184(1):15–54. doi:10.1111/j.1749-6632.2009.05115.x
10. Dijkstra F, Van den Bossche K, de Bruyn B, et al. REM sleep without atonia and the relation with Lewy body disease. Parkinsonism Relat Disord. 2019;67:90–98. doi:10.1016/j.parkreldis.2019.07.007
11. Iranzo A, Ratti PL, Casanova-Molla J, Serradell M, Vilaseca I, Santamaria J. Excessive muscle activity increases over time in idiopathic REM sleep behavior disorder. Sleep. 2009;32(9):1149–1153. doi:10.1093/sleep/32.9.1149
12. Postuma RB, Gagnon JF, Rompre S, Montplaisir JY. Severity of REM atonia loss in idiopathic REM sleep behavior disorder predicts Parkinson disease. Neurology. 2010;74(3):239–244. doi:10.1212/WNL.0b013e3181ca0166
13. Nepozitek J, Dostalova S, Dusek P, et al. Simultaneous tonic and phasic REM sleep without atonia best predicts early phenoconversion to neurodegenerative disease in idiopathic REM sleep behavior disorder. Sleep. 2019;42(9):zsz132. doi:10.1093/sleep/zsz132
14. Liu Y, Zhang J, Chau SWH, et al. Evolution of prodromal REM sleep behavior disorder to neurodegeneration: a Retrospective Longitudinal Case-Control Study. Neurology. 2022;99(6):e627–e637. doi:10.1212/wnl.0000000000200707
15. Shen Y, Xiong KP, Li J, et al. Clinical correlates of rapid eye movement sleep without atonia in Parkinson’s disease. Clin Neurophysiol. 2015;126(6):1198–1203. doi:10.1016/j.clinph.2014.09.014
16. de Natale ER, Wilson H, Politis M. Predictors of RBD progression and conversion to synucleinopathies. Curr Neurol Neurosci Rep. 2022;22(2):93–104. doi:10.1007/s11910-022-01171-0
17. Antoniou SA, Koelemay M, Antoniou GA, Mavridis D. A practical guide for application of network meta-analysis in evidence synthesis. Eur J Vasc Endovasc Surg. 2019;58(1):141–144. doi:10.1016/j.ejvs.2018.10.023
18. Rouse B, Chaimani A, Li T. Network meta-analysis: an introduction for clinicians. Intern Emerg Med. 2017;12(1):103–111. doi:10.1007/s11739-016-1583-7
19. Page MJ, McKenzie JE, Bossuyt PM, et al. The PRISMA 2020 statement: an updated guideline for reporting systematic reviews. BMJ. 2021;372:n71. doi:10.1136/bmj.n71
20. Wan X, Wang W, Liu J, Tong T. Estimating the sample mean and standard deviation from the sample size, median, range and/or interquartile range. BMC Med Res Methodol. 2014;14:135. doi:10.1186/1471-2288-14-135
21. Sutton AJ, Abrams KR. Bayesian methods in meta-analysis and evidence synthesis. Stat Methods Med Res. 2001;10(4):277–303. doi:10.1177/096228020101000404
22. Plummer M. JAGS Version 3.3. 0 User Manual. International Agency for Research on Cancer; 2012.
23. Rjags P. Bayesian graphical models using MCMC. R package version 4-12; 2021.
24. van Valkenhoef G, Kuiper J. gemtc: network meta-analysis using Bayesian methods. R package version 1.0–1. Available from: https://CRAN.R-project.org/package=gemtc.
25. Brooks SP, Gelman A. General methods for monitoring convergence of iterative simulations. J Comput Graph Stat. 1998;7(4):434–455. doi:10.1080/10618600.1998.10474787
26. Spiegelhalter DJ, Best NG, Carlin BP, Van der linde A. Bayesian measures of model complexity and fit. J R Stat Soc Ser B. 2002;64(4):583–639. doi:10.1111/1467-9868.00353
27. Wells GA, Shea B, Connell DO, et al. The Newcastle-Ottawa Scale (NOS) for assessing the quality of nonrandomised studies in meta-analyses. Available from: http://www.ohri.ca/programs/clinical_epidemiology/oxford.asp.
28. Schünemann H, Brożek J, Guyatt G, Oxman A GRADE handbook for grading quality of evidence and strength of recommendations. Available from: https://gdt.gradepro.org/app/handbook/handbook.html.
29. University and Evidence Prime. GRADEpro GDT: GRADEpro Guideline Development Tool [Software]. University and Evidence Prime; 2021.
30. Arnaldi D, Latimier A, Leu-Semenescu S, De Carli F, Vidailhet M, Arnulf I. Does postural rigidity decrease during REM sleep without atonia in Parkinson disease? J Clin Sleep Med. 2016;12(6):839–847. doi:10.5664/jcsm.5882
31. Bugalho P, Salavisa M, Marto JP, Borbinha C, Alves L. Polysomnographic data in Dementia with Lewy bodies: correlation with clinical symptoms and comparison with other α-synucleinopathies. Sleep Med. 2019;55:62–68. doi:10.1016/j.sleep.2018.12.006
32. Wang Y, Shen Y, Xiong KP, et al. Tonic electromyogram density in multiple system atrophy with predominant Parkinsonism and Parkinson’s disease. Chin Med J. 2017;130(6):684–690. doi:10.4103/0366-6999.201603
33. Iranzo A, Santamaria J, Rye D, et al. Characteristics of idiopathic REM sleep behavior disorder and that associated with MSA and PD. Neurology. 2005;65(2):247–252. doi:10.1212/01.wnl.0000168864.97813.e0
34. Frauscher B, Iranzo A, Gaig C, et al. Normative EMG values during REM sleep for the diagnosis of REM sleep behavior disorder. Sleep. 2012;35(6):835–847. doi:10.5665/sleep.1886
35. McCarter SJ, St. Louis EK, Sandness DJ, et al. Antidepressants increase REM sleep muscle tone in patients with and without REM sleep behavior disorder. Sleep. 2015;38(6):907–917. doi:10.5665/sleep.4738
36. Montplaisir J, Gagnon JF, Fantini ML, et al. Polysomnographic diagnosis of idiopathic REM sleep behavior disorder. Mov Disord. 2010;25(13):2044–2051. doi:10.1002/mds.23257
37. Lee SA, Kim CS, Cho CU, Kim B, Lee GH. Quantitative EMG criteria for diagnosing idiopathic REM sleep behavior disorder. Sleep Breath. 2015;19(2):685–691. doi:10.1007/s11325-014-1077-7
38. Gossard TR, McCarter SJ, Gorres E, et al. Quantitative REM Sleep without atonia in Parkinson’s disease and essential tremor. Mov Disord Clin Pract. 2021;8(1):37–43. doi:10.1002/mdc3.13112
39. Garcia-Borreguero D, Caminero AB, De La Llave Y, et al. Decreased phasic EMG activity during rapid eye movement sleep in treatment-naive Parkinson’s disease: effects of treatment with levodopa and progression of illness. Mov Disord. 2002;17(5):934–941. doi:10.1002/mds.10233
40. McCarter SJ, St. Louis EK, Duwell EJ, et al. Diagnostic thresholds for quantitative REM sleep phasic burst duration, phasic and tonic muscle activity, and REM atonia index in REM sleep behavior disorder with and without comorbid obstructive sleep apnea. Sleep. 2014;37(10):1649–1662. doi:10.5665/sleep.4074
41. Figorilli M, Ferri R, Zibetti M, et al. Comparison between automatic and visual scorings of REM sleep without atonia for the diagnosis of REM sleep behavior disorder in Parkinson disease. Sleep. 2017;40(2):zsw060. doi:10.1093/sleep/zsw060
42. Gong Y, Xiong KP, Mao CJ, et al. Clinical manifestations of Parkinson disease and the onset of rapid eye movement sleep behavior disorder. Sleep Med. 2014;15(6):647–653. doi:10.1016/j.sleep.2013.12.021
43. Shen Y, Dai YP, Wang Y, et al. Two polysomnographic features of REM sleep behavior disorder: clinical variations insight for Parkinson’s disease. Parkinsonism Relat Disord. 2017;44:66–72. doi:10.1016/j.parkreldis.2017.09.003
44. Frauscher B, Iranzo A, Hogl B, et al. Quantification of electromyographic activity during REM sleep in multiple muscles in REM sleep behavior disorder. Sleep. 2008;31(5):724–731. doi:10.1093/sleep/31.5.724
45. Liu Y, Zhang J, Lam SP, et al. Electromyography activity level in rapid eye movement sleep predicts neurodegenerative diseases in idiopathic rapid eye movement sleep behavior disorder: a 5-year longitudinal study. Sleep Med. 2019;56:128–134. doi:10.1016/j.sleep.2019.01.018
46. Postuma RB, Gagnon JF, Tuineaig M, et al. Antidepressants and REM sleep behavior disorder: isolated side effect or neurodegenerative signal? Sleep. 2013;36(11):1579–1585. doi:10.5665/sleep.3102
47. Ahmed Z, Asi YT, Sailer A, et al. The neuropathology, pathophysiology and genetics of multiple system atrophy. Neuropathol Appl Neurobiol. 2012;38(1):4–24. doi:10.1111/j.1365-2990.2011.01234.x
48. Koga S, Aoki N, Uitti RJ, et al. When DLB, PD, and PSP masquerade as MSA: an autopsy study of 134 patients. Neurology. 2015;85(5):404–412. doi:10.1212/WNL.0000000000001807
49. Horsager J, Andersen KB, Knudsen K, et al. Brain-first versus body-first Parkinson’s disease: a multimodal imaging case-control study. Brain. 2020;143(10):3077–3088. doi:10.1093/brain/awaa238
50. Borghammer P, Horsager J, Andersen K, et al. Neuropathological evidence of body-first vs. brain-first Lewy body disease. Neurobiol Dis. 2021;161:105557. doi:10.1016/j.nbd.2021.105557
51. McKeith IG, Boeve BF, Dickson DW, et al. Diagnosis and management of dementia with Lewy bodies: fourth consensus report of the DLB consortium. Neurology. 2017;89(1):88–100. doi:10.1212/WNL.0000000000004058
52. Eisensehr I, Linke R, Noachtar S, Schwarz J, Gildehaus FJ, Tatsch K. Reduced striatal dopamine transporters in idiopathic rapid eye movement sleep behaviour disorder. Comparison with Parkinson’s disease and controls. Brain. 2000;123((Pt 6)(6)):1155–1160. doi:10.1093/brain/123.6.1155
53. Beach TG, Adler CH, Lue L, et al. Unified staging system for Lewy body disorders: correlation with nigrostriatal degeneration, cognitive impairment and motor dysfunction. Acta Neuropathol. 2009;117(6):613–634. doi:10.1007/s00401-009-0538-8
54. Gagnon JF, Bédard MA, Fantini ML, et al. REM sleep behavior disorder and REM sleep without atonia in Parkinson’s disease. Neurology. 2002;59(4):585–589. doi:10.1212/wnl.59.4.585
55. Zhu R, Xie C, P-P P, Wang K. Clinical variations in Parkinson’s disease patients with or without REM sleep behaviour disorder: a meta-analysis. Sci Rep. 2017;7(1):40779. doi:10.1038/srep40779
56. Chahine LM, Kauta SR, Daley JT, Cantor CR, Dahodwala N. Surface EMG activity during REM sleep in Parkinson’s disease correlates with disease severity. Park Relat Disord. 2014;20(7):766–771. doi:10.1016/j.parkreldis.2014.04.011
57. Fernández-Arcos A, Iranzo A, Serradell M, et al. Diagnostic value of isolated mentalis versus mentalis plus upper limb electromyography in idiopathic REM sleep behavior disorder patients eventually developing a neurodegenerative syndrome. Sleep. 2017;40(4):zsx025. doi:10.1093/sleep/zsx025
58. Byun JI, Yang TW, Sunwoo JS, Shin WC, Kwon OY, Jung KY. Comparison of rapid eye movement without atonia quantification methods to diagnose rapid eye movement sleep behavior disorder: a systematic review. Sleep. 2022;45(9):zsac150. doi:10.1093/sleep/zsac150
 © 2023 The Author(s). This work is published and licensed by Dove Medical Press Limited. The
full terms of this license are available at https://www.dovepress.com/terms
and incorporate the Creative Commons Attribution
- Non Commercial (unported, 3.0) License.
By accessing the work you hereby accept the Terms. Non-commercial uses of the work are permitted
without any further permission from Dove Medical Press Limited, provided the work is properly
attributed. For permission for commercial use of this work, please see paragraphs 4.2 and 5 of our Terms.
© 2023 The Author(s). This work is published and licensed by Dove Medical Press Limited. The
full terms of this license are available at https://www.dovepress.com/terms
and incorporate the Creative Commons Attribution
- Non Commercial (unported, 3.0) License.
By accessing the work you hereby accept the Terms. Non-commercial uses of the work are permitted
without any further permission from Dove Medical Press Limited, provided the work is properly
attributed. For permission for commercial use of this work, please see paragraphs 4.2 and 5 of our Terms.