Back to Journals » International Journal of Chronic Obstructive Pulmonary Disease » Volume 15
Quantitative CT Analysis in Patients with Pulmonary Emphysema: Do Calculated Differences Between Full Inspiration and Expiration Correlate with Lung Function?
Authors Song L, Leppig JA, Hubner RH, Lassen-Schmidt BC ![]() , Neumann K
, Neumann K ![]() , Theilig DC, Feldhaus FW
, Theilig DC, Feldhaus FW ![]() , Fahlenkamp UL, Hamm B, Song W, Jin Z
, Fahlenkamp UL, Hamm B, Song W, Jin Z ![]() , Doellinger F
, Doellinger F ![]()
Received 12 March 2020
Accepted for publication 2 July 2020
Published 3 August 2020 Volume 2020:15 Pages 1877—1886
DOI https://doi.org/10.2147/COPD.S253602
Checked for plagiarism Yes
Review by Single anonymous peer review
Peer reviewer comments 3
Editor who approved publication: Prof. Dr. Richard Russell
Lan Song,1,* Jonas A Leppig,2,* Ralf H Hubner,3 Bianca C Lassen-Schmidt,4 Konrad Neumann,5 Dorothea C Theilig,2 Felix W Feldhaus,2 Ute L Fahlenkamp,2 Bernd Hamm,2 Wei Song,1 Zhengyu Jin,1 Felix Doellinger2
1Department of Radiology, Peking Union Medical College Hospital, Chinese Academy of Medical Sciences and Peking Union Medical College, Beijing, People’s Republic of China; 2Department of Radiology, Charité Universitätsmedizin Berlin, Berlin, Germany; 3Department of Internal Medicine/Infectious Diseases and Respiratory Medicine, Charité Universitätsmedizin Berlin, Berlin, Germany; 4Fraunhofer Institute for Digital Medicine MEVIS, Bremen, Germany; 5Institute of Biometrics and Clinical Epidemiology, Charité Universitätsmedizin Berlin, Berlin, Germany
*These authors contributed equally to this work
Correspondence: Zhengyu Jin
Department of Radiology, Peking Union Medical College Hospital, Chinese Academy of Medical Sciences and Peking Union Medical College, Shuaifuyuan No. 1, Dongcheng District, Beijing, People’s Republic of China
Tel +86 10 69 155 439
Fax +86 10 69 155 058
Email [email protected]
Purpose: The aim of this retrospective study was to evaluate correlations between parameters of quantitative computed tomography (QCT) analysis, especially the 15th percentile of lung attenuation (P15), and parameters of clinical tests in a large group of patients with pulmonary emphysema.
Patients and Methods: One hundred and seventy-two patients with pulmonary emphysema and chronic obstructive pulmonary disease (COPD) global initiative for chronic obstructive lung disease (GOLD) stage 3 or 4 were assessed by nonenhanced thin-section CT scans in full inspiratory and expiratory breath-hold, pulmonary function test (PFT), a 6-minute walk test (6MWT), and quality of life questionnaires (SGRQ and CAT). QCT parameters included total lung volume (TLV), total emphysema score (TES), and P15, all measured at inspiration (IN) and expiration (EX). Differences between inspiration and expiration were calculated for TLV (TLVDiff), TES (TESDiff), and P15 (P15Diff). Spearman correlation analysis was performed.
Results: CT-measured lung volume in inspiration (TLVIN) correlated strongly with spirometry-measured total lung capacity (TLC) (r=0.81, p< 0.001) and moderately to strongly with residual volume (RV), forced vital capacity (FVC), and forced expiratory volume in 1 second (FEV1)/FVC (r=0.60, 0.56, and − 0.49, each p< 0.001). Lung volume in expiration (TLVEX) correlated moderately to strongly with TLC, RV and FEV1/FVC ratio (r=0.75, 0.66, and − 0.43, each p< 0.001). TES and P15 showed stronger correlations with the carbon monoxide transfer coefficient (KCO%) (r= − 0.42, 0.44, both p< 0.001), when measured during expiration. P15Diff correlated moderately with KCO% and carbon monoxide diffusing capacity (DLCO%) (r= 0.41, 0.40, both p< 0.001). The 6MWT and most QCT parameters showed significant differences between COPD GOLD 3 and 4 groups.
Conclusion: Our results suggest that QCT can help predict the severity of lung function decrease in patients with pulmonary emphysema and COPD GOLD 3 or 4. Some QCT parameters, including P15EX and P15Diff, correlated moderately to strongly with parameters of pulmonary function tests.
Keywords: chronic obstructive pulmonary disease, pulmonary emphysema, quantitative CT, pulmonary function test
Introduction
Chronic obstructive pulmonary disease (COPD) is the third leading cause of mortality in industrialized countries.1 Pulmonary emphysema is characterized by irreversible hyperinflation of lung parenchyma and is a key contributor to impaired lung function in COPD. Patients with pulmonary emphysema have a higher lung volume than healthy people, whereas the difference in volume between inspiration and expiration is smaller than in healthy nonsmokers.2,3 The pulmonary function test (PFT) is the gold standard for diagnosing COPD, typically showing a reduced forced expiratory volume in 1 second (FEV1), an increased total lung capacity (TLC), and a decreased FEV1/forced vital capacity (FVC) ratio.1 However, the PFT results depend on how well a patient can cooperate, and the number of unacceptable and nonrepeatable maneuvers is relatively higher among older subjects and patients in poor health.4 The latest COPD guidelines emphasize the feasibility and necessity of various methods for evaluating COPD.1 While PFT continues to be the mainstay of diagnosis, quantitative computed tomography (QCT) analysis has gained importance in the evaluation of COPD and is increasingly used to identify and classify emphysema.5–8 Emphysematous lung destruction results in the replacement of normal lung tissue, which has a typical attenuation of approximately −850 Hounsfield units (HU) on inspiratory CT scans in healthy humans. Hyperinflation reduces lung attenuation towards −1000 HU. The normal increase in lung density from inspiration to expiration is reduced in COPD due to air trapping/hyperinflation.5 CT attenuation values can quantify the extent of emphysema. Low attenuation volumes (LAVs) are considered to represent emphysematous lung parenchyma and reportedly correlate with the degree of lung function impairment.6
The diagnostic value of QCT for the objective evaluation of pulmonary emphysema has been described for total lung volume (TLV), the extent of emphysema (threshold-based identification of LAV), total emphysema score (TES, i.e. the emphysema index), and mean lung density (MLD).6–10 MLD is the most basic parameter for estimating emphysema extent. Previous studies have shown that the MLD derived from expiratory CT scans is a good predictor of pulmonary ventilation.7 Alternatively, indices of lung attenuation at a given percentile along the HU histogram, such as the first percentile (P1) or 15th percentile (P15), can be used for the evaluation of emphysema.8 As the emphysema extent increases, the density histogram shifts towards lower HU values, and the P index decreases. There is some evidence that the percentile approach is more robust for longitudinal monitoring of emphysema and less susceptible to changes in lung volume or concomitant high-attenuation disease (e.g. fibrosis) than MLD.11 Several percentile indices derived from inspiratory scans were reported to significantly correlate with microscopic and macroscopic emphysema extent.6 Most long-term studies have used P15, as it is less severely degraded by image noise and truncation effects than P1.7,8,12 We expect the percentage difference of P15 values measured at inspiration and expiration (P15Diff) to be a useful parameter for evaluating pulmonary emphysema severity. P15Diff might be affected less by patient size than absolute values acquired in only one respiratory phase and it should be able to reflect dynamic changes between full inspiration and expiration. However, P15Diff has not yet been investigated in COPD patients.
We conducted a systematic retrospective analysis to correlate QCT parameters measured at inspiration and expiration and the differences between inspiration and expiration with clinical test results in a large number of patients with severe COPD. CT-based inspiratory and expiratory TLV, TES, and P15 and the calculated parameters of the corresponding inspiratory/expiratory differences were compared with PFT results and scores of the 6-minute walk test (6MWT), St. George’s Respiratory Questionnaire (SGRQ), and COPD assessment test (CAT).
Patients and Methods
This study was approved by the local ethics committee/institutional review board (IRB; Charité Ethikkommission; Entscheid EA1/213/16). Patient consent to anonymous and retrospective review of their medical records was not required by IRB for this retrospective study. The confidential and anonymous evaluation of the patient data was guaranteed. The study was conducted in accordance with the Declaration of Helsinki.
Patients
In this retrospective study, we analyzed 172 pulmonary emphysema patients that were clinically diagnosed with severe COPD, Global Initiative for Chronic Obstructive Lung Disease (GOLD) stage 3 or 4. All patients were evaluated for surgical or bronchoscopic lung volume reduction and underwent noncontrast multislice CT (MSCT) scanning and a PFT within a span of 30 days in our department from May 2014 to May 2019 (Table 1). The inclusion criteria for patients with severe COPD were FEV1/FVC ratio <70% and FEV1 < 50% of the predicted value after bronchodilator inhalation. COPD was graded according to the 2019 GOLD guidelines: GOLD 3 (severe): 30% ≤ FEV1 < 50% of the predicted value, GOLD 4 (very severe): FEV1 < 30% of the predicted value, both based on postbronchodilator use.1 The exclusion criteria (based on a retrospective, blinded review of chest CT datasets) were active lung diseases such as acute exacerbation of COPD, pneumothorax, pleural effusion, extensive ground-glass opacities, suspicious nodules, lung tumors, relevant atelectasis, consolidation, major scars, thoracic deformity, postoperative lung, and poor respiratory coordination. All subjects had a long-term history of cigarette smoking with a smoking index of more than 20 pack-years. The results of the 6MWT, SGRQ, and CAT were retrieved from medical records.
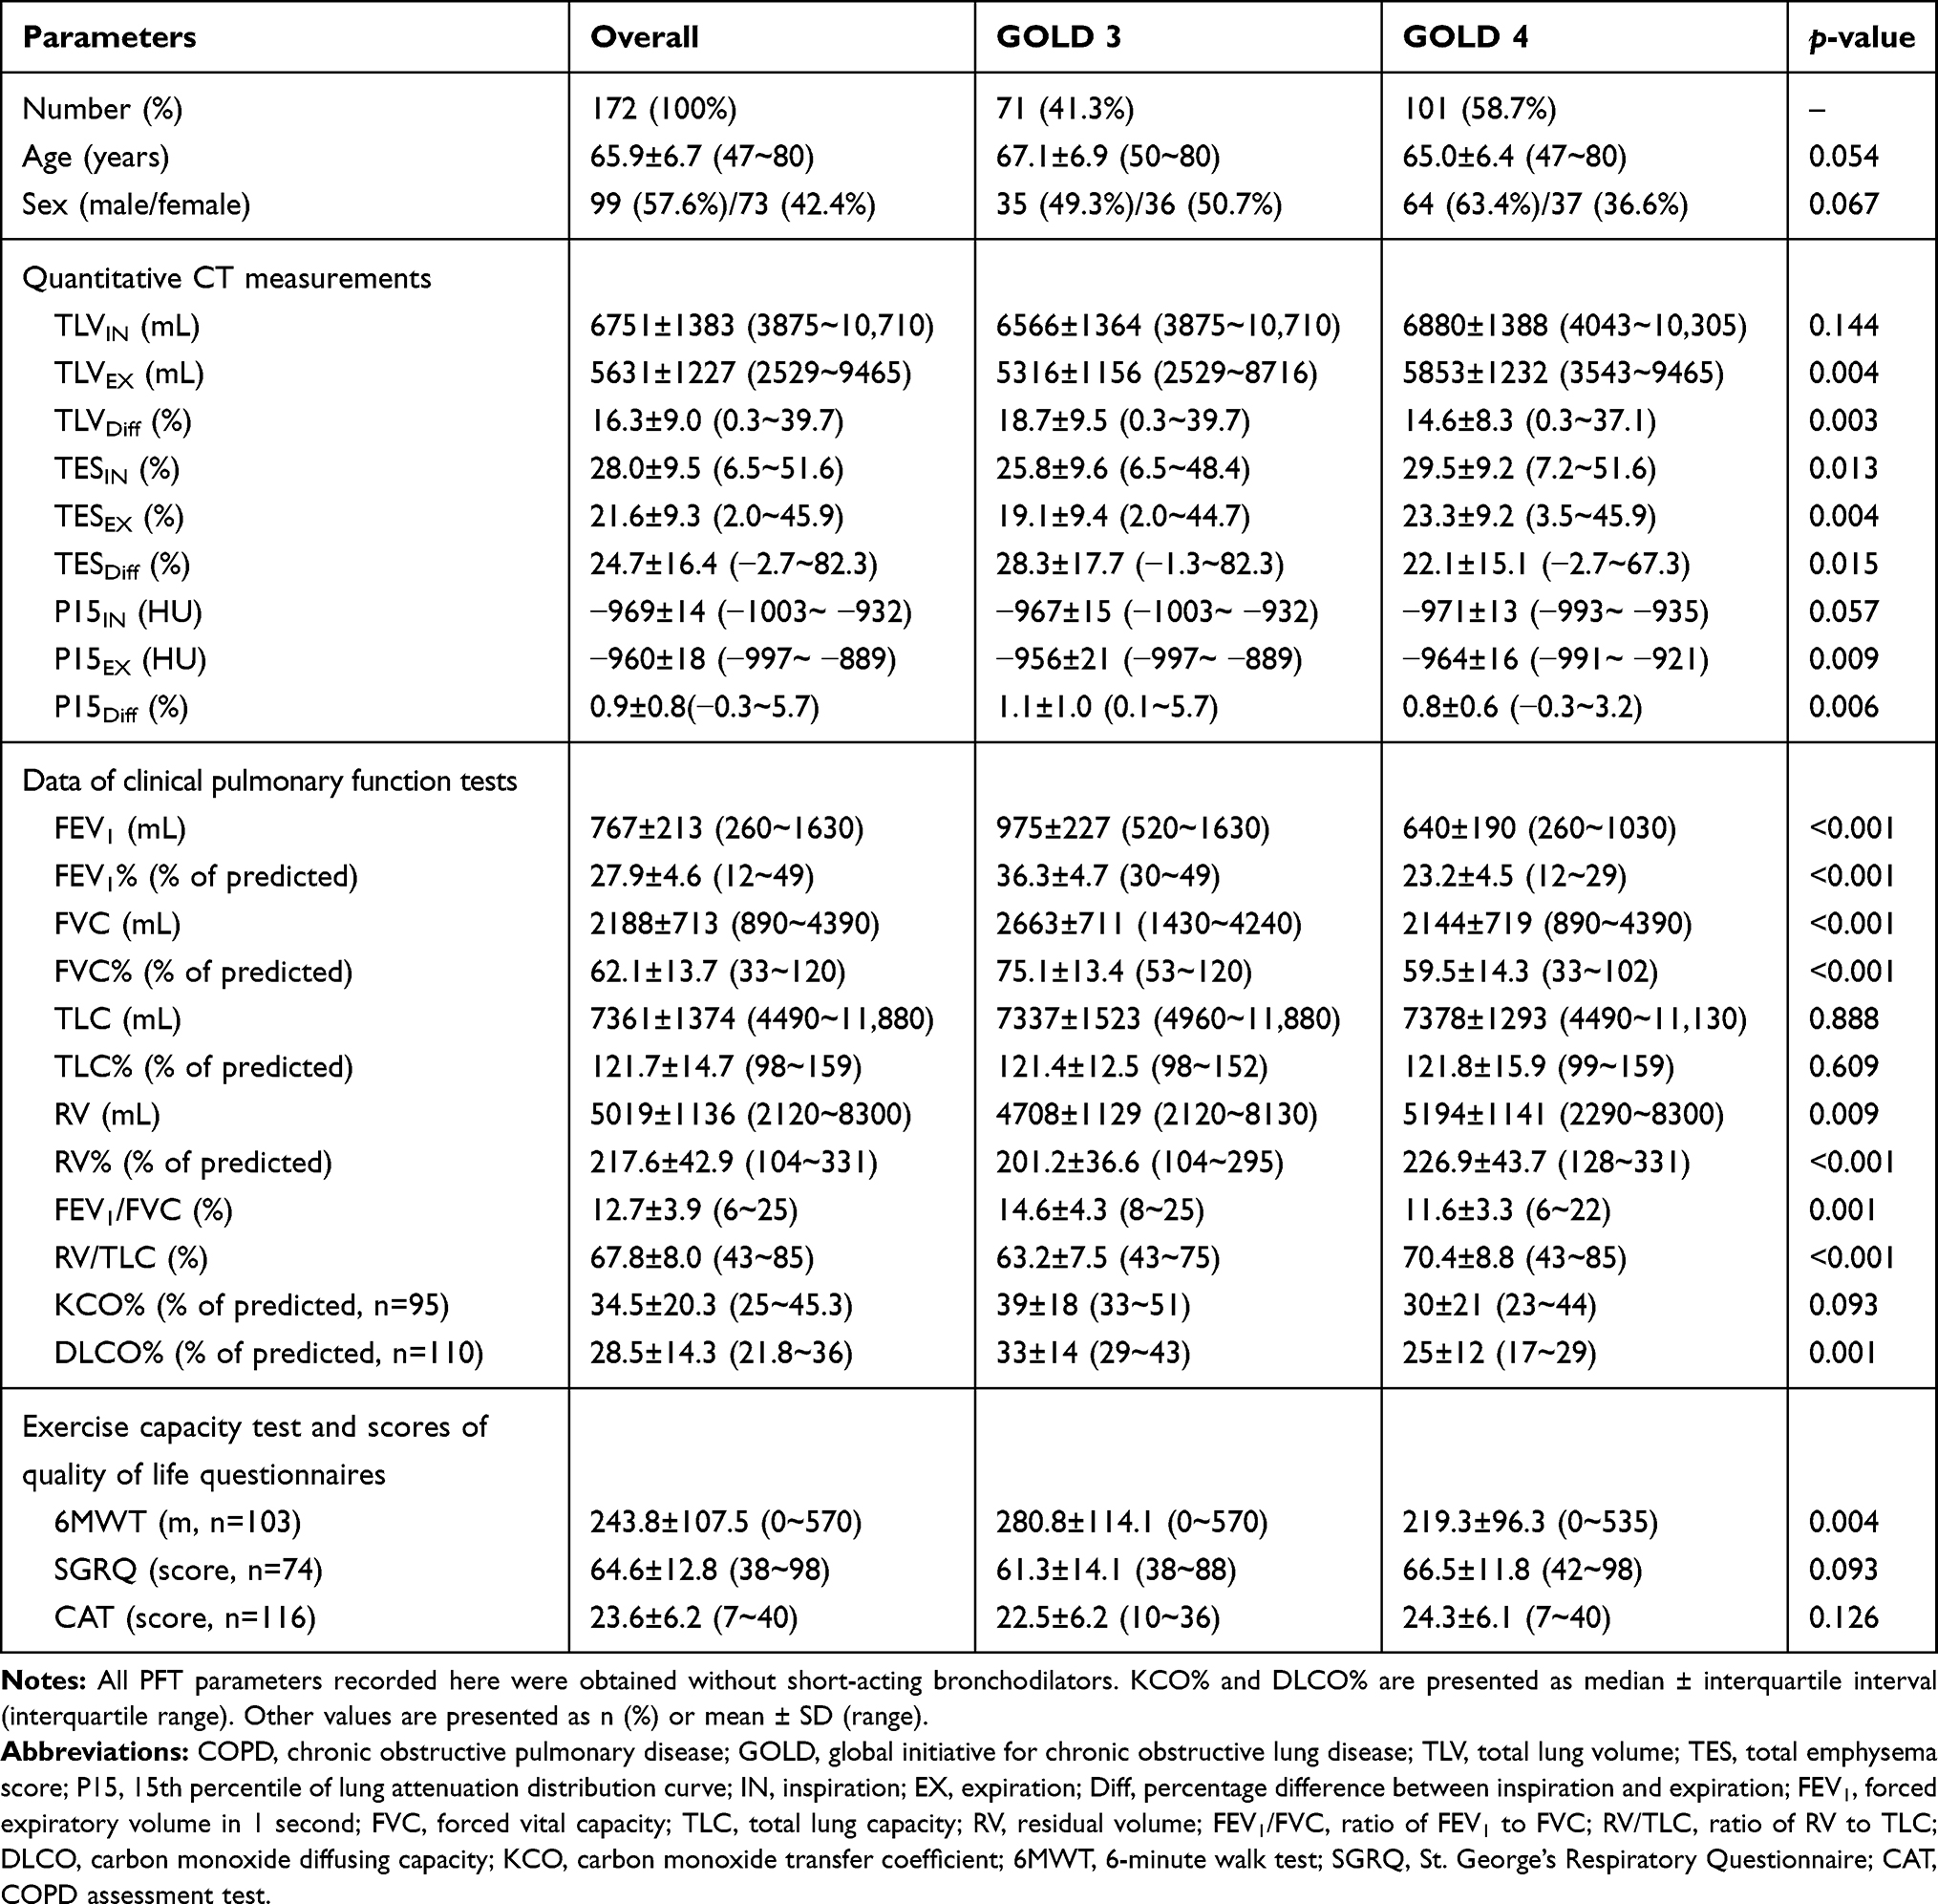 |
Table 1 Demographics and Quantitative CT Parameters, Pulmonary Function Test Data, and 6-Minute Walk Test and Clinical Scores in 172 Patients with COPD GOLD 3 or 4 |
Quantitative Computed Tomography
Patients were randomly assigned to undergo inspiratory and expiratory nonenhanced CT for emphysema evaluation on one of two CT scanners (Light Speed Ultra 8 or Revolution EVO, both General Electric Healthcare, Chicago, IL, USA) with the same protocol (supine position, two scans of the whole lung in full inspiratory and expiratory breath-hold) including standardized scanning parameters (0.625 or 1.25 mm primary slice thickness, slice interval the same as slice thickness, 120 kV voltage, 100 mA tube current, standard (soft) kernel). All patients were thoroughly coached in breathing techniques prior to the CT scan. Quantitative analysis of chest CT scans was performed using the MeVis PULMO3D software (v3.7.1, Fraunhofer MEVIS, Bremen, Germany) to obtain TLV, TES, and P15 (i.e. the 15th percentile of the lung attenuation distribution curve) using the density mask technique.13 TES was defined as the percentage of voxels with density values below the threshold of −950 HU out of the total number of voxels in the whole lung as described in many previous studies.14–16 The full datasets of axial slices without interscan gaps were used for analysis.
Differences in the QCT parameters between inspiration and expiration were calculated as follows:


Examples of QCT analysis of the total lung during full inspiratory and full expiratory breath-hold are presented in Figures 1 and 2.
 |
Figure 1 Coronal 3D surface views of the lungs of a 79-year-old female smoker with COPD GOLD 3 (A, B). These surface views were generated with the MeVis PULMO3D software by processing CT scans acquired at full inspiration (A) and full expiration (B). Lung lobes are depicted semitransparent green (lower lobes), red (upper lobes) and blue (right middle lobe). Emphysematous lung parenchyma, demonstrated as a LAV (i.e., voxels with a density ≤ −950 HU), is depicted in orange and yellow. In this patient, LAV in the right upper lobe significantly decreased in expiration, while LAV in the left upper lobe did not show a significant change between the two respiratory phases. Abbreviations: 3D, three dimensional; COPD, chronic obstructive pulmonary disease; GOLD, global initiative for chronic obstructive lung disease; LAV, low attenuation volumes. |
 |
Figure 2 3D surface views of the lung of a 59-year-old male smoker with COPD GOLD 3 (A, B). Coronal (A) and sagittal (B) reconstructions of a CT scan acquired at full inspiration demonstrates a predominant emphysema distribution in the upper lobe. Abbreviations: 3D, three dimensional; COPD, chronic obstructive pulmonary disease; GOLD, global initiative for chronic obstructive lung disease. |
Pulmonary Function Test
Dynamic spirometry (including FEV1 and FVC) and static lung volumes (including TLC and residual volume (RV)) were measured according to American Thoracic Society/European Respiratory Society standards.17,18 All spirometric maneuvers were performed before and 15 min after inhalation of 400 mg of salbutamol. A Ganshorn PowerCube (Ganshorn Medizin Electronic GmbH, Niederlauer, Germany) was used for all measurements. Diffusing capacities, including carbon monoxide diffusing capacity (DLCO) and carbon monoxide transfer coefficient (KCO), were measured according to single-breath carbon monoxide uptake. All lung function parameters except FEV1/FVC ratio and RV/TLC ratio are expressed as absolute values and as the percentage of the predicted value. FEV1/FVC was calculated as the percentage of FEV1 to FVC, and RV/TLC was calculated as the percentage of RV to TLC. Diffusing capacity parameters DLCO% and KCO% were calculated as the percentage of the predicted value. The PFT results are summarized in Table 1.
Statistics
Continuous variables with nonnormal distribution, such as KCO% and DLCO%, are expressed as median ± interquartile interval (interquartile range). Continuous variables with normal distribution are presented as mean ± SD (range). Categorical variables are expressed as frequencies (percentages). For the comparison of QCT parameters and clinical parameters, Spearman’s rank correlation analysis was used. Differences between COPD GOLD 3 and GOLD 4 were assessed using the independent samples t-test or Mann–Whitney U-test for continuous variables as appropriate, and the chi-square test was used for categorical variables (sex). A two-tailed p-value <0.05 was considered statistically significant. The SPSS Statistics 26 software package (IBM Corporation, Armonk, NY, USA) was used for all statistical analyses. In this observational study, no adjustment for multiple testing was performed. Hence, all p-values are exploratory.
Results
Whole-Lung Analysis and Comparison Based on GOLD Stages
The demographics, QCT data, PFT data, and scores of the 6MWT, SGRQ and CAT of 172 severe COPD patients are shown in Table 1. No significant differences were found for age, sex, TLVIN, P15IN, TLC, TLC%, KCO%, SGRQ and CAT scores between GOLD 3 and GOLD 4. All other QCT and PFT parameters and 6MWT showed significant differences between both GOLD stages.
Correlation Analysis of Different Measurement Methods
The correlation analyses for all tested QCT and PFT parameters are shown in Table 2 and Figure 3. TLVIN showed moderate to very strong correlations with TLC, RV, FVC and FEV1/FVC (r=0.81, 0.60, 0.56, and −0.49; each p<0.001). TLVEX showed a moderate to strong correlation with TLC, RV and FEV1/FVC (r=0.75, 0.66, and −0.43; each p<0.001). TLVDiff showed a moderate, negative correlation with RV/TLC (r=−0.43; p<0.001). TESEX showed a moderate, negative correlation with KCO% (r=−0.42; p<0.001). It is worth noting that both P15EX and P15Diff showed moderate correlations with KCO% (r=0.44 and 0.41; both p<0.001), and P15Diff showed a moderate correlation with DLCO% (r=0.40; p<0.001). There were only weak but measurable correlations in some other pairings. The strongest correlation was found for CT-measured TLVIN and PFT-measured TLC, but paired t-test showed that the mean TLC (7361 mL prebronchodilator) was significantly higher than that of TLVIN (6751 mL), with a mean difference of 610 mL in all 172 patients (p<0.001).
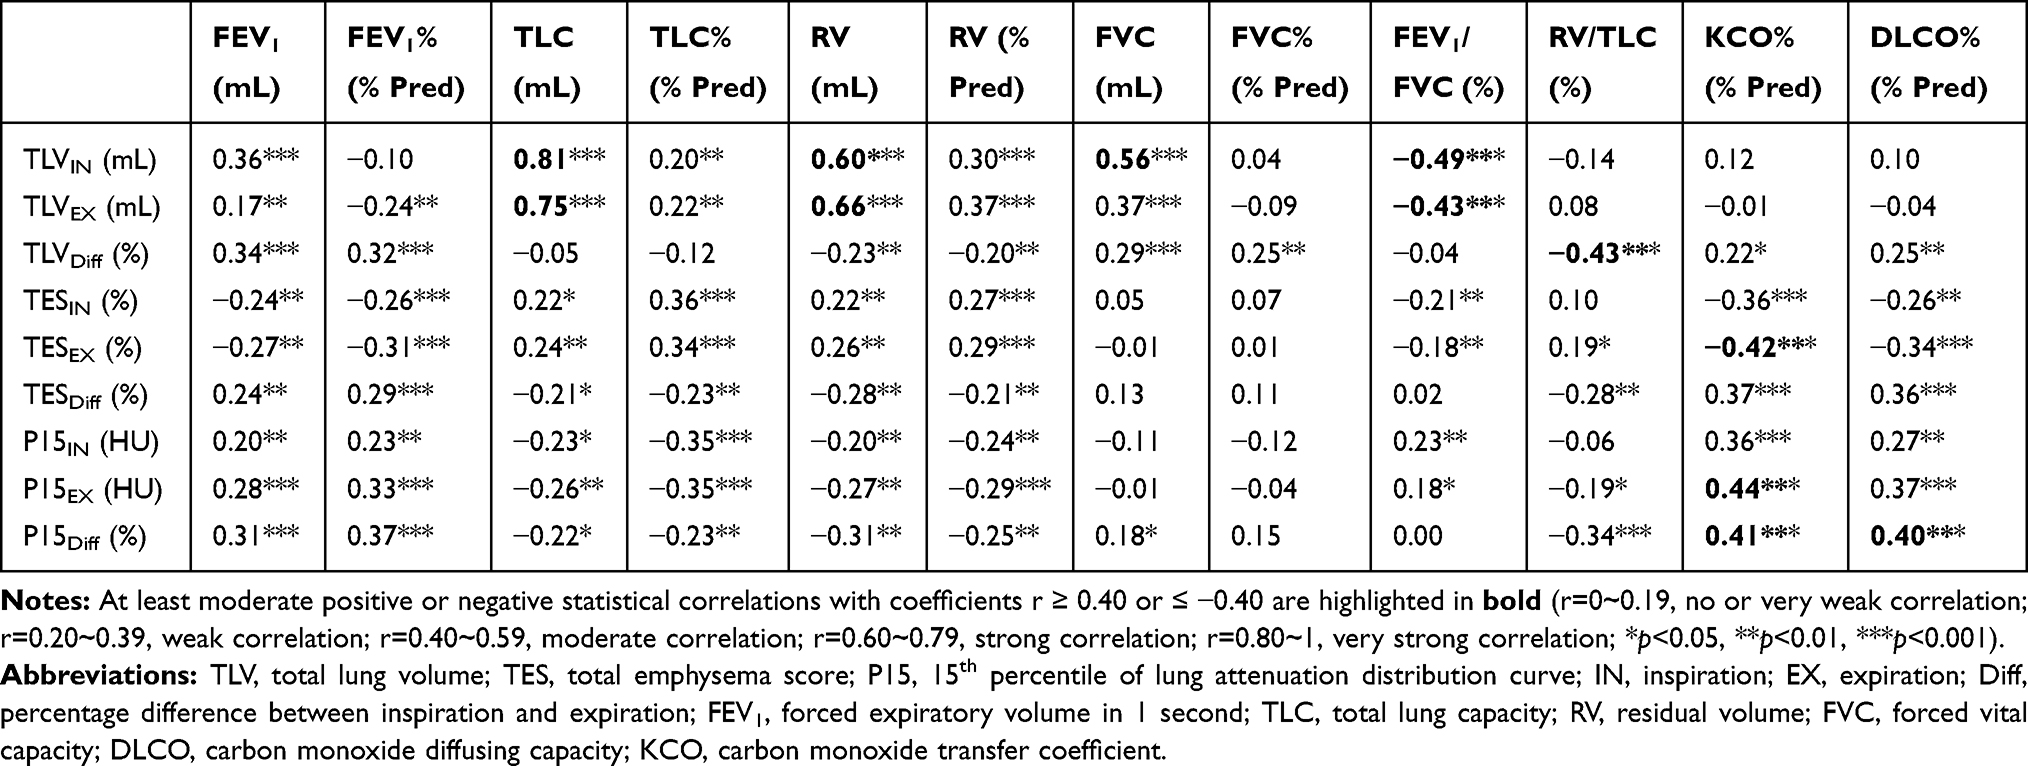 |
Table 2 Spearman’s Rank Correlation Coefficients Describing the Statistical Correlations Between QCT Parameters and the Results of Pulmonary Function Tests in the Evaluation of 172 Patients with COPD GOLD 3 or 4 |
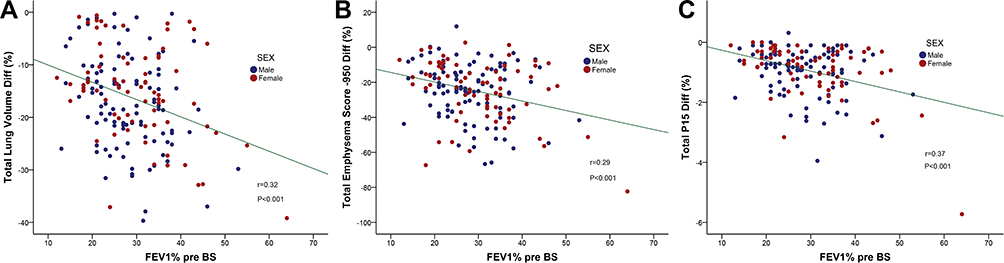 |
Figure 3 Correlation between FEV1% pre-BS and parameters of quantitative CT analysis in 172 patients with COPD GOLD 3 or 4 (A–C). These three scattered plot diagrams show only weak statistical correlations between FEV1% pre-BS and TLVDiff (A, r=0.32, p<0.001), TESDiff (B, r=0.29, p<0.001) and P15Diff (C, r=0.37, p<0.001). Abbreviations: FEV1%, percentage predicted of forced expiratory volume in 1 second; pre-BS, before application of short-acting bronchodilators; TLVDiff, percentage difference of total lung volume between inspiration and expiration; TESDiff, percentage difference of total emphysema score between inspiration and expiration; P15Diff, percentage difference of the 15th percentile of lung attenuation distribution curve between inspiration and expiration. |
The correlations of the QCT parameters and the 6MWT, SGRQ, and CAT scores are shown in Table 3. The SGRQ and 6MWT scores only weakly correlated with TLVDiff, TESEX, TESDiff, P15EX and P15Diff (SGRQ: r=−0.27, 0.32, −0.30, −0.29, and −0.28; 6MWT: r=0.27, −0.21, 0.29, 0.23, and 0.32). The CAT score showed no significant correlations with any of the QCT parameters, although it was strongly correlated with the SGRQ score (r=0.65; p<0.001). The 6MWT showed a moderate, negative correlation with the SGRQ score (r= −0.47; p<0.001) and a weak, negative correlation with the CAT score (r= −0.23; p<0.05).
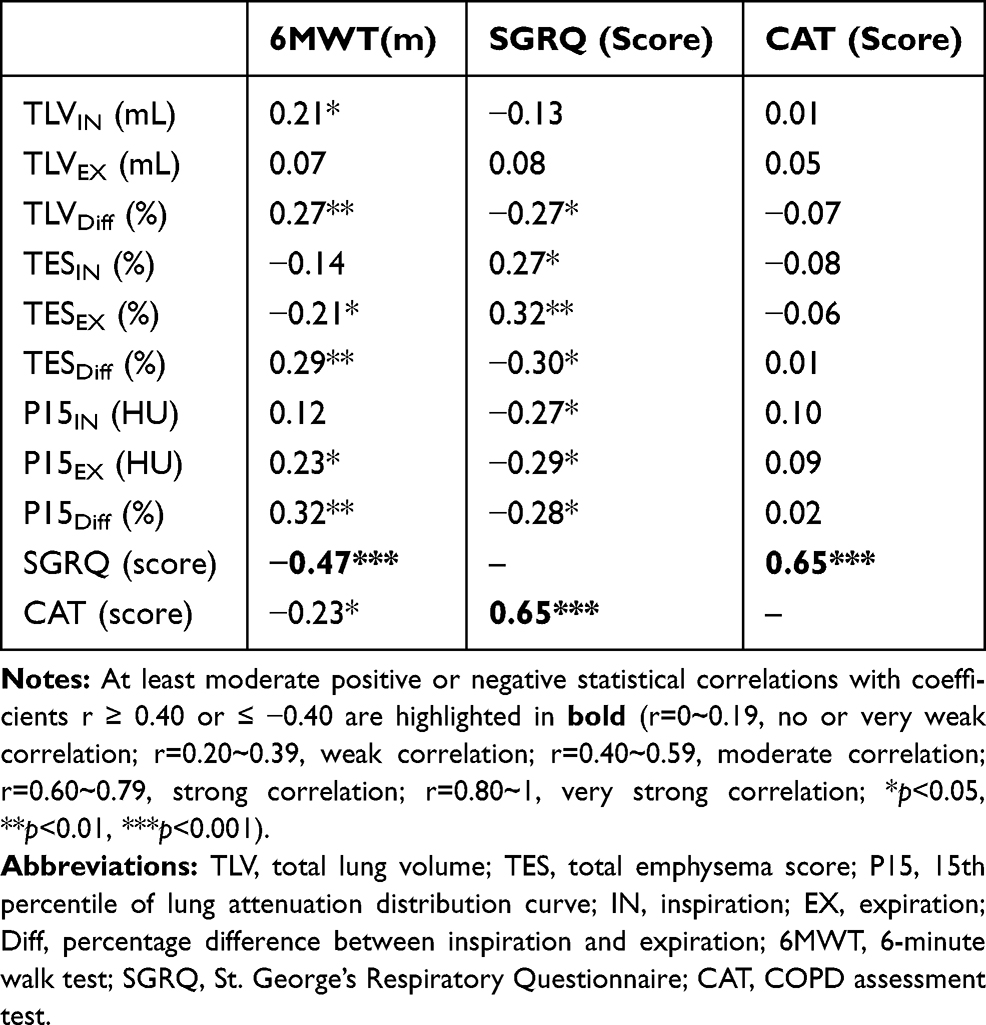 |
Table 3 Spearman’s Rank Correlation Coefficients Describing Statistical Correlations Between QCT Parameters and the Results of Clinical Tests in the Evaluation of 172 Patients with COPD GOLD 3 or 4 |
None of the calculated differences between the CT measurements in inspiration and expiration showed strong correlations with the clinical tests, including the questionnaires.
Discussion
In this study, we measured TLV, TES and P15 in inspiration and expiration and calculated TLVDiff, TESDiff, and P15Diff from paired inspiratory/expiratory chest CT scans for two reasons: PFTs also provide dynamic breathing information, and normal lung volumes vary with patient size.
Comparison of Our results and Comparable Studies
A LAV threshold of −950 HU, as used in our study, is most commonly used for CT-based emphysema quantification, yielding a good balance between sensitivity and specificity.8,14,16 As expected, our patients with severe COPD (FEV1% <50%) had a much higher mean TESIN of 28.0% (SD 9.5) than the reported range for healthy individuals aged 30–70 years (2.6–4.5%).19 The mean P15IN in GOLD 3 and GOLD 4 was −967HU and −971HU, respectively, in our study, compared with a mean of −919 HU in young men with normal lung function.20 In 36 severe COPD patients, the means of TLVDiff, P15IN and P15EX were similar to ours: 0.19±0.10 vs. 0.16±0.09, −961±12 HU vs. −969±14 HU, and −951±21 HU vs. −960±18 HU.21 Heussel et al found median TLVIN, TESIN and P15IN of 7200mL, 45%, and −985 HU, respectively, in 102 COPD patients GOLD stages 3 and 4, versus the corresponding mean values of 6751 mL, 28% and −969 HU in 172 COPD patients GOLD stages 3 and 4 in our study.8 This discrepancy may be due to differences in data presentation and different emphysema extents in our study population from those in the study from Heussel et al. In another study, TLVIN was on average 670 mL smaller than PFT-derived TLC, consistent with our result of 610 mL.22 There are two potential reasons for this discrepancy. First, QCT-measured TLVIN does not include upper and lower airway gas volumes. Second, the clinical PFT is examined in the sitting position, while the CT scans needed for QCT evaluation are acquired in the supine position. The inspiratory capacity may be affected by the different positions. However, a very strong correlation between TLVIN and TLC (r=0.81; p<0.001) was shown in our study, comparable to the previous result (r=0.90).3
Many publications on the correlation between other QCT and PFT parameters are inconsistent. Our study found the strongest correlations for TLC and TLVIN (r=0.81; p<0.001), RV and TLVEX (r=0.66; p<0.001), and RV/TLC and TLVDiff (r=−0.43; p<0.001). TLVIN had moderate to strong correlations with RV, FVC and FEV1/FVC, and TLVEX had a strong correlation with TLC. Functionally, hyperinflation of the entire lung is characterized by high RV and low FVC. Therefore, we used CT scans in full inspiration and full expiration to measure vital capacity (i.e. TLVIN-TLVEX) and total lung capacity (i.e. TLVIN). The lung with the largest amount of air trapping was considered to be the lung with the lowest VC/TLC ratio (i.e. TLVDiff). Therefore, TLVDiff indicated lung collapse.
Frequently, a negative correlation of TES with FEV1 or FEV1/FVC is expected.7,9 Our study also shows weak, negative correlations between FEV1, FEV1%, FEV1/FVC, and TES in both inspiration and expiration. Schroeder et al reported that TESIN (r=−0.67, −0.76), P15IN (r=0.55, 0.69) and P15EX (r=0.71, 0.80) had moderate to strong correlations with FEV1 and FEV1/FVC in COPD patients.10 Consistent with this result, P15IN and P15EX also had significant positive correlations with FEV1 and FEV1/FVC in our study. Overall, most of the correlation coefficients between TLV, TES and P15 and the results of PFT and 6MWT in our study were similar to those of the previous study, while some correlations were weaker in our study.7,8 However, we found better correlations with KCO% and DLCO%. The correlation of FEV1% with TLV, TES and P15 was not strong in our study. This might be explained by the fact that TLV, TES, and P15 are morphological measures mainly influenced by parenchymal destruction, while FEV1 is a bronchial functional parameter. Emphysema extent is only partially predicted by the severity of changes revealed by PFTs.23 In our study, TES correlated best with KCO% and TLC% in both inspiration (r=−0.36, 0.36) and expiration (r=−0.42, 0.34). Furthermore, we found that FEV1/FVC correlated best with TLVIN and TLVEX (r=−0.49, −0.43; both p<0.001), KCO% correlated best with TESEX, P15EX and P15Diff (r=−0.42, 0.44, 0.41; each p<0.001), and DLCO% correlated best with P15Diff (r=0.40; p<0.001). TLVDiff, TESDiff and P15Diff correlated better with RV/TLC than TLVIN or TLVEX, TESIN or TESEX, P15IN or P15EX do, suggesting that the calculated differences might be better indicators of air trapping than the corresponding absolute values measured in inspiration and expiration. In 30 COPD patients, Cavigli et al found stronger correlations of DLCO% with TESIN and P15IN (r=−0.63, 0.50, respectively) than we did (r=−0.26, 0.27, p<0.01).24 Gelb et al found strong negative correlations between DLCO%, KCO% and TES only in patients with an absolute FEV1 ≥ 1000 mL.25 Our study population had a mean FEV1 of 770 mL, which may explain why we found weaker correlations than Cavigli et al.24 Akira et al reported that P15IN and P15EX to correlate well with FEV1/FVC, RV/TLC and DLCO%, but not with FEV1%, and most of the corresponding correlations were stronger in patients with FEV1% ≥ 50%.26 They also found that TESEX correlated better with FEV1% and RV/TLC than with TESIN, when FEV1% was less than 50%, consistent with our result.26 Our study shows that P15IN and P15EX correlated best with KCO%, relatively well with DLCO% and TLC%, and weakly with FEV1/FVC and FEV1%. P15EX and P15Diff only had a weak negative correlation with RV/TLC. TESEX, P15EX and P15Diff had a relatively good correlation with KCO% and DLCO% in our study. From our point of view, these results suggest that P15EX, P15Diff and TESEX are related to lung diffusion capacity.
Staging COPD Patients According to QCT Parameters
Except for TLVIN and P15IN, our study shows significant differences in lung volume (TLVEX, TLVDiff), emphysema index (TESIN, TESEX and TESDiff), and 15th percentile of lung density (P15EX, P15Diff) between GOLD 3 and GOLD 4 patients. TLVEX, TESIN and TESEX were significantly larger in GOLD 4 than in GOLD 3, while TLVDiff, TESDiff, P15Diff, P15EX and 6MWT were significantly smaller in GOLD 4 than in GOLD 3. There were no significant differences in TLVIN, TLC or TLC% between both GOLD stages in our study. These results suggest that QCT, especially the parameters measured in expiration, can help to evaluate the severity of COPD in patients with GOLD 3 and 4. We also found better correlations with FEV1, FEV1%, TLC, RV, RV%, RV/TLC, KCO%, and DLCO% for TESEX and P15EX than for TESIN and P15IN. Zaporozhan et al reported no differences in TESIN, TESEX, TESDiff and TLVDiff between GOLD 3 and GOLD 4 among 31 patients, probably due to the small number of patients.3
Relationship Between QCT and Quality-of-Life Questionnaires
The GOLD guidelines group COPD patients by symptom and risk assessment.1 Quality of life assessments, such as the SGRQ and CAT, have been widely used to evaluate the condition of COPD patients and to predict their mortality risk.27,28 While the GOLD classification is an index reflecting the severity of COPD, CAT reflects the patients’ overall quality of life, allowing patients to monitor their disease status and treatment effects easily.28 Previous studies showed that the CAT score could reflect disease impact on exercise ability.29 Our results show that the CAT score was weakly and negatively correlated with the 6MWT (r= −0.23; p<0.05), while the SGRQ score had a moderate to strong correlation with the 6MWT and CAT score (r= −0.47, 0.65; both p<0.001). Except for TLVIN and TLVEX, the QCT parameters only correlated weakly with the SGRQ score. No QCT parameter correlated with the CAT score, suggesting that the SGRQ may be superior in evaluating emphysematous lung destruction. The 6MWT and most QCT and PFT results were significantly different between COPD GOLD stage 3 and 4, while there was no significant difference in the SGRQ and CAT scores between the two groups. This finding might be related to the different ages and educational levels of the patients with respect to the recognition of acute exacerbations of COPD. QCT may assess the severity of COPD more objectively.
Drawbacks of the Study
Differences in study populations and CT slice thickness, hardware, protocols, and postprocessing software may have contributed to differences between our results and previous studies. The correlation between QCT parameters and clinical tests was not as strong as expected, but some important factors hampered our results. First, we conducted a retrospective study, and most CT scans were not performed on the exact same day as the PFTs, although we excluded patients with long intervals (>30 days). Second, CT scans at breath-hold, PFTs, the 6MWT, and quality of life questionnaires all depend on patient cooperation. Despite breathing training before the CT scans and PFTs, reaching the desired expiratory volumes is impaired in advanced emphysema (GOLD 3 and 4) with hyperinflated lungs, which was a confounder of lung density and volume in expiratory scans in these patients. Third, we did not use the mass-conserving volume change method for estimating voxel volume changes from the HU values within an inhale/exhale CT image pair as proposed by Castillo et al.30 We plan to apply this method in further studies. Finally, this study focused on the CT assessment of lung parenchyma and did not consider airway abnormalities, which also affect lung ventilation function significantly. Therefore, the relationship between airway abnormalities and PFT results needs to be addressed in future studies.
Conclusion
The present study provides reference values for several QCT parameters in both inspiration and expiration compared with clinical tests in a large group of severe COPD patients. As expected, lung volumetry from CT scans works well and strongly correlates with spirometry. In particular, P15, including P15EX and P15Diff, correlates with the severity of emphysema and parameters of lung diffusion capacity. QCT can help to evaluate the severity of COPD in GOLD 3 and 4 patients. Many studies, including ours, indicate that expiratory CT is superior for assessing COPD severity and better reflects airflow limitation and air trapping.
Abbreviations
6MWT, 6-minute walk test; CAT, COPD assessment test; COPD, chronic obstructive pulmonary disease; DLCO, carbon monoxide diffusing capacity; FEV1, forced expiratory volume in 1 second; FVC, forced vital capacity; GOLD, global initiative for chronic obstructive lung disease; KCO, carbon monoxide transfer coefficient; P15, 15th percentile of lung attenuation distribution curve; PFT, pulmonary function test; pre BS, before application of short-acting bronchodilators; QCT, quantitative computed tomography; RV, residual volume; SGRQ, St. George’s Respiratory Questionnaire; TES, total emphysema score; TLC, total lung capacity; TLV, total lung volume.
Acknowledgments
This work was supported by the non-profit Central Research Institute Fund of the Chinese Academy of Medical Sciences (2019PT320008, 2018PT32003). The authors thank Mrs. Bettina Herwig for English language editing.
Disclosure
Author Bianca C Lassen-Schmidt is an employee of Fraunhofer MEVIS, the developer of the MeVis PULMO3D software. Ralf H Hubner reports personal fees from Pulmonx during the conduct of the study. All other authors report no conflicts of interest in this work.
References
1. Singh D, Agusti A, Anzueto A, et al. Global strategy for the diagnosis, management, and prevention of chronic obstructive lung disease: the GOLD science committee report 2019. Eur Respir J. 2019;53(5). doi:10.1183/13993003.00164-2019
2. Cho HB, Chae KJ, Jin GY, et al. Structural and functional features on quantitative chest computed tomography in the Korean Asian versus the White American healthy non-smokers. Korean J Radiol. 2019;20(7):1236–1245. doi:10.3348/kjr.2019.0083
3. Zaporozhan J, Ley S, Eberhardt R, et al. Paired inspiratory/expiratory volumetric thin-slice CT scan for emphysema analysis: comparison of different quantitative evaluations and pulmonary function test. Chest. 2005;128(5):3212–3220. doi:10.1378/chest.128.5.3212
4. Belzer RB, Lewis RJ. The practical significance of measurement error in pulmonary function testing conducted in research settings. Risk Anal. 2019;39(10):2316–2328. doi:10.1111/risa.13315
5. Nishio M, Matsumoto S, Tsubakimoto M, et al. Paired inspiratory/expiratory volumetric CT and deformable image registration for quantitative and qualitative evaluation of airflow limitation in smokers with or without COPD. Acad Radiol. 2015;22(3):330–336. doi:10.1016/j.acra.2014.09.011
6. Madani A, De Maertelaer V, Zanen J, Gevenois PA. Pulmonary emphysema: radiation dose and section thickness at multidetector CT quantification - Comparison with macroscopic and microscopic morphometry. Radiology. 2007;243(1):250–257. doi:10.1148/radiol.2431060194
7. Lee YK, Oh Y-M, Lee J-H, et al. Quantitative assessment of emphysema, air trapping, and airway thickening on computed tomography. Lung. 2008;186(3):157–165. doi:10.1007/s00408-008-9071-0
8. Heussel CP, Herth FJ, Kappes J, et al. Fully automatic quantitative assessment of emphysema in computed tomography: comparison with pulmonary function testing and normal values. Eur Radiol. 2009;19(10):2391–2402. doi:10.1007/s00330-009-1437-z
9. Koyama H, Ohno Y, Nishio M, et al. Three-dimensional airway lumen volumetry: comparison with bronchial wall area and parenchymal densitometry in assessment of airway obstruction in pulmonary emphysema. Br J Radiol. 2012;85(1020):1525–1532. doi:10.1259/bjr/22602417
10. Schroeder JD, McKenzie AS, Zach JA, et al. Relationships between airflow obstruction and quantitative CT measurements of emphysema, air trapping, and airways in subjects with and without chronic obstructive pulmonary disease. AJR Am J Roentgenol. 2013;201(3):W460–W470. doi:10.2214/AJR.12.10102
11. Dirksen A. Monitoring the progress of emphysema by repeat computed tomography scans with focus on noise reduction. Proc Am Thorac Soc. 2008;5(9):925–928. doi:10.1513/pats.200804-033QC
12. Ashraf H, Lo P, Shaker SB, et al. Short-term effect of changes in smoking behaviour on emphysema quantification by CT. Thorax. 2011;66(1):55–60. doi:10.1136/thx.2009.132688
13. Kuhnigk J-M, Dicken V, Zidowitz S, et al. Informatics in radiology (infoRAD): new tools for computer assistance in thoracic CT. Part 1. Functional analysis of lungs, lung lobes, and bronchopulmonary segments. Radiographics. 2005;25(2):525–536. doi:10.1148/rg.252045070
14. Lynch DA. Progress in imaging COPD, 2004–2014. Chronic Obstr Pulm Dis. 2014;1(1):73–82. doi:10.15326/jcopdf.1.1.2014.0125
15. Wang ZM, Gu SC, Leader JK, et al. Optimal threshold in CT quantification of emphysema. Eur Radiol. 2013;23(4):975–984. doi:10.1007/s00330-012-2683-z
16. Lynch DA, Austin JHM, Hogg JC, et al. CT-definable subtypes of chronic obstructive pulmonary disease: a statement of the fleischner society. Radiology. 2015;277(1):192–205. doi:10.1148/radiol.2015141579
17. Wanger J, Clausen JL, Coates A, et al. Standardisation of the measurement of lung volumes. Eur Respir J. 2005;26(3):511–522. doi:10.1183/09031936.05.00035005
18. Miller MR, Crapo R, Hankinson J, et al. General considerations for lung function testing. Eur Respir J. 2005;26(1):153–161. doi:10.1183/09031936.05.00034505
19. Hochhegger B, Alves GRT, Irion KL, Moreira JD, Marchiori ED. Emphysema index in a cohort of patients with no recognizable lung disease: influence of age. J Bras Pneumol. 2012;38(4):494–502. doi:10.1590/S1806-37132012000400012
20. Mets OM, van Hulst RA, Jacobs C, van Ginneken B, de Jong PA. Normal range of emphysema and air trapping on CT in young men. AJR Am J Roentgenol. 2012;199(2):336–340. doi:10.2214/AJR.11.7808
21. Hetzel J, Boeckeler M, Horger M, et al. A new functional method to choose the target lobe for lung volume reduction in emphysema - comparison with the conventional densitometric method. Int J Chron Obstruct Pulmon Dis. 2017;12:2621–2628. doi:10.2147/COPD.S139304
22. Kauczor HU, Heussel CP, Fischer B, Klamm R, Mildenberger P, Thelen M. Assessment of lung volumes using helical CT at inspiration and expiration: comparison with pulmonary function tests. Am J Roentgenol. 1998;171(4):1091–1095. doi:10.2214/ajr.171.4.9763003
23. Hersh CP, Jacobson FL, Gill R, Silverman EK. Computed tomography phenotypes in severe, early-onset chronic obstructive pulmonary disease. COPD. 2007;4(4):331–337. doi:10.1080/15412550701601274
24. Cavigli E, Camiciottoli G, Diciotti S, et al. Whole-lung densitometry versus visual assessment of emphysema. Eur Radiol. 2009;19(7):1686–1692. doi:10.1007/s00330-009-1320-y
25. Gelb AF, Schein M, Kuei J, et al. Limited contribution of emphysema in advanced chronic obstructive pulmonary disease. Am Rev Respir Dis. 1993;147(5):1157–1161. doi:10.1164/ajrccm/147.5.1157
26. Akira M, Toyokawa K, Inoue Y, Arai T. Quantitative CT in chronic obstructive pulmonary disease: inspiratory and expiratory assessment. AJR Am J Roentgenol. 2009;192(1):267–272. doi:10.2214/AJR.07.3953
27. Sciriha A, Lungaro-Mifsud S, Scerri J, Magro R, Camilleri L, Montefort S. Health status of COPD patients undergoing pulmonary rehabilitation: a comparative responsiveness of the CAT and SGRQ. Chron Respir Dis. 2017;14(4):352–359. doi:10.1177/1479972317694622
28. Jones PW, Harding G, Berry P, Wiklund I, Chen WH, Kline Leidy N. Development and first validation of the COPD assessment test. Eur Respir J. 2009;34(3):648–654. doi:10.1183/09031936.00102509
29. Finch S, Laska IF, Abo-Leyah H, Fardon TC, Chalmers JD. Validation of the COPD Assessment Test (CAT) as an outcome measure in bronchiectasis. Chest. 2019.
30. Castillo E, Vinogradskiy Y, Castillo R. Robust HU-based CT ventilation from an integrated mass conservation formulation. Med Phys. 2019;46(11):5036–5046. doi:10.1002/mp.13817
 © 2020 The Author(s). This work is published and licensed by Dove Medical Press Limited. The
full terms of this license are available at https://www.dovepress.com/terms
and incorporate the Creative Commons Attribution
- Non Commercial (unported, 3.0) License.
By accessing the work you hereby accept the Terms. Non-commercial uses of the work are permitted
without any further permission from Dove Medical Press Limited, provided the work is properly
attributed. For permission for commercial use of this work, please see paragraphs 4.2 and 5 of our Terms.
© 2020 The Author(s). This work is published and licensed by Dove Medical Press Limited. The
full terms of this license are available at https://www.dovepress.com/terms
and incorporate the Creative Commons Attribution
- Non Commercial (unported, 3.0) License.
By accessing the work you hereby accept the Terms. Non-commercial uses of the work are permitted
without any further permission from Dove Medical Press Limited, provided the work is properly
attributed. For permission for commercial use of this work, please see paragraphs 4.2 and 5 of our Terms.