Back to Journals » International Journal of General Medicine » Volume 17
Quantitative Analysis of Multimodal MRI Markers and Clinical Risk Factors for Cerebral Small Vessel Disease Based on Deep Learning
Authors Zhang Z, Ding Z, Chen F, Hua R ![]() , Wu J
, Wu J ![]() , Shen Z, Shi F
, Shen Z, Shi F ![]() , Xu X
, Xu X ![]()
Received 3 November 2023
Accepted for publication 12 February 2024
Published 4 March 2024 Volume 2024:17 Pages 739—750
DOI https://doi.org/10.2147/IJGM.S446531
Checked for plagiarism Yes
Review by Single anonymous peer review
Peer reviewer comments 2
Editor who approved publication: Dr Scott Fraser
Zhiliang Zhang,1,* Zhongxiang Ding,2,* Fenyang Chen,2 Rui Hua,3 Jiaojiao Wu,3 Zhefan Shen,2 Feng Shi,3 Xiufang Xu1
1School of Medical Imaging, Hangzhou Medical College, Hangzhou, People’s Republic of China; 2Department of Radiology, Affiliated Hangzhou First People’s Hospital, Westlake University School of Medicine, Hangzhou, People’s Republic of China; 3Department of Research and Development, Shanghai United Imaging Intelligence Co., Ltd, Shanghai, People’s Republic of China
*These authors contributed equally to this work
Correspondence: Feng Shi; Xiufang Xu, Email [email protected]; [email protected]
Background: Cerebral small vessel disease lacks specific clinical manifestations, and extraction of valuable features from multimodal images is expected to improve its diagnostic accuracy. In this study, we used deep learning techniques to segment cerebral small vessel disease imaging markers in multimodal magnetic resonance images and analyze them with clinical risk factors.
Methods and results: We recruited 211 lacunar stroke patients and 83 control patients. The patients’ cerebral small vessel disease markers were automatically segmented using a V-shaped bottleneck network, and the number and volume were calculated after manual correction. The segmentation results of the V-shaped bottleneck network for white matter hyperintensity and recent small subcortical infarction were in high agreement with the ground truth (DSC> 0.90). In small lesion segmentation, cerebral microbleed (average recall=0.778; average precision=0.758) and perivascular spaces (average recall=0.953; average precision=0.923) were superior to lacunar infarct (average recall=0.339; average precision=0.432) in recall and precision. Binary logistic regression analysis showed that age, systolic blood pressure, and total cerebral small vessel disease load score were independent risk factors for lacunar stroke (P< 0.05). Ordered logistic regression analysis showed age was positively correlated with cerebral small vessel disease load score and total cholesterol was negatively correlated with cerebral small vessel disease score (P< 0.05).
Conclusion: Lacunar stroke patients exhibited higher cerebral small vessel disease imaging markers, and age, systolic blood pressure, and total cerebral small vessel disease score were independent risk factors for lacunar stroke patients. V-shaped bottleneck network segmentation network based on multimodal deep learning can segment and quantify various cerebral small vessel disease lesions to some extent.
Keywords: lacunar stroke, cerebral small vessel disease, imaging markers, deep learning, quantification, image segmentation, clinical risk factors
Introduction
Cerebral small vessel disease (CSVD) is a neurological disorder that commonly affects the middle-aged and elderly population, which will cause abnormalities visible on brain imaging. Patients with CSVD are at a higher risk of experiencing stroke and, to some extent, cognitive impairment and dementia.1 Therefore, early diagnosis and treatment of CSVD are crucial.
Magnetic resonance imaging (MRI) scans are a primary diagnostic tool for detecting CSVD. Compared to computed tomography (CT) scans, MRI scans offer greater sensitivity, and many imaging features can only be detected through MRI.2 Notably, there are multiple radiological markers for CSVD, including white matter hyperintensities (WMH), recent small subcortical infarcts (RSSI), lacunar infarcts (LI), enlarged perivascular spaces (EPVS), and cerebral microbleeds (CMB).3 Different imaging markers rely on different MRI sequences for detection. How to achieve the detection and quantification of multiple imaging markers based on multi-sequence MRI is an urgent challenge.
However, few studies have explored the relationship between clinical risk factors and each CSVD imaging marker through quantitative segmentation, automated calculation of the total CSVD load score, and extraction of CSVD imaging markers. This situation is attributed to the significant challenges in accurately diagnosing CSVD: (1) a high rate of leakage, particularly for small lesions like PVS; (2) a substantial workload requiring comprehensive assessment using different MRI sequences; and (3) a lack of quantitative assessment criteria, with clinical diagnosis relying mainly on subjective assessments by physicians, resulting in low inter- and intra-observer consistency. Hence, there is an urgent need for a rapid, accurate, and reproducible diagnostic method that can quantify CSVD.
Deep learning technology has shown outstanding performance in intelligent assisted diagnosis of cerebrovascular diseases in recent years.4 It can identify lesion locations using detection networks, accurately segment regions of interest (ROIs) using segmentation networks, and perform volume quantification. Additionally, it can score and classify lesion severity using classification networks.5 This paper focuses on deep learning detection using a 2D convolutional neural network (CNN), called a V-shaped bottleneck network (VB-Net) to achieve precise segmentation of CSVD biomarkers in different MRI sequences, calculate corresponding load scores, and perform statistical analysis in combination with clinical risk factors that may contribute to CSVD, with the hope that this study will enhance the ability to diagnose CSVD in clinical settings.
Methods
Inclusion and Exclusion Criteria
The clinical data of hospitalized patients at Hangzhou First People’s Hospital from January 2014 to January 2021 were collected, including T1-weighted magnetic resonance imaging (T1WI), T2-weighted magnetic resonance imaging (T2WI), T2-fluid attenuation inversion recovery (T2-FLAIR), susceptibility-weighted imaging (SWI), and diffusion-weighted imaging (DWI). Patients diagnosed with lacunar infarct were selected as the case group; Patients in the non-lacunar cerebral infarction group (with no imaging abnormalities) served as the control group. After excluding patients with incomplete MRI data, 294 patients finally met the inclusion criteria, including 211 lacunar stroke patients and 83 control patients. The inclusion criteria for this study were as follows: (1) Age > 18 years; (2) Patients diagnosed with lacunar infarction through clinical and imaging examinations after the review; (3) Presence of symptomatic microvascular disease on cranial MRI, including WMH, RSSI, LI, PVS, and CMB; (4) Availability of complete clinical data. Exclusion criteria were as follows: (1) Patients who did not meet the criteria for MRI examination; (2) Patients with severe liver and kidney problems; (3) Pregnant patients; (4) Patients with non-vascular dementia, Parkinson’s disease, or other neurodegenerative diseases. All patients underwent appropriate clinical and biochemical examinations along with MRI scans.
Clinical Information Collection
Clinical data, including sex, age, body mass index (BMI), smoking and alcohol consumption, and biochemical parameters, were collected for each patient. Blood pressure was measured using a mercury sphygmomanometer, and hypertension was defined as systolic blood pressure (SBP) ≥ 140 mm Hg or diastolic blood pressure (DBP) ≥ 90 mm Hg, or a history of hypertension and use of antihypertensive drugs. Diabetes was defined as fasting blood glucose ≥ 7.0 mmol/L or a history of diabetes. Routine biochemical tests were conducted to measure urine acid (UA), total cholesterol (TC), triglycerides (TG), high-density lipoprotein cholesterol (HDL), low-density lipoprotein cholesterol (LDL), homocysteine (HCY), apolipoprotein A-1 (ApoA-1), and apolipoprotein B (Apo B) levels.
MRI Examination
The MRI examinations included T1WI, T2WI, T2-FLAIR, DWI, and SWI, each of which reflects specific tissue features. All patients in this study were examined using a GE MR Model 750 3.0 T or 1.5 T imaging system. The scan sequences included: T1-weighted images with echo time (TE) of 25–30 ms and repetition time (TR) of 1750–1800 ms; T2-weighted images with TE of 90–95 ms and TR of 5170–5175 ms; T2 FLAIR with TE of 145–150 ms and TR of 8400–8450 ms; layer thickness of 6–7 mm, layer spacing of 6–7 mm; matrix of 512 × 512, and field of view (FOV) of 240.00 mm. Two experienced imaging physicians reviewed the MRI findings, and any discrepancies in image interpretation were resolved through discussion to reach a consensus diagnosis.
Lesion Measurement Method
Segmentation Process
The segmentation procedure was executed on the uAI research portal (uRP), which has integrated a great deal of segmentation models for various ROIs.6 In this study, a two-dimensional (2D) V-shaped bottleneck network (VB-Net) was invoked for the segmentation of all CSVD imaging markers. It is worth noting that this VB-Net has been used for the segmentation of WMH with a dice similarity coefficient (DSC) of 0.878 in our published paper.7 In this study, we evaluated the segmentation performance of the VB-Net for several CSVD tasks (ie, WMH, RSSI, LI, PVS, and CMB) and compared it to the manual contouring results from two experienced radiologists. Finally, the two experienced radiologists manually checked and corrected the automated segmentation results for the presence of lesions in the brain and output quantitative metrics (eg, location, number, volume).
To be specific, the general 2D VB-Net included an efficient encoder-decoder framework for feature embedding, residual connections for information flow, as well as bottleneck layers for model compression. More details can be found in our previously published article.7 Notably, each CSVD marker segmentation used the corresponding optimal MRI sequence to achieve the most accurate quantification. As a result, the inputs to VB-Net varied with the CSVD markers, in which the segmentation of WMH, RSSI, LI, PVS, and CMB depended on T2-FLAIR, DWI, T1WI, T2WI, and SWI, respectively (Figure 1). It is worth noting that, WMH lesions could be further categorized as juxtaventricular white matter hyperintensities (JVWMH), periventricular white matter hyperintensities (PVWMH), deep white matter hyperintensities (DWMH), and juxtacortical white matter hyperintensities (JCWMH).8
 |
Figure 1 A general 2D VB-Net used for segmenting multiple cerebral small vessel disease (CSVD) markers. The VB-Net included an encoder-decoder framework for feature embedding, residual connections for information flow, and bottleneck layers for model compression. The VB-Net automatically segmented five CSVD markers on the corresponding MRI sequence. Specifically, T2-fluid attenuation inversion recovery (T2-FLAIR), diffusion-weighted imaging (DWI), T1-weighted magnetic resonance imaging (T1WI), T2-weighted magnetic resonance imaging (T2WI), and susceptibility-weighted imaging (SWI) were used to segment the white matter hyperintensity (WMH), recent small subcortical brain infarction (RSSI), lacunar infarction (LI), perivascular spaces (PVS), and cerebral microbleeds (CMB), respectively. |
The segmentation performance of VB-Net on five tasks (ie, WMH, RSSI, LI, PVS, and CMB) was evaluated by calculating three metrics including DSC, recall, and precision. The manual contouring results of the above CSVD markers by two experienced radiologists (ie, Fenyang Chen for Reader1 and Zhefan Shen for Reader2) were considered as ground truth.
where the TP represented true positive, FP represented false positive, and FN represented false negative, the higher the metrics, the better the segmentation results. For smaller lesions such as LI, PVS, and CMB, we focused on precision and recall to assess FN and FP. The automated segmentation results were then manually checked and corrected by two radiologists, and a series of quantitative measures were outputted, including the number of lesions and total volume.
Contouring Criteria
Two radiologists manually corrected the automated segmentation results following the contouring criteria (Figure 2).
 |
Figure 2 MRI findings related to small vessel disease illustrate examples (upper) and schematic representations (middle) of MRI features associated with such changes, accompanied by a summary of imaging characteristics (lower) specific to individual lesions. Increased signals are represented as ↑; Decreased signals are represented as ↓; Isointense signals are represented as ↔. MRI sequences included T2-fluid attenuation inversion recovery (T2-FLAIR), diffusion-weighted imaging (DWI), T1-weighted magnetic resonance imaging (T1WI), T2-weighted magnetic resonance imaging (T2WI), and susceptibility-weighted imaging (SWI). |
WMH. Brain WMH is defined as a high signal on T2WI and T2 FLAIR sequences and an equal or low signal on T1WI sequences.9
RSSI. It manifests as a recent small infarct located in the distribution of the penetrating artery. It exhibits a low signal on T1WI sequences, a high signal on T2WI and T2 FLAIR sequences, and has coronal and sagittal diameters of greater than 20 mm, with an axial maximum diameter of less than 20 mm.
LI. Among the various subtypes of cerebral infarction, LI holds a distinctive position within the realm of ischemic stroke, accounting for approximately 25%.10 These foci exhibit small sizes, ranging from 3–15 mm in diameter. Lesions smaller than 3 mm may indicate recent subcortical infarctions and are predominantly located deep in the brain, including the basal ganglia region, thalamus, and brainstem.
PVS. It manifests as a low signal on T1WI and appears as a high signal shadow on T2WI. It is distributed along the course of the penetrating arteries, resembling the signal characteristics of cerebrospinal fluid. PVS is frequently observed in the centrum semiovale, basal ganglia, and midbrain. When parallel to the mirror plane, it appears linear, whereas it appears punctate when perpendicular to the mirror plane.3 PVS are identified as lesions with diameters less than 2 mm, EPVS as lesions with diameters greater than 2 mm, RSSI as lesions with diameters between 15–20 mm, and LI sizes ranging from 2–15 mm with increased FLAIR signal at the edge.11
CMB. It’s the lesion characterized by the deposition of iron-containing hemoglobin due to blood leakage from severely damaged tiny vessels.3
CSVD Burden
Previous studies have confirmed a high correlation between the Fazekas scale and WMH volumes in terms of severity, assessing the sum of PWMH and DWMH on a scale of 0–6.12,13 To evaluate the severity of the WMH, a regression model was developed to generate the Fazekas scores (Figure 3). Specifically, the CNN-based multi-task WMH scoring network could provide Fazekas scores for each layer under different tasks (ie, PWMH and DWMH) in the image. By inputting the original T2-FLAIR image and WMH segmentation mask image, the network determined the index of the image layer corresponding to the maximum score.
 |
Figure 3 The multi-task regression model used for white matter hyperintensity (WMH) scoring. Based on the segmentation results of WMH by VB-Net, the gray-scale image and the corresponding mask served as the dual-channel input to the 2D regression network. Then, each slice of the image was transformed into the embedding to regress the corresponding WMH score and probability. Finally, the scores and probabilities of periventricular WMH (PWMH) and deep WMH (DWMH) were output by selecting the maximum probability. Convs referred to convolutional layers and GAP represented global average pooling. |
The CSVD total load score was generated from the uRP platform, combining metrics related to WMH, LI, EPVS, and CMB. The following criteria were scored as 1 point: (1) ≥ 1 LI; (2) DWMH score ≥ 2 points and/or PWMH score of 3 points in Fazekas score; (3) ≥ 1 deep or subcortical CMB; (4) moderately severe (grade 2 to 4) PVS in the basal ganglia region.14 One study included brain atrophy scores in the CSVD total load score.15 However, since brain atrophy is not specific to neurodegenerative diseases,1 its analysis was omitted in this article and not included in the CSVD load score.
Statistical Analyses
Statistical analysis was performed using SPSS 25.0 software. Continuous variables were expressed as mean ± standard deviation or median and interquartile range. The Kolmogorov–Smirnov test was used to check if the data conforms to a normal distribution. The t-test or Mann–Whitney U-test was employed for comparison based on the distribution of the data. Categorical variables were presented as percentages and analyzed using the Pearson chi-square test or Fisher exact probability method. Binary logistic regression analysis was conducted for variables with P < 0.05 and variables identified as influential, such as age, to investigate the relationship between clinical risk factors and each CSVD imaging marker. Ordered logistic regression was utilized to assess the relationship between the total CSVD score and each risk factor. A multifactorial linear regression model was applied to determine the relationship between each continuous variable imaging marker and clinical risk factors. Initially, an unadjusted model was employed, followed by an adjustment for potential confounders. Odds ratios (ORs) and 95% confidence intervals (CIs) were calculated, with statistical significance set at P < 0.05.
Results
Demographic Information
Out of the 294 patients included in the study, 211 (71.77%) were diagnosed with lacunar stroke, while 83 (28.23%) were control patients with no imaging abnormalities. The age of all patients was 59.00 (51.00, 67.00) years. In the comparison of the lacunar stroke and control groups, age (63.73 ± 9.74 vs 49.00 [40.75, 54.00]) and systolic blood pressure (136 [124, 151] mm Hg vs 126 ± 16.21 mm Hg) were significantly higher in the lacunar stroke group than in the control group (P < 0.001). Other clinical data indicated significantly higher proportions of patients with hypertension (65.88% vs 21.69%), atherosclerosis (32.70% vs 10.84%), and coronary artery disease (15.64 vs 1.20%) in the lacunar stroke group as compared with the control group (P < 0.001). Biochemical parameters, including TC (4.11 [3.44, 4.76] vs 4.45 ± 0.89), LDL (2.23 [1.73, 2.78] vs 2.58 [2.05, 2.95]), and HCY (11.70 [9.40, 14.30] vs 10.30 [8.60, 11.60]), also showed statistically significant differences between the two groups (P < 0.05), with lower levels of TC and LDL observed in the lacunar stroke group compared to the control group (Table 1).
 |
Table 1 Description of Each Clinical Risk Factor for Patients in the Lacunar Stroke and Control Groups |
Quantification of CSVD Imaging Markers, Total Load Score, and Fazekas Score
Five CSVD imaging markers were automatically segmented by VB-Net based on the corresponding MRI sequences and the segmentation performance was compared to the ground truth. As shown in Table 2 and Figure 4a, the manual contouring results for the two Readers showed good agreement across the five tasks, with median DSC values exceeding 0.90. From Figures 4b and c and Table 2, it could be seen that the segmentation results of VB-Net for WMH and RSSI were in high agreement with the ground truth (ie, Reader1 and Reader2) in terms of DSC, recall, and precision. The segmentation results for small lesions (ie, LI, PVS, and CMB) focused on recall (Figure 4d) and precision (Figure 4e), which were described in detail in Table 2. Although VB-Net performs poorly in LI segmentation, it performed well overall. Quantitative metrics (eg, number of lesions, total volume) were extracted after manual correction of the automatic segmentation results. The statistical analysis of all quantitative results (Table 3) revealed significant differences (P < 0.001) in all CSVD imaging markers between lacunar infarction patients and controls, except for EPVS. Among all patients, 152 cases (51.70%) had a CSVD total load score of ≥ 1. The proportions of Fazekas score (≥ 1), and CSVD total load score (≥ 1) were higher in the lacunar infarction group than in the control group. These differences in Fazekas scores, including DWMH, PVWMH, and CSVD total load scores, were all statistically significant (P < 0.001) (Table 3).
 |
Table 2 The Segmentation Performance of VB-Net for CSVD Imaging Biomarkers. |
 |
Table 3 Quantitative Description of Each CSVD Imaging Marker in the Lacunar Stroke and Control Groups |
 |
Figure 4 Segmentation performance of VB-Net for five CSVD imaging markers. (a) Dice similarity coefficients (DSCs) between the manual contouring results of the two Readers in five tasks. The numbers annotated in the plot represented the medians. Scatter plots showing the segmentation performance of VB-Net for white matter hyperintensity (WMH) (b) and recent small subcortical infarction (RSSI) (c), in which DSC, recall, and precision were calculated from the automated results and manual results. Each subgroup was labeled with the median and its interquartile range. Segmentation performance of VB-Net for lacunar infarction (LI), perivascular spaces (PVS), and cerebral microbleeds (CMB) were assessed by recall (d) and precision (e). Error bars represented the 95% confidence interval of the mean. |
Association of CSVD Total Load Score and Each Imaging Marker with Vascular Risk Factors
Univariate logistic regression analysis revealed statistically significant differences (P < 0.05) between the lacunar stroke and control groups in terms of age, systolic blood pressure, TC, LDL, HCY, hypertension, coronary artery disease, and atherosclerosis (Table 1). According to a multifactorial linear regression model, age exhibited a positive correlation with the number of EPVS and the total volume of LI and WMH. In the linear regression analysis of WMH volumes in different brain regions, age demonstrated a positive correlation with the volume of WMH in each region, and SBP exhibited a positive correlation with the volume of JVWMH and PVWMH (P < 0.05) (Table 4 and Table 5). And binary logistic regression analysis identified several independent risk factors for lacunar stroke patients (Table 6). After adjusting confounding factors, age, SBP, and CSVD total load score were found to be independent risk factors for lacunar stroke. In the ordered logistic regression analysis of CSVD total load score and clinical risk factors, TC exhibited statistical significance after adjusting the model to include Apo-1, ApoB, and BMI. Age showed positive correlations with CSVD total load score, and TC showed negative correlations with CSVD total load score (P < 0.05) (Table 7).
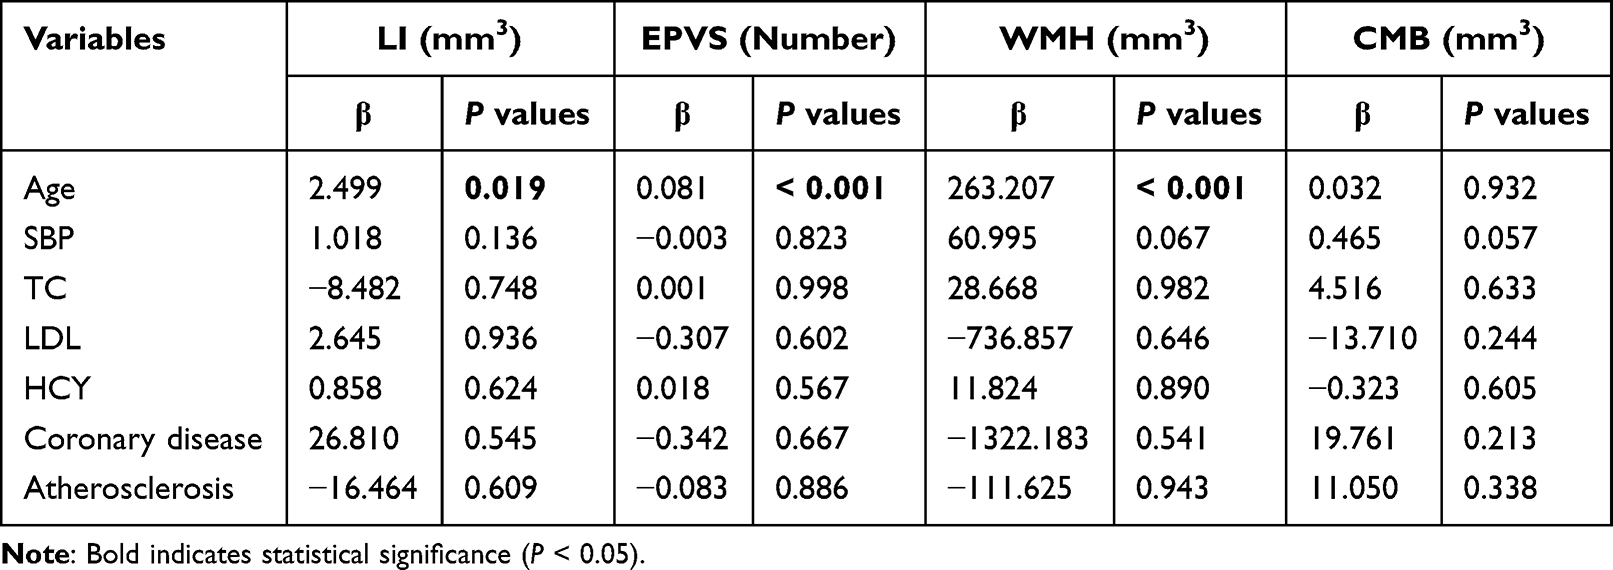 |
Table 4 Multifactor Linear Regression Analysis of CSVD Imaging Markers and Clinical Risk Factors. The Regression Coefficient is Expressed as β |
 |
Table 5 Multifactor Linear Regression Analysis of Regional WMH and Vascular Risk Factors |
 |
Table 6 Binary Logistic Regression Analysis of Each Clinical Risk Factor in Patients in the Lacunar Stroke and Control Groups |
 |
Table 7 Ordinal Logistic Regression Analysis of Clinical Risk Factors and CSVD Scores |
Discussion
Epidemiological surveys have demonstrated independent associations between hypertension, diabetes, age, hyperlipidemia, smoking, and alcohol consumption with stroke.16 Yang et al study found that 24-hour daytime and nighttime SBP levels and 24-hour SBPV were positively associated with CSVD burden.15 Furthermore, brain WMH volume has been observed to increase with age.17 Our research results also indirectly confirm the above viewpoint. A recent Mendelian randomized observational study has suggested a link between obesity, as indicated by a high BMI, and an elevated risk of CSVD.18 In addition, the Apo B/ApoA-1 ratio has increasingly been recognized as a promising biochemical marker for coronary heart disease, intracranial atherosclerosis, and stroke.19–21 However, little is known about its relationship with CSVD. Studies have suggested that HCY may increase the risk of recurrent primary stroke.22 In this study, patients with higher TC levels actually had lower CSVD total load scores, cohort studies have also demonstrated that patients with hypercholesterolemia or hyperlipidemia have lower WMH severity at the time of stroke, supporting the possibility that hyperlipidemia may have a relatively protective role in CSVD disease.23 While this paper did not examine cognitive impairment, one study found an association between asymptomatic lacunar infarction, perivascular gap enlargement, and cognitive decline.24,25 WMH has been associated with an increased risk of long-term cognitive impairment and Alzheimer’s disease.26 Additionally, approximately one-third of stroke patients suffer from depression,27 and CSVD load has been linked to post-stroke depression.28 RSSI with severe total CSVD burden at baseline have a greater potential to become cavitated.29 Furthermore, evidence suggests that sex may influence lipid levels and CSVD, with HDL and ApoA-1 levels negatively correlated with PWMH and DWMH in women,30 and the probability of stroke is higher in women than in men.31
In this study, we employed the MR CSVD intelligent analysis system, which incorporates various deep learning detection and segmentation algorithms, to automatically perform lesion segmentation and index quantification based on multi-modal MR images, including WMH, RSSI, LI, PVS, and CMB. This system enables precise lesion localization, allowing clinicians to visualize and digitally analyze the lesions for accurate diagnosis. Compared to traditional manual outlining, this deep learning-based automatic segmentation algorithm offers higher efficiency, consistency, and repeatability, particularly when dealing with large-scale datasets. It helps overcome operator bias associated with traditional manual outlining and film reading. Previous studies have also confirmed the value of deep learning detection, segmentation, and classification networks in assisting CSVD diagnosis, although most of them have focused on specific scenarios. For instance, Ghafoorian et al developed a multiscale location-aware framework for the automatic identification of vascular-derived lacunae using 3D CNN. The model achieved a sensitivity of 97.4% and a false positive rate of 0.13% in a single layer of images, demonstrating detection performance comparable to that of four trained physicians.32 Duan et al achieved automatic segmentation of RSSI based on a CNN network, with a segmentation performance (DSC = 0.728) surpassing that of four low-ranking (< 10 years of experience) physicians’ manual outlining results (DSC = 0.615, 0.690, 0.717, and 0.747, respectively). Not only limited to cerebrovascular diseases, but deep learning has also shown excellent performance in segmenting brain malignant tumors. Rasheed et al33 used image enhancement and CNNs to accurately segment common types of brain tumors (recall = 0.979, area under the curve [AUC] = 0.978). The automated segmentation approach also outperformed the clinicians’ manual outlining in terms of accuracy and significantly improved segmentation efficiency, requiring only 1% of the time needed for manual outlining.34
In comparison to previous applications of deep learning in CSVD, the MR brain small vessel disease intelligent analysis system developed in this study can detect, segment, quantify, and score various subtypes of CSVD. It can be applied to different MR sequences for different subtypes, including (1) assessment of WMH lesion extent, volume quantification, and calculation of Fazekas score; (2) RSSI; (3) luminal foci; and (4) automatic detection of EPVS, precise localization within the brain, and quantitative lesion analysis (including number, total volume). Consequently, its application scenarios are more extensive, allowing for a comprehensive assessment of CSVD status at different levels and calculation of the total CSVD load score to facilitate accurate diagnosis by clinicians. In future research, we plan to increase the sample size and further analyze the correlation between CSVD imaging markers and clinical risk factors.
Conclusion
Age, SBP, and CSVD total load score emerged as independent risk factors for lacunar stroke patients, with older age associated with a higher risk of EPVS, LI, and cerebral WMH. The application of multi-modal deep learning-based MR image processing enabled the segmentation and quantification of various CSVD lesions. The lacunar stroke group demonstrated higher CSVD imaging indexes when assessed comprehensively through different levels of CSVD imaging marker status, calculation of the CSVD total load score, and digitization of disease severity. The CSVD total load score quantified by the VB-Net algorithm provides an assessment of stroke severity to a certain extent and may provide guidance for developing stroke prevention strategies.
Ethical Disclosure
This study has obtained informed consents from patients, all human research procedures followed the committee’s ethical standards for human experimentation (institutional and national) and with the Helsinki Declaration of 1975, as revised in 2008. This study was approved by the Ethics Committee of the First People’s Hospital of Hangzhou, Zhejiang University School of Medicine (IIT-20221212-0198-01).
Acknowledgment statement
Zhiliang Zhang and Zhongxiang Ding are co-first authors for this study. Thanks to all the researchers who participated in this study, all the patients who provided data, and the researchers who provided literature support.
Funding
This study was supported in part by the National Natural Science Foundation of China (61976075), the National Key Research and Development Program of China (2022YFE0205700), and the Natural Science Foundation of Zhejiang Province (Y22H185692).
Disclosure
R.H., J.W., and F.S. are employees of Shanghai United Imaging Intelligence Co., Ltd., and the company has no role in designing and performing the surveillance and analyzing and interpreting the data. All other authors report no conflicts of interest relevant to this article.
References
1. Cannistraro RJ, Badi M, Eidelman BH, et al. CNS small vessel disease: a clinical review. Neurology. 2019;92(24):1146–1156. doi:10.1212/WNL.0000000000007654
2. Ma C, Li H, Zhang K, et al. Risk Factors of Restroke in Patients with Lacunar Cerebral Infarction Using Magnetic Resonance Imaging Image Features under Deep Learning Algorithm. Contrast Media Mol Imaging. 2021;2021:2527595. doi:10.1155/2021/2527595
3. Duering M, Biessels GJ, Brodtmann A, et al. Neuroimaging standards for research into small vessel disease-advances since 2013. Lancet Neurol. 2023.
4. Jiang J, Wang D, Song Y, et al. Computer-aided extraction of select MRI markers of cerebral small vessel disease: a systematic review. Neuroimage. 2022;261:119528. doi:10.1016/j.neuroimage.2022.119528
5. Williamson BJ, Khandwala V, Wang D, et al. Automated grading of enlarged perivascular spaces in clinical imaging data of an acute stroke cohort using an interpretable, 3D deep learning framework. Sci Rep. 2022;12(1):788. doi:10.1038/s41598-021-04287-4
6. Wu J, Xia Y, Wang X, et al. uRP: an integrated research platform for one-stop analysis of medical images. Front Radiol. 2023;3:1153784.
7. Zhu W, Huang H, Zhou Y, et al. Automatic segmentation of white matter hyperintensities in routine clinical brain MRI by 2D VB-Net: a large-scale study. Front Aging Neurosci. 2022;14:915009. doi:10.3389/fnagi.2022.915009
8. Rieu Z, Kim J, Kim RE, et al. Semi-Supervised Learning in Medical MRI Segmentation: brain Tissue with White Matter Hyperintensity Segmentation Using FLAIR MRI. Brain Sci. 2021;11(6). doi:10.3390/brainsci11060720
9. Chen X, Wang J, Shan Y, et al. Cerebral small vessel disease: neuroimaging markers and clinical implication. J Neurol. 2019;266(10):2347–2362.
10. Wardlaw JM, Smith EE, Biessels GJ, et al. Neuroimaging standards for research into small vessel disease and its contribution to ageing and neurodegeneration. Lancet Neurol. 2013;12(8):822–838. doi:10.1016/S1474-4422(13)70124-8
11. Wardlaw JM, Smith C, Dichgans M. Small vessel disease: mechanisms and clinical implications. Lancet Neurol. 2019;18(7):684–696.
12. Gao F-Q, Swartz RH, Scheltens P, et al. Complexity of MRI white matter hyperintensity assessments in relation to cognition in aging and dementia from the Sunnybrook Dementia Study. J Alzheimers Dis. 2011;26(Suppl 3):379–388. doi:10.3233/JAD-2011-0058
13. Gouw AA, Van Der Flier WM, Van Straaten EC, et al. Simple versus complex assessment of white matter hyperintensities in relation to physical performance and cognition: the LADIS study. J Neurol. 2006;253(9):1189–1196. doi:10.1007/s00415-006-0193-5
14. Staals J, Makin SDJ, Doubal FN, et al. Stroke subtype, vascular risk factors, and total MRI brain small-vessel disease burden. Neurology. 2014;83(14):1228–1234. doi:10.1212/WNL.0000000000000837
15. Yang S, Yuan J, Qin W, et al. Twenty-four-hour ambulatory blood pressure variability is associated with total magnetic resonance imaging burden of cerebral small-vessel disease. Clin Interv Aging. 2018;13:1419–1427. doi:10.2147/CIA.S171261
16. Flora GD, Nayak MK. A Brief Review of Cardiovascular Diseases, Associated Risk Factors and Current Treatment Regimes. Curr Pharm Des. 2019;25(38):4063–4084.
17. Garnier-Crussard A, Bougacha S, Wirth M, et al. White matter hyperintensities across the adult lifespan: relation to age, Aβ load, and cognition. Alzheimers Res Ther. 2020;12(1):127. doi:10.1186/s13195-020-00669-4
18. Kim MS, Kim WJ, Khera AV, et al. Association between adiposity and cardiovascular outcomes: an umbrella review and meta-analysis of observational and Mendelian randomization studies. Eur Heart J. 2021;42(34):3388–3403. doi:10.1093/eurheartj/ehab454
19. Park J-H, Hong K-S, Lee E-J, et al. High levels of apolipoprotein B/AI ratio are associated with intracranial atherosclerotic stenosis. Stroke. 2011;42(11):3040–3046. doi:10.1161/STROKEAHA.111.620104
20. Holme I, Aastveit AH, Hammar N, et al. Relationships between lipoprotein components and risk of ischaemic and haemorrhagic stroke in the Apolipoprotein MOrtality RISk study (AMORIS). J Intern Med. 2009;265(2):275–287. doi:10.1111/j.1365-2796.2008.02016.x
21. Lind L, Vessby B, Sundström J. The apolipoprotein B/AI ratio and the metabolic syndrome independently predict risk for myocardial infarction in middle-aged men. Arterioscler Thromb Vasc Biol. 2006;26(2):406–410. doi:10.1161/01.ATV.0000197827.12431.d0
22. Anniwaer J, Liu M-Z, Xue K-D, et al. Homocysteine might increase the risk of recurrence in patients presenting with primary cerebral infarction. Int J Neurosci. 2019;129(7):654–659. doi:10.1080/00207454.2018.1517762
23. Jimenez-Conde J, Biffi A, Rahman R, et al. Hyperlipidemia and reduced white matter hyperintensity volume in patients with ischemic stroke. Stroke. 2010;41(3):437–442. doi:10.1161/STROKEAHA.109.563502
24. Benjamin P, Trippier S, Lawrence AJ, et al. Lacunar Infarcts, but Not Perivascular Spaces, Are Predictors of Cognitive Decline in Cerebral Small-Vessel Disease. Stroke. 2018;49(3):586–593. doi:10.1161/STROKEAHA.117.017526
25. Ding J, Sigurðsson S, Jónsson PV, et al. Large Perivascular Spaces Visible on Magnetic Resonance Imaging, Cerebral Small Vessel Disease Progression, and Risk of Dementia: the Age, Gene/Environment Susceptibility-Reykjavik Study. JAMA Neurol. 2017;74(9):1105–1112. doi:10.1001/jamaneurol.2017.1397
26. H-Y H, Y-N O, Shen X-N, et al. White matter hyperintensities and risks of cognitive impairment and dementia: a systematic review and meta-analysis of 36 prospective studies. Neurosci Biobehav Rev. 2021;120:16–27. doi:10.1016/j.neubiorev.2020.11.007
27. Guo J, Wang J, Sun W, et al. The advances of post-stroke depression: 2021 update. J Neurol. 2022;269(3):1236–1249. doi:10.1007/s00415-021-10597-4
28. Zhang X, Tang Y, Xie Y, et al. Total magnetic resonance imaging burden of cerebral small-vessel disease is associated with post-stroke depression in patients with acute lacunar stroke. Eur J Neurol. 2017;24(2):374–380. doi:10.1111/ene.13213
29. Wang M, Li Y, Song Y, et al. Association of total cerebral small vessel disease burden with the cavitation of recent small subcortical infarcts. Acta Radiol. 2023;64(1):295–300. doi:10.1177/02841851211066583
30. Yin ZG, Wang QS, Yu K, et al. Sex differences in associations between blood lipids and cerebral small vessel disease. Nutr, Metab Cardiovasc Dis. 2018;28(1):28–34. doi:10.1016/j.numecd.2017.10.001
31. Feigin VL. Global, regional, and national burden of stroke and its risk factors, 1990-2019: a systematic analysis for the Global Burden of Disease Study 2019. Lancet Neurol. 2021;20(10):795–820. doi:10.1016/S1474-4422(21)00252-0
32. Ghafoorian M, Karssemeijer N, Heskes T, et al. Deep multi-scale location-aware 3D convolutional neural networks for automated detection of lacunes of presumed vascular origin. Neuroimage Clin. 2017;14:391–399. doi:10.1016/j.nicl.2017.01.033
33. Rasheed Z, Ma Y-K, Ullah I, et al. Brain Tumor Classification from MRI Using Image Enhancement and Convolutional Neural Network Techniques. Brain Sci. 2023;13(9):1320.
34. Duan Y, Shan W, Liu L, et al. Primary Categorizing and Masking Cerebral Small Vessel Disease Based on “Deep Learning System”. Front Neuroinf. 2020;14:17. doi:10.3389/fninf.2020.00017
 © 2024 The Author(s). This work is published and licensed by Dove Medical Press Limited. The
full terms of this license are available at https://www.dovepress.com/terms
and incorporate the Creative Commons Attribution
- Non Commercial (unported, 3.0) License.
By accessing the work you hereby accept the Terms. Non-commercial uses of the work are permitted
without any further permission from Dove Medical Press Limited, provided the work is properly
attributed. For permission for commercial use of this work, please see paragraphs 4.2 and 5 of our Terms.
© 2024 The Author(s). This work is published and licensed by Dove Medical Press Limited. The
full terms of this license are available at https://www.dovepress.com/terms
and incorporate the Creative Commons Attribution
- Non Commercial (unported, 3.0) License.
By accessing the work you hereby accept the Terms. Non-commercial uses of the work are permitted
without any further permission from Dove Medical Press Limited, provided the work is properly
attributed. For permission for commercial use of this work, please see paragraphs 4.2 and 5 of our Terms.