Back to Journals » Journal of Inflammation Research » Volume 15
Quantile-Specific Heritability of Inflammatory and Oxidative Stress Biomarkers Linked to Cardiovascular Disease
Authors Williams PT
Received 2 November 2021
Accepted for publication 16 December 2021
Published 5 January 2022 Volume 2022:15 Pages 85—103
DOI https://doi.org/10.2147/JIR.S347402
Checked for plagiarism Yes
Review by Single anonymous peer review
Peer reviewer comments 2
Editor who approved publication: Professor Ning Quan
Paul T Williams
Molecular Biophysics & Integrated Bioimaging Division, Lawrence Berkeley National Laboratory, Berkeley, CA, USA
Correspondence: Paul T Williams Email [email protected]
Purpose: Heritability (h2, the proportion of the phenotypic variance attributable to additive genetic effects) is traditionally assumed to be constant throughout the distribution of the phenotype. However, the heritabilities of circulating C-reactive protein, interleukin-6, plasminogen activator inhibitor type-1 (PAI-1), and monocyte chemoattractant protein-1 (MCP-1) concentrations depend upon whether the phenotype is high or low relative to their distributions (quantile-dependent expressivity), which may account for apparent gene–environment interactions. Whether the heritabilities of other inflammatory biomarkers linked to cardiovascular disease are quantile-dependent remain to be determined.
Patients and Methods: Quantile-specific offspring-parent (βOP) and full-sib regression slopes (βFS) were estimated by applying quantile regression to the age- and sex-adjusted phenotypes of families surveyed as part of the Framingham Heart Study. Quantile-specific heritabilities were calculated as: h2=2βOP/(1+rspouse) and h2={(1+8rspouseβFS)0.5– 1}/(2rspouse).
Results: Heritability (h2 ± SE) of lipoprotein-associated phospholipase A2 (Lp-PLA2) mass concentrations increased from 0.11 ± 0.03 at the 10th percentile, 0.08 ± 0.03 at the 25th, 0.12 ± 0.03 at the 50th, 0.20 ± 0.04 at the 75th, and 0.26 ± 0.06 at the 90th percentile, or 0.0023 ± 0.0006 per each one-percent increase in the phenotype distribution (Plinear trend= 0.0004). Similarly, h2 increased 0.0029 ± 0.0011 (Plinear trend= 0.01) for sP-selectin, 0.0032 ± 0.0009 (Plinear trend= 0.0001) for soluble intercellular adhesion molecule 1 (sICAM-1), and 0.0026 ± 0.0006 for tumor necrosis factor receptor 2 (TNFR2) (Plinear trend= 5.0 × 10− 6) per each one-percent increase in their distributions when estimated from βOP. Osteoprotegerin and soluble ST2 heritability also increased significantly with increasing percentiles of their distributions when estimated from βFS. Lp-PLA2 activity, CD40 ligand, TNFα, interleukin-18, and myeloperoxidase heritability showed no significant quantile-dependence.
Conclusion: The heritabilities of circulating Lp-PLA2-mass, sP-selectin, sICAM-1, TNFR2, osteoprotegerin and soluble ST2 concentrations are quantile-dependent, which may contribute to purported genetic modulations of: 1) sP-selectin’s relationships to venous thrombosis, pulmonary hypertension, type 2 diabetes and atorvastatin treatment; 2) sICAM-I’s relationships to brain abscess and atorvastatin treatment; and 3) Lp-PLA2’s relationships to myocardial infarction and preeclampsia.
Keywords: gene–environment interaction: heritability, P-selectin, intercellular adhesion molecule-1, lipoprotein-associated phospholipase A2, osteoprotegerin
Introduction
Biomarkers of systemic inflammation and oxidative stress are associated with cardiovascular disease,1 metabolic syndrome,2 frailty,3 diabetes,4 obesity,5,6 and chronic renal disease.7 The Framingham Heart Study has reported that additive genetic effects explain significant portions of the phenotypic variance of these markers (heritability, h2): 0.17 for CD40 ligand,8 0.34 for intercellular adhesion molecule-1 (ICAM-1),8 0.25 for lipoprotein-associated phospholipase A2 (Lp-PLA2) mass,9 0.41 for Lp-PLA2 activity,9 0.24 for myeloperoxidase,8 0.45 for P-selectin,8 0.34 for tumor necrosis factor receptor II (TNFR2),8 0.45 for soluble ST2,10 and 0.16 for tumor necrosis factor-alpha (TNFα)8 when log-transformed. Traditionally, these estimates are assumed to apply throughout the phenotype distribution.11
“Quantile-dependent expressivity” refers to the phenotypic expression of a genetic variant being dependent on whether the trait is high or low relative to its distribution.12 For example, the heritability of total and HDL cholesterol,13–15 triglycerides,16 leptin,17 glucose,18 insulin,18 uric acid19 and adiponectin concentrations,20 coffee and alcohol consumption,21,22 adiposity,12,23 and postprandial lipemia24 increase with increasing quantiles of each trait, whereas intakes of other macronutrients and height do not.12,22,23 One potential consequence of quantile-dependent expressivity is that sampling by characteristics that distinguish high- vs low-valued phenotypes may produce genetic differences traditionally ascribed to gene–environment, gene–drug and gene–diet interactions when a simpler explanation of quantile-dependence might suffice.15
We have previously demonstrated quantile-dependent expressivity for C-reactive protein,25 a nonspecific acute-phase reactant,26 and interleukin-6,27 a primary stimulator for the production of most acute-phase proteins.28 Specifically, their heritabilities increased significantly with their increasing serum concentrations, such that larger genetic effects at higher vis-à-vis lower concentrations might contribute to published examples of their gene–drug, gene–diet, and gene–environment interactions. Using data from the Framingham Heart Study,29,30 the current report furthers these analyses by examining whether quantile-dependent heritability might also affect other biomarkers representing different aspects of inflammatory cascade: inflammatory cytokines (TNFα, TNFR2, interleukin-18), leukocyte tethering (P-selectin), cellular immunity (CD40 ligand), leukocyte adhesion (ICAM-1), and monocyte adhesion and endothelial sensitization (osteoprotegerin).31–36 Soluble ST2 was examined because it functions as a decoy receptor for interleukin-33 that prevents ST2/IL-33 signaling.10 Lp-PLA2 and myeloperoxidase concentrations were included as measures of oxidative stress.37 Quantile-regression does not require statistical normality and therefore tests for genetic effects on these phenotypes as originally measured.
Materials and Methods
The Framingham Study data were obtained from the National Institutes of Health FRAMCOHORT, GEN3, FRAMOFFSPRING Research Materials obtained from the National Heart, Lung, and Blood (NHLBI) Biologic Specimen and Data Repository Information Coordinating Center. The hypothesis tested is not considered as part of the initial Framingham Study design and is exploratory. The Offspring Cohort included 5124 adult children of the Original Cohort and their spouses who were initially examined between 1971 and 1975, reexamined eight years later, and then every three to four years thereafter.29 The Third Generation Cohort was composed of the prodigy of the Offspring Cohort.30 Subjects used in the current analyses were at least 16 years of age and were self-identified as non-Hispanic White.
Lawrence Berkeley National Laboratory Human Subjects Committee (HSC) approved the analyses of these data for protocol “Gene–environment interaction vs quantile-dependent penetrance of established SNPs (107H021)”. LBNL holds the Office of Human Research Protection's Federal Wide Assurance Number FWA 00006253. Approval number: 107H021-13MR20. All surveys were conducted under the direction of the Framingham Heart Study human use committee guidelines, with signed informed consent from all participants or parent and/or legal guardian if <18 years of age.
Phlebotomy was performed on fasting participants who had rested for 5 to 10 minutes in a supine position, typically between 8 and 9 AM. Specimens were stored at −80°C without freeze-thaw cycles until assay. Collected blood was spun at 5000 rpm for 20 minutes in a balanced oxalate tube. The inflammatory biomarkers were measured in the Offspring Cohort at clinical examination 6 (soluble ST2), examination 7 (sICAM-1, myeloperoxidase, Lp-PLA2, osteoprotegerin, sP-selectin, TNFR2, CD40 ligand, TNFα, interleukin-18) and examination 8 (sICAM-1, Lp-PLA2, osteoprotegerin, sP-selectin, TNFR2) and in the Generation Three Cohort at examination 1 (ICAM-1, LpPLA2, osteoprotegerin, sP-selectin, TNFR2). Offspring Cohort examination 6 took place between 1996 and 1998, examination 7 between 1998 and 2001, and examination 8 between 2004 and 2008. The Third Generation Cohort examination one occurred between 2002 and 2005. Details of the assays have been published36,38 and are available online.39
Statistics
The statistical analyses have been described elsewhere,12–25 and summarized briefly here. Individual subject values are the average of the age- and sex-adjusted concentrations over all available exams. Offspring-parent regression slopes (βOP) were computed using parents from the Offspring Cohort and their Third Generation Cohort children. Full-sibling regression slopes (βFS) were calculated for the sibships identified in the Offspring and Third Generation Cohorts by forming all ki(ki-1) sib pair combinations for the ki siblings in sibship i and assigning equal weight to each sibling.40 Heritability in the narrow sense (h2) was calculated as h2= 2βOP/(1+rspouse) and h2={(1+8βFSrspouse)0.5–1}/(2rspouse), where rspouse is the spouse correlation.11
Simultaneous quantile regression was performed using the sqreg command of Stata (version 11, StataCorp, College Station, TX).41 One thousand bootstrap samples were drawn to estimate the variance-covariance matrix for the 91 quantile regression coefficients between the 5th and 95th percentiles of the offspring’s distribution.42 Quantile-specific expressivity was assessed by: 1) estimating quantile-specific β-coefficients (±SE) for the 5th, 6th, …, 95th percentiles of the sample distribution; 2) plotting the quantile-specific β coefficient vs the quantile of the trait distribution; and 3) testing whether the resulting graph was constant, or changed as a linear, quadratic, and cubic functions of the percentile of the trait distribution using orthogonal polynomials.43 Statistics are reported ± one standard error. “Quantile-specific heritability” refers to the heritability statistic, whereas “quantile-specific expressivity” is the biological phenomenon of the trait expression being quantile-dependent.
Published examples of gene–disease and gene–environment interactions were identified through keyword search on PubMed. Data from these studies were re-analyzed using genotype-specific means or medians presented in the original articles 44–56 or by extracting these values from published graphs 57–62 using the Microsoft PowerPoint formatting palette as previously described.24 Specifically, histograms were created that display a precision medicine perspective of genotype-specific patient-control differences or treatment effects. These were compared to line graphs showing a larger genetic effect size when average circulating concentrations were high, ie, a quantile-dependent expressivity perspective. The juxtaposition of the histograms and line graphs shows that both interpretations warrant consideration. Our interpretations of these other studies are not necessarily those of the original authors.
Data Availability
The data are not being published in accordance with the data use agreement between the NIH National Heart Lung, and Blood Institute and Lawrence Berkeley National Laboratory. However, the data that support the findings of this study are available from NIH National Heart Lung, and Blood Institute Biologic Specimen and Data Repository Information Coordinating Center directly through the website https://biolincc.nhlbi.nih.gov/my/submitted/request/.
Results
Table 1 displays the sample characteristics by sex and cohort. Estimated age and sex-adjusted spouse correlations (rspouse) were 0.0921 for sP-selectin, 0.1110 for sICAM-1, 0.0525 for Lp-PLA2 mass, −0.0171 for Lp-PLA2 activity, 0.0067 for osteoprotegerin, 0.0561 for CD40 ligand, −0.0376 for interleukin-18, 0.0238 for TNFα, 0.0835 for TNFR2, 0.0845 for myeloperoxidase, and 0.0538 for soluble ST2. Table 2 presents the traditional estimates of heritability for the untransformed inflammatory markers, which were strongest for sP-selectin concentration, soluble ST2 concentration, and Lp-PLA2 activity, modest for circulating sICAM-1, Lp-PLA2-mass, osteoprotegerin, TNFR2, and myeloperoxidase concentrations, and nonsignificant for TNFα and CD40 ligand.
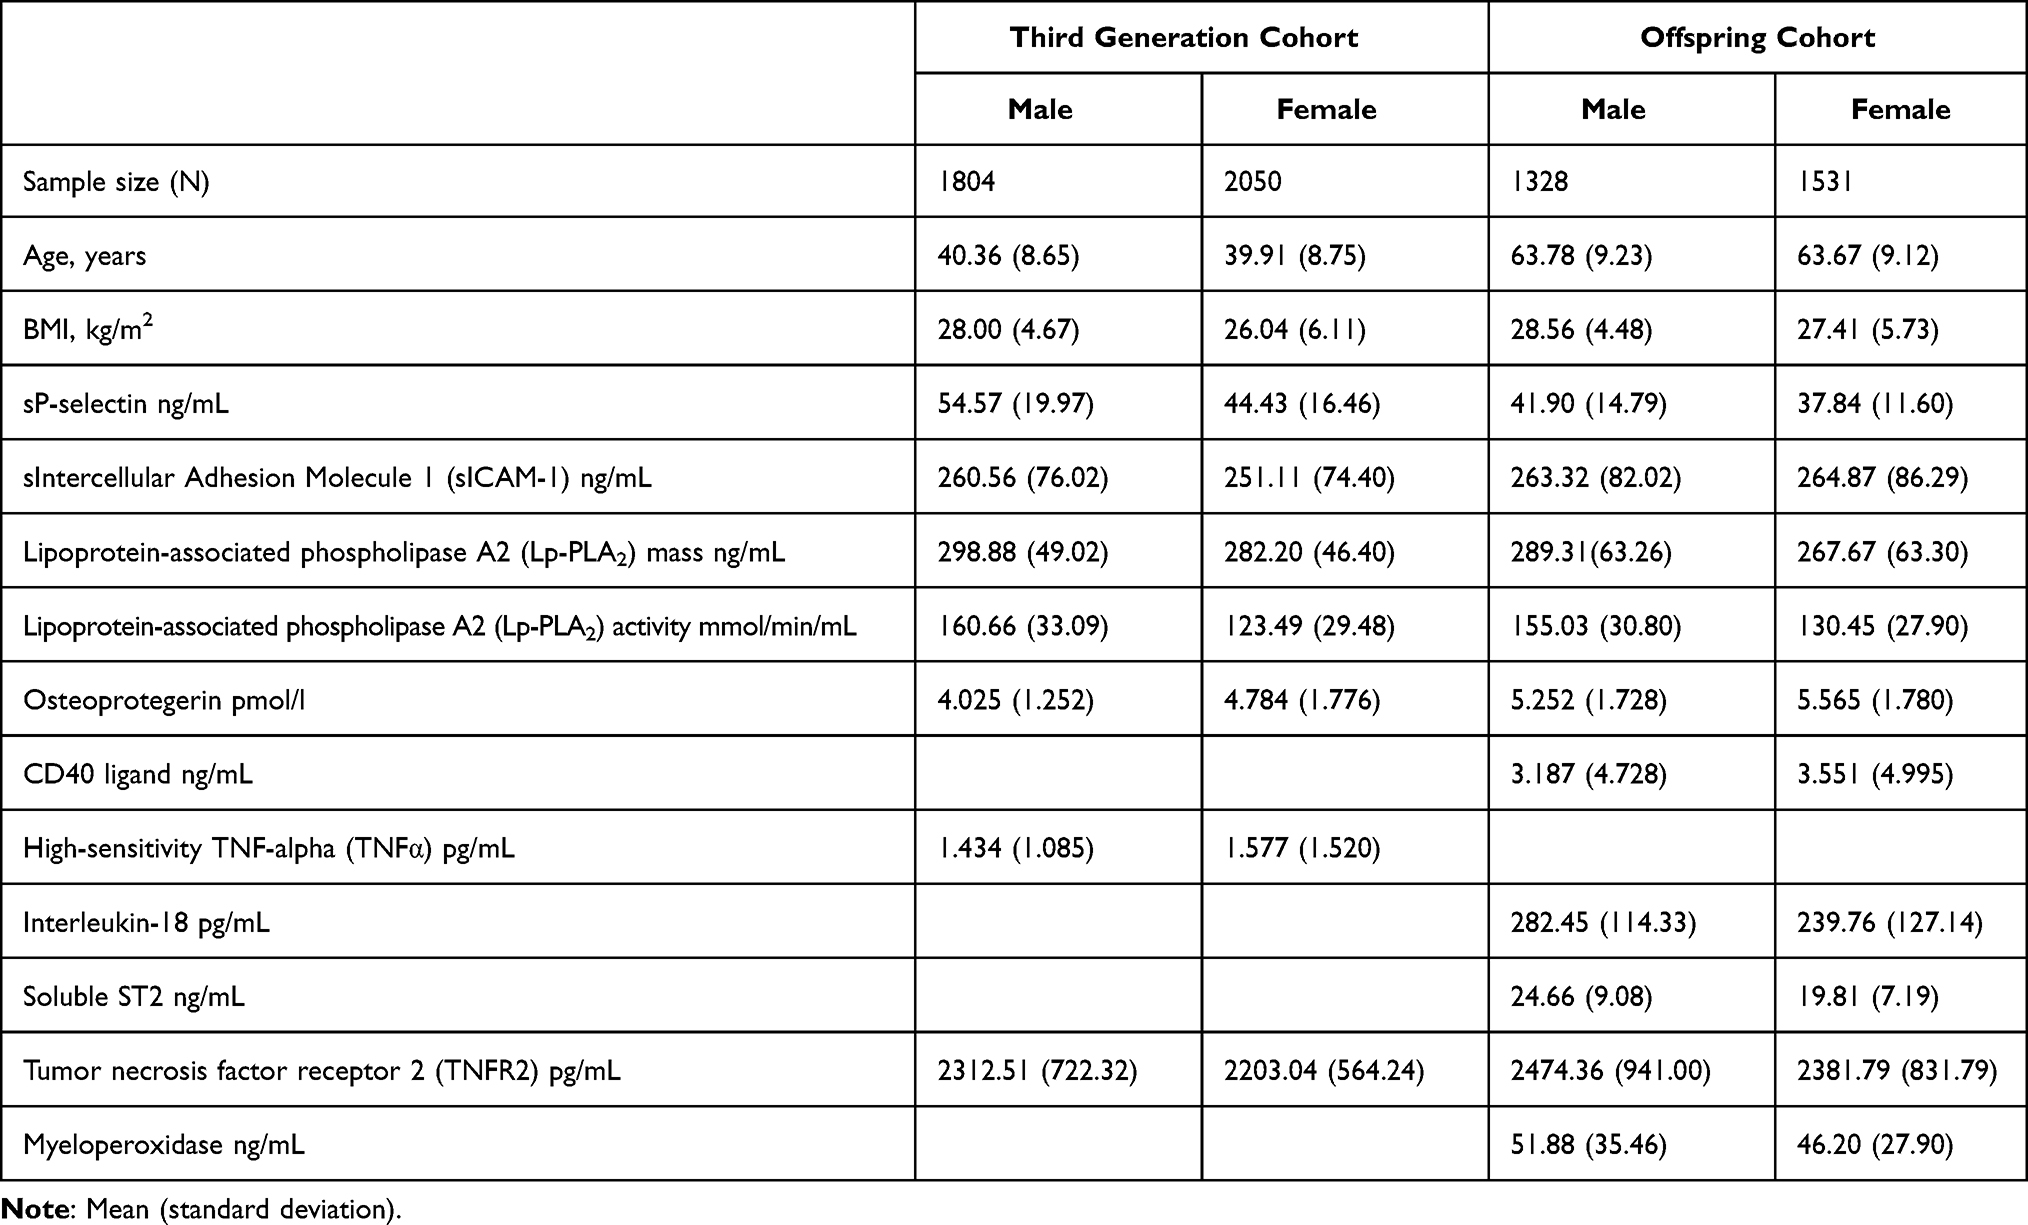 |
Table 1 Sample Characteristics |
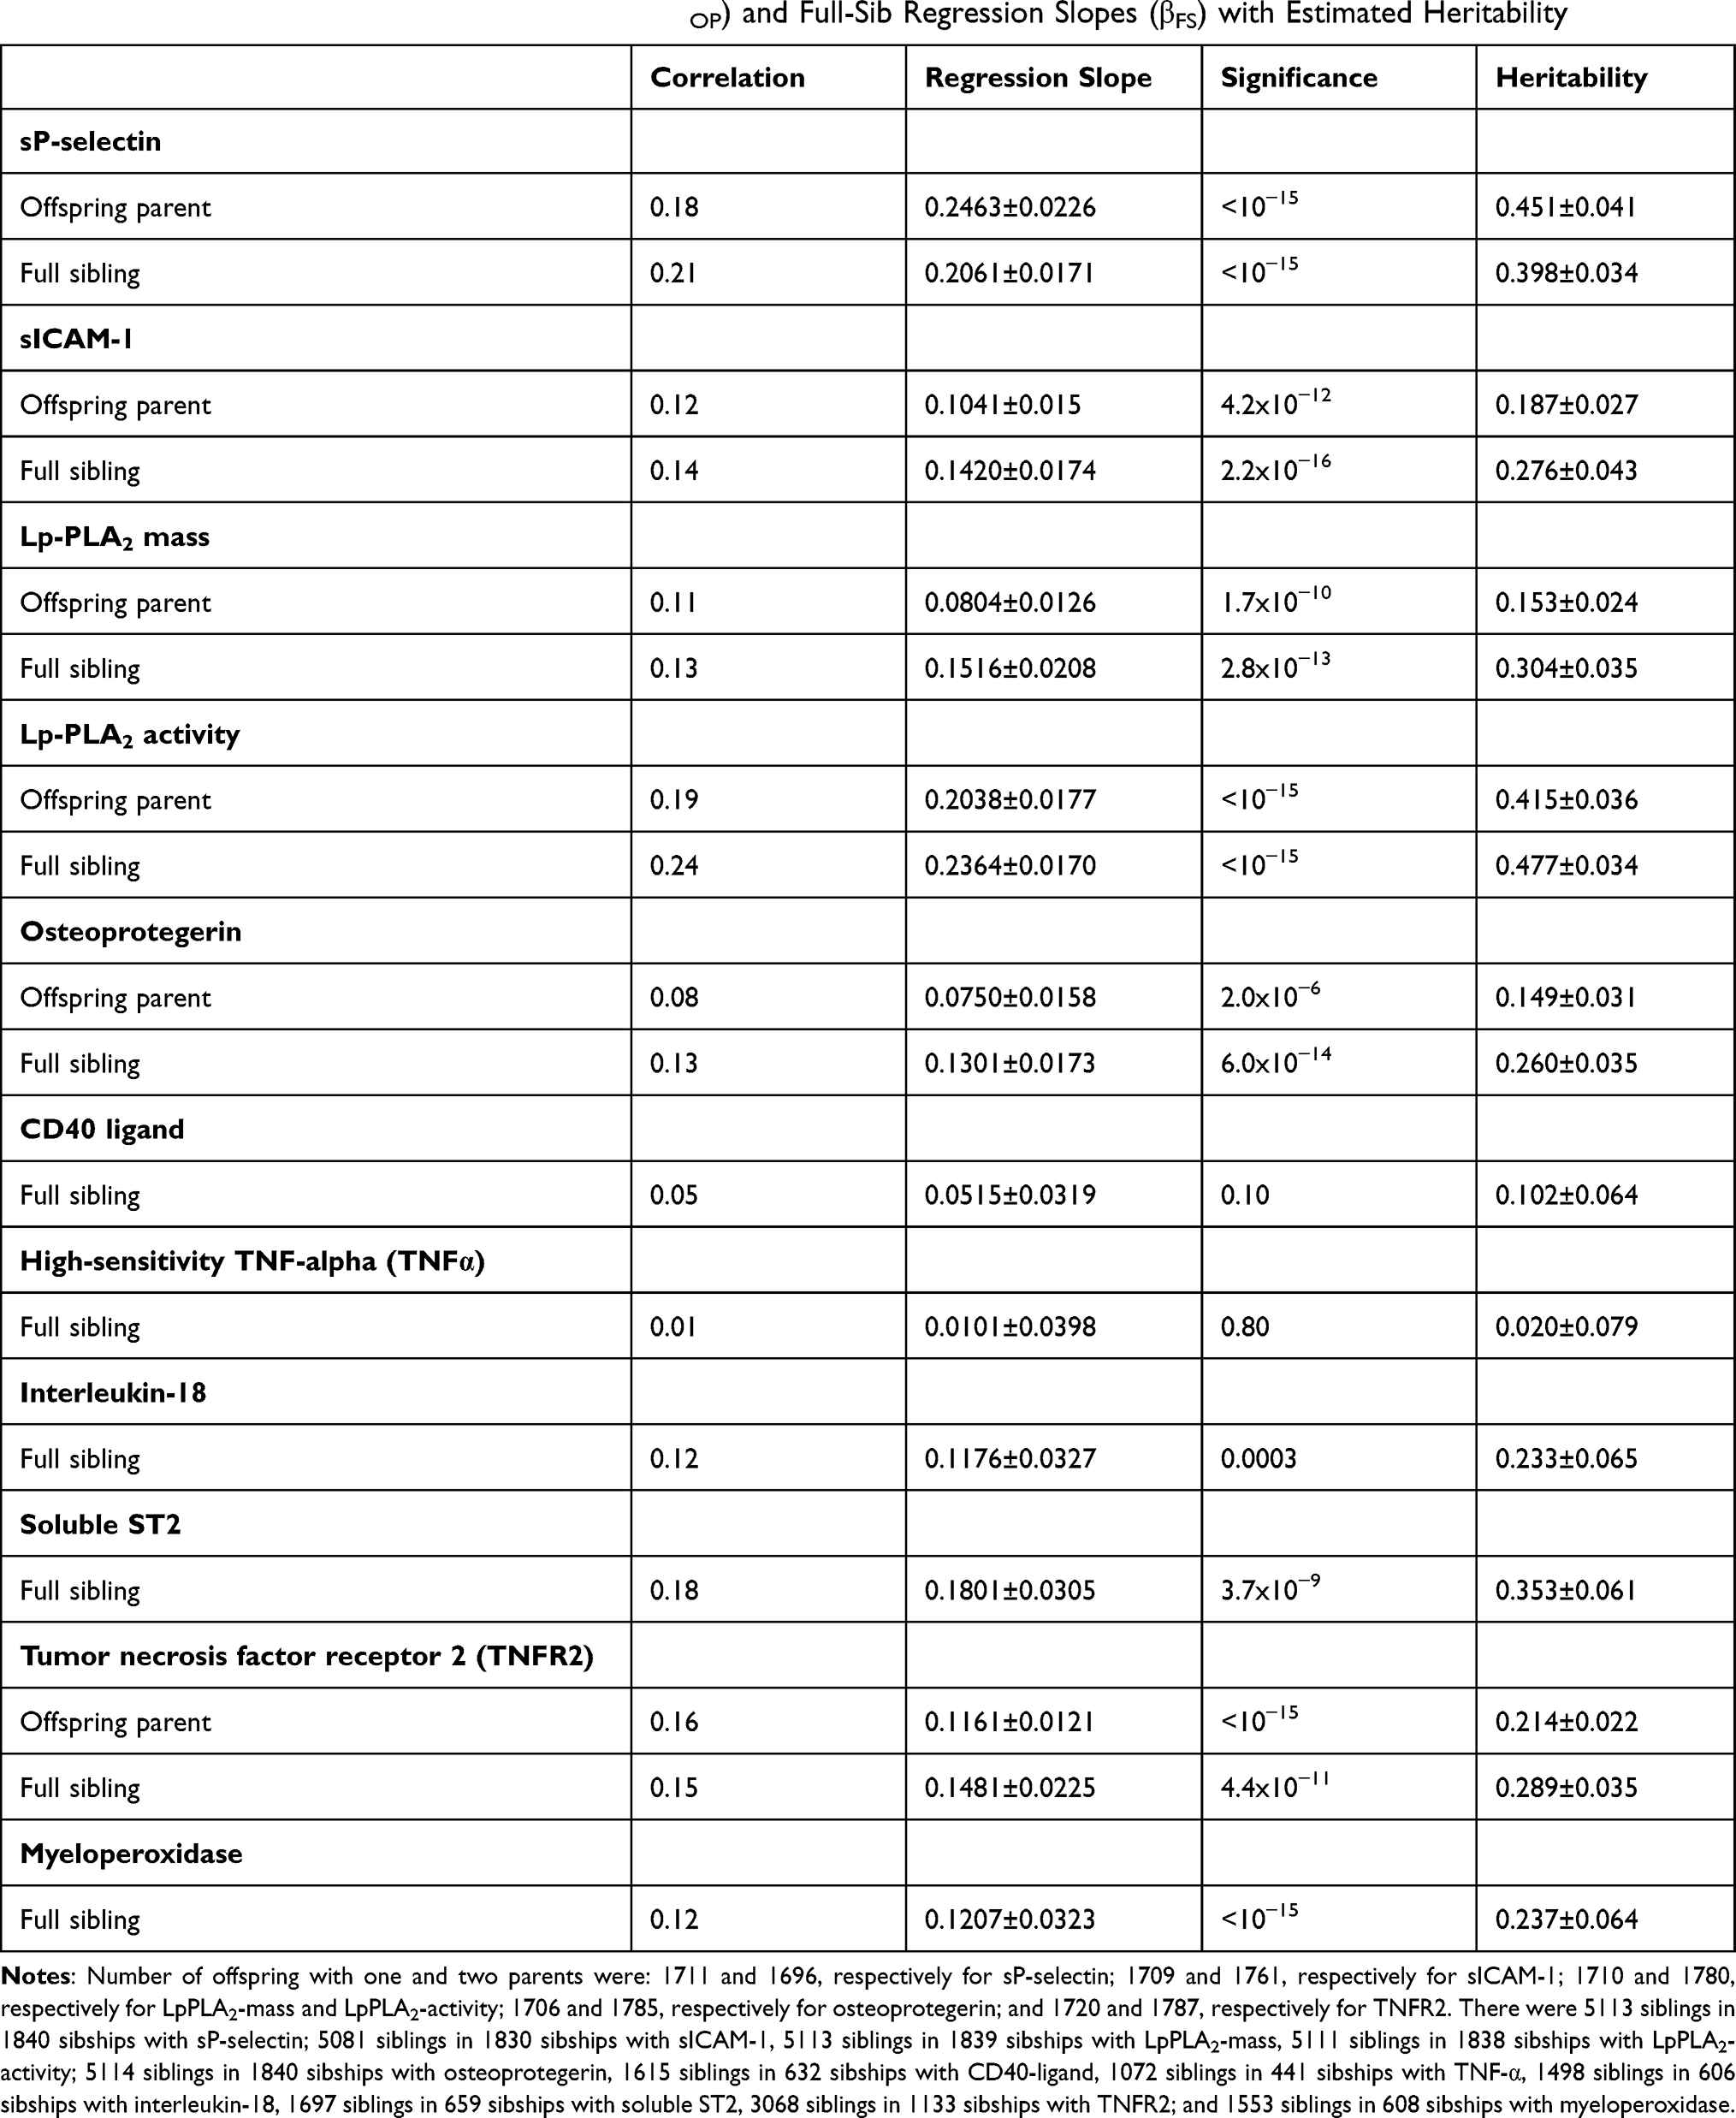 |
Table 2 Traditional Estimates of Offspring-Parent (βOP) and Full-Sib Regression Slopes (βFS) with Estimated Heritability |
Quantile-Specific Heritability
Figure 1A presents the offspring-parent regression slopes (βOP) for selected quantiles of the offspring’s age and sex-adjusted Lp-PLA2 mass concentrations. Each ng/mL increment in the parents’ Lp-PLA2 concentration corresponded to a 0.057±0.018 ng/mL Lp-PLA2 increase at the 10th percentile of the offspring’s Lp-PLA2 distribution (P = 0.001), a 0.042±0.014 ng/mL increase at the 25th percentile (P = 0.003), a 0.063±0.014 ng/mL increase at the 50th (P = 8.4x10⁻⁶), a 0.106±0.020 ng/mL increase at the 75th percentile (P = 6.3x10⁻⁸), and a 0.139±0.031 ng/mL increase at the 90th percentile (P = 7.9x10⁻⁶). These correspond to h2±SEs of 0.109±0.034 at the 10th, 0.080±0.026 at the 25th, 0.119±0.027 at the 50th, 0.201±0.037 at the 75th, and 0.264±0.059 at the 90th percentile. These quantile-specific regression slopes were included with those of other quantiles to create the quantile-specific heritability function in Figure 1B, ie, where the offspring-parent slopes (Y-axis) are plotted as a function of the quantile of the offsprings’ sample distribution (X-axis). If the offspring-parent slope was the same for all offspring quantiles as traditionally assumed, then Figure 1A would display parallel regression lines, and Figure 1B would present a flat horizontal graph. In fact, the graph shows that the slopes become progressively greater with increasing quantiles above about the 70th percentile, such that on average each 1-percent increase in the offspring’s distribution was associated with a 0.0023±0.0006 unit linear increase in h2 (Plinear trend=0.0004). The heritability function is, in fact, convex (Pquadratic=0.01) meaning that the increase in heritability with increasing percentiles of the offspring’s Lp-PLA2 distribution is accentuated at higher concentrations. Figure 1C presents a significant increase in βFS-estimated heritability with increasing quantiles of the sib Lp-PLA2 mass distribution.
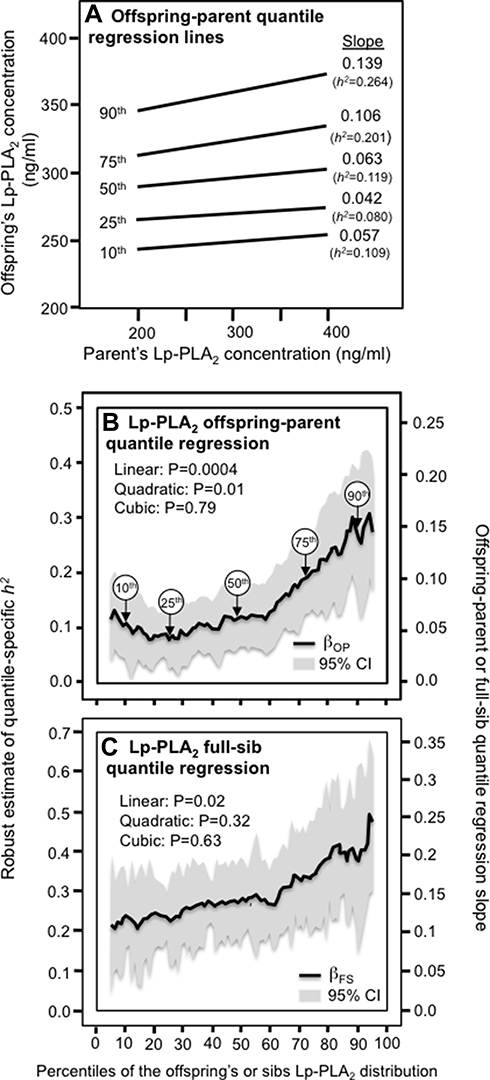 |
Figure 1 (A) Offspring-parent regression slopes (βOP) for selected quantiles of the offspring’s untransformed Lp-PLA2-mass concentrations with corresponding estimates of heritability (h2=2βOP/(1+rspouse)),11 where the correlation between spouses was rspouse=0.0525. The slopes became greater (ie, steeper) with increasing quantiles of the Lp-PLA2 distribution. (B) The selected quantile-specific regression slopes were included with those of other quantiles to create a quantile-specific heritability function. Significance of the linear, quadratic and cubic trends and the 95% confidence intervals (shaded region) were determined by 1000 bootstrap samples. (C) Quantile-specific full-sib regression slopes (βFS) with corresponding estimates of heritability as calculated by h2={(8rspouseβFS+1)0.5–1}/(2rspouse).11 |
Table 3 presents quantile regression analyses for the additional inflammatory markers. Figure 2 shows that the heritabilities of sP-selectin, sICAM-1, and TNFR2 increase significantly with increasing percentiles of the offspring phenotype distribution. Moreover, these increases in heritability were further accelerated at higher concentrations of sICAM-1 (Pquadratic=0.05) and TNFR2 (Pquadratic=0.03). Figure 3 presents the significant increases in h2 for osteoprotegerin and soluble ST2 concentrations. The results for osteoprotegerin were mixed, with increasing βFS with increasing percentiles of the sibling concentrations, but not βOP. Lp-PLA2 activity and circulating concentrations of CD40 ligand, TNFα, interleukin-18 and myeloperoxidase heritability showed no significant quantile-dependence.
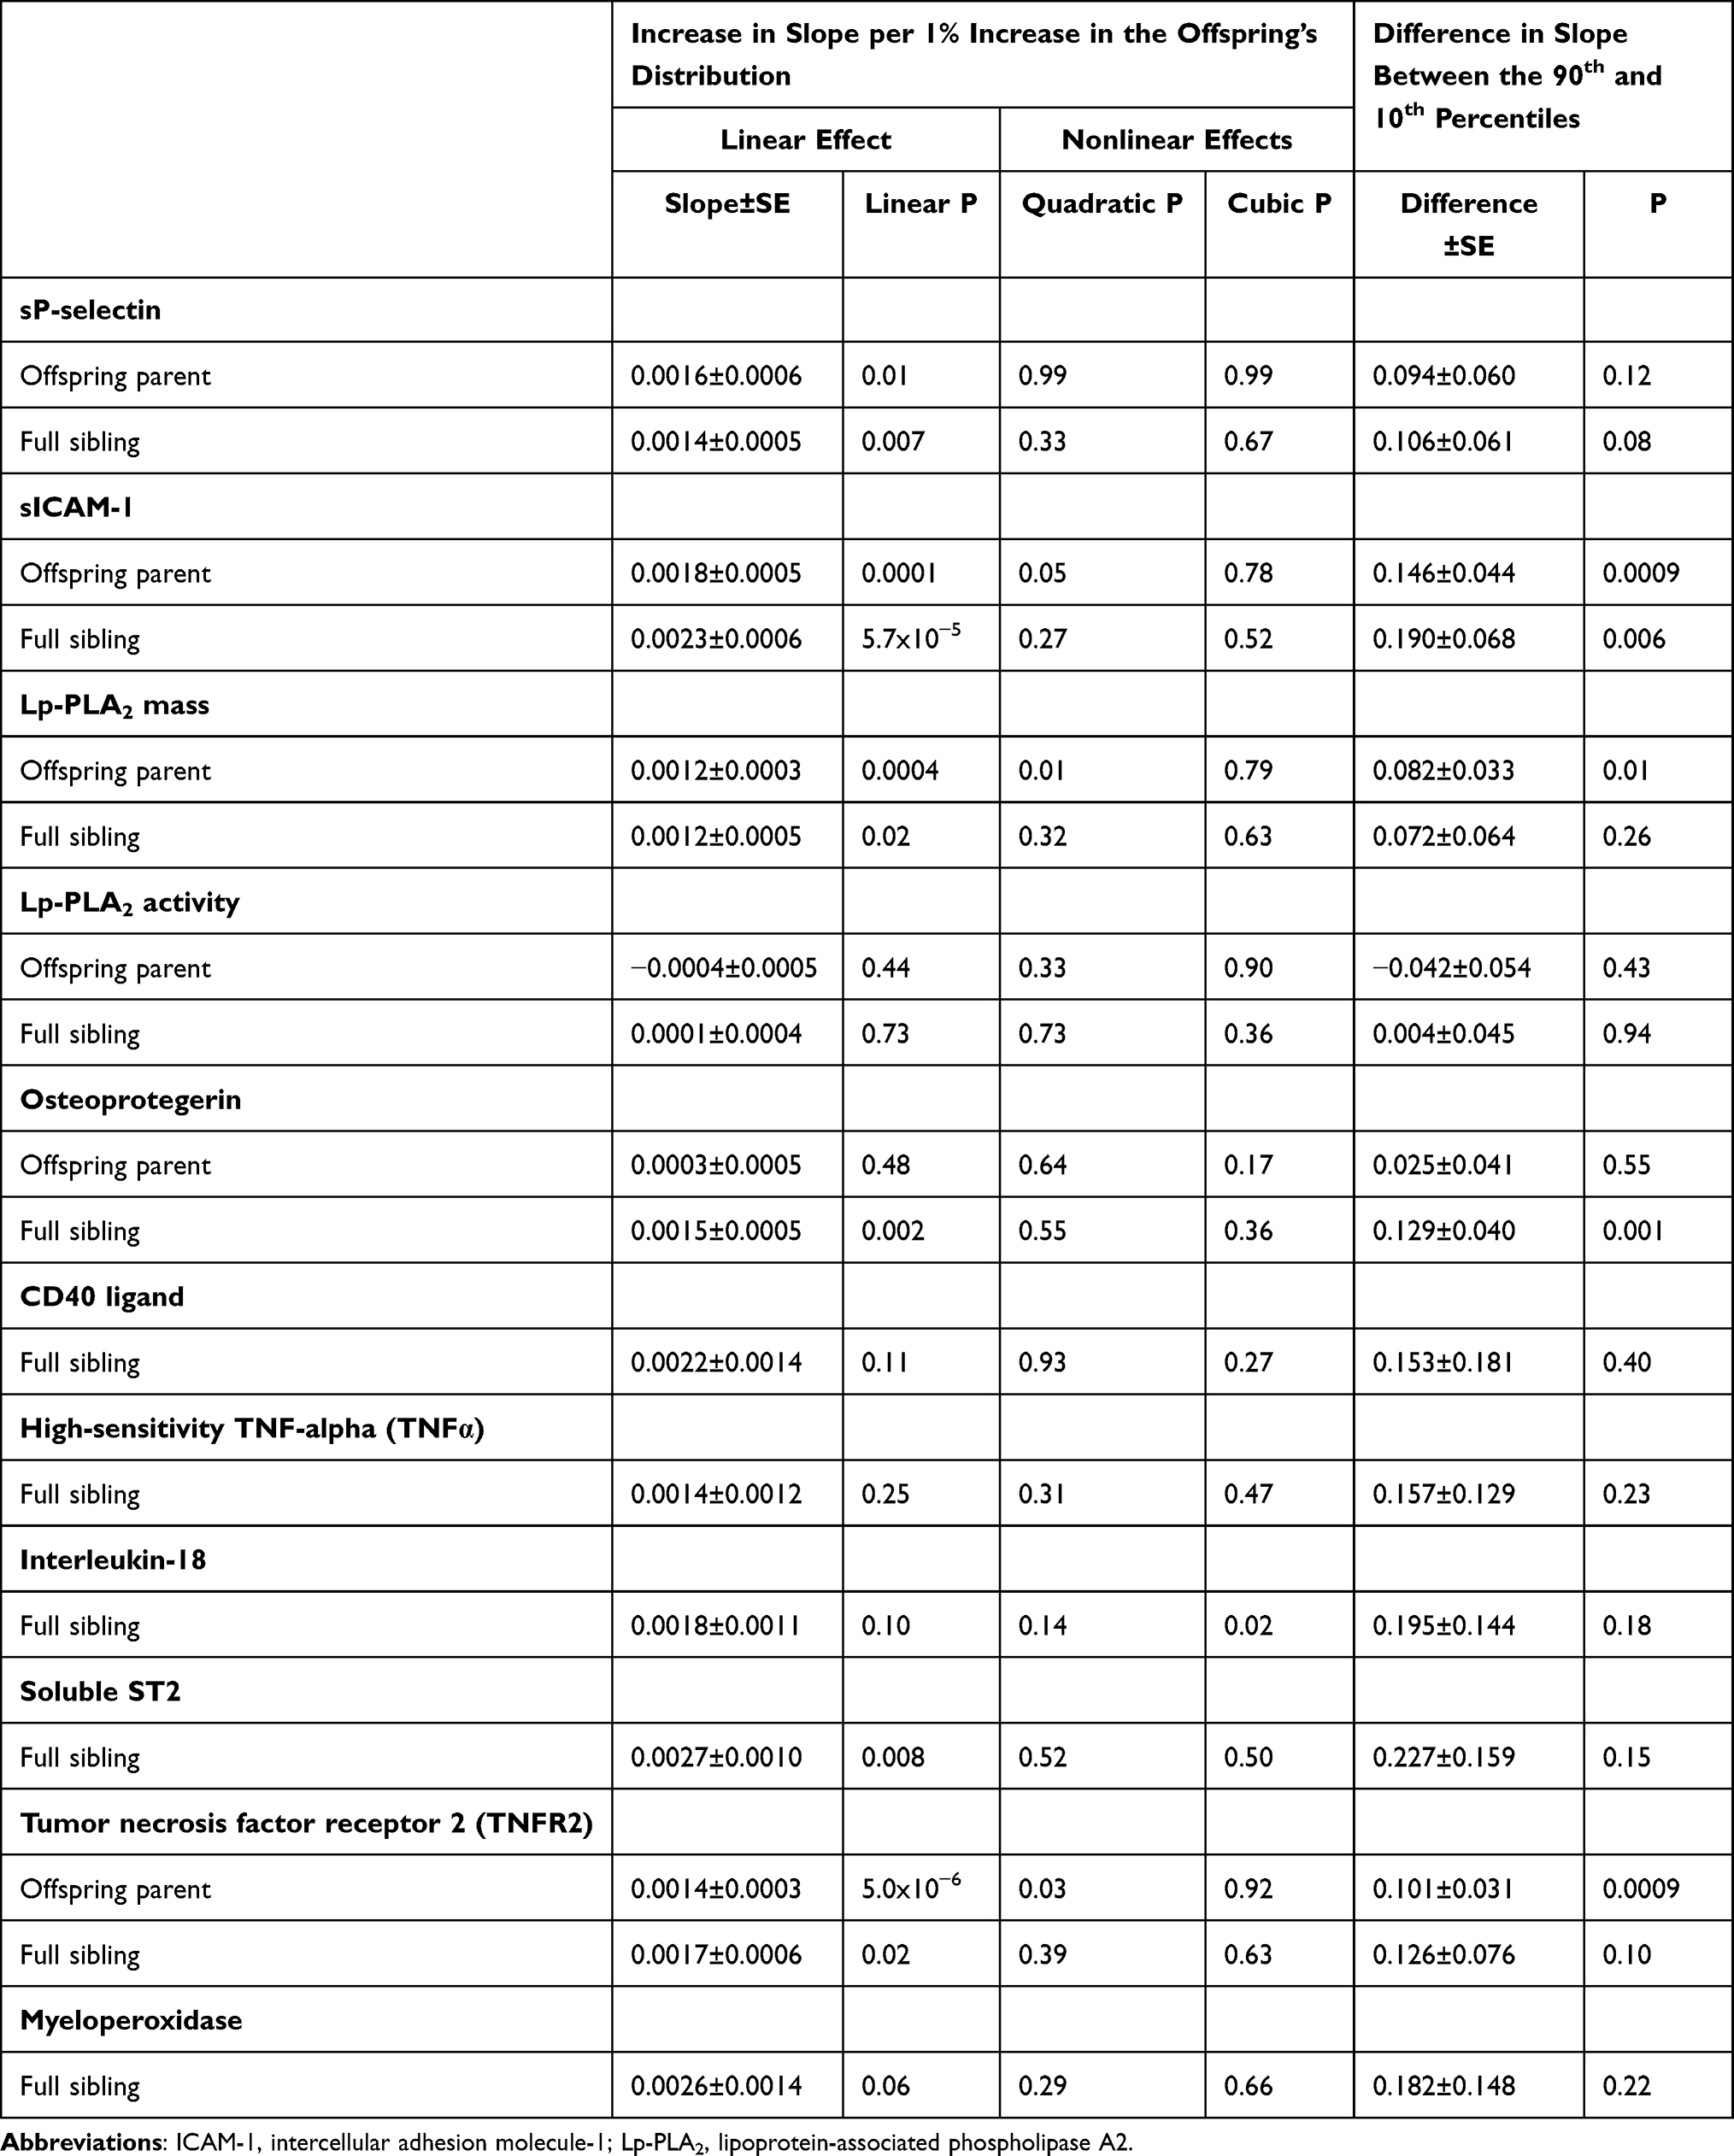 |
Table 3 Quantile Regression Analyses of Offspring-Parent and Full-Sib Phenotypes from the Framingham Heart Study |
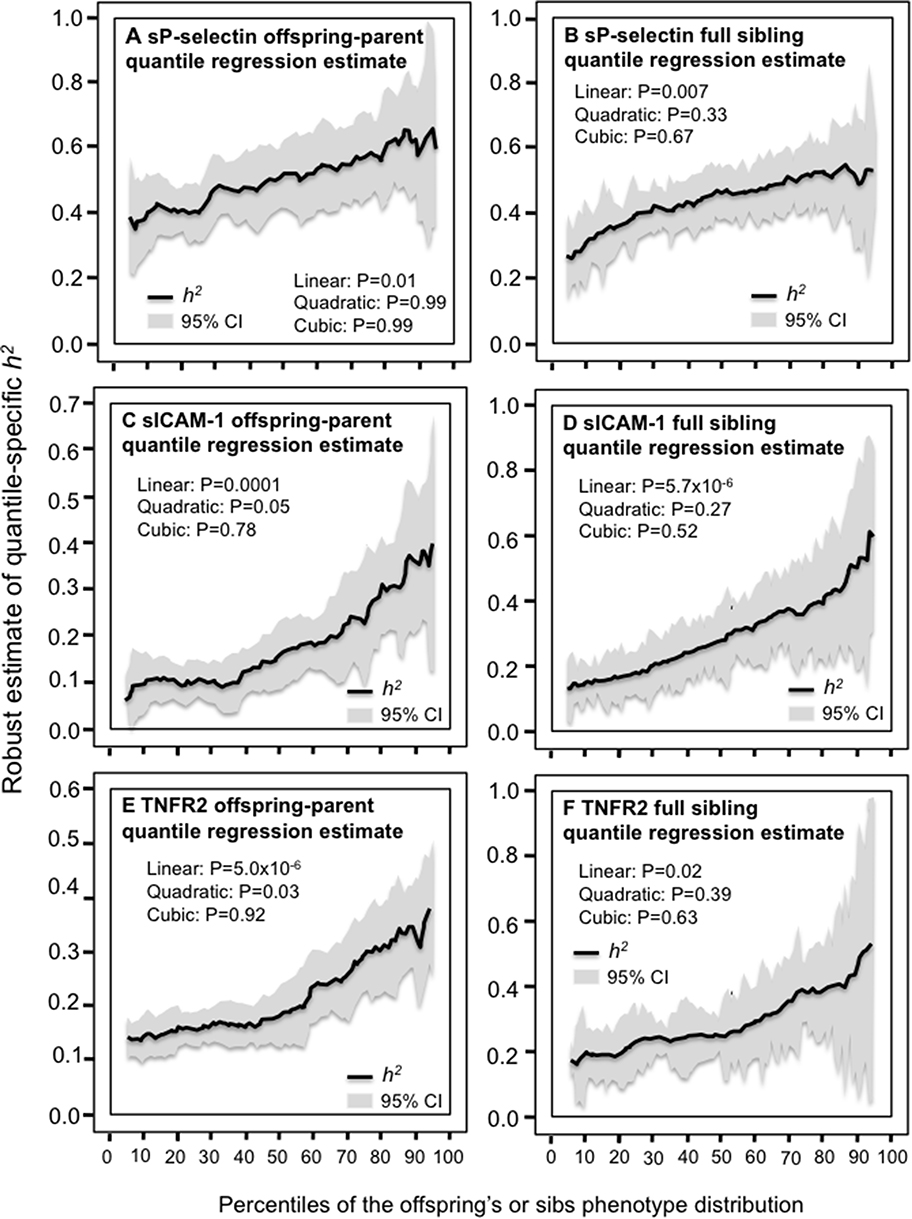 |
Figure 2 Quantile-specific heritability by percentiles of the offspring or sib phenotypic distribution for: sP-selectin concentrations (A and B); sICAM-1 concentrations (C and D); and tumor necrosis factor receptor type 2 (TNFR2) concentrations (E and F). |
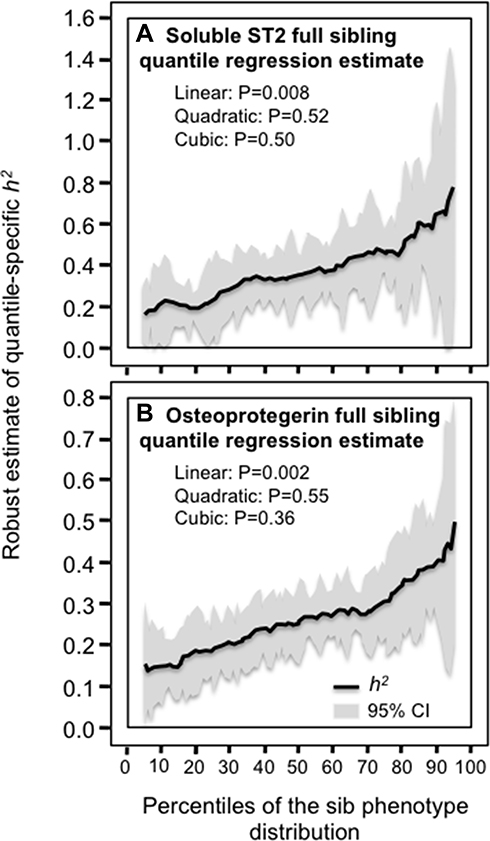 |
Figure 3 Quantile-specific heritability by percentiles of the sib phenotypic distribution for: (A) soluble ST2 concentrations in citrated plasma, and (B) serum osteoprotegerin concentrations. |
Logarithmically Transformed Phenotypes
Supplementary Table 1 shows that the logarithmic transformation generally alters, rather than eliminates, quantile-dependent heritability, ie, greater heritability at lower (not higher) concentrations for log sP-selectin, log Lp-PLA2 activity, and log TNFR2, and increasing convexity for Lp-PLA2-mass and CD40 ligand. The increase in heritability with increasing sICAM-1 concentrations persisted when log-transformed. Estimated age and sex-adjusted spouse correlations (rspouse) were 0.0898 for log sP-selectin, 0.1121 for log sICAM-1, 0.1161 for log Lp-PLA2 mass, 0.0330 for log Lp-PLA2 activity, 0.0795 for log osteoprotegerin, 0.0345 for log CD40 ligand, 0.1392 for log TNFα, 0.0760 for log TNFR2, 0.0873 for log myeloperoxidase, and 0.0688 for log soluble ST2.
Reassessing Published Gene–Disease and Gene–Treatment Interactions
Heritability lacks the specificity of directly measured genotypes; therefore, we also examined published studies that measured genetic variants directly from the perspective of quantile-dependent expressivity to establish external validity and generalizability. Figures 4 and 5 are derived from published examples that show larger genetic effect sizes for conditions that elevate P-selectin, ICAM-1, Lp-PLA2-mass, and osteoprotegerin concentrations, consistent with their quantile-specific heritability. Specifically, the histograms present patient-control differences by genotype for venous thromboembolism, coronary heart disease with pulmonary hypertension, T2DM, brain abscess, myocardial infarction, intervertebral disc degeneration and carotid artery unstable plaque, and genotype-specific reductions in sP-selectin and sICAM-1 due to statin treatment. Alternatively, the line graphs present the results from the perspective of quantile-dependent expressivity, ie, larger cross-sectional differences between genotypes at the higher mean concentration of the diseased state or prior to statin treatment.
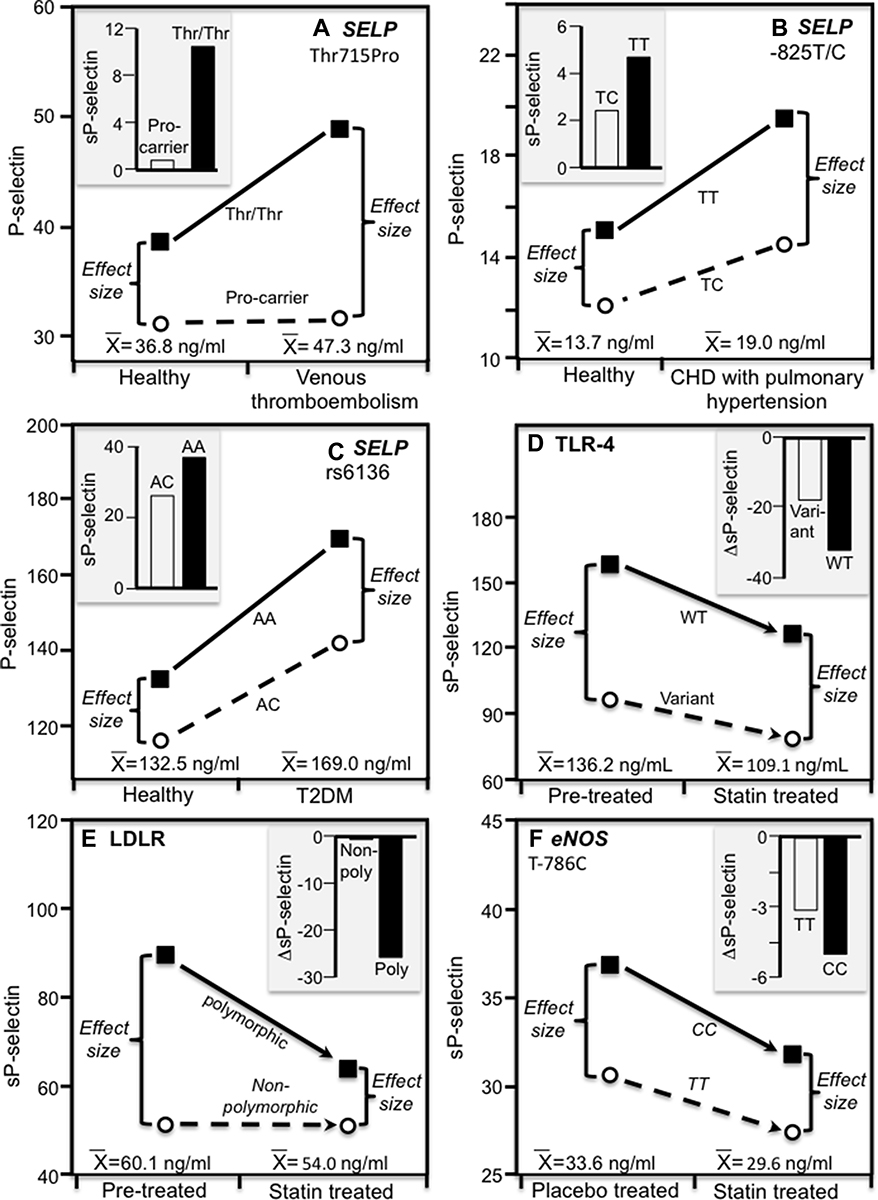 |
Figure 4 Precision medicine perspective of genotype-specific sP-selectin differences (histogram inserts) vs quantile-dependent expressivity perspective (line graphs showing larger genetic effect size when average sP-selectin concentrations were high) for: (A) Ay et al 2007 report on the serum sP-selectin difference between 116 venous thromboembolism (VTE) patients and 129 age and sex-matched controls by SELP rs6136 (Thr715Pro) genotypes;.57 (B) Li et al 2015 report on the sP-selectin difference between congenital heart disease patients with pulmonary hypertension and healthy controls by −825T/C genotypes in the SELP promoter region; 44 (C) Kaur et al 2019 report on the sP-selectin difference between type 2 diabetes mellitus (T2DM) patients and healthy controls by SELP rs6136 genotypes;45 (D) Di Nisio et al 2004 report on the decrease in sP-selection concentrations following 20 mg/d atorvastatin by toll-like receptor-4 (TLR-4) gene variants (Asp299Gly and Thr399Ile vs wild type);46 (E) Bolewski et al 2008 report showing greater reductions in mean sP-selectin concentrations following 3 months of 20 mg/d atorvastatin treatment in 8 hypercholesterolemic patients with LDLR mutations vs 26 unmutated patients: 58 (F) Souza-Costa et al 2007 report on the decrease in sP-selection concentrations following 10 mg/d atorvastatin in 15 CC homozygotes and 15 TT homozygotes of the T-786C polymorphism of the endothelial nitric oxide synthase (eNOS) gene. 59 |
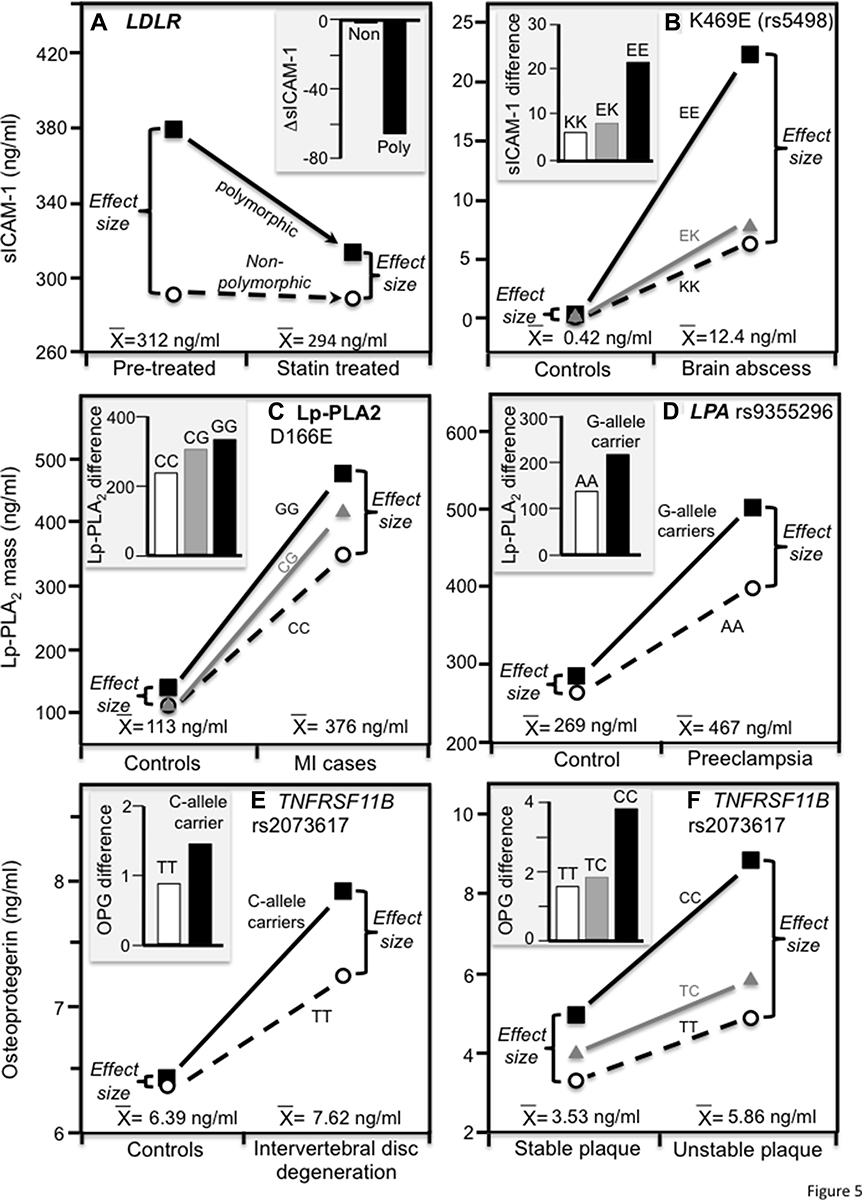 |
Figure 5 Precision medicine perspective of genotype-specific differences in inflammatory biomarkers (histogram inserts) vs quantile-dependent expressivity perspective (line graphs showing larger genetic effect size when average concentrations were high) for: (A) Bolewski et al 2008 report on three-month atorvastatin-induced changes in sICAM-1 concentrations in 8 patients with mutations in the low-density lipoprotein receptor (LDLR) gene vs 26 un-mutated patients;.58 (B) Mishra et al 2016 report on differences in serum sICAM-1 concentrations between 100 brain abscess patients and 100 controls by ICAM-1 K469E (rs5498) genotypes;60 (C) Zhang et al 2019 report on differences in serum Lp-PLA2 mass concentrations between 297 myocardial infarction (MI) patients and 262 healthy controls by Lp-PLA2 D166E genotypes; 51 (D) Tuten et al 2021 report on differences in serum Lp-PLA2 mass concentrations between 149 women with preeclampsia and 49 with normal pregnancies by LPA rs9355296 genotypes; 61 (E) Xue et al 2016 report on differences in serum osteoprotegerin concentrations between intervertebral disc degeneration patients and matched controls by TNFRSF11B 950T/C (rs2073617) genotypes;52 and (F) Straface et al 2011 report on differences in serum osteoprotegerin concentrations between 74 internal carotid artery stenosis patients with unstable plaques and 95 with stable plaque by TNFRSF11B 950T/C (rs2073617) genotypes. 53 |
Discussion
These analyses suggest that the heritability of circulating sP-selectin, sICAM-1, Lp-PLA2-mass, TNFR2, and soluble ST2 concentrations increase with increasing percentiles of their phenotype distributions. Relative to the 10th percentile, the heritability at the 90th percentile was 43% greater for sP-selection, 3.8-fold greater for sICAM-1 (P = 0.0009), 2.4-fold greater for Lp-PLA2 mass (P = 0.01), and 2.3-fold greater for TNFR2 (P = 0.0009) when estimated from βOP. Similar differences were obtained for sICAM-1 (3.5-fold greater, P = 0.006), Lp-PLA2 mass (61% greater, P = 0.04), and TNFR2 (2.3-fold greater, P = 0.03) when estimated from βFS. These differences in heritability between the 90th and 10th percentiles are smaller than those previously reported for circulating C-reactive protein (17.7-fold difference)25 and IL-6 (14-fold difference),27 but similar to those reported for two other inflammatory markers–plasminogen activator inhibitor type-1 (2.9-fold difference)63 and monocyte chemoattractant protein-1 concentrations (3.0-fold difference).64 The different results for osteoprotegerin heritability when estimated from βOP (Ptrend=0.48) and βFS (Ptrend=0.002) may relate to shared environmental effects or genetic dominance affecting sibling but not offspring-parent associations.11 Importantly, Lp-PLA2 activity, CD40 ligand, TNFα, and myeloperoxidase heritability exhibited no significant quantile-dependence, showing that not all inflammatory markers exhibit quantile-dependent expressivity.
A potential consequence of quantile-dependent expressivity is that the selection of patients by characteristics that distinguish high- vs low-value phenotypes may display different size genetic effect.14,15 These genetic differences are often interpreted from the perspective of precision medicine, ie, genotypic markers that predict treatment efficacy or disease severity, when a simpler explanation of quantile-dependent expressivity might suffice.
sP-Selectin
Adhesion molecules are found to be membrane-bound forms that mediate leukocyte attachment and internalization,65 and soluble forms produced by the shedding or enzymatic cleavage of the membrane-bound molecules.66 P-selectin belongs to the selectin family of adhesion molecules.67 Elevated sP-selectin concentrations have been associated with diabetes,68 cardiovascular disease,69,70 obstructive sleep apnea,71 and obesity.72 sP-selectin concentrations in serum are about 2.5-fold greater than their plasma concentrations due to in vitro platelet activation and sP-selectin release.48
Others report that the heritability of sP-select is moderately strong, ie 46±10% in the Fels longitudinal study,73 45% in the Framingham Offspring Study,8,74 70% in the San Antonio Family Heart Study,75 and 78% in the Emory Twin Studies.76 P-selectin is encoded by the SELP gene on chromosome 1q21-q24 spanning >50 kb,77 and includes three SNPs that have been associated with disease: Ser290Asn (rs6131) in exon 7, G1980T Leu599Val (rs6133) in exon 12, and A2331C Thr715Pro (rs6136) in exon 13.77,78 Barbalic et al reported that 9.3% of variance in sP-selectin concentrations was attributable to SELP genetic variants in their genome-wide association study (GWAS) of 4115 subjects,79 with the strongest association for the SELP rs6136 polymorphism (P = 4.1x10−61). sP-selectin concentrations were also significantly related to polymorphisms located near the ABO blood group gene (rs579459, P = 1.9x10−41), which may affect P-selectin (and ICAM-1) shedding from cell membranes by altering their glycosylation.79
P-selectin concentrations are elevated immediately following venous thrombosis and remain elevated for months thereafter, either as a cause or the consequence of the thromboembolism.57 Ay et al57 reported significantly higher plasma P-selectin concentrations in 116 patients with confirmed recurrent venous thrombosis than in 129 age and sex matched controls (47.3±1.4 vs 36.8±1.0 ng/mL, P < 0.001). Figure 4A histogram suggests that the difference was specific to Thr/Thr homozygotes of the Thr715Pro (rs6136) polymorphism (P < 0.001) whilst the patient-control difference for Pro715 allele carriers was nonsignificant (P = 0.63). Alternatively, the associated line graph shows the significant interaction between genotype and condition (Pinteraction=0.002) could also be ascribed to a larger difference between genotypes (17.3±2.4 ng/mL) at the higher patient concentrations vis-à-vis the smaller genotype difference (7.5±1.9 ng/mL) at the lower average concentrations of controls. Whereas the histogram represents a precision medicine perspective (genotype-specific health effect), the line graph represents a quantile-dependent expressivity interpretation (larger genetic effect size at the higher mean concentration).
Li et al44 reported that plasma sP-selectin concentrations were markedly higher in congenital heart disease patients with pulmonary hypertension than in healthy age- and sex-matched controls (P < 0.0001). Figure 4B histogram shows that the patient minus control sP-selectin difference was greater in TT homozygotes than TC heterozygotes of the −825T/C polymorphism in the SELP promoter region (4.7 vs 2.4 ng/mL), which quantile-dependent expressivity might attribute to the larger difference between genotypes at the higher sP-selectin concentrations of the patients (genotype difference of 5.2 ng/mL in patients vs 3.0 ng/mL in controls).
Kaur et al45 reported significantly higher serum sP-selectin concentrations in Type 2 diabetics than healthy controls (169.0±7.2 vs 132.5±5.4 ng/mL, P < 0.001), particularly in AA homozygotes (P < 0.001) and less so in AC heterozygotes (P = 0.11, Figure 4C histogram) of the SELP rs6136 polymorphism. Correspondingly, the line graph shows that the difference between AA and AC genotypes was greater at the higher average concentrations of the diabetics (27.4 vs 16.6 ng/mL).
Three studies report reductions in sP-selection concentrations following 10 to 20 mg/d of atorvastatin. They include Di Nisio et al46 report of somewhat greater reductions in sP-selectin concentrations in noncarriers of the Thr399Ile or Asp299Gly polymorphisms of the toll-like receptor-4 (TLR-4) gene (ie wild type, Figure 4D histogram), Bolewski et al58 report of greater sP-selectin reductions in hypercholesterolemic patients having mutations in low-density lipoprotein receptor (LDLR) gene than in those lacking mutations (Pinteraction<0.05, Figure 4E), and Souza-Costa et al 59 report of significant (P < 0.05) sP-selectin reductions in CC homozygotes of the T-786C polymorphism of the endothelial nitric oxide synthase (eNOS) gene but not in TT homozygotes (Figure 4F). In all three cases, the associated line graphs show a greater difference between genotypes at the higher pre-treatment than lower post-treatment average sP-selectin concentrations. From a precision medicine perspective, the original reports concluded that CC homozygote of the T-786C polymorphism and carriers of the LDLR mutations might identify patients most likely to benefit from atorvastatin-induced sP-selectin reduction. Alternatively, from the perspective of quantile-dependent expressivity, these genetic markers may simply track the reduction in the genetic effect size associated with lower sP-selectin concentrations.
Quantile-dependent expressivity would not explain the significant rs6136 by smoking interactions reported by Carter et al47 and Barbaux et al48 due to a larger genotype difference at the lower average P-selectin concentrations of the nonsmokers.
Intercellular Adhesion Molecule-1
ICAM-1 (aka CD54) is an intercellular adhesion molecule belonging to the immunoglobulin gene superfamily that facilitates leukocyte endothelial transmigration.80 sICAM-1 heritability was estimated to be 24±10% in the Fels longitudinal study,73 24.0% and 34.1% in the Framingham Study,8,81,82 55% in the Longitudinal Study of Aging of Danish Twins,83 55% in the Emory Twin Studies,76 and 56% in the San Antonio Family Heart Study.84 Barbalic et al reported that sICAM-1 concentrations showed the strongest association with rs3093030 within the ICAM-1 gene (P = 3.5x10⁻²³) and was also significantly related to the aforementioned rs579459 polymorphism located near the ABO blood group gene (P = 1.2x10⁻¹⁵).79
The study by Bolewski et al58 showed that statin treatment decreased sICAM-1 by 21% for those with LDLR mutations and by 7% for those without mutations (Figure 5A, Pinteraction<0.01). Alternatively, the line graph shows a greater difference between genotypes at the higher average pre-treatment sICAM-1 concentrations vis-à-vis the smaller genotype differences after their average concentrations had decreased following treatment.
Brain abscess, the result of parenchymal infection by pyogenic bacteria, can cause focal neurological deficits, loss of mental acuity, and seizures. Mishra et al60 reported that average serum sICAM-1 concentrations were 30-fold higher in patients with brain abscesses compared to matched healthy controls (P < 0.001). The histogram of Figure 5B shows that the patient-control differences were substantially greater in ICAM-1 rs5498 EE-homozygotes vis-à-vis carriers of the K-allele. Consistent with quantile-dependent expressivity, the associated line graph shows that the cross-sectional genotype difference between EE-homozygotes and K-allele carriers was much greater at the higher concentrations of the affected patients.
Three studies lack genotype-specific information in healthy controls, which is needed to assess their consistency with quantile-dependent expressivity. Japanese encephalitis is a fatal condition in approximately one third of cases and produces permanent neurological sequelae in about one-half of survivors due to virus-induced tissue damage and host-induced immune response.85 Baluni et al86 reported that patients infected with Japanese encephalitis virus had significantly higher ICAM-1 concentrations than healthy controls (P = 0.002), and significantly higher ICAM-1 concentrations in EE homozygotes than EK heterozygotes (P = 0.01) or KK homozygotes (P = 0.007) of the ICAM-1 K469E polymorphism but did not describe the genotype-specific effects in the healthy controls.
Pseudoxanthoma elasticum (PXE), an autosomal-recessive disorder caused by mutations in the ATP binding cassette transporter gene (ABCC6), is characterized by calcification and fragmentation of elastic fibers, proteoglycan accumulation in the extracellular matrix, skin lesions, and loss of visual acuity.87 Hendig et al reported that in addition to having significantly higher serum ICAM-1 concentrations than healthy controls (303 vs 241 mg/L, P < 0.02),49 PXE patients with two nonsense ABCC6 mutations or one nonsense mutation plus one missense mutation had significantly higher ICAM-1 concentrations than those lacking these mutations (314±16 vs 259±17 ng/mL, P < 0.03), but did not provide genotype-specific ICAM-1 concentrations in controls.
A third study by He et al50 reported significantly higher mean ICAM-1 serum concentrations in migraine patients than controls (4372±78 vs 679±21, P < 0.01). They also reported that patients with the E-allele had higher ICAM-1 concentrations than K-allele carriers of the ICAM1 K469E polymorphism (5493±137 vs 3971±80, P < 0.01) but did not provide the genotype-specific ICAM-1 concentrations in controls (which may reflect their nonsignificant differences).
Lipoprotein-Associated Phospholipase A2
Abnormal plasma Lp-PLA2 (aka platelet-activating factor acetylhydrolase, PAF-AH) mass, activity, or its distribution across lipoproteins is associated with inflammatory diseases, such as hypertension, cerebral ischemia, cardiac infarction,88 sepsis, asthma, polycystic ovary syndrome (PCOS), and gestational diabetes mellitus. The enzyme, encoded by the PLA2G7 gene, is secreted primarily by macrophages, and circulates bound to low-density lipoproteins, high-density lipoproteins, and Lp(a).88 Reported Lp-PLA2 heritability by others range from 25% to 37% for its mass concentration and from 37% to 62% for enzymatic activity.9,89–91 However, Lp-PLA2 mass and activity measurements do not correlate strongly (ρ=0.24,92 r = 0.5193) presumably due to variation in catalytic activity in addition to enzyme availability affecting the latter. In particular, loss of catalytic activity has been reported for the missense mutation V279F and A379V polymorphisms.88 The analyses of the Framingham data sets showed that the heritabilities of Lp-PLA2 mass concentration and Lp-PLA2 activity differed with respect to both strength (15–30% vs 42–48%, Table 2) and quantile-dependence (Plinear=0.0004 vs Plinear=0.44, Table 3).
Zhang et al51 reported significantly higher Lp-PLA2 serum mass concentrations in patients sampled within 24 hours of hospital admission for a myocardial infarction (MI) compared to age- and sex-matched controls (375.7±3.7 vs 112.5±1.7 ng/mL, P < 0.001). When these differences were examined with respect to the PLA2G7 D166E polymorphism, Figure 5C shows that the case-control difference is greatest for GG, intermediate for CG and least for CC genotypes. The line graph shows that this corresponds to a significant difference between genotypes at the higher mean concentrations of the MI patients (P < 0.001) but not at the lower concentrations of the control group (P = 0.23).
Tuten et al61 reported significantly higher Lp-PLA2 mass concentrations in women experiencing preeclampsia than controls (P < 0.01). As shown in Figure 5D, the net effect of preeclampsia on Lp-PLA2 mass concentrations was greater in G-allele carriers of the LPA rs9355296 polymorphism. They also reported significant differences in Lp-PLA2 mass concentrations between rs9355296 G-allele carriers compared with AA homozygotes in women with preeclampsia (<0.01) but not their healthy counterparts.
Osteoprotegerin
Osteoprotegerin is synthesized primarily by osteoblasts and participates in the regulation of osteoblasts/osteoclasts balance and bone formation/absorption.94 Specifically, osteoprotegerin competitively binds to the receptor activator for nuclear factor-κB ligand (RANKL) so as to modulate bone re-absorption, decrease osteoclasts number, and regulate bone homeostasis via osteoblast-osteoclast cross-talk.95 Thus, factors affecting osteoprotegerin gene regulation influence bone mass and risks for fractures, osteoporosis and osteoarthritis.96 The osteoprotegerin gene (TNFRSF11B) is located on chromosome 8q23-24 and includes several polymorphisms affecting serum osteoprotegerin concentrations, including rs3134069 (245T/G) in the promoter region, rs2073617 (950T/C) in the 5' untranslated region, and rs2073618 (1181G/C) in exon 1.52
Osteoprotegerin plays an important role in the pathology of intervertebral disc degeneration (IDD, aka degenerative disc disease), a debilitating condition characterized by lower back pain, intervertebral disc herniation and spinal canal stenosis.97 Xue et al reported significantly higher osteoprotegerin serum concentrations in IDD patients than matched controls (7.62±0.17 vs 6.39±0.16 ng/mL).52 Figure 5E shows a greater osteoprotegerin difference between patients and controls in carriers of the C-allele than TT homozygotes of the OPG rs2073617 polymorphism (1.47±0.35 vs 0.89±0.30 ng/mL). Consistent with quantile-dependent expressivity, the line graph shows a greater difference between genotypes at the higher mean osteoprotegerin concentration of the patients (OsteoprotegerinC+ - Osteoprotegerin TT: 0.65±0.33 ng/mL) than at the lower mean concentration of the controls (0.07±0.32 ng/mL).
Elevated osteoprotegerin concentrations have also been associated with acute myocardial infarction, unstable angina, peripheral artery disease and heart failure severity, symptomatic carotid stenosis, and vulnerable carotid plaques.53 Straface et al53 reported that carotid artery stenosis patients who underwent carotid endarterectomy had significantly higher osteoprotegerin than age and sex-matched controls (4.02 vs 2.94 ng/mL, P < 0.01), and those with unstable plaque had higher concentrations than the carotid artery stenosis patients with stable plaque (5.86 vs 3.53 ng/mL, P < 0.01). Figure 5F shows that the net osteoprotegerin difference associated with carotid artery stenosis and plaque instability was greater in the rs2073617 CC homozygotes than in the T-allele carriers. Correspondingly, the osteoprotegerin difference between rs2073617 genotypes was greater at the higher concentrations of the carotid stenosis patients with unstable plaque.
Osteoprotegerin is also linked to insulin resistance.98 Nanda et al99 reported that osteoprotegerin concentrations were significantly higher in women with gestational diabetes mellitus vs nondiabetic pregnancies (55.9 vs 45.6 pg/mL, P = 0.02) and significantly higher in CT heterozygotes than TT homozygotes of the rs2073617 polymorphism in those with gestational diabetes (P < 0.05). The authors did not report the osteoprotegerin differences between genotypes in women with normal pregnancies.
Tumor Necrosis Factor Receptor Type 2
Tumor necrosis factor receptor type 2 (TNFR2, aka p75 and TNFRSF1B) is one of the two distinct cell surface receptors that mediate the biological effects of TNFα.100,101 The receptor is encoded by the TNFRSF1B (aka TNFRII) gene located on the short arm of chromosome 1 (1p36).102 Alternative splicing/shedding of membrane-bound TNFR2 produces its soluble form (sTNFR2) whose elevated concentrations during inflammation is thought to reflect upregulation of the membrane-bound TNFR2 receptor.103 Higher circulating sTNFR2 concentrations have been associated with rheumatoid arthritis,57,104 inflammatory bowel disease,105 sarcoidosis,106 primary progressive multiple sclerosis,107 coronary heart disease, endometriosis, and amyotrophic lateral sclerosis.
Ronnemma et al attributed two-thirds,108 and Raggi et al attributed 63% of sTNFR2 variance to additive genetic effects,76 while others estimated the sTNFR2 heritability to be slightly less (34%,8 50%109). The most widely reported TNFR2 genetic variant is the +676T>G polymorphism (rs1061622) that replaces the amino acid methionine (M) with arginine (R) at TNFR2 position 196 (M196R). Data presented by Oregón-Romero et al showed larger differences between MM homozygotes and R-allele carriers in rheumatoid arthritis patients than in healthy controls (255 vs 75 pg/mL) corresponding to the significantly higher average TNFR2 concentrations in the patients (2914 vs 2078 pg/mL, P = 0.0001).62 Differences between the 196M carriers and RR homozygotes in the rheumatoid arthritis patients reported by Glossop et al54 were greater than the difference in the normal volunteers reported by Stark et al (661±264 vs 161±70 pg/mL),55 consistent with the higher average sTNFR2 concentrations of the patients (5132±121 vs 1200±24 pg/mL). Tolusso et al also reported larger M196R genotype differences in rheumatoid arthritis patients than healthy blood donors (1190 vs 560 pg/mL) consistent with the patients’ higher TNFR2 concentrations (5350 vs 3110 pg/mL, P < 0.0001).56 Some of these effects could, in part, be related to TNFR2 quantile-dependent genetic effects.
Limitations
Quantile-dependent expressivity represents an alternative explanation to the more traditional gene–disease or gene–treatment interactions that warrants consideration, but the analyses presented herein do not disprove gene–environment interactions as proposed by the original authors. The use of Falconer’s formula may underestimate the complexity of genetic and nongenetic contributions to biomarkers of inflammation and oxidative stress. Because only a small percentage of the sP-selectin, sICAM-1, Lp-PLA2-mass, osteoprotegerin, and sTNFR2 heritabilities are attributable to specific genotypes, the effects of individual genotypes on their circulating concentrations are not necessarily constrained by the heritability plots of Figures 1–3. The examples of Figures 4 and 5 are admittedly selective. This is because quantile-dependent expressivity is a novel concept, and, therefore, many studies do not provide the information required to evaluate its applicability, namely genotype-specific differences for both healthy and affected subjects. Finally, quantile regression does not depend upon statistical normality, and the analyses presented are for circulating concentrations as originally measured; however, the estimated quantile-specific heritability is not independent of data transformations. With few exceptions,47,48,57 reports of gene–environment interaction are mostly described for the untransformed44,45,59,60 or median values.46,56,86 Supplementary Table 1 suggests that logarithmic transformations mostly alter the shape heritability function rather than eliminate its quantile-dependence.
Conclusion
The analyses of the Framingham Heart Study family sets presented in this paper suggest that genetic influences on circulating sP-selectin, sICAM-1, Lp-PLA2, osteoprotegerin, and TNFR2 concentrations are quantile dependent, and that larger genetic effect size at higher circulating concentrations could potentially explain many of the gene–disease and gene–treatment interactions that have been previously described. These results suggest caution is warranted when assigning clinical significance to gene-specific associations from a precision medicine perspective.
Abbreviations
ABCC6, ATP-binding cassette transporter gene; βFS, full-sib regression slope; βOM, offspring-midparental regression slope; βOP, offspring-parent regression slope; BMI, Body mass index; GWAS, Genome-wide association study; h2, Heritability in the narrow sense; IDD, Intervertebral disc degeneration; IL-6, Interleukin-6; ICAM-1, Intercellular adhesion molecule-1; LDLR, Low-density lipoprotein receptor; Lp-PLA2, Lipoprotein-associated phospholipase A2; MI, Myocardial infarction; NHLBI, National Heart Lung and Blood Institute; PAF-AH, platelet-activating factor acetylhydrolase; PXE, Pseudoxanthoma elasticum; rspouse, spouse correlation; RANKL, Receptor activator for nuclear factor-κB ligand; SD, Standard deviation; SE, Standard error; SELP, Selectin P gene; SNP, Single nucleotide polymorphism; TLR-4, Toll-like receptor-4; TNFα, Tumor necrosis factor-alpha; TNFR2, Tumor necrosis factor receptor 2.
Disclosure
This research was supported by NIH grant R21ES020700 from the National Institute of Environmental Health Sciences, and an unrestricted gift from HOKA ONE ONE. There are no conflicts of interest to disclose.
References
1. Legein B, Temmerman L, Biessen EA, Lutgens E. Inflammation and immune system interactions in atherosclerosis. Cell Mol Life Sci. 2013;70:3847–3869. doi:10.1007/s00018-013-1289-1
2. Dallmeier D, Larson MG, Vasan RS, et al. Metabolic syndrome and inflammatory biomarkers: a community-based cross-sectional study at the Framingham Heart Study. Diabetol Metab Syndr. 2012;4:
3. Liu CK, Lyass A, Larson MG, et al. Biomarkers of oxidative stress are associated with frailty: the Framingham Offspring Study. Age (Dordr). 2016;38:1. doi:10.1007/s11357-015-9864-z
4. Dallmeier D, Larson MG, Wang N, Fontes JD, Benjamin EJ, Fox CS. Addition of inflammatory biomarkers did not improve diabetes prediction in the community: the Framingham heart study. J Am Heart Assoc. 2012;1:e000869. doi:10.1161/JAHA.112.000869
5. Keaney JF
6. Pou KM, Massaro JM, Hoffmann U, et al. Visceral and subcutaneous adipose tissue volumes are cross-sectionally related to markers of inflammation and oxidative stress: the Framingham Heart Study. Circulation. 2007;116:1234–1241. doi:10.1161/CIRCULATIONAHA.107.710509
7. Kaysen GA. The microinflammatory state in uremia: causes and potential consequences. J Am Soc Nephrol. 2001;12(7):1549–1557. doi:10.1681/ASN.V1271549. PMID: 11423586.
8. Schnabel RB, Lunetta KL, Larson MG, et al. The relation of genetic and environmental factors to systemic inflammatory biomarker concentrations. Circ Cardiovasc Genet. 2009;2:229–237. doi:10.1161/CIRCGENETICS.108.804245
9. Schnabel R, Dupuis J, Larson MG, et al. Clinical and genetic factors associated with lipoprotein-associated phospholipase A2 in the Framingham Heart Study. Atherosclerosis. 2009;204:601–607. doi:10.1016/j.atherosclerosis.2008.10.030
10. Ho JE, Chen WY, Chen MH, et al. Common genetic variation at the IL1RL1 locus regulates IL-33/ST2 signaling. J Clin Invest. 2013;123:4208–4218. doi:10.1172/JCI67119
11. Falconer DS, Mackay TFC. Introduction to Quantitative Genetics.
12. Williams PT. Quantile-specific penetrance of genes affecting lipoproteins, adiposity and height. PLoS One. 2012;7:e28764. doi:10.1371/journal.pone.0028764
13. Williams PT. Quantile-specific heritability of total cholesterol and its pharmacogenetic and nutrigenetic implications. Int J Cardiol. 2020;327:185–192. doi:10.1016/j.ijcard.2020.11.070
14. Williams PT. Quantile-specific heritability of high-density lipoproteins with implications for precision medicine. J Clin Lipid. 2020;14(448–458.e0):448–458.e0. doi:10.1016/j.jacl.2020.05.099
15. Williams PT. Quantile-dependent expressivity and gene-lifestyle interactions involving high-density lipoprotein cholesterol. Lifestyle Genom. 2021;14:1–19. doi:10.1159/000511421
16. Williams PT. Gene-environment interactions due to quantile-specific heritability of triglyceride and VLDL concentrations. Sci Rep. 2020;10:4486. doi:10.1038/s41598-020-60965-9
17. Williams PT. Quantile-specific heritability of sibling leptin concentrations and its implications for gene-environment interactions. Sci Rep. 2020;10:22152. doi:10.1038/s41598-020-79116-1
18. Williams PT. Quantile-dependent heritability of glucose, insulin, proinsulin, insulin resistance, and glycated hemoglobin. Lifestyle Genomics. 2021;5:1–26.
19. Williams PT. Quantile-dependent expressivity of serum uric acid concentrations. Int J Genomics. 2021;2021:3889278. doi:10.1155/2021/3889278
20. Williams PT. Quantile-dependent expressivity of plasma adiponectin concentrations may explain its sex-specific heritability, gene-environment interactions, and genotype-specific response to postprandial lipemia. PeerJ. 2020;8:e10099. doi:10.7717/peerj.10099
21. Williams PT. Quantile-specific heritability may account for gene-environment interactions involving coffee consumption. Behav Genet. 2020;50:119–126. doi:10.1007/s10519-019-09989-0
22. Williams PT. Quantile-specific heritability of intakes of alcohol but not other macronutrients. Behav Genet. 2020;50:332–345. doi:10.1007/s10519-020-10005-z
23. Williams PT. Quantile-dependent heritability of computed tomography, dual-energy x-ray absorptiometry, anthropometric, and bioelectrical measures of adiposity. Int J Obesity. 2020;44:2101–2112. doi:10.1038/s41366-020-0636-1
24. Williams PT. Quantile-dependent expressivity of postprandial lipemia. PLoS One. 2020;15(2):e0229495. doi:10.1371/journal.pone.0229495
25. Williams PT. Quantile-dependent expressivity of serum C-reactive protein concentrations in family sets. PeerJ. 2021;9:e10914. doi:10.7717/peerj.10914
26. Pepys MB, Hirschfield GM. C-reactive protein: a critical update. J Clin Invest. 2003;111(12):1805–1812. doi:10.1172/JCI200318921
27. Williams PT. Quantile-dependent expressivity of serum interleukin-6 concentrations as a possible explanation of gene-disease interactions, gene-environment interactions, and pharmacogenetic effects. Inflammation. 2020;14:1–19.
28. Ishihara K, Hirano T. IL-6 in autoimmune disease and chronic inflammatory proliferative disease. Cytokine Growth Factor Rev. 2002;13:357–368. doi:10.1016/S1359-6101(02)00027-8
29. Kannel WB, Feinleib M, McNamara PM, Garrison RJ, Castelli WP. An investigation of coronary heart disease in families. The Framingham offspring study. Am J Epidemiol. 2006;110:281–290. doi:10.1093/oxfordjournals.aje.a112813
30. Splansky GL, Corey D, Yang Q, et al. The Third Generation Cohort of the National Heart, Lung, and Blood Institute’s Framingham Heart Study: design, recruitment, and initial examination. Am J Epidemiol. 2007;165:1328–1335. doi:10.1093/aje/kwm021
31. Feghali CA, Wright TM. Cytokines in acute and chronic inflammation. Front Biosci. 1997;2:d12–d26. doi:10.2741/A171
32. MacEwan DJ. TNF receptor subtype signalling: differences and cellular consequences. Cell Signal. 2002;14:477–492. doi:10.1016/s0898-6568(01)00262-5
33. Yellin MJ, Brett J, Baum D, et al. Functional interactions of T cells with endothelial cells: the role of CD40L-CD40-mediated signals. J Exp Med. 1995;182:1857–1864. doi:10.1084/jem.182.6.1857
34. Mangan SH, van Campenhout A, Rush C, et al. Osteoprotegerin upregulates endothelial cell adhesion molecule response to tumor necrosis factor-alpha associated with induction of angiopoietin-2. Cardiovasc Res. 2007;76:494–505. doi:10.1016/j.cardiores.2007.07.017
35. Gabay C, Kushner I. Acute-phase proteins and other systemic responses to inflammation. N Engl J Med. 1999;340:448–454. doi:10.1056/NEJM199902113400607
36. Schnabel R, Larson MG, Dupuis J, et al. Relations of inflammatory biomarkers and common genetic variants with arterial stiffness and wave reflection. Hypertension. 2008;51:1651–1657. doi:10.1161/HYPERTENSIONAHA.107.105668
37. Roberts LJ, Morrow JD. The generation and actions of isoprostanes. Biochim Biophys Acta. 1997;1345:121–135. doi:10.1016/S0005-2760(96)00162-2
38. Coglianese EE, Larson MG, Vasan RS, et al. Distribution and clinical correlates of the interleukin receptor family member soluble ST2 in the Framingham Heart Study. Clin Chem. 2012;58:1673–1681. doi:10.1373/clinchem.2012.192153
39. Fontes J, Pryde M, Ingram C, Sutherland P, Larson M, Benjamin E. Framingham Heart Study inflammatory markers manual Offspring exam 8 and Omni 1 (3);2011 Available from: www.framinghamheartstudy.org/share/vascularprotocols.html.
40. Karlin S, Cameron EC, Williams PT. Sibling and parent-offspring correlation estimation with variable family size. Proc Natl Acad Sci USA. 1981;78:2664–2668. doi:10.1073/pnas.78.5.2664
41. Koenker R, Hallock KF. Quantile regression. J Econ Perspectives. 2001;15:143–156. doi:10.1257/jep.15.4.143
42. Gould WW. Quantile regression with bootstrapped standard errors. Stata Technical Bull. 1992;9:19–21.
43. Winer BJ, Brown DR, Michels KM. Statistical Principles in Experimental Design.
44. Li XF, Song CH, Sheng HZ, Zhen DD, Pan M, Zhu JH. P-selectin gene polymorphism associates with pulmonary hypertension in congenital heart disease. Int J Clin Exp Pathol. 2015;8:7189–7195. PMID: 26261613; PMCID:.
45. Kaur R, Singh J, Kapoor R, Kaur M. Association of SELP polymorphisms with soluble P-selectin levels and vascular risk in patients with Type 2 diabetes mellitus: a case-control study. Biochem Genet. 2019;57:73–97. doi:10.1007/s10528-018-9881-6
46. Di Nisio M, Di Febbo C, Moretta V, et al. Effects of toll-like receptor-4 gene polymorphisms on soluble P-selectin and von Willebrand factor levels in hypercholesterolemic patients. Thromb Haemost. 2007;98:642–646. doi:10.1160/TH07-02-0099
47. Carter AM, Anagnostopoulou K, Mansfield MW, Grant PJ. Soluble P-selectin levels, P-selectin polymorphisms and cardiovascular disease. J Thromb Haemost. 2003;1:1718–1723. doi:10.1046/j.1538-7836.2003.00312.x
48. Barbaux SC, Blankenberg S, Rupprecht HJ, et al. Association between P-selectin gene polymorphisms and soluble P-selectin levels and their relation to coronary artery disease. Arterioscler Thromb Vasc Biol. 2001;21:1668–1673. doi:10.1161/hq1001.097022
49. Hendig D, Adam A, Zarbock R, Szliska C, Kleesiek K, Götting C. Elevated serum levels of intercellular adhesion molecule ICAM-1 in Pseudoxanthoma elasticum. Clin Chim Acta. 2008;394(1–2):54–58. doi:10.1016/j.cca.2008.04.002
50. He Q, Lin X, Wang F, et al. Associations of a polymorphism in the intercellular adhesion molecule-1 (ICAM1) gene and ICAM1 serum levels with migraine in a Chinese Han population. J Neurol Sci. 2014;345(1–2):148–153. doi:10.1016/j.jns.2014.07.030
51. Zhang MM, Zhang CG, Yang CJ, Zhao P, Li YL. The association between the D166E polymorphism of the lipoprotein associated phospholipase A2 and risk of myocardial infarction. Eur Rev Med Pharmacol Sci. 2019;23:3960–3966. doi:10.26355/eurrev_201905_17825
52. Xue JB, Zhan XL, Wang WJ, Yan YG, Liu C. OPG rs2073617 polymorphism is associated with upregulated OPG protein expression and an increased risk of intervertebral disc degeneration. Exp Ther Med. 2016;12:702–710. doi:10.3892/etm.2016.3342
53. Straface G, Biscetti F, Pitocco D, et al. Assessment of the genetic effects of polymorphisms in the osteoprotegerin gene, TNFRSF11B, on serum osteoprotegerin levels and carotid plaque vulnerability. Stroke. 2011;42:3022–3028. doi:10.1161/STROKEAHA.111.619288
54. Glossop JR, Dawes PT, Nixon NB, Mattey DL. Polymorphism in the tumour necrosis factor receptor II gene is associated with circulating levels of soluble tumour necrosis factor receptors in rheumatoid arthritis. Arthritis Res Ther. 2005;7:R1227–34. doi:10.1186/ar1816
55. Stark GL, Dickinson AM, Jackson GH, Taylor PR, Proctor SJ, Middleton PG. Tumour necrosis factor receptor type II 196M/R genotype correlates with circulating soluble receptor levels in normal subjects and with graft-versus-host disease after sibling allogeneic bone marrow transplantation. Transplantation. 2003;76:1742–1749. doi:10.1097/01.TP.0000092496.05951.D5
56. Tolusso B, Sacco S, Gremese E, La Torre G, Tomietto P, Ferraccioli GF. Relationship between the tumor necrosis factor receptor II (TNF-RII) gene polymorphism and sTNF-RII plasma levels in healthy controls and in rheumatoid arthritis. Hum Immunol. 2004;65:1420–1426. doi:10.1016/j.humimm.2004.06.010
57. Ay C, Jungbauer LV, Sailer T, et al. High concentrations of soluble P-selectin are associated with risk of venous thromboembolism and the P-selectin Thr715 variant. Clin Chem. 2007;53:1235–1243. doi:10.1373/clinchem.2006.085068
58. Bolewski A, Lipiecki J, Plewa R, Burchardt P, Siminiak T. The effect of atorvastatin treatment on lipid profile and adhesion molecule levels in hypercholesterolemic patients: relation to low-density lipoprotein receptor gene polymorphism. Cardiology. 2008;111:140–146. doi:10.1159/000119702
59. Souza-Costa DC, Sandrim VC, Lopes LF, Gerlach RF, Rego EM, Tanus-Santos JE. Anti-inflammatory effects of atorvastatin: modulation by the T-786C polymorphism in the endothelial nitric oxide synthase gene. Atherosclerosis. 2007;193(2):438–444. doi:10.1016/j.atherosclerosis.2006.07.020
60. Mishra P, Prasad KN, Singh K, Sahu RN, Ojha BK. Association of ICAM-1 (K469E) and MCP-1-2518 A>G gene polymorphism with brain abscess. J Neuroimmunol. 2016;292:102–107. doi:10.1016/j.jneuroim.2016.01.021
61. Tuten A, Gungor Z, Ekmekci H, et al. Relationship between LPA SNPs and inflammatory burden in patients with preeclampsia to address future cardiovascular risk. J Matern Fetal Neonatal Med. 2021;34:898–906. doi:10.1080/14767058.2019.1622667
62. Oregón-Romero E, Vázquez-Del Mercado M, Navarro-Hernández RE, et al. Tumor necrosis factor receptor 2 M196R polymorphism in rheumatoid arthritis and osteoarthritis: relationship with sTNFR2 levels and clinical features. Rheumatol Int. 2006;27:53–59. doi:10.1007/s00296-006-0159-7
63. Williams PT. Quantile-specific heritability of plasminogen activator inhibitor type-1 (PAI-1, aka SERPINE1) and other hemostatic factors. J Thromb Haemost. 2021;19:2559–2571. doi:10.1111/jth.15468
64. William PT. Quantile-specific heritability of monocyte chemoattractant protein-1 and relevance to rs1024611-disease interactions. Cytokine. 2021;149:155722. doi:10.1016/j.cyto.2021.155722
65. Ley K, Laudanna C, Cybulsky MI, Nourshargh S. Getting to the site of inflammation: the leukocyte adhesion cascade updated. Nat Rev Immunol. 2007;7:678–689. doi:10.1038/nri2156. PMID: 17717539.
66. Ishiwata N, Takio K, Katayama M, et al. Alternatively spliced isoform of P-selectin is present in vivo as a soluble molecule. J Biol Chem. 1994;269:23708–23715. doi:10.1016/S0021-9258(17)31573-9
67. Polgar J, Matuskova J, Wagner DD. The P-selectin, tissue factor, coagulation triad. J Thromb Haemost. 2005;3:1590–1596. doi:10.1111/j.1538-7836.2005.01373.x
68. Jilma B, Fasching P, Ruthner C, et al. Elevated circulating P-selectin in insulin dependent diabetes mellitus. Thromb Haemost. 1996;76:328–332. doi:10.1055/s-0038-1650578
69. Ridker P, Buring J, Soluble RN. P-selectin and the risk of future cardiovascular events. Circulation. 2001;103:491–495. doi:10.1161/01.CIR.103.4.491
70. Blann AD, Nadar SK, Lip GY. The adhesion molecule P-selectin and cardiovascular disease. Eur Heart J. 2003;24:2166–2179. doi:10.1016/j.ehj.2003.08.021
71. Zhu D, Xu Z, Liu T, Soluble LY. -selectin levels in patients with obstructive sleep apnea: a systematic review and meta-analysis. Eur Arch Otorhinolaryngol. 2021;278(12):4633–4644. doi:10.1007/s00405-021-06831-4 PMID: 33950356.
72. De Pergola G, Pannacciulli N, Coviello M, et al. sP-selectin plasma levels in obesity: association with insulin resistance and related metabolic and prothrombotic factors. Nutr Metab Cardiovasc Dis. 2008;18:227–232. doi:10.1016/j.numecd.2006.09.010
73. Lee M, Czerwinski SA, Choh AC, et al. Quantitative genetic analysis of cellular adhesion molecules: the Fels Longitudinal Study. Atherosclerosis. 2006;185:150–158. doi:10.1016/j.atherosclerosis.2005.05.027
74. Lee DS, Larson MG, Lunetta KL, et al. Clinical and genetic correlates of soluble P-selectin in the community. J Thromb Haemost. 2008; (1):20–31. PMID: 17944986. doi:10.1111/j.1538-7836.2007.02805.x
75. Hixson JE, Blangero J. Genomic searches for genes that influence atherosclerosis and its risk factors. Ann N Y Acad Sci. 2000;902:1–7. doi:10.1111/j.1749-6632.2000.tb06295.x
76. Raggi P, Su S, Karohl C, Veledar E, Rojas-Campos E, Vaccarino V. Heritability of renal function and inflammatory markers in adult male twins. Am J Nephrol. 2010;32:317–323. doi:10.1159/000319449
77. Herrmann SM, Ricard S, Nicaud V, et al. The P-selectin gene is highly polymorphic: reduced frequency of the Pro715 allele carriers in patients with myocardial infarction. Hum Mol Genet. 1998;7:1277–1284. doi:10.1093/hmg/7.8.1277
78. Kee F, Morrison C, Evans AE, et al. Polymorphisms of the P-selectin gene and risk of myocardial infarction in men and women in the ECTIM extension study: etude cas-temoin de l’infarctus myocarde. Heart. 2000;84:548–552. doi:10.1136/heart.84.5.548
79. Barbalic M, Dupuis J, Dehghan A, et al. Large-scale genomic studies reveal central role of ABO in sP-selectin and sICAM-1 levels. Hum Mol Genet. 2010;19:1863–1872. doi:10.1093/hmg/ddq061
80. Hopkins AM, Baird AW, Nusrat A. ICAM-1: targeted docking for exogenous as well as endogenous ligands. Adv Drug Deliv Rev. 2004;56(6):763–778. doi:10.1016/j.addr.2003.10.043
81. Dupuis J, Larson MG, Vasan RS, et al. Genome scan of systemic biomarkers of vascular inflammation in the Framingham Heart Study: evidence for susceptibility loci on 1q. Atherosclerosis. 2005;182:307–314. doi:10.1016/j.atherosclerosis.2005.02.015
82. Keaney JF
83. de Maat MP, Bladbjerg EM, Hjelmborg JB, et al. Genetic influence on inflammation variables in the elderly. Arterioscler Thromb Vasc Biol. 2004;24:2168–2173. doi:10.1161/01.ATV.0000143856.01669.e7
84. Kent JW
85. Bandyopadhyay B, Bhattacharyya I, Adhikary S, et al. Incidence of Japanese encephalitis among acute encephalitis syndrome cases in West Bengal, India. Biomed Res Int. 2013;2013:896749. doi:10.1155/2013/896749
86. Baluni M, Fatima T, Zia A, Himanshu Reddy D, Dhole TN. Association of ICAM-1 (K469E) and MCP-1-2518 A > G polymorphism with risk of Japanese encephalitis in North Indian population. Cytokine. 2018;111:420–427. doi:10.1016/j.cyto.2018.05.021
87. Neldner K, Struk B. Pseudoxanthoma elasticum. In: Royce PM, Steinmann B, editors. Connective Tissue and Its Heritable Disorders. New York: Wiley-Liss Inc.; 2002:561–583.
88. Huang F, Wang K, Shen J. Lipoprotein-associated phospholipase A2: the story continues. Med Res Rev. 2020;40:79–134. doi:10.1002/med.21597
89. Guerra R, Zhao B, Mooser V, Stafforini D, Johnston JM, Cohen JC. Determinants of plasma platelet-activating factor acetylhydrolase: heritability and relationship to plasma lipoproteins. J Lipid Res. 1997;38:2281–2288. doi:10.1016/S0022-2275(20)34942-7
90. Lenzini L, Antezza K, Caroccia B, et al. A twin study of heritability of plasma lipoprotein-associated phospholipase A2 (Lp-PLA2) mass and activity. Atherosclerosis. 2009;205:181–185. doi:10.1016/j.atherosclerosis.2008.08.045
91. Rahman I, Atout R, Pedersen NL, et al. Genetic and environmental regulation of inflammatory CVD biomarkers Lp-PLA2 and IgM anti-PC. Atherosclerosis. 2011;218(1):117–122. doi:10.1016/j.atherosclerosis.2011.04.038. PMID: 21616491.
92. Chu AY, Guilianini F, Grallert H, et al. Genome-wide association study evaluating lipoprotein-associated phospholipase A2 mass and activity at baseline and after rosuvastatin therapy. Circ Cardiovasc Genet. 2012;5:676–685. doi:10.1161/CIRCGENETICS.112.963314
93. Thompson A, Gao P; Lp-PLA(2) Studies Collaboration, et al. Lipoprotein-associated phospholipase A(2) and risk of coronary disease, stroke, and mortality: collaborative analysis of 32 prospective studies. Lancet. 2010;375(9725):1536–1544. doi:10.1016/S0140-6736(10)60319-4.
94. Vega D, Maalouf NM, Sakhaee K. The role of receptor activator of nuclear factor-kappaB (RANK)/RANK ligand/osteoprotegerin: clinical implications. J Clin Endocrinol Metab. 2007;92:4514–4521. doi:10.1210/jc.2007-0646
95. Trouvin AP, Goeb V. Receptor activator of nuclear factor-κB ligand and osteoprotegerin: maintaining the balance to prevent bone loss. Clin Interv Aging. 2010;5:345–354. doi:10.2147/CIA.S10153
96. Silva I, Branco JC. Rank/Rankl/opg: literature review. Acta Reumatol. 2011;Port 36:209–218.
97. Hangai M, Kaneoka K, Kuno S, Hinotsu S, Sakane M, Mamizuka N. Sakai S Ochiai N: factors associated with lumbar intervertebral disc degeneration in the elderly. Spine J. 2008;8:732–740. doi:10.1016/j.spinee.2007.07.392
98. Secchiero P, Corallini F, Pandolfi A, et al. An increased osteoprotegerin serum release characterizes the early onset of diabetes mellitus and may contribute to endothelial cell dysfunction. Am J Pathol. 2006;169:2236–2244. doi:10.2353/ajpath.2006.060398
99. Nanda MR, Sagili H, Rani JM, ANaga S. Association of osteoprotegerin gene T950C polymorphism with cardiometabolic risk factors in gestational diabetes mellitus in South Indian Tamilian women. Diabetes Metab Syndr. 2021;15:102157. doi:10.1016/j.dsx.2021.05.030
100. Hohmann HP, Remy R, Brockhaus M, van Loon AP. Two different cell types have different major receptors for human tumor necrosis factor (TNF alpha). J Biol Chem. 1989;264:14927–14934. doi:10.1016/S0021-9258(18)63791-3
101. Brockhaus M, Schoenfeld H, Schlaeger E, Hunziker W, Lesslauer W, Loetscher H. Identification of two types of tumor necrosis factor receptors on human cell lines by monoclonal antibodies. Proc Natl Acad Sci USA. 1990;87:3127–3131. doi:10.1073/pnas.87.8.3127
102. Beltinger CP, White PS, Maris JM, et al. Physical mapping and genomic structure of the human TNFR2 gene. Genomics. 1996;35:94–100. doi:10.1006/geno.1996.0327
103. Mohler KM, Torrance DS, Smith CA, et al. Soluble tumor necrosis factor (TNF) receptors are effective therapeutic agents in lethal endotoxemia and function simultaneously as both TNF carriers and TNF antagonists. J Immunol. 1993;151:1548–1561.
104. Barrera P, Boerbooms AM, Janssen EM, et al. van der Meer JW. Circulating soluble tumor necrosis factor receptors, interleukin-2 receptors, tumor necrosis factor alpha, and interleukin-6 levels in rheumatoid arthritis longitudinal evaluation during methotrexate and azathioprine therapy. Arthritis Rheum. 1993;36:1070–1079. doi:10.1002/art.1780360807
105. Spoettl T, Hausmann M, Klebl F, et al. Serum soluble TNF receptor I and II levels correlate with disease activity in IBD patients. Inflamm Bowel Dis. 2007;13:727–732. doi:10.1002/ibd.20107
106. Nakayama T, Hashimoto S, Amemiya E, Horie T. Elevation of plasma-soluble tumour necrosis factor receptors (TNF-R) in sarcoidosis. Clin Exp Immunol. 1996;104:318–324. doi:10.1046/j.1365-2249.1996.13702.x
107. Fissolo N, Cantó E, Vidal-Jordana A, Castilló J, Montalban X, Comabella M. Levels of soluble TNF-RII are increased in serum of patients with primary progressive multiple sclerosis. J Neuroimmunol. 2014;271(1–2):56–59. doi:10.1016/j.jneuroim.2014.04.001
108. Rönnemaa T, Pulkki K, Kaprio J. Serum soluble tumor necrosis factor-alpha receptor 2 is elevated in obesity but is not related to insulin sensitivity: a study in identical twins discordant for obesity. J Clin Endocrinol Metab. 2000;85:2728–2732. doi:10.1210/jcem.85.8.6720
109. Vistoropsky Y, Ermakov S, Toliat MR, et al. Genetic determinants of circulating levels of tumor necrosis factor receptor II and their association with TNF-RII gene polymorphisms. Cytokine. 2010;51:28–34. doi:10.1016/j.cyto.2010.04.013
 © 2022 The Author(s). This work is published and licensed by Dove Medical Press Limited. The
full terms of this license are available at https://www.dovepress.com/terms
and incorporate the Creative Commons Attribution
- Non Commercial (unported, 3.0) License.
By accessing the work you hereby accept the Terms. Non-commercial uses of the work are permitted
without any further permission from Dove Medical Press Limited, provided the work is properly
attributed. For permission for commercial use of this work, please see paragraphs 4.2 and 5 of our Terms.
© 2022 The Author(s). This work is published and licensed by Dove Medical Press Limited. The
full terms of this license are available at https://www.dovepress.com/terms
and incorporate the Creative Commons Attribution
- Non Commercial (unported, 3.0) License.
By accessing the work you hereby accept the Terms. Non-commercial uses of the work are permitted
without any further permission from Dove Medical Press Limited, provided the work is properly
attributed. For permission for commercial use of this work, please see paragraphs 4.2 and 5 of our Terms.