Back to Journals » Cancer Management and Research » Volume 12
Qualitative Evaluation of Virtual Touch Imaging Quantification: A Simple and Useful Method in the Diagnosis of Breast Lesions
Authors Zhu Y, Jia X, Zhou W, Zhan W, Zhou J
Received 10 December 2019
Accepted for publication 21 February 2020
Published 18 March 2020 Volume 2020:12 Pages 2037—2045
DOI https://doi.org/10.2147/CMAR.S241815
Checked for plagiarism Yes
Review by Single anonymous peer review
Peer reviewer comments 2
Editor who approved publication: Professor Harikrishna Nakshatri
Ying Zhu,* Xiao-hong Jia,* Wei Zhou, Wei-wei Zhan, Jian-qiao Zhou
Department of Ultrasound, Shanghai Ruijin Hospital Affiliated to Medical School of Shanghai Jiaotong University, Shanghai, People’s Republic of China
*These authors contributed equally to this work
Correspondence: Jian-qiao Zhou
Department of Ultrasound, Shanghai Ruijin Hospital Affiliated to Medical School of Shanghai Jiaotong University, 197 Ruijin Er Road, Shanghai 200025, People’s Republic of China
Email [email protected]
Objective: To test the value of qualitative virtual touch imaging quantification (VTIQ) features in differentiating benign from malignant breast lesions.
Methods: From November 2016 to August 2017, 230 lesions were subjected to conventional US and virtual touch imaging quantification before biopsy. The maximum shear wave velocity (SWVmax) was measured using a standardized method. Qualitative VTIQ features, including the “stiff rim” sign and color pattern classification, were assessed according to a binary classification. The sensitivity, specificity and area under the receiver operating curve (AUC) of Breast Imaging Reporting and Data System (BI-RADS), SWVmax, qualitative VTIQ features, and combined data were compared.
Results: Among the 230 breast lesions, 150 were benign and 80 were malignant. Compared to the benign lesions, the malignant ones had higher SWVmax values and were more likely to show the “stiff rim” sign and VTIQ pattern 2 (P < 0.001 for all). The AUC value was 0.885 for the qualitative VTIQ combination (the presence of the “stiff rim” sign and/or the display of VTIQ pattern 2), similar to that for SWVmax (P=0.472). BI-RADS combined with the qualitative VTIQ combination and with SWVmax yielded similar results, including significantly higher AUC values (P = 0.018 and 0.014, respectively), significantly higher specificities (P< 0.001 for both), and nonsignificantly decreased sensitivities (P = 0.249 for both) compared to BI-RADS alone.
Conclusion: The dual-category classification of qualitative VTIQ features according to the presence of the “stiff rim” sign and/or the classification of VTIQ pattern 2 is a simple and useful method that may be representative of quantitative VTIQ parameters in the evaluation of breast masses.
Keywords: breast, ultrasound, elastography
Introduction
Elastography is a promising technique for the differential diagnosis of breast lesions. It can provide additional functional information by evaluating mechanical tissue stiffness, which is a reliable indicator of tissue elasticity.1 Several approaches, including strain elastography and shear wave elastography (SWE), have been investigated. In contrast to strain elastography, SWE does not require manual compression; the quantification is based on an intrinsic tissue property, and thus, it has a high user-independence and reproducibility.2,3 SWE can produce quantitative images of shear wave velocity (SWV). In general, the stiffer the tissue is, the greater the SWV will be.4
Virtual touch IQ (VTIQ) is one form of SWE imaging. VTIQ can reflect the elasticity of tissue accurately by estimating the speed of a shear wave precisely and objectively. Several studies, utilizing different measurement methods for SWV, have demonstrated that VTIQ helps in the characterization of benign and malignant breast masses, with a sensitivity of 89–97% and a specificity of 81–85%.5 However, no clear consensus exists regarding the standard measurement method of the quantitative feature, or the most appropriate cutoff value. VTIQ can also provide qualitative elasticity information for tissue. In clinical practice, by visually assessing features of a color-coded elasticity map, qualitative breast lesion features can be evaluated instantaneously before measuring elasticity quantitatively. Previous studies in which another type of 2D SWV imaging technique, supersonic shear imaging (SSI), was used had demonstrated that the combination of conventional US and qualitative classification had a comparable diagnostic performance to the combination of conventional US and quantitative parameters,6,7 suggesting that qualitative analysis involving SSI might play an important role in clinical application. Unfortunately, it is still unclear whether the results from SSI are applicable to VTIQ because different manufacturers may produce the two types of SWE systems with technical differences in push beam mechanical index, push pulse sequencing, shear wave detection, and transducer frequency.
In the present study, we created a visual qualitative method for breast lesions based on VTIQ. We then addressed the efficacy of qualitative VTIQ features in differentiating benign from malignant breast lesions by comparing with quantitative VTIQ parameters. We propose that this convenient qualitative method is an effective method to assist in breast mass diagnoses.
Materials and Methods
Patients
This prospective study, carried out from November 2016 to August 2017, was approved by the Ethics Committee of Shanghai Ruijin Hospital. Patient and parental written informed consent for those patients under 18 years of age was obtained, and compliance with the Declaration of Helsinki. Two hundred and eighty-five women who had US-visible breast masses and underwent VTIQ examination were recruited. Forty-five patients were later excluded from the study for the following reasons: twenty-two women had undergone neoadjuvant chemotherapy before VTIQ examination; eight women did not have complete quantitative elasticity measurements; six women had undergone biopsy before VTIQ examination; two women did not have final histopathological confirmation; and seven women had breast lesions with at least 25% cystic component. Finally, 230 breast lesions in 230 women (mean age: 44.65 ± 14.60 years; age range 13 to 88 years) comprised the final cohort.
Image Acquisition
Conventional US and VTIQ examinations were performed with an ACUSON S3000 ultrasound scanner system (Siemens Medical Solutions, Mountain View, CA, USA) with an L9-5 linear array probe. All examinations were performed by one licensed radiologist (Y.Z) with 10 years of experience in breast US and 8 months of experience performing SWE of breast lesions.
All patients were scanned in the supine position, with both breasts fully exposed. Conventional images of the target lesions were obtained during the standard ultrasound appointment. During VTIQ examination, all images were obtained with the patients holding their breaths for a few seconds, and the probe was adjusted to minimize compression. The region of interest (ROI) for VTIQ examination was manually adjusted to include the lesion and sufficient surrounding breast tissue. When the VTIQ function was activated, a shear wave velocity map with the default display setting (0.5–6.5 m/s) was automatically displayed in the ROI, where the lowest SWV was coded in dark blue, with increasing SWV coded in light blue, green, orange and red. The map was then switched to Shear Wave Quality mode, in which the image quality was shown as different colors from high quality (green) to intermediate (yellow) and low quality (red). A high-quality SWE image was selected and the maximum SWV (SWVmax) was then measured by a fixed ROI (2×2 mm) in the shear wave velocity map. All data were recorded and stored for further analysis. Typically, the radiologist may spend approximately 5–10 mins on the whole procedure without any inconvenience or additional cost for each patient.
A standardized measurement method for SWVmax was established: (1) for softer lesions that did not display red and thus led to difficulty in finding the stiffest area, the display scale was adjusted downward to a level such that red began to appear; (2) for harder lesions with large red area, the display scale was adjusted upward to a level such that a smallest red area was displayed; (3) the location of the measurement cursor was always slightly adjusted around the red areas of the image according to the SWV value displayed in the data box; (4) the areas displayed as green in the Shear Wave Quality map were selected; (5) the areas with liquid or calcified regions were avoided. All data were recorded and stored for further analysis.
Image Analysis
The VTIQ features were independently evaluated by two blinded readers (Y.J. and J.W.Z), with 6 and 5 years of experience in breast US, respectively. All discrepancies were settled by a third radiologist (J.Q.Z), with more than 15 years of experience in breast US. They attended a 1-day training session prior to the initiation of the study. The training session consisted of a review of fifteen cases of breast masses that were not included in our study.
There were two settings for image interpretation: conventional US images alone and VTIQ images alone. In both settings, the images were presented randomly, and any medical records containing clinical information from the patients or the mammographic images obtained before US were concealed. In the first setting, each target lesion was prospectively classified as category 3, 4a, 4b, 4c, and 5 according to the 2013 Breast Imaging Reporting and Data System lexicons.8 Then in the qualitative analysis of VTIQ images, both the “stiff rim” sign and color pattern classification were evaluated based on shear wave velocity images. The “stiff rim” sign was recorded as present or absent (Figure 1).9 Color patterns in the VTIQ images were categorized into one of two groups by visual evaluation: in VTIQ pattern 1, the lesion appears without red under the default display setting (0.5–6.5 m/s); and in VTIQ pattern 2, the lesion does display red under the default display setting (0.5–6.5 m/s) (Figure 2). In the quantitative analysis of VTIQ, the SWVmax was used (Figure 3).
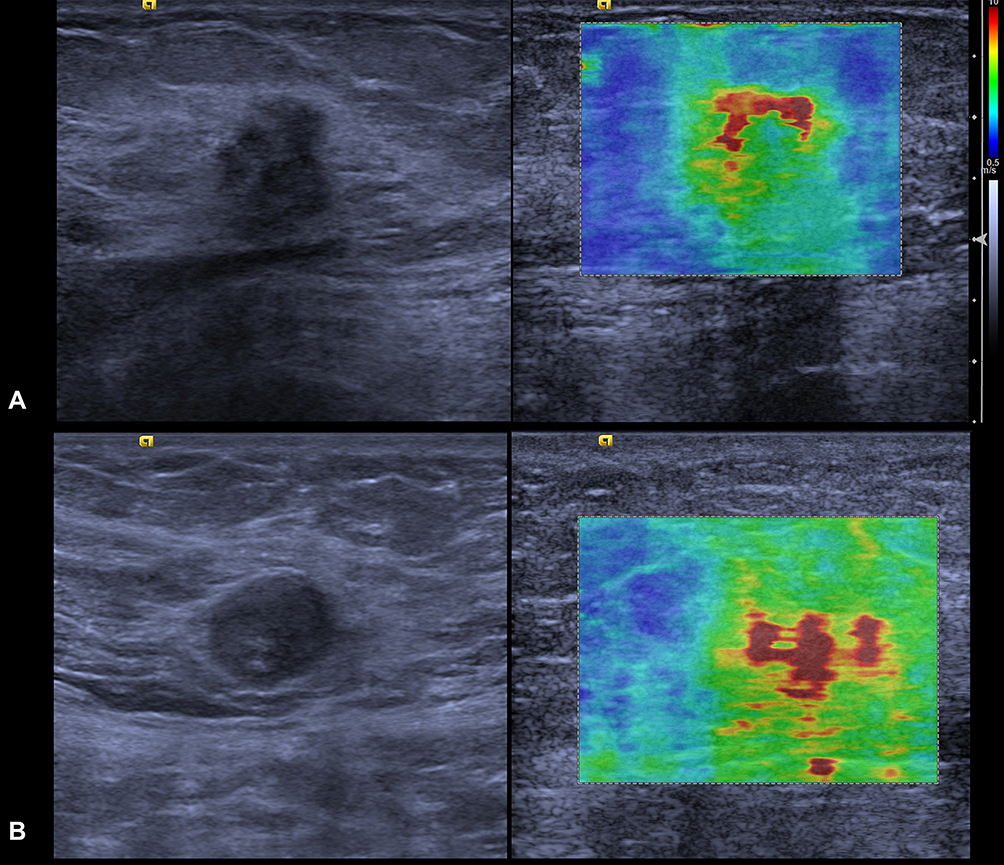 |
Figure 1 (A) the presence of the “stiff rim” sign; (B) the absence of the stiff rim sign. |
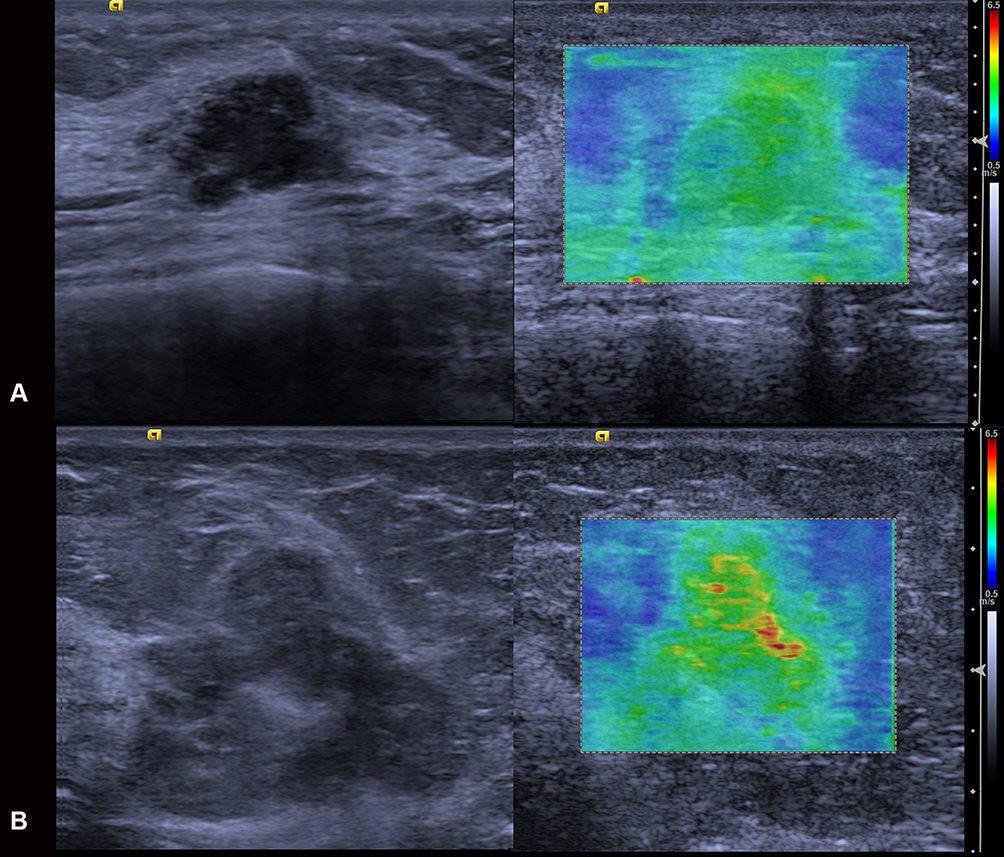 |
Figure 2 (A) VTIQ pattern 1, the lesion is displayed without red under the default display setting (0.5–6.5 m/s); (B) VTIQ pattern 2, the lesion is displayed with red under the default display setting (0.5–6.5 m/s). |
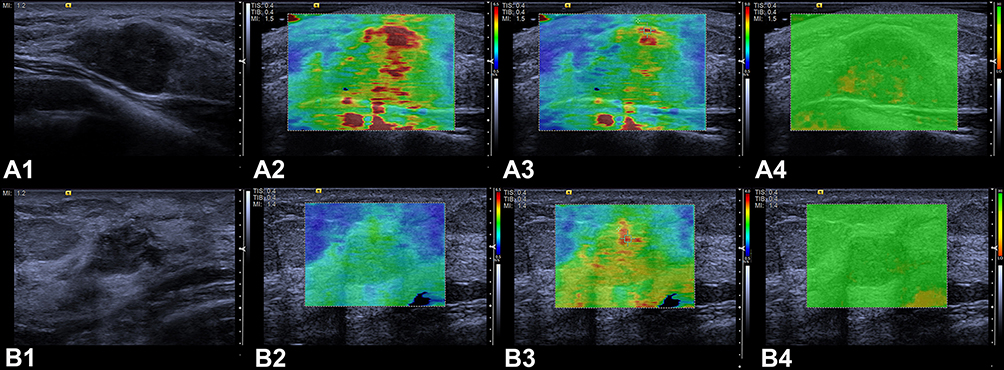 |
Figure 3 Measurement of SWVmax with the guidance of the shear wave quality assessment system. (A) for harder lesions with a large red area under the default display setting (0.5–6.5 m/s), the display scale was adjusted upward to 0.5–9.0m/s such that a smallest red area was displayed; (B) for softer lesions that did not display red color under the default display setting (0.5–6.5 m/s), the display scale was adjusted downward to 0.5–4.0m/s such that red began to appear. |
The current analysis considered lesions classified as BI-RADS III category as most likely benign and those classified as BI-RADS 4a, 4b, 4c and 5 as most likely malignant. For the VTIQ qualitative assessment, the absence of the “stiff rim” sign or classification as VTIQ pattern 2 was considered benign, while the presence of the “stiff rim” sign or classification as VTIQ pattern 1 most likely indicated malignancy. For the VTIQ quantitative features, the optimal cut points were obtained from the Youden index.
Combination of BI-RADS and VTIQ Features
The readers were asked to upgrade the BI-RADS category (ie, 3 to 4a, 4a to 4b, 4b to 4c, or 4c to 5) when the lesion met one or both of the following conditions: (i) the “stiff rim” sign was present and/or a classification of VTIQ pattern 2 was made; and (ii) SWVmax was greater than or equal to the cut-off value. In the opposite situation, the readers were asked to downgrade the final BI-RADS-US assessment category (ie, 5 to 4c, 4c to 4b, 4b to 4a, or 4a to 3).
Statistical Analysis
Statistical analyses were performed by using SPSS version 16.0 (SPSS Inc, Chicago, IL) and MedCalc for Windows, version 12.2.0.0 (MedCalc Software, Mariakerke, Belgium). The Chisquare was performed for categorical variables. The independent sample t test and the Mann–Whitney U-test were used for comparisons of continuous variables. Using histologic results as a reference, sensitivity, specificity, and the AUC for the differentiation of breast masses with conventional US, the qualitative VTIQ features, the quantitative VTIQ features, and the combination of conventional US and VTIQ features were calculated. To summarize each method’s overall performance, the AUCs were compared. To compare both sensitivity and specificity, the McNemar test was performed. In addition, interobserver agreement of quantitative VTIQ features was determined with the Cohen kappa statistic.10 A P value < 0.05 was considered to indicate a significant difference.
Results
Of the 230 breast masses, 150 (65.2%) cases were benign and 80 (34.8%) were malignant. The malignant lesions were significantly larger than the benign lesions: 22.00±12.10 mm (4.50–69.90 mm) and 17.73±8.38 mm (5.80–55.2 mm), respectively (P=0.016). The histopathologic results of the 230 breast lesions are summarized in Table 1.
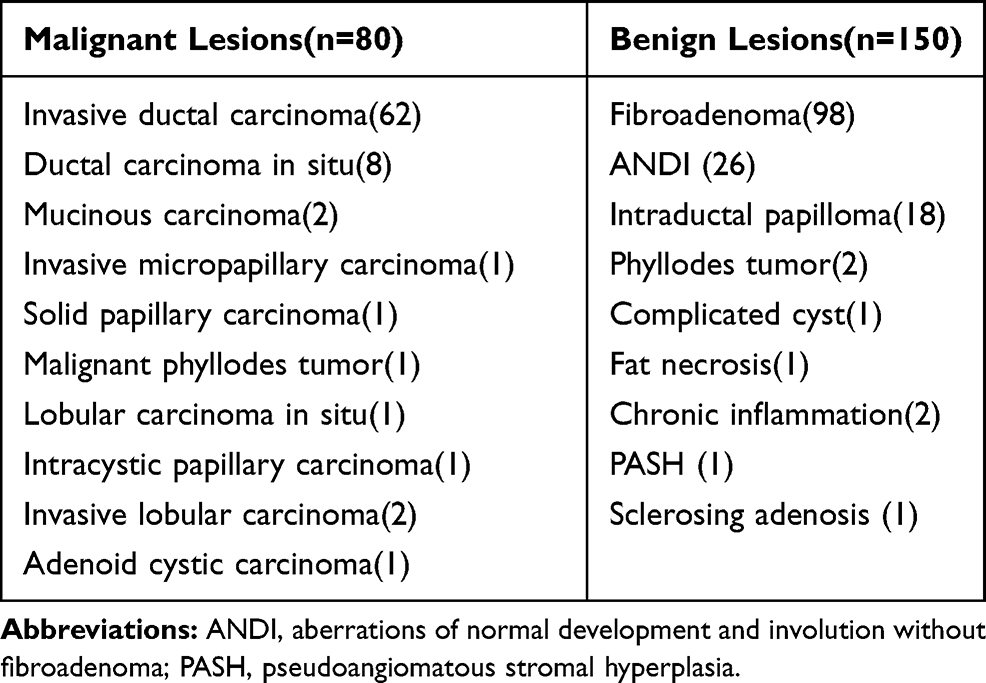 |
Table 1 Pathological Diagnoses of the 230 Breast Lesions |
Conventional B-Mode US
There was an upward trend in the percentage of malignancy from women with BI-RADS 3 lesions to those with BI-RADS 5 (Table 2). Totally, the sensitivity, specificity, and the AUC value of conventional US were 98.75% (95% CI: 93.2–100.0%), 27.33% (95% CI: 20.4–35.2%), and 0.906 (95% CI: 0.861–0.941), respectively (Table 3).
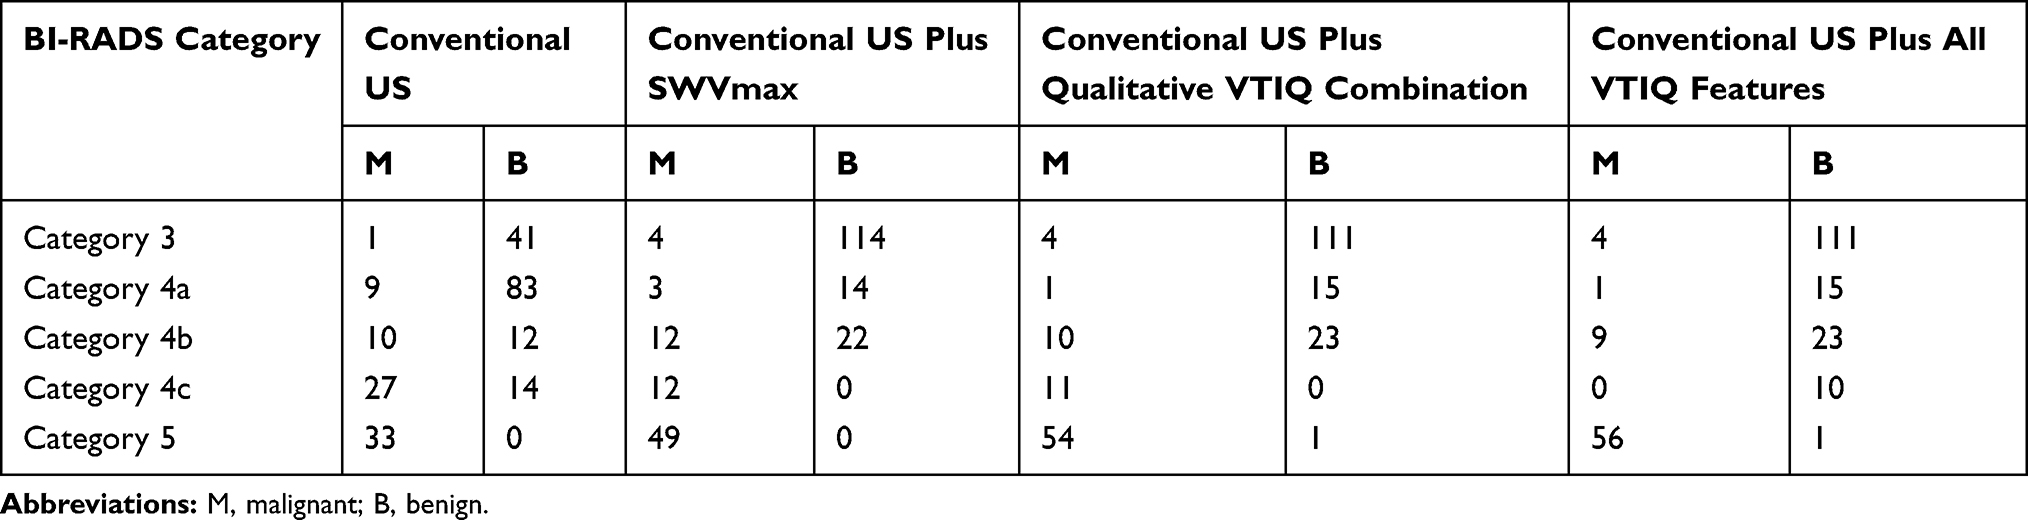 |
Table 2 Distribution of BI-RADS Categories Based on Conventional US and Combined Conventional US and VTIQ |
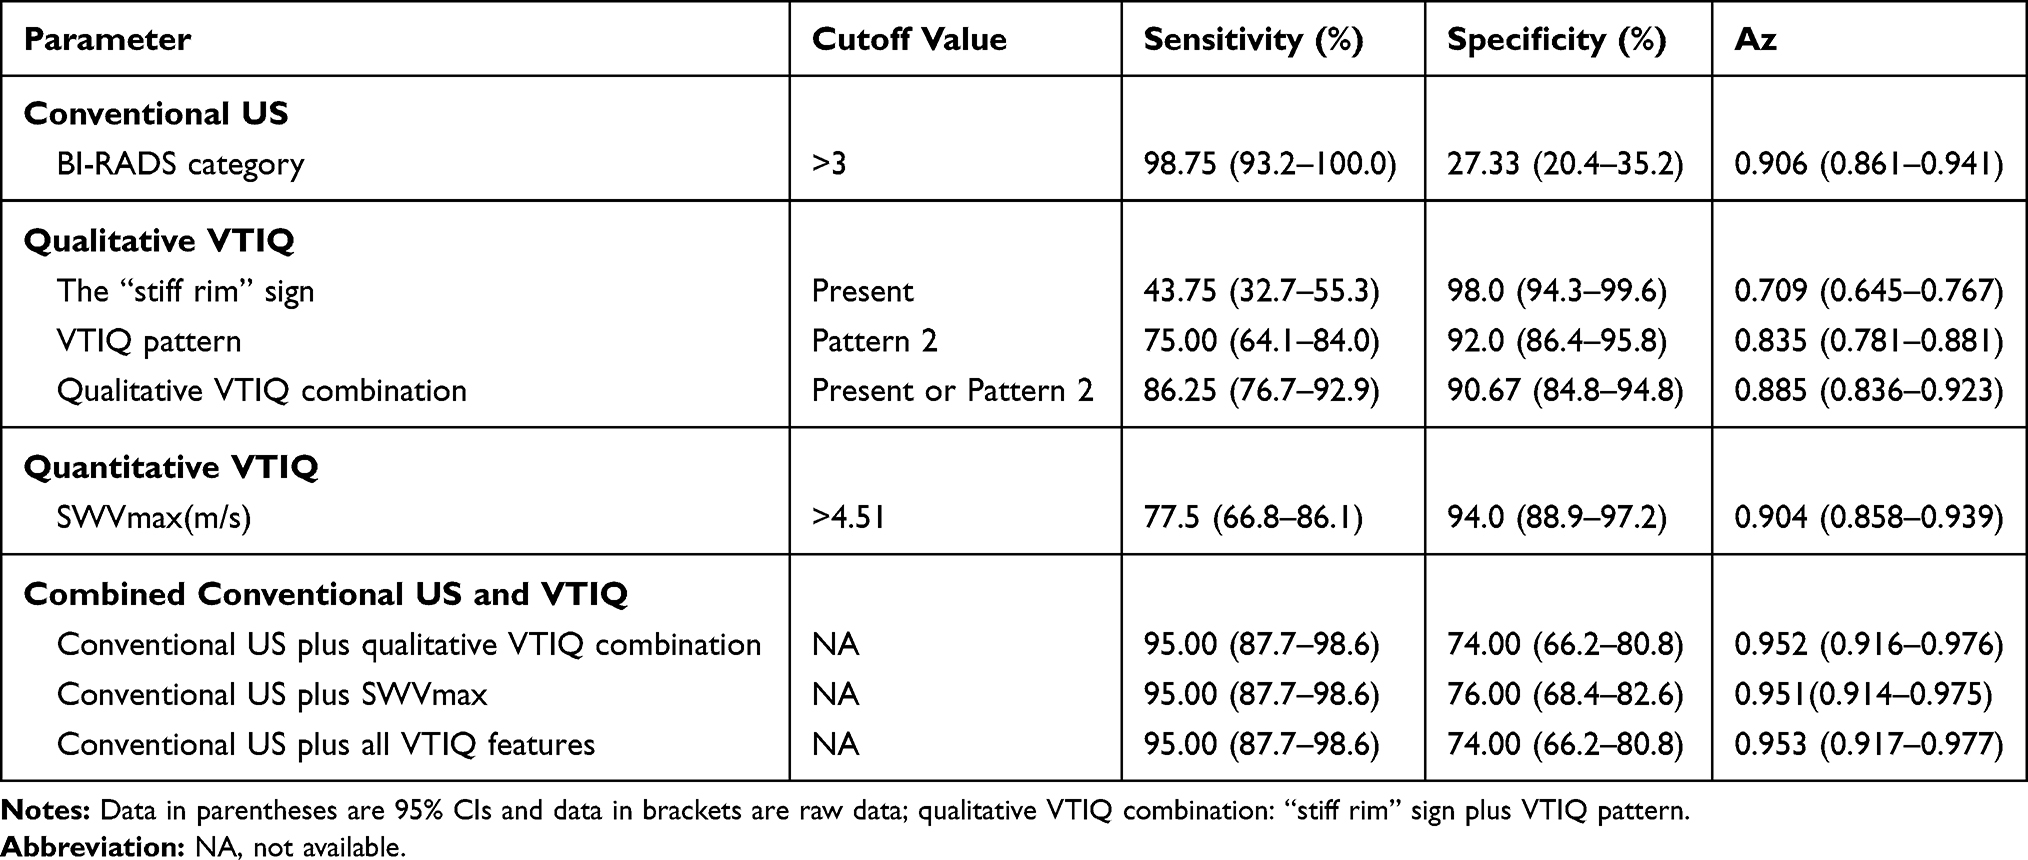 |
Table 3 Diagnostic Performances of Conventional US, VTIQ, and Combined Conventional US and VTIQ |
Quantitative and Qualitative VTIQ Features
Compared to the benign lesions, the malignant lesions had higher SWVmax values (P <0.001, Table 4), and were more likely to show the “stiff rim” sign and VTIQ pattern 2 (P <0.001 for both, Table 4). For SWVmax, when a cutoff point of 4.51 m/s was used, SWV elastography had a sensitivity of 77.5% (95% CI: 66.8–86.1%), and a specificity of 94.0% (95% CI: 88.9–97.2%). The diagnostic performance of SWVmax, the VTIQ pattern alone, the “stiff rim” sign alone, and the qualitative VTIQ combination (VTIQ pattern plus the “stiff rim” sign) is showed in Table 3. Among them, the A z value of SWVmax was the highest, showing significant differences when compared to the VTIQ pattern alone (P=0.018) or the “stiff rim” sign alone (P<0.001), but it was not significantly different from the value for the qualitative VTIQ combination (P=0.472).
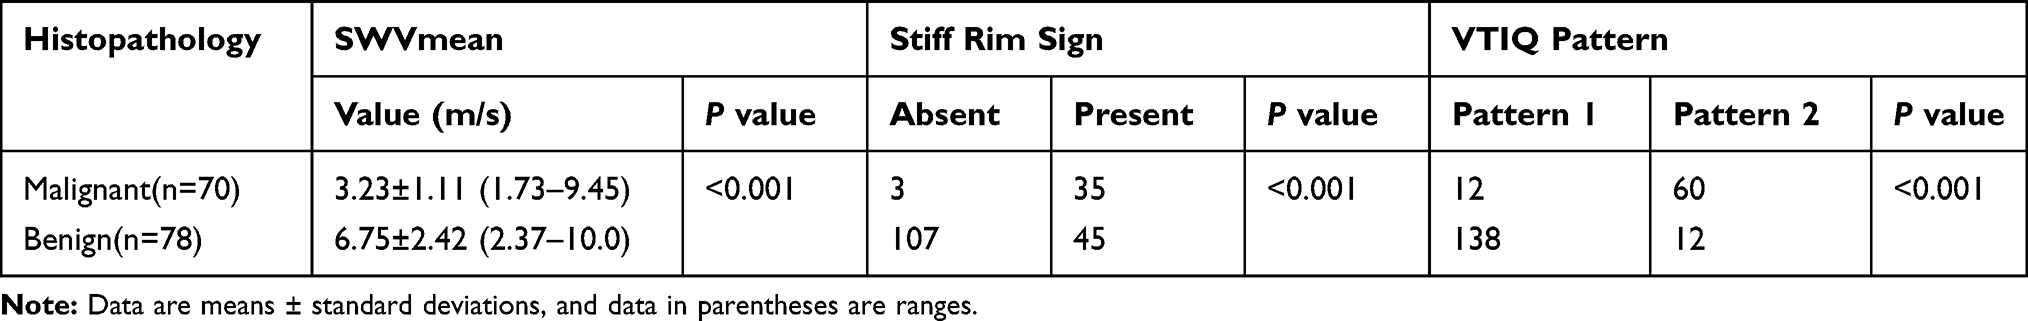 |
Table 4 SWVmax, “Stiff Rim” Sign and VTIQ Pattern Distributions in the 230 Breast Lesions |
Combined Conventional US and VTIQ Features
The distribution of breast lesions analyzed by the combination of VTIQ features and conventional US is showed in Table 3. The combination of conventional US with SWVmax and with the qualitative VTIQ combination yielded similar results and, compared with conventional US alone, showed significantly higher AUC values (P = 0.018 and 0.014, respectively), significantly higher specificities (P<0.001 for both), and slightly decreased but not significantly different sensitivities (P = 0.249 for both). However, unlike what was expected, the ROC curves showed that the performances of conventional US combined with all VTIQ features did not display further improvement (Table 3). Of note, three malignant lesions, including one IDC case of 12 mm, one IDC case of 9 mm and one DCIS case of 16 mm, were incorrectly downgraded by both combined methods in this study (Figure 4).
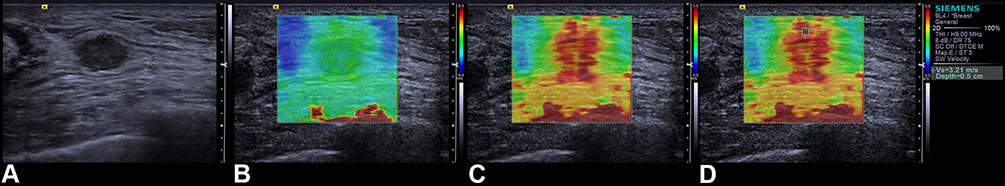 |
Figure 4 False-classified results in a 40-year-old woman with invasive ductal carcinoma when combining conventional US with qualitative VTIQ features or SWVmax. (A) Grayscale US image reveals a 0.9-cm irregular microlobulated hypoechoic mass, which was classified as BI-RADS category 4a. (B) Under the default display setting of 0.5–6.5 m/s, the color pattern on the shear wave velocity display was classified as VTIQ pattern 2. (C) The stiff rim sign was absent even when the display scale was adjusted downward to 0.5–3.5m/s. (D) The maximal shear wave velocity was 3.21 m/s. |
Observer Variability of Qualitative VTIQ Features
The interobserver agreement was substantial for the “stiff rim” sign and the VTIQ pattern, with kappa values of 0.691 (95% CI: 0.565–0.818) and 0.756 (95% CI: 0.669–0.842), respectively, respectively. The interobserver agreement for the VTIQ pattern was almost perfect, with a kappa value of 0.819 (95% CI: 0.744–0.894).
Discussion
As a 2-D SWE technique, VTIQ provides a visualization of a color quantitative elastogram superimposed on a B-mode image, enabling the operator to be guided by both anatomical and tissue stiffness information.11 More importantly, it can display on the shear wave quality form, indicating whether the shear wave is of sufficient magnitude and signal-to-noise ratio (SNR) for accurate shear wave velocity estimation. Thus, with the guidance of the shear wave quality assessment system, VTIQ may be more accurate in obtaining tissue elasticity information.
The majority of studies utilizing VTIQ technology measure only the maximum SWE velocity of the masses and confirm the significance of SWVmax in differentiating benign from malignant lesions.3,11,12 Although different SWS-max cut-off values have been used due to the patient inclusion criteria, technical factors, pathological factors, or some unknown factors, the majority of previous studies showed that SWVmax achieves a high specificity (79.8–92.1%) and a moderate sensitivity (74.0–81.3%).12–14 Our study revealed similar results. In this study, we acquired the maximum SWV of each lesion according to a standardized measurement method, and found a significantly higher SWVmax in malignant lesions (P < 0.0001). When using 4.51 m/s as the SWVmax cut-off value, a sensitivity of 77.5% and a specificity of 94.0% were obtained in the determination of malignant from benign breast lesions.
In general, qualitative SWE pattern classification is easier to perform since it is based on the elastography images obtained prior to adding additional ROIs to the image for obtaining quantitative data. Based on our clinical experience and preliminary test results, we described a simple qualitative classification for the diagnosis of breast masses. Based on the dual-category classification method, the qualitative VTIQ evaluation proposed in this study was easier to use than the qualitative pattern classifications of SWE proposed by previous studies, such as the three-color overlay pattern of Berg et al15 the four-color overlay pattern of Tozaki and Fukuma16 or the five-color overlay classification of Cong et al.17 Moreover, our experience found that the previous classification of the SSI system, might not be applicable to the VTIQ system. In most previous classifications, the “stiff rim” sign, a high SWV present in the peritumoural region, was specifically addressed. Our data demonstrated that this sign displayed different diagnostic performance when using different SWE systems. Cong et al,17 using SSI, indicated that the “stiff rim” sign was classified as the sign with the highest malignancy rate, and considered the “stiff rim” sign as the only factor to upgrade the BI-RADS categories according to the five-color overlay classification. In contrast, our study, using VTIQ, found that the “stiff rim” sign yielded the highest specificity of 98.0%, but had a poor sensitivity (40.0%) and a low AUC value of 0.709. The difference between the two SWE systems might be due to the technical differences between the systems. In SSI, wide spacing push beams and plane-wave insonification with a relatively low mechanical index result in a slightly poor SNR and spatial resolution.4,18,19 Moreover, a relatively higher transducer frequency leads to higher shear wave attenuation. On the other hand, VTIQ uses a maximum of 256 focused push/detection beams with a relatively low transducer frequency and a relatively high mechanical index of 1.7 to generate a higher SNR shear wave imaging compared to SSI11 Consequently, shear wave information is more completely obtained throughout the breast lesion in VTIQ than in SSI. In SSI, the “stiff rim” sign is caused either by increased stiffness in the peritumoural region or by poor quality shear waves in the interior of lesion.9 The more completely obtained shear wave information in the lesion might explain the more obviously decreased sensitivity of the “stiff rim” sign in VTIQ.
The VTIQ images are a color overlap on the B-mode image representing the distribution according to the local propagation velocity of the pressure waves. Our study confirmed that the qualitative VTIQ features combination (the “stiff rim” sign plus the VTIQ pattern) and SWVmax, whether used alone or in combination with conventional US, had similar diagnostic performance in terms of the AUC value, sensitivity and specificity, for differentiating benign from malignant breast masses, which indicated that qualitative VTIQ features might be correlated to the quantitative VTIQ features. Thus, VTIQ qualitative assessment might be considered a subjective evaluation method of SWE measurement.
Various reports have shown improvement in diagnostic performance when combining US with SWE, especially in the specificity of US.5,20 The results of our study showed similar results. Our data found that the specificity of conventional US was significantly improved from 25.6% to 74.0–76.0% (P < 0.001), with a slight tradeoff of a nonsignificantly decreased sensitivity (95.0%). However, three malignant lesions, one with DCIS and two with IDC, were all falsely classified when combining conventional US with qualitative or quantitative VTIQ features. Vinnicombe et al21 reported that a small size, invasive status, and histologic grade have a significant influence on the accuracy of VTIQ results. These results were in accordance with those of our study.
There were several limitations to our study. First, only ultrasound-visible breast lesions were included in the study. Second, a multicenter study with a larger sample size should be performed to validate the benefits of VTIQ. Third, although the qualitative analyses were evaluated by two well-trained readers who had already obtained good agreement, the validity of the results of our study may also be questioned in failing to consider the interobserver variability during the quantitative analyses. In this study, SWVmax measurements were acquired according to a standardized method by one breast radiologist with more than 10 years of experience with breast sonography. Considering prior results3 showing that quantitative VTIQ is highly reliable and reproducible for assessing the elastographic features of breast lesions, inter- or intraobserver variability was expected to have little influence on our results.
In conclusion, the validity of the qualitative classification proposed in our study (the presence of the “stiff rim” sign and/or the classification into VTIQ pattern 2) might be comparable to that of quantitative parameters (SWVmax), with similar diagnostic performances for the evaluation of breast masses. Using qualitative VTIQ features to change the BI-RADS categories could increase specificity without a loss of sensitivity. Usually, qualitative evaluation of VTIQ can be performed more simply in a typical busy breast imaging practice. Thus, we suggest that qualitative assessment of VTIQ could be widely applied as a useful method of malignancy risk-stratification in breast tumors.
Funding
This research was supported by Guangxi Outstanding Youth Training Program (No. GCQN-2018-B17), the National Natural Science Foundation of China (Grant 81471669), and the Study Project of Collaborative Innovation Center for Translational Medicine at Shanghai Jiao Tong University School of Medicine (Grant TM201618).
Disclosure
The authors report no conflicts of interest in this work.
References
1. Ophir J, Alam SK, Garra BS, et al. Elastography: imaging the elastic properties of soft tissues with ultrasound. J Med Ultrason. 2002;29(4):155. doi:10.1007/BF02480847
2. Tozaki M, Isobe S, Fukuma E. Preliminary study of ultrasonographic tissue quantification of the breast using the acoustic radiation force impulse (ARFI) technology. Eur J Radiol. 2011;80(2):e182–7. doi:10.1016/j.ejrad.2011.05.020
3. Golatta M, Schweitzer-martin M, Harcos A, et al. Evaluation of virtual touch tissue imaging quantification, a new shear wave velocity imaging method, for breast lesion assessment by ultrasound. Biomed Res Int. 2014;2014:960262. doi:10.1155/2014/960262
4. Bamber J, Cosgrove D, Dietrich CF, et al. EFSUMB guidelines and recommendations on the clinical use of ultrasound elastography. Part 1: basic principles and technology. Ultraschall Med. 2013;34(2):169–184. doi:10.1055/s-0033-1335205
5. Barr RG. The Role of sonoelastography in breast lesions. Semin Ultrasound CT MR. 2018;39(1):98–105. doi:10.1053/j.sult.2017.05.010
6. Yoon JH, Ko KH, Jung HK, Lee JT. Qualitative pattern classification of shear wave elastography for breast masses: how it correlates to quantitative measurements. Eur J Radiol. 2013;82(12):2199–2204. doi:10.1016/j.ejrad.2013.08.047
7. Park J, Woo OH, Shin HS, Cho KR, Seo BK, Kang EY. Diagnostic performance and color overlay pattern in shear wave elastography (SWE) for palpable breast mass. Eur J Radiol. 2015;84(10):1943–1948. doi:10.1016/j.ejrad.2015.06.020
8. D' Orsi CJ, Sickles EA, Mendelson EB, Morris E. ACR BI-RADS Atlas: Breast Imaging Reporting and Data System. 5th ed. Reston, VA: American college of Radiology; 2013
9. Zhou J, Zhan W, Chang C, et al. Breast lesions: evaluation with shear wave elastography, with special emphasis on the “stiff rim” sign. Radiology. 2014;272(1):63–72. doi:10.1148/radiol.14130818
10. Landis JR, Koch GG. The measurement of observer agreement for categorical data. Biometrics. 1977;33(1):159–174. doi:10.2307/2529310
11. Tozaki M, Saito M, Benson J, Fan L, Isobe S. Shear wave velocity measurements for differential diagnosis of solid breast masses: a comparison between virtual touch quantification and virtual touch IQ. Ultrasound Med Biol. 2013;39(12):2233–2245. doi:10.1016/j.ultrasmedbio.2013.07.012
12. Sun JW, Wang XL, Zhao Q, et al. Virtual touch tissue imaging and quantification (VTIQ) in the evaluation of breast lesions: the associated factors leading to misdiagnosis. Eur J Radiol. 2019;110:97–104. doi:10.1016/j.ejrad.2018.11.021
13. Kong WT, Zhou WJ, Wang Y, Zhuang XM, Wu M. The value of virtual touch tissue imaging quantification in the differential diagnosis between benign and malignant breast lesions. J Med Ultrason. 2019;46(4):459–466. doi:10.1007/s10396-019-00948-0
14. Dória MT, Jales RM, Conz L, Sfm D, Loz S. Diagnostic accuracy of shear wave elastography - Virtual touch™ imaging quantification in the evaluation of breast masses: impact on ultrasonography’s specificity and its ultimate clinical benefit. Eur J Radiol. 2019;113:74–80. doi:10.1016/j.ejrad.2019.02.004
15. Berg WA, Cosgrove DO, Doré CJ, et al. Shear-wave elastography improves the specificity of breast US: the BE1 multinational study of 939 masses. Radiology. 2012;262(2):435–449. doi:10.1148/radiol.11110640
16. Tozaki M, Fukuma E. Pattern classification of ShearWave™ Elastography images for differential diagnosis between benign and malignant solid breast masses. Acta Radiol. 2011;52(10):1069–1075. doi:10.1258/ar.2011.110276
17. Cong R, Li J, Guo S. A new qualitative pattern classification of shear wave elastography for solid breast mass evaluation. Eur J Radiol. 2017;87:111–119. doi:10.1016/j.ejrad.2016.12.021
18. Bercoff J, Tanter M, Fink M. Supersonic shear imaging: a new technique for soft tissue elasticity mapping. IEEE Trans Ultrason Ferroelectr Freq Control. 2004;51(4):396–409. doi:10.1109/TUFFC.2004.1295425
19. Montaldo G, Tanter M, Bercoff J, Benech N, Fink M. Coherent plane-wave compounding for very high frame rate ultrasonography and transient elastography. IEEE Trans Ultrason Ferroelectr Freq Control. 2009;56(3):489–506. doi:10.1109/TUFFC.2009.1067
20. Barr RG, Nakashima K, Amy D, et al. WFUMB guidelines and recommendations for clinical use of ultrasound elastography: part 2: breast. Ultrasound Med Biol. 2015;41(5):1148–1160. doi:10.1016/j.ultrasmedbio.2015.03.008
21. Vinnicombe SJ, Whelehan P, Thomson K, et al. What are the characteristics of breast cancers misclassified as benign by quantitative ultrasound shear wave elastography. Eur Radiol. 2014;24(4):921–926. doi:10.1007/s00330-013-3079-4
 © 2020 The Author(s). This work is published and licensed by Dove Medical Press Limited. The
full terms of this license are available at https://www.dovepress.com/terms
and incorporate the Creative Commons Attribution
- Non Commercial (unported, 3.0) License.
By accessing the work you hereby accept the Terms. Non-commercial uses of the work are permitted
without any further permission from Dove Medical Press Limited, provided the work is properly
attributed. For permission for commercial use of this work, please see paragraphs 4.2 and 5 of our Terms.
© 2020 The Author(s). This work is published and licensed by Dove Medical Press Limited. The
full terms of this license are available at https://www.dovepress.com/terms
and incorporate the Creative Commons Attribution
- Non Commercial (unported, 3.0) License.
By accessing the work you hereby accept the Terms. Non-commercial uses of the work are permitted
without any further permission from Dove Medical Press Limited, provided the work is properly
attributed. For permission for commercial use of this work, please see paragraphs 4.2 and 5 of our Terms.