")
Back to Journals » Neuropsychiatric Disease and Treatment » Volume 19
qEEG as Biomarker for Alzheimer’s Disease: Investigating Relative PSD Difference and Coherence Analysis
Authors Simfukwe C , Han SH, Jeong HT , Youn YC
Received 31 July 2023
Accepted for publication 4 November 2023
Published 9 November 2023 Volume 2023:19 Pages 2423—2437
DOI https://doi.org/10.2147/NDT.S433207
Checked for plagiarism Yes
Review by Single anonymous peer review
Peer reviewer comments 2
Editor who approved publication: Dr Taro Kishi
Chanda Simfukwe, Su-Hyun Han, Ho Tae Jeong, Young Chul Youn
Department of Neurology, Chung-Ang University College of Medicine, Seoul, South Korea
Correspondence: Young Chul Youn; Su-Hyun Han, Department of Neurology, Chung-Ang University Hospital, Seoul, Republic of Korea, Email [email protected]; [email protected]
Purpose: Electroencephalography (EEG) is a non-intrusive technique that provides comprehensive insights into the electrical activities of the brain’s cerebral cortex. The brain signals obtained from EEGs can be used as a neuropsychological biomarker to detect different stages of Alzheimer’s disease (AD) through quantitative EEG (qEEG) analysis. This paper investigates the difference in the abnormalities of resting state EEG (rEEG) signals between eyes-open (EOR) and eyes-closed (ECR) in AD by analyzing 19-scalp electrode EEG signals and making a comparison with healthy controls (HC).
Participants and Methods: The rEEG data from 534 subjects (ages 40– 90) consisting of 269 HC and 265 AD subjects in South Korea were used in this study. The qEEG for EOR and ECR states were performed separately for HC and AD subjects to measure the relative power spectrum density (PSD) and coherence with functional connectivity to evaluate abnormalities. The rEEG data were preprocessed and analyzed using EEGlab and Brainstorm toolboxes in MATLAB R2021a software, and statistical analyses were carried out using ANOVA.
Results: Based on the Welch method, the relative PSD of the EEG EOR and ECR states difference in the AD group showed a significant increase in the delta frequency band of 19 EEG channels, particularly in the frontal, parietal, and temporal, than the HC groups. The delta power band on the source level was increased for the AD group and decreased for the HC group. In contrast, the source activities of alpha, beta, and gamma frequency bands were significantly reduced in the AD group, with a high decrease in the beta frequency band in all brain areas. Furthermore, the coherence of rEEG among different EEG electrodes was analyzed in the beta frequency band. It showed that pair-wise coherence between different brain areas in the AD group is remarkably increased in the ECR state and decreased after subtracting out the EOR state.
Conclusion: The findings suggest that examining PSD and functional connectivity through coherence analysis could serve as a promising and comprehensive approach to differentiate individuals with AD from normal, which may benefit our understanding of the disease.
Keywords: Alzheimer’s disease, electroencephalography, power spectral density, coherence
Introduction
Electroencephalography (EEG) tool is currently used as a biomarker in the early diagnosis and detection of Alzheimer’s disease (AD) and other types of dementia through quantitative EEG (qEEG).1–3 Researchers typically record EEG data from participants in an eyes-open resting (EOR) state and an eyes-closed resting (ECR) state where participants are awake but refrain from specific tasks or movements.4 The condition AD is the leading cause of dementia, a degenerative brain condition characterized by a gradual decline in cognitive function. It primarily affects individuals over 70, leading to severe memory loss and cognitive impairment. Studies indicate that the hallmark characteristics of AD include the presence of neurofibrillary tangles, senile plaques, and significant neuronal cell loss in the hippocampus. These neurofibrillary tangles consist of abnormal and hyperphosphorylated forms of total tau (t-tau) and phospho-tau (p-tau) found in cerebrospinal fluid (CSF). In contrast, the senile plaques mainly consist of amyloid-β (Aβ) peptides.5 The global prevalence of AD is anticipated to double over the next 20 years due to increased life expectancy in most populations.6,7
Neuroimaging and blood-based biomarkers can identify and categorize AD at an early stage. They help healthcare practitioners prevent misdiagnosis, enhance disease management, and offer prompt and effective patient treatment options.8,9 Although these advanced techniques, such as magnetic resonance imaging (MRI), functional MRI (fMRI), positron emission tomography (PET), cerebrospinal fluid amyloid beta 42 (CSF Aβ42), and multimer detection system-oligomerized amyloid beta (MDS-OAβ) offer significant capabilities, they have several disadvantages. These include high cost, limited temporal resolution, time-intensive procedures, potential radiation risks, immobility, and have limited accessibility to patients.10,11 It is likely that EEG can play an essential role in accomplishing these needs and serve as a valuable tool in detecting AD.12 The EEG analysis is traditionally widely utilized in clinical settings to evaluate conditions such as emotional recognition, epilepsy, sleep disorders, and strokes.12,13 In addition, visual and statistical techniques can be applied to EEG data for diagnosing dementia.14 Henderson et al15 successfully utilized EEG to classify the presence of early dementia with high levels of sensitivity and specificity. The EEG signals were divided into five distinct frequency bands: delta, theta, alpha, beta, and gamma, typically between 10 µv and 100 µv and covering a frequency range of 1 to 100 Hz.16 Patients with AD showed abnormal EEG signals characterized by a decrease in higher frequency bands, specifically alpha and beta (8–30 Hz), and an increase in the lower frequency bands, delta, and theta (0.5–8 Hz).
Additionally, these signals often display a slowing pattern.17 A standard method for analyzing EEG data involves using traditional power spectrum density (PSD) and coherence measurements through quantitative EEG (qEEG).18 The qEEG helps clinicians efficiently summarize EEG data compared to conventional EEG data.3 The PSD assesses the collective activity of cortical cells organized in parallel and averaged across the cortex, providing a physiological measure of brain activity,3,19 while EEG coherence identifies the specific brain regions from which a particular activity originates.18,20 It measures the level of linear synchrony between different brain cortical areas. When coherence is high, it indicates a stronger functional linkage between these areas, showing a greater degree of coordinated activity.20,21 The EEG PSD is commonly computed based on PSD (Welch), which computes a modified periodogram for each segment and then averages to produce a PSD estimate.22 Compared to traditional spectrum estimation techniques (eg, Fast Fourier Transform (FFT)), the Welch method offers a trade-off between noise reduction in the estimated power spectra and a reduction in frequency resolution.22,23 Several EEG types show notable changes in EEG power bands in AD patients, including delta, theta, alpha, beta, and gamma. Gianotti et al24 and Jeong et al25 applied qEEG to demonstrate alterations in individuals with AD. They observed reduced activity in fast-frequency bands and increased activity in slow-frequency bands among AD patients. Czigler et al26 observed a notable reduction in the alpha band power and an elevation in theta power among AD patients compared to the control group. Moreover, several studies have investigated the correlation of EEG frequency bands in AD patients using qEEG.25,27,28
Although EEG PSD can effectively capture variations between the AD and control group in the frequency domain, it has limitations in that it solely examines individual EEG channels and fails to depict the interplay among different EEG series, particularly the connectivity between distinct brain regions. However, many studies have consistently highlighted that AD is widely recognized as a syndrome associated with disrupted connectivity, where there is widespread deterioration of synaptic connections and neuronal loss.29,30
The relative PSD for EEG EOR and ECR states is commonly used to evaluate specific parts of the brain region active during EEG recordings through frequency domain analysis using standardized low-resolution brain electromagnetic tomography (sLORETA) in AD patients.31,32 The sLORETA is a functional neuroimaging technique used to determine the cortical origin of brain electrical signals in a 3-D human head model.33
Utilizing the frequency domain analysis, several studies indicate that patients with AD in EEG ECR and EOR states have different changes in frequency bands compared to healthy controls. In the EEG ECR state, AD patients display an apparent reduction in power, specifically in the alpha frequency range.18,32 In contrast, in EOR EEG, the alpha peak of AD patients does not display a significant decrease compared to healthy participants.4,34 However, no study has investigated the relative PSD and coherence difference (EOR – ECR) of EEG in EOR and ECR state findings in patients with AD compared to healthy controls. Most studies compare EOR to ECR or focus on ECR in AD from the normal group and are based on a small sample size.18,31,32,34
The present study investigates the differences between EEG EOR and ECR EEG states for AD patients based on a larger sample size by characterizing the alteration of relative PSD and coherence analysis between multiple cortical regions. Understanding the electrophysiological features of patients with AD is anticipated to help with early differential diagnosis. Figure 1 shows a block diagram for the study framework.
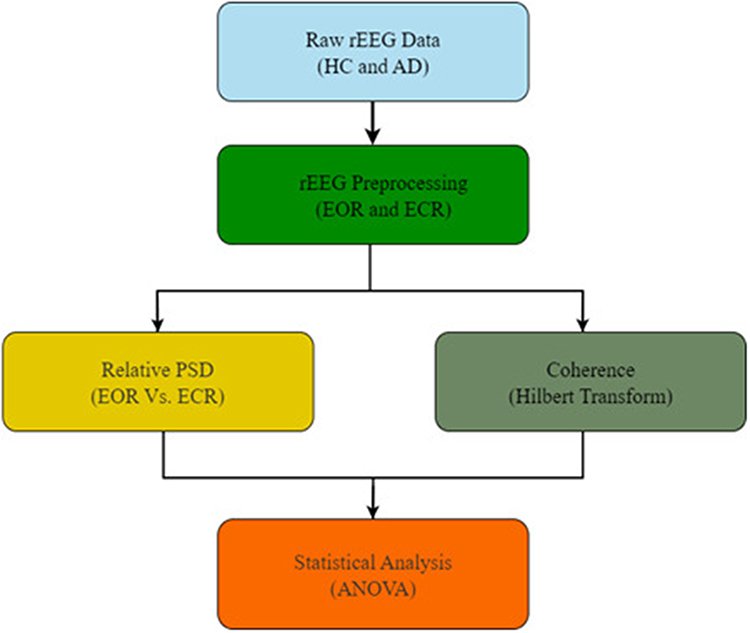 |
Figure 1 Block diagram of classification between HC subjects and AD patients from the EEG analysis. Abbreviations: rEEG, resting state electroencephalography; HC, healthy controls; AD, Alzheimer’s disease; EOR, eyes-open resting; ECR, eyes-closed resting; PSD, power spectrum density; ANOVA, analysis of variance. |
Methods
Participants
A total of 534 participants were included in the study, comprising 269 HC and 265 AD patients. The participants’ ages were 64.54±9.03 for HC and 76.94±8.03 for AD (mean ± standard deviation, here and throughout) (Figure 2). The data were collected under approval number 1792–012-300 from the Chung-Ang University Hospital ethics committee (IRB No. C2012049). The study originated as a cohort research investigation at the hospital to determine the prevalence of cognitive impairments and identify associated risk factors among the elderly.
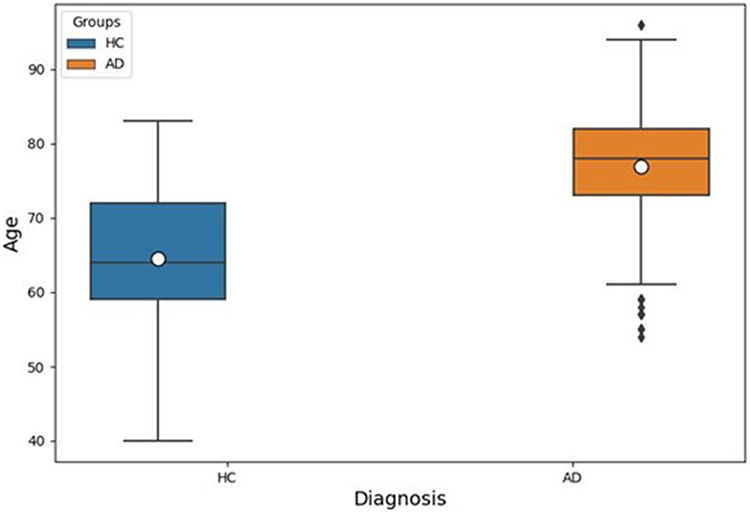 |
Figure 2 The age demographics of the different groups. Abbreviations: HC, healthy controls; AD, Alzheimer’s disease. Note: Data is shown as mean ± standard deviation. |
The selection criteria of the AD participants were grouped accordingly; the subject needed to meet specific criteria, including the clinical identification of a gradual deterioration in memory, a decline in the ability to independently perform daily activities, changes in personality, and an objective assessment of verbal memory using the Seoul Neuropsychological Screening Battery (SNSB). The SNSB is a comprehensive tool for assessing various cognitive functions, including memory, attention, language skills, related cognitive processes, and visuospatial abilities.35 The HC group comprised individuals who demonstrated typical functioning in their daily activities and exhibited cognitive abilities within the normal range. Specifically, their memory decline was less than 1.0 standard deviation below the average on neuropsychological tests. A qualified neurologist conducted the diagnostic assessments. Participants with acute mental issues like depression, neurological disorders like epilepsy, and psychiatric conditions like schizophrenia were excluded from the study. The EEG data of the subjects underwent preprocessing using the EEGlab and Brainstorm tool in the MATLAB environment to remove any artifacts.
EEG Recordings and Analysis
The EEG signals were collected using electroencephalograph hardware (Comet AS40 amplifier EEG GRASS; Telefactor, USA) and gold-cup EEG electrodes. The placement of these electrodes followed the international 10–20 system, resulting in 19 electrodes at specific positions, including Fp1, Fp2, F7, F3, Fz, F4, F8, T3, C3, Cz, C4, T4, T5, P3, Pz, P4, T6, O1, and O2. The earlobes were electrode reference points (Supplementary Figure 1). Throughout the EEG recording sessions, the skin impedance of the electrodes remained consistently below 5kΩ. The EEG signals were digitally recorded and stored on magnetic disks. Before recording, the signals underwent digital filtering. Bandpass filtering was applied; this is a crucial step in EEG signal processing, where it is used to isolate a specific frequency range of interest while attenuating frequencies outside that range. In our study, we applied a range of 0.5 to 70 Hz was chosen to retain EEG frequencies within this range and remove unwanted noise. This process involved selecting a filter design, specifying the filter order, and applying the filter to each EEG channel.
Participants were instructed to keep their eyes open or closed when presented with a flashing light signal. EEG sampling occurred at a frequency of 200 Hz, with 10 recordings taken for both eyes-open and eyes-closed conditions, each lasting 30 seconds. Approximately 3 minutes of data were collected during these recordings. For analysis purposes, 45 epochs were selected, each lasting four seconds. The recorded data for both EOR and ECR state conditions were converted using the connected ear reference and saved in a text format without removing any artifacts. The participants were instructed to remain relaxed and motionless in a quiet room, refraining from physical activities like swallowing or blinking. The raw EEG signals were processed using the EEGlab toolbox version 2022 (https://sccn.ucsd.edu/eeglab/index.php), which operates within the MATLAB software environment version R2021a (https://kr.mathworks.com/). Preprocessing of the EEG signals involved various standard procedures, including amplification, signal filtering, artifact removal, and independent component analysis (ICA). The EEG data were subjected to these preprocessing steps following a general block diagram, as shown in Figure 3. These measures ensured that the EEG signals used for the relative PSD analysis and coherence assessment were free from any artifacts.
 |
Figure 3 A schematic representation of the preprocessing steps and artifact removal applied to EEG signals. Abbreviations: rEEG, resting state electroencephalography; EOR, eyes-open resting; ECR, eyes-closed resting; CAR, common average reference; ASR, Artifact reconstruction; ICA, independent component analysis. |
The relative PSD at the sensor level was computed using a PSD (Welch) in the Brainstorm toolbox version (https://neuroimage.usc.edu/brainstorm/) in MATLAB environment according to frequency bands: delta (2–4 Hz), theta (5–7 Hz), alpha (8–12 Hz), beta (15–29 Hz), and gamma (30–90 Hz). The relative power was obtained by averaging the power of the FFT coefficients’ across overlapping windows. Furthermore, the sLORETA technique available in Brainstorm analyzes the current distribution across the brain at the source level.36 This analysis compared relative power values in 19 regions of interest (ROIs) and the connectivity.
Statistical Analysis
Statistical analyses were conducted using a one-way ANOVA test with Python programing language (https://www.python.org/) in Pycharm integrated development environment (IDE) (https://www.jetbrains.com/pycharm/) from JetBrains by applying the “f_oneway” function from the Scipy library (https://docs.scipy.org/doc/scipy/index.html) to compare the relative PSD and pair-wise coherence for AD group and HC group. A significance level of p < 0.05 was adopted to determine statistical significance.
Results
Relative PSD Analysis
Table 1 shows the average PSD for AD and HC groups for EOR and ECR. The AD group significantly differed between EOR and ECR in theta, alpha, beta, and gamma sub-bands (p < 0.05). In contrast, the HC group only showed a significant difference between EOR and ECR in the gamma frequency band (p < 0.05). Additionally, the difference between EOR and ECR for the AD and HC groups is shown in Table 2, which shows the statistical significance between AD and HC groups with an ANOVA (P-value < 0.05) in alpha, beta, and gamma frequency bands. Figure 4 shows the relative PSD of 19 EEG channels in five frequency bands for the HC (EOR – ECR) and AD (EOR – ECR) groups. The PSD decreased as the frequency increased in both groups. The relative PSD values in the delta frequency band varied between −0.1 and 0.8, indicating a wide range of power distribution in this frequency range. On the other hand, the gamma frequency band exhibited fluctuations within the range of −0.1 to 0.5, suggesting that most energy was concentrated in lower frequencies while the subjects were resting.
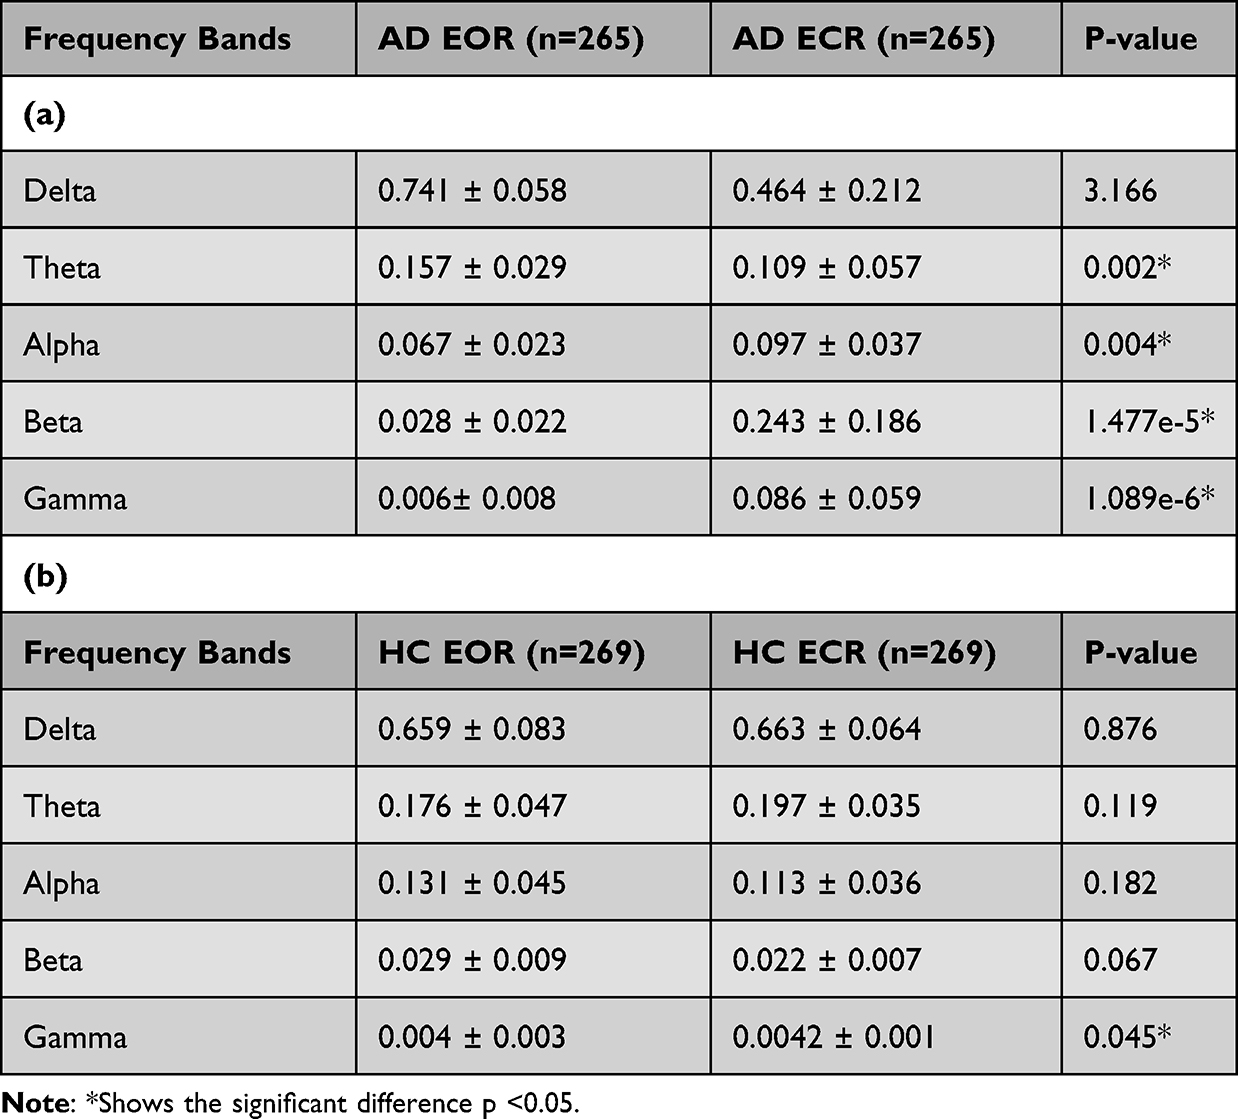 |
Table 1 (a) Results of ANOVA for Relative PSD of AD Group for EOR and ECR State; (b) Results of ANOVA for Relative PSD of HC Group for EOR and ECR |
 |
Table 2 (a) Results of ANOVA for Relative PSD Differences Between AD and HC Group for EOR and ECR State |
 |
Figure 4 The overall PSD of 19 EEG channels in the (a) delta, (b) theta, (c) alpha, (d) beta, and (e) gamma frequency band for the AD group and the HC. Abbreviations: PSD, power spectrum density; EEG, electroencephalography; AD, Alzheimer’s disease; HC, healthy controls. |
We observed three interesting results after comparing the relative PSD values between the AD and HC groups. (1) In the delta and theta frequency bands (Figure 4a and b), the relative PSD in the AD group was notably higher than that of the HC group. However, there were no significant group differences, except several electrodes, such as F3, C3, F4, C4, F7, T3, and T4 in the delta frequency band and Fp1, F3, C3, O1, F4, C4, F7, T3, and F8 in the theta frequency band. (2) In the alpha frequency band (Figure 4c), the relative PSD showed similar variations across different electrodes for both groups. However, there was a significant difference between the two groups; (3) In the beta and gamma frequency bands (Figure 4d and e), the relative PSD values of the AD group were significantly lower than those of the HC group in all brain regions, and the differences between the groups were significant.
We calculated the average relative PSD values across all 19 electrodes within the five frequency bands to comprehensively understand the overall relative PSD. The ANOVA statistical analysis results are presented in Figure 5 and Table 3. These findings provide valuable insights into the collective spectral characteristics of the EEG data, offering a clearer perspective on the patterns and differences observed in the studied frequency bands. It was observed that compared to the HC group, the relative PSD in delta and theta frequency bands in the AD group were increased, and there was a decrease in the remaining three frequency bands: alpha, beta, and gamma. The averaged group difference estimated by the ANOVA was statistically significant in the alpha (F= 13.08, P = 0.0009 < 0.05), beta (F= 158.18, P= 9.737e-15 < 0.05), and gamma (F= 190.30, P= 6.099e-16 < 0.05). The AD group beta frequency band showed a huge decrease in relative PSD compared to the HC group and other sub-bands (Figure 5).
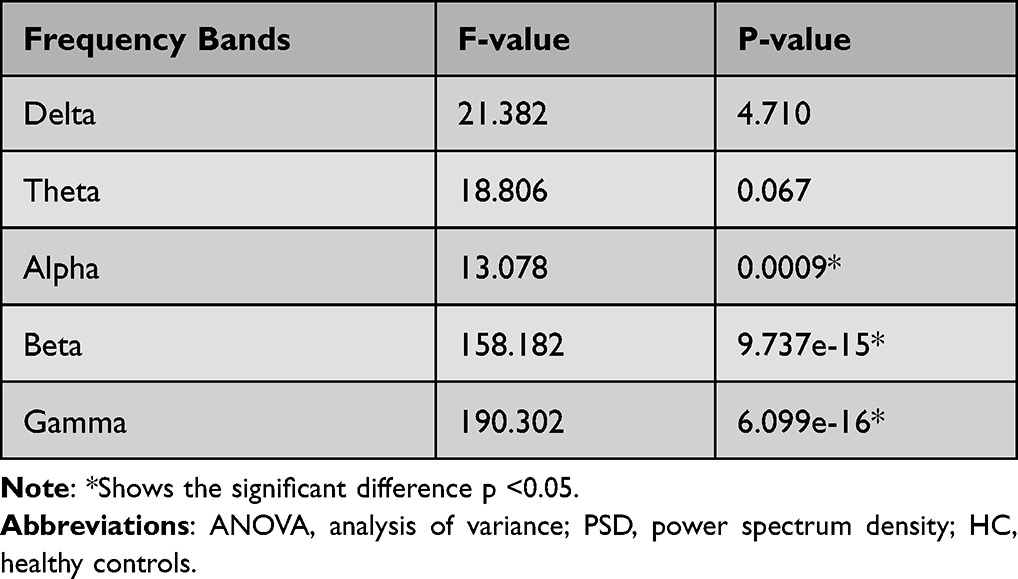 |
Table 3 Results of ANOVA for Relative PSD of Five Frequency Bands Between AD and the HC Group |
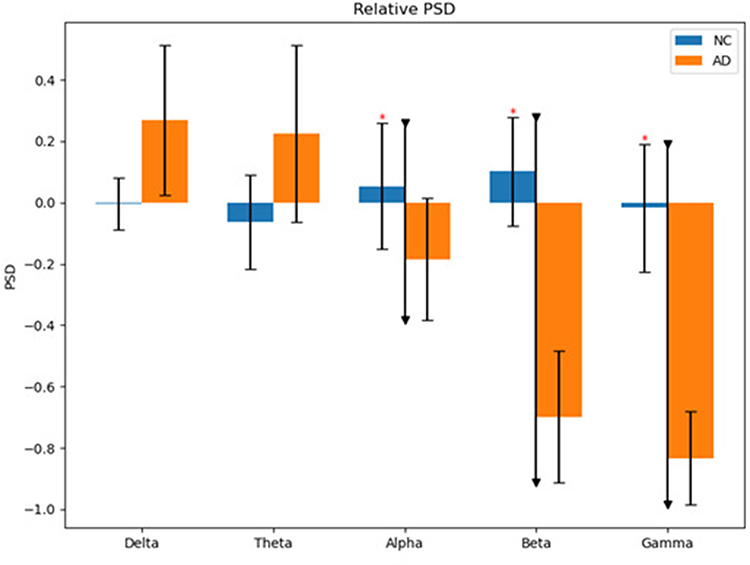 |
Figure 5 Relative PSD averaged over the 19 electrodes in five frequency bands for AD and the HC group. The error bars depict the standard deviations. Asterisks and black down-pointing triangles denote significant differences between the two groups, indicating p-values less than 0.05 after ANOVA analysis. Abbreviations: PSD, power spectrum density; ANOVA, analysis of variance; AD, Alzheimer’s disease; HC, healthy controls. |
Coherence Analysis
Coherence can be regarded as quantifying the normalized linear synchronization between various EEG signals when analyzed in the frequency domain. In this study. Coherence analysis was conducted on all possible combinations of EEG channels for AD and HC groups. The analysis focused specifically on the beta frequency band, where the relative PSD mentioned earlier showed the greatest significant decrease between the two groups.
The average coherence between 19 channels of the AD and HC groups in the beta frequency range is shown in Figure 6. The symmetry in the mean coherence distributions of both groups suggests the potential existence of rapid and bidirectional transmission between different areas of the brain. The coherence matrix displayed a diagonal where all entries were equal to 1, indicating that an EEG signal could synchronize perfectly with itself. The HC group (Figure 6B) had more significant regions with high coherence values (color red) than the AD group. In the AD group (Figure 6A), the regions with high coherence values were found in different areas, including the parietal-temporal, occipital, occipital-parietal, frontal-temporal, frontal, occipital-frontal, frontal-parietal, and temporal. These areas included connections such as P3/O1-T6/O2, O1/Fp2-P4/T4, Fp2/O2-F8/Fp2, Fp2/F7-T5/Pz, Fp2/F7-T3/Cz, T3/T5-T4/T4, T3/T5-F8/Fp2, T3/F8-Fp2/T4, F8/T4-T3/F8, F8/T4-Fp2/T5, T4/T6-T3-P3, T4/Cz-Fp3/F7, and Pz-F7 for the beta frequency band. The high coherence values were scattered and distributed across these regions. The P-value matrix obtained from the ANOVA comparing the AD group and the HC group differences in coherence is illustrated in Figure 6C. All p-values were less than 0.05, indicating the difference in the coherence matrix between AD patients and healthy individuals was large enough for a clear distinction between the two groups.
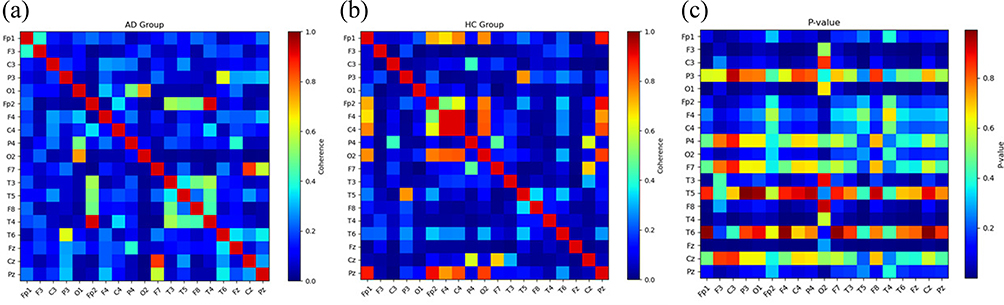 |
Figure 6 Coherence matrix for pair-wise electrodes for (A) AD and (B) the HC group in the beta frequency band; (C) matrix P-value of the two groups obtained by ANOVA, in which all the diagonal entries are defined as the most significant value with red color. Abbreviations: AD, Alzheimer’s disease; HC, healthy controls; P-value, probability; ANOVA, ANOVA, analysis of variance. Notes: The color scale used in the representation indicates the standardized uptake value ratio (SUVR), where blue to red shades indicate areas with higher coherence retention. |
The coherence between patients with AD and HC group were further examined by focusing on the functional connectivity between electrodes. Figure 7 shows topographic maps representing the relative PSD in the beta frequency range for both the AD and HC groups. Meanwhile, the study investigated functional connections based on coherence, as illustrated by red links in Figure 7, between electrodes indicating high relative PSD values, specifically Fp2, T4, Cz, F7, Pz, O2, F4, and C4. Moreover, the electrodes with higher PSD values indicated more localized functional connections in both the AD and HC groups. Additionally, in the AD group, there were fewer strong connections between frontal-temporal areas compared to the HC group. This indicates that the level of synchronization, including the transmission of information and collaborative effects, was significantly reduced.
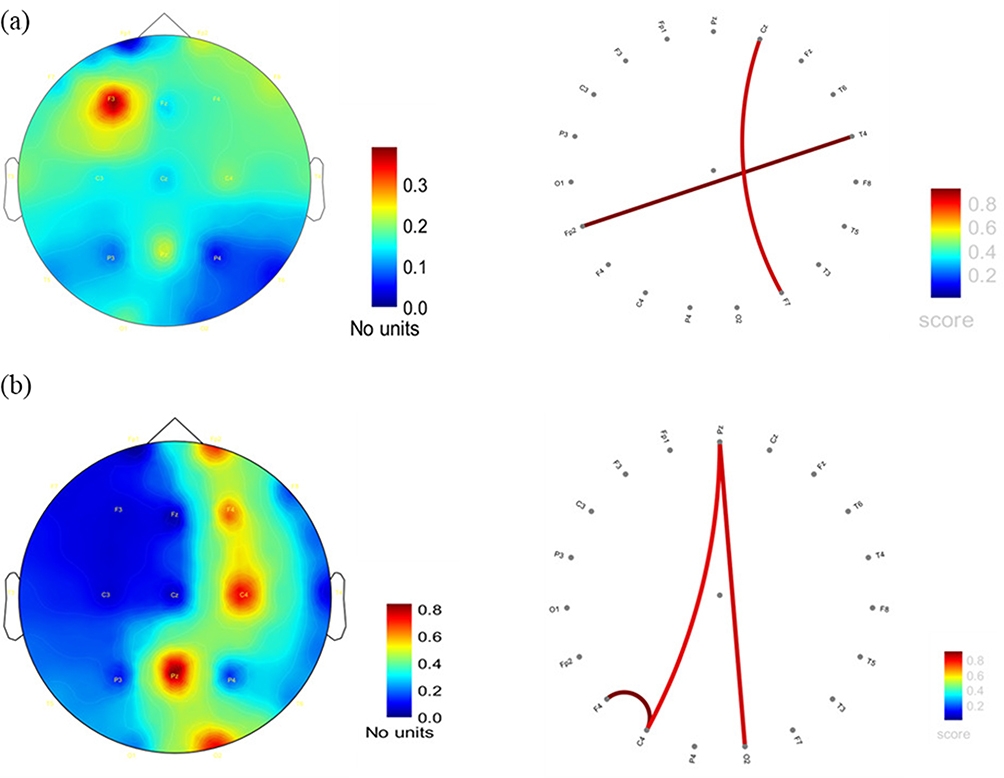 |
Figure 7 Topographic maps and functional connectivity of the relative PSD in the beta frequency band for (A) AD group and (B) the HC group on 19 EEG channels. Meanwhile, the electrodes showing strong coherence-based functional connections are in red: Fp2, T4, Cz, F7, Pz, O2, F4, and C4, as they have relatively high PSD values. The threshold used for this identification is set at 0.2. When the coherence value between two electrodes exceeds 0.2, connectivity in the red line exists. Abbreviations: AD, Alzheimer’s disease; HC, healthy controls; P-value, probability; ANOVA, ANOVA, analysis of variance. Notes: The color scale used in the representation indicates the standardized uptake value ratio (SUVR), where blue to red shades indicate areas with higher connectivity retention. |
Discussion
In this study, we analyzed the rEEG signals for EOR and ECR from 265 patients diagnosed with AD and compared them to EEG signals from the 269 in the HC group. Many studies have demonstrated that EEG analysis has the potential to provide valuable insights into the disrupted brain functions observed in patients with AD.20,37,38 This study analyzed the relative PSD and functional connectivity derived from coherence to access the spectrum and synchrony abnormalities in patients with AD. The PSD of EEG has been widely applied to show brain activity in different regions,18,39 and coherence measures the level of synchronization between two specific cortical areas of the brain but in the frequency domain.20,21,40,41
As for spectrum analysis, it was observed that AD patients showed significant differences in relative PSD between EOR and ECR values compared to HC (Table 1). Specifically, AD patients showed higher PSD values in the delta and theta frequency bands while having lower PSD values in the alpha, beta, and gamma frequency bands than the HC group. The significant difference in relative PSD between EOR and ECR state for AD and HC groups is shown in Figure 5. Additionally, our results suggest that there is also a significant increase in the functional connectivity of EOR and ECR states in AD in comparison to the HC group in the beta frequency band Figure 8, with the spectrum changes in different brain regions of EOR-ECR. The frontal, central, temporal, and parietal areas showed significant differences between HC and AD groups (Table 4).
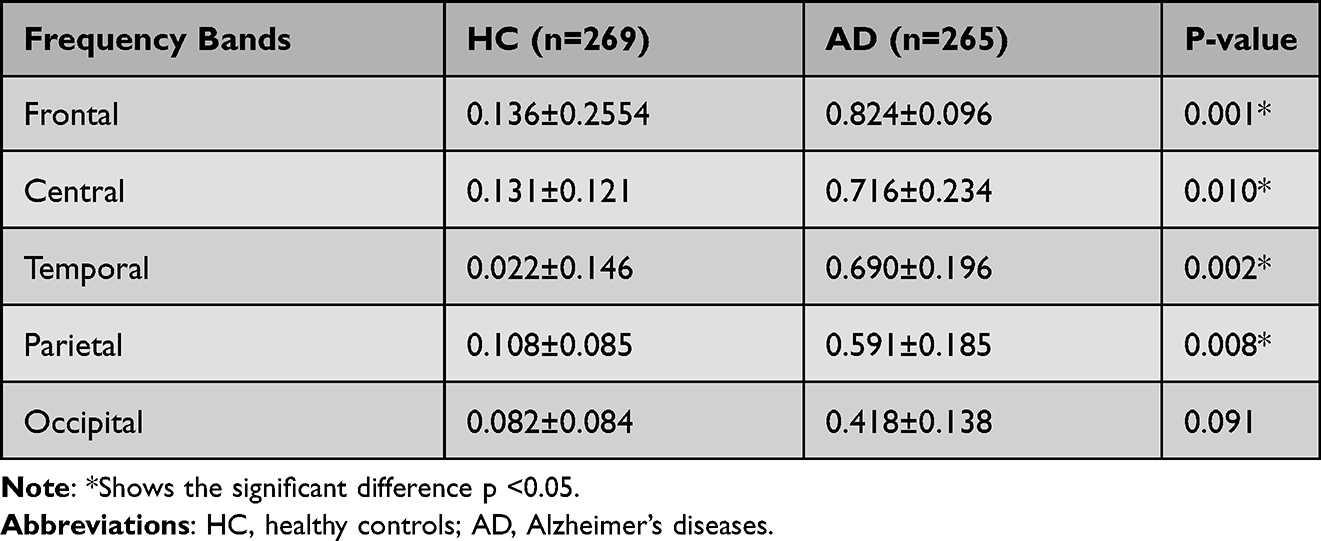 |
Table 4 Relative Power of Beta Frequency Band According to the Brain Region |
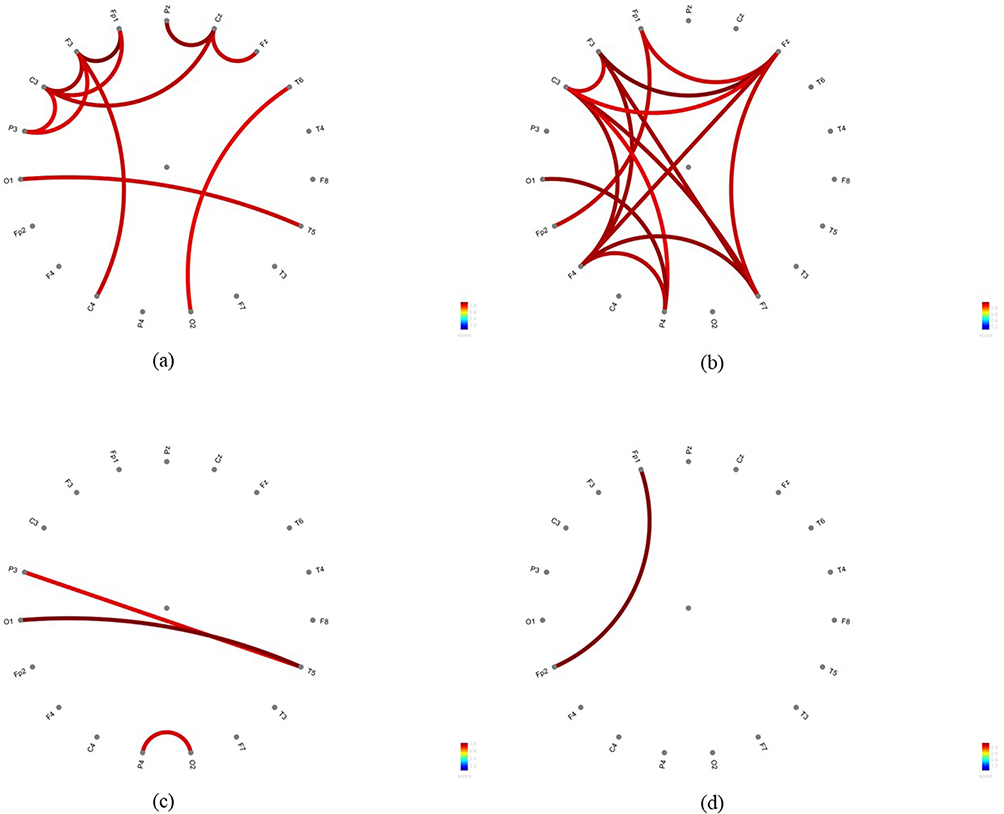 |
Figure 8 Functional connectivity of the relative PSD in the beta frequency band for (a) EOR state (AD); (b) ECR state (AD); (c) EOR state (HC); (d) ECR state (HC). Abbreviations: PSD, power spectrum density; AD, Alzheimer’s disease; EOR, eyes-open resting; ECR, eyes-closed resting; HC, healthy controls. Notes: The color scale used in the representation indicates the standardized uptake value ratio (SUVR), where blue to red shades indicate areas with higher connectivity retention. |
Based on the findings from Elgendi et al42 and Vecchio et al,43 it can be inferred that the relative PSD is directly related to the distribution of power or energy across frequency components of EEG signal in the brain. Individuals with AD showed significantly slower physiological activity in their brains. The observed abnormalities may arise from two distinct underlying physiological changes: First, the reduction in PSD for higher frequencies might indicate disruptions in the connections between regions of the cerebral cortex. Second, the increase in PSD for lower frequencies could be attributed to the diminished impact of subcortical cholinergic structures on cortical electrical activity.25,44,45 The degeneration of cholinergic neurons in the basal forebrain projecting to the hippocampus and neocortex may play an essential role in this process.46 A study observed increased relative PSD values within the delta and theta frequency bands for AD patients. At the same time, there was a notable significant decrease in the beta frequency band in the central and parietal regions.47 From a global perspective, a reduction of beta reactivity is associated with poorer memory performance.20 Thus, this study focused on the beta frequency band, which showed a significant difference between the two groups. This specific frequency band was chosen better understand the brain abnormalities of individuals with AD. Our results align with previous studies demonstrating spectral “slowing” in AD patients.20,26,48 In a study conducted by Jeong et al,25 patients with AD experienced a slowing in their rEEG patterns. Dauwels et el.20 further demonstrated that AD showed heightened activity in the delta and theta frequency ranges while reduced activity in the alpha and beta frequency ranges. The increase in theta power typically occurs in the initial phase of AD, while the decrease in alpha frequency is considered a feature of the advanced stage of the disease.49
Similarly, Fernandez et al50 reached a comparable conclusion by analyzing spontaneous magnetoencephalography (MEG) signals. However, van Deursen et al51 observed different patterns. Instead of increased oscillations in the gamma frequency band in AD patients, there was a slight decrease in the relative PSD within the gamma frequency range, similar to our observations.
It is generally accepted that there are three significant changes in the EEG patterns within the brain affected by AD. (1) EEG slowing refers to a change in the brain’s electrical activity with a noticeable shift towards lower frequency bands, specifically the delta and theta bands. At the same time, there is a reduction in oscillations in the high-frequency bands, such as alpha and beta waves. (2) There is a decrease in complexity related to the slowing of EEG activity, and (3) decreased synchrony, from which a functional network can be extracted.20,41 Notably, AD has been characterized as a disconnection syndrome, indicating that anatomical irregularities among various cortical regions significantly impact the brain’s functional interactions.51 Recently, numerous research studies have been conducted to investigate functional networks and their potential dysconnectivity in AD using neurophysiological signals.41,52,53 Previous studies suggested that AD is associated with transitioning from a small-world network to less efficient patterns in the brain.54,55 Our findings also support this concept. We discovered that the difference between EOR and ECR states in AD patients showed a notable decrease in functional connections between brain regions, particularly within the beta frequency band. This decline in functional connection could be linked to the physiological deficiencies in information processing characteristic of AD.29 Earlier EEG and MEG studies consistently reported decreased beta band synchronization.20,40,41,56 The main reason for the reduced synchrony might be from several factors, such as widespread degeneration of synapses and death of neurons, a broader impact of insufficient neurotransmitters, or a decrease in the connectivity of local neural networks due to nerve cell death.25,51
In contrast to earlier studies that reported a loss of synchrony in AD EEG, Gallego-Jutgla et al57 found different results for EEG synchrony in other frequency bands. Specifically, the EEG of AD patients was more synchronous than in healthy individuals within the optimized range of 5–6 Hz. These findings differ from the previous reports of decreased synchrony in AD EEG, highlighting the variability in results obtained from different frequency bands with this disease. Taken as a measure of synchrony, EEG coherence is commonly used as a linear metric to assess functional connectivity in the frequency domain. It represents the degree of communication between different brain regions, indicating their level of interaction and coordination.20,21,41 When coherence is higher, it signifies stronger synchrony between brain areas. This heightened synchrony indicates a robust functional connection between these specific brain regions. Consequently, there is an increase in the exchange of neural information, improved functional coordination, and enhanced integrity of cortical neural pathways in the brain’s physiology.20,58,59 Frequent reports of changes in beta band coherence have been observed in studies using conventional coherence to analyze EEG patients with AD.40,60
The varying outcomes could be attributed to three potential factors. First, the dissimilar composition of AD patient samples, including the distinction in sex, age, and the severity of the disease, as indicated by mini-mental state examination (MMSE) scores. Second, the different data types and data preprocessing steps. Lastly, the selection of different frequency bands in research methodologies.
The AD group had lower relative PSD and coherence than the control group, specifically in the beta frequency band. This decrease is particularly prominent in many brain regions. Suggesting that such alterations in brain activity may be associated with the cognitive dysfunction observed in AD subjects. Similar to the results obtained in our study, Spiegel et al61 also reported that individuals with cognitive impairment related to AD showed reduced power and coherence in the alpha/beta frequency range. However, they observed increased power and coherence in the delta/theta frequency range. Rossini et al62 successfully differentiated subjects with mild cognitive impairment (MCI) from those with AD by analyzing EEG power and coherence with high accuracy.
This study exclusively selected individuals with severe AD as the participants for comparison with the HC group. Patients with MCI or those in the moderate stage of AD were not included. Therefore, although our findings indicate that spectral and synchrony features may aid in distinguishing between AD patients and HC, it’s essential to recognize that these results are preliminary. Further research and validation on different types of dementia and population are required to draw definitive conclusions and establish the potential of these features in the discrimination of AD.
Conclusion
In this study, we examined the abnormalities in patients with AD by analyzing the relative PSD and coherence of EEG signals related to functional connectivity. Utilizing the Welch method for analyzing relative PSD, we observed that AD patients exhibited higher relative PSD in the delta frequency band but notably lower relative PSD in the beta frequency band compared to the HC group. Furthermore, we applied coherence analysis to investigate the degree of linear synchrony between electrode pairs, specifically within the beta frequency band, and there was a significant reduction in coherence among different brain regions in AD participants. We extracted the topographic maps and functional connectivity based on the coherence matrix, and there was a significant reduction in the connectivity between different brain regions in the AD group. Thus, the results observed in the beta frequency band of the AD brain, specifically in terms of relative PSD and functional connectivity derived from coherence matrices, have the potential to serve as a valuable indicator for effectively distinguishing AD patients from healthy individuals.
Abbreviations
EEG, Electroencephalogram; MEG, magnetoencephalography; HC, Healthy control; AD, Alzheimer’s disease; Aβ, Amyloid beta; p-tau, Phospho-tau; t-tau, Total-tau; CSF, Cerebrospinal fluid; MRI, Magnetic resonance imaging; PET, Positron emission tomography; PSD, power spectrum density; ANOVA, analysis of variance; MATLAB, Matrix laboratory; FFT, Fast Fourier Transform; qEEG, Quantitative electroencephalogram; sLORETA, low-resolution brain electromagnetic tomography; EOR, Eyes-open resting; ECR, Eyes-closed resting; HC, Healthy controls; MMSE, Mini-Mental State Examination; SD, Standard deviation; SNSB, Seoul Neuropsychological Screening Battery; ICA, Independent component analysis; ASR, Artifact subspace reconstruction; IDE, integrated development environment.
Ethics Approval and Consent to Participate
The study was conducted in accordance with the Declaration of Helsinki and approved by the Institutional Review Board of the Chung-Ang University Hospital (IRB No. C2012049). Informed consent was waived by the IRB of Chung-Ang University Hospital since this study was retrospective and blinding of the personal information in the data was performed. All methods were carried out in accordance with relevant guidelines and regulations.
Acknowledgments
This research was supported by the Chung-Ang University Young Scientist Scholarship in 2021, and we thank the Department of Neurology at Chung-Ang University Hospital for providing the necessary tools to make this research successful.
Author Contributions
All authors made a significant contribution to the work reported, whether that is in the conception, study design, execution, acquisition of data, analysis and interpretation, or in all these areas; took part in drafting, revising, or critically reviewing the article; gave the final approval of the version to be published; have agreed on the journal to which the article has been submitted; and agree to be accountable for all aspects of the work.
Funding
This research was supported by the Chung-Ang University Young Scientist Scholarship in 2021 and the publication costs, design of the study, data management and writing the manuscript for this article were supported by the Ministry of Education of the Republic of Korea and the National Research Foundation of Korea (Project Number: NRF-2017S1A6A3A01078538).
Disclosure
The authors declare that they have no competing interests in this work.
References
1. Snyder SM, Hall JR, Cornwell SL, Falk JD. Addition of EEG improves accuracy of a logistic model that uses neuropsychological and cardiovascular factors to identify dementia and MCI. Psychiatry Res. 2011;186(1):97–102. doi:10.1016/j.psychres.2010.04.0582
2. Al-Qazzaz NK, Ali SH, Ahmad SA, Chellappan K, Islam MS, Escudero J. Role of EEG as biomarker in the early detection and classification of dementia. Sci World J. 2014;2014:906038. doi:10.1155/2014/906038
3. Koberda JL, Moses A, Koberda P, Koberda L. Clinical advantages of quantitative electroencephalogram (QEEG)-electrical neuroimaging application in general neurology practice. Clin EEG Neurosci. 2013;44(4):273–285. doi:10.1177/155005941247529116
4. Jennings JL, Peraza LR, Baker M, Alter K, Taylor JP, Bauer R. Investigating the power of eyes open resting state EEG for assisting in dementia diagnosis. Alzheimers Res Ther. 2022;14(1):109. doi:10.1186/s13195-022-01046-z
5. DeTure MA, Dickson DW. The neuropathological diagnosis of Alzheimer’s disease. Mol Neurodegener. 2019;14(1):32. doi:10.1186/s13024-019-0333-54
6. Mayeux R, Stern Y. Epidemiology of Alzheimer disease. Cold Spring Harb Perspect Med. 2012;2(8):a006239. doi:10.1101/cshperspect.a006239
7. Duong S, Patel T, Chang F. Dementia: what pharmacists need to know. Can Pharma J. 2017;150(2):118–129. doi:10.1177/1715163517690745
8. Banerjee D, Muralidharan A, Hakim Mohammed AR, Malik BH. Neuroimaging in dementia: a brief review. Cureus. 2020;12(6):e8682. doi:10.7759/cureus.8682
9. Wang MJ, Yi S, Han JY, et al. Oligomeric forms of amyloid-β protein in plasma as a potential blood-based biomarker for Alzheimer’s disease. Alzheimers Res Ther. 2017;9(1):98. doi:10.1186/s13195-017-0324-0
10. Hampel H, O’Bryant SE, Molinuevo JL, et al. Blood-based biomarkers for Alzheimer disease: mapping the road to the clinic. Nat Rev Neurol. 2018;14(11):639–652. doi:10.1038/s41582-018-0079-7
11. Decarli C, DeKosky ST, Leon MJ, et al. The use of MRI and PET for clinical diagnosis of dementia and investigation of cognitive impairment: a consensus report. Alzheimer’s Assoc Chicago. 2004;1:1–5.
12. Ferreira D, Jelic V, Cavallin L, et al. Electroencephalography is a good complement to currently established dementia biomarkers. Dement Geriatr Cogn Disord. 2016;42(1–2):80–92. doi:10.1159/00044839410
13. Louis EK S, Frey LC, Britton JW, et al. Electroencephalography (EEG): An Introductory Text and Atlas of Normal and Abnormal Findings in Adults, Children, and Infants. American Epilepsy Society; 2016.
14. Komolovaitė D, Maskeliūnas R, Damaševičius R. Deep convolutional neural network-based visual stimuli classification using electroencephalography signals of healthy and Alzheimer’s disease subjects. Life. 2022;12(3):374. doi:10.3390/life12030374
15. Henderson G, Ifeachor E, Hudson N, et al. Development and assessment of methods for detecting dementia using the human electroencephalogram. IEEE Trans Biomed Eng. 2006;53(8):1557–1568. doi:10.1109/TBME.2006.878067
16. Amo C, De santiago L, Barea R, López-Dorado A, Boquete L. Analysis of gamma-band activity from human EEG using empirical mode decomposition. Sensors. 2017;17(5):989. doi:10.3390/s17050989
17. Algin DI, Adapinar DO, Erdinc OO. EEG biomarker for Alzheimer’s disease. Neurodegenerative Dis. 2020. doi:10.5772/intechopen.93711
18. Wang R, Wang J, Yu H, Wei X, Yang C, Deng B. Power spectral density and coherence analysis of Alzheimer’s EEG. Cogn Neurodyn. 2015;9(3):291–304. doi:10.1007/s11571-014-9325-x
19. Nunez PL, Wingeier BM, Silberstein RB. Spatial-temporal structures of human alpha rhythms: theory, microcurrent sources, multiscale measurements, and global binding of local networks. Hum Brain Mapp. 2001;13(3):125–164. doi:10.1002/hbm.1030
20. Dauwels J, Vialatte F, Cichocki A. Diagnosis of Alzheimer’s disease from EEG signals: where are we standing? Curr Alzheimer Res. 2010;7(6):487–505. doi:10.2174/156720510792231720
21. Pereda E, Quiroga RQ, Bhattacharya J. Nonlinear multivariate analysis of neurophysiological signals. Prog Neurobiol. 2005;77(1–2):1–37. doi:10.1016/j.pneurobio.2005.10.003
22. Di Y, An X, Zhong W, Liu S, Ming D. The Time-Robustness Analysis of Individual Identification Based on Resting-State EEG. Front Hum Neurosci. 2021;15:672946. doi:10.3389/fnhum.2021.672946
23. Alkan A, Kiymik MK. Comparison of AR and Welch methods in epileptic seizure detection. J Med Syst. 2006;30(6):413–419. doi:10.1007/s10916-005-9001-0
24. Gianotti LR, Künig G, Lehmann D, et al. Correlation between disease severity and brain electric LORETA tomography in Alzheimer’s disease. Clin Neurophysiol. 2007;118(1):186–196. doi:10.1016/j.clinph.2006.09.007
25. Jeong J. EEG dynamics in patients with Alzheimer’s disease. Clin Neurophysiol. 2004;115(7):1490–1505. doi:10.1016/j.clinph.2004.01.001
26. Czigler B, Csikós D, Hidasi Z, et al. Quantitative EEG in early Alzheimer’s disease patients - power spectrum and complexity features. Int J Psychophysiol. 2008;68(1):75–80. doi:10.1016/j.ijpsycho.2007.11.002
27. Bennys K, Rondouin G, Vergnes C, Touchon J. Diagnostic value of quantitative EEG in Alzheimer’s disease. Neurophysiol Clin. 2001;31(3):153–160. doi:10.1016/s0987-7053(01)00254-4
28. Schreiter-Gasser U, Gasser T, Ziegler P. Quantitative EEG analysis in early onset Alzheimer’s disease: correlations with severity, clinical characteristics, visual EEG and CCT. Electroencephalogr Clin Neurophysiol. 1994;90(4):267–272. doi:10.1016/0013-4694(94)90144-9
29. Delbeuck X, Van der Linden M, Collette F. Alzheimer’s disease as a disconnection syndrome? Neuropsychol Rev. 2003;13(2):79–92. doi:10.1023/a:1023832305702
30. Tijms BM, Wink AM, de Haan W, et al. Alzheimer’s disease: connecting findings from graph theoretical studies of brain networks. Neurobiol Aging. 2013;34(8):2023–2036. doi:10.1016/j.neurobiolaging.2013.02.020
31. Babiloni C, Lizio R, Vecchio F, et al. Reactivity of cortical alpha rhythms to eye opening in mild cognitive impairment and Alzheimer’s disease: an EEG study. J Alzheimers Dis. 2010;22(4):1047–1064. doi:10.3233/JAD-2010-100798
32. van Straaten EC, Scheltens P, Gouw AA, Stam CJ. Eyes-closed task-free electroencephalography in clinical trials for Alzheimer’s disease: an emerging method based upon brain dynamics. Alzheimers Res Ther. 2014;6(9):86. doi:10.1186/s13195-014-0086-x
33. Pascual-Marqui RD. Standardized low-resolution brain electromagnetic tomography (sLORETA): technical details. Methods Find Exp Clin Pharmacol. 2002;24(Suppl D):5–12.
34. Güntekin B, Erdal F, Bölükbaş B, Hanoğlu L, Yener G, Duygun R. Alterations of resting-state Gamma frequency characteristics in aging and Alzheimer’s disease. Cogn Neurodyn. 2023;17(4):829–844. doi:10.1007/s11571-022-09873-4
35. Ahn HJ, Chin J, Park A, et al. Seoul Neuropsychological Screening Battery-dementia version (SNSB-D): a useful tool for assessing and monitoring cognitive impairments in dementia patients. J Korean Med Sci. 2010;25(7):1071–1076. doi:10.3346/jkms.2010.25.7.1071
36. Shim YS, Shin HE. Analysis of neuropsychiatric symptoms in patients with Alzheimer’s disease using quantitative EEG and sLORETA. Neurodegener Dis. 2020;20(1):12–19. doi:10.1159/000508130
37. Hidasi Z, Czigler B, Salacz P, Csibri E, Molnár M. Changes of EEG spectra and coherence following performance in a cognitive task in Alzheimer’s disease. Int J Psychophysiol. 2007;65(3):252–260. doi:10.1016/j.ijpsycho.2007.05.002
38. Jelles B, Scheltens P, van der Flier WM, Jonkman EJ, da Silva FH, Stam CJ. Global dynamical analysis of the EEG in Alzheimer’s disease: frequency-specific changes of functional interactions. Clin Neurophysiol. 2008;119(4):837–841. doi:10.1016/j.clinph.2007.12.002
39. Jeong HT, Youn YC, Sung HH, Kim SY. Power Spectral Changes of Quantitative EEG in the Subjective Cognitive Decline: comparison of Community Normal Control Groups. Neuropsychiatr Dis Treat. 2021;17:2783–2790. doi:10.2147/NDT.S320130
40. Koenig T, Prichep L, Dierks T, et al. Decreased EEG synchronization in Alzheimer’s disease and mild cognitive impairment. Neurobiol Aging. 2005;26(2):165–171. doi:10.1016/j.neurobiolaging.2004.03.008
41. Stam CJ, van der Made Y, Pijnenburg YA, Scheltens P. EEG synchronization in mild cognitive impairment and Alzheimer’s disease. Acta Neurol Scand. 2003;108(2):90–96. doi:10.1034/j.1600-0404.2003.02067
42. Elgendi M, Vialatte F, Cichocki A, Latchoumane C, Jeong J, Dauwels J. Optimization of EEG frequency bands for improved diagnosis of Alzheimer disease. Annu Int Conf IEEE Eng Med Biol Soc. 2011;2011:6087–6091. doi:10.1109/IEMBS.2011.6091504
43. Vecchio F, Babiloni C, Lizio R, et al. Resting state cortical EEG rhythms in Alzheimer’s disease: toward EEG markers for clinical applications: a review. Suppl Clin Neurophysiol. 2013;62:223–236. doi:10.1016/b978-0-7020-5307-8.00015-6
44. Molnár M, Csuhaj R, Horváth S, et al. Spectral and complexity features of the EEG changed by visual input in a case of subcortical stroke compared to healthy controls. Clin Neurophysiol. 2006;117(4):771–780. doi:10.1016/j.clinph.2005.12.022
45. Moretti DV, Fracassi C, Pievani M, et al. Increase of theta/gamma ratio is associated with memory impairment. Clin Neurophysiol. 2009;120(2):295–303. doi:10.1016/j.clinph.2008.11.012
46. Dringenberg HC. Alzheimer’s disease: more than a ‘cholinergic disorder’ - evidence that cholinergic-monoaminergic interactions contribute to EEG slowing and dementia. Behav Brain Res. 2000;115(2):235–249. doi:10.1016/s0166-4328(00)00261-8
47. Holschneider DP, Leuchter AF. Beta activity in aging and dementia. Brain Topogr. 1995;8(2):169–180. doi:10.1007/BF01199780
48. van der Hiele K, Vein AA, Reijntjes RH, et al. EEG correlates in the spectrum of cognitive decline. Clin Neurophysiol. 2007;118(9):1931–1939. doi:10.1016/j.clinph.2007.05.070
49. Ponomareva NV, Selesneva ND, Jarikov GA. EEG alterations in subjects at high familial risk for Alzheimer’s disease. Neuropsychobiology. 2003;48(3):152–159. doi:10.1159/000073633
50. Fernández A, Hornero R, Mayo A, Poza J, Gil-Gregorio P, Ortiz T. MEG spectral profile in Alzheimer’s disease and mild cognitive impairment. Clin Neurophysiol. 2006;117(2):306–314. doi:10.1016/j.clinph.2005.10.017
51. van Deursen JA, Vuurman EF, Verhey FR, van Kranen-Mastenbroek VH, Riedel WJ. Increased EEG gamma band activity in Alzheimer’s disease and mild cognitive impairment. J Neural Transm. 2008;115(9):1301–1311. doi:10.1007/s00702-008-0083-y
52. Jelles B, van Birgelen JH, Slaets JP, Hekster RE, Jonkman EJ, Stam CJ. Decrease of non-linear structure in the EEG of Alzheimer patients compared to healthy controls. Clin Neurophysiol. 1999;110(7):1159–1167. doi:10.1016/s1388-2457(99)00013-9
53. He Y, Chen Z, Gong G, Evans A. Neuronal networks in Alzheimer’s disease. Neuroscientist. 2009;15(4):333–350. doi:10.1177/1073858409334423
54. Joudaki A, Salehi N, Jalili M, Knyazeva MG. EEG-based functional brain networks: does the network size matter? PLoS One. 2012;7(4):e35673. doi:10.1371/journal.pone.0035673
55. Supekar K, Menon V, Rubin D, Musen M, Greicius MD. Network analysis of intrinsic functional brain connectivity in Alzheimer’s disease. PLoS Comput Biol. 2008;4(6):e1000100. doi:10.1371/journal.pcbi.1000100
56. Knott V, Mohr E, Mahoney C, Ilivitsky V. Electroencephalographic coherence in Alzheimer’s disease: comparisons with a control group and population norms. J Geriatr Psychiatry Neurol. 2000;13(1):1–8. doi:10.1177/089198870001300101
57. Gallego-Jutglà E, Elgendi M, Vialatte F, et al. Diagnosis of Alzheimer’s disease from EEG by means of synchrony measures in optimized frequency bands. Annu Int Conf IEEE Eng Med Biol Soc. 2012;2012:4266–4270. doi:10.1109/EMBC.2012.6346909
58. Lizio R, Vecchio F, Frisoni GB, Ferri R, Rodriguez G, Babiloni C. Electroencephalographic rhythms in Alzheimer’s disease. Int J Alzheimers Dis. 2011;2011:927573. doi:10.4061/2011/927573
59. Koelewijn L, Bompas A, Tales A, et al. Alzheimer’s disease disrupts alpha and beta-band resting-state oscillatory network connectivity. Clin Neurophysiol. 2017;128(11):2347–2357. doi:10.1016/j.clinph.2017.04.018
60. Young-Min P, Hee-Jae C, Chang-Hwan I, Hyung-Tae J, Sung-Man B, Seung-Hwan L. Decrease EEG synchronization and its correlation with symptom severity in Alzheimer’s disease. Neurosci Res. 2008;62(2008):112–117.
61. Spiegel A, Tonner PH, Renna M. Altered states of consciousness: processed EEG in mental disease. Best Pract Res Clin Anaesthesiol. 2006;20(1):57–67. doi:10.1016/j.bpa.2005.07.010
62. Rossini PM, Del Percio C, Pasqualetti P, et al. Conversion from mild cognitive impairment to Alzheimer’s disease is predicted by sources and coherence of brain electroencephalography rhythms. Neuroscience. 2006;143(3):793–803. doi:10.1016/j.neuroscience.2006.08.049
 © 2023 The Author(s). This work is published and licensed by Dove Medical Press Limited. The full terms of this license are available at https://www.dovepress.com/terms.php and incorporate the Creative Commons Attribution - Non Commercial (unported, v3.0) License.
By accessing the work you hereby accept the Terms. Non-commercial uses of the work are permitted without any further permission from Dove Medical Press Limited, provided the work is properly attributed. For permission for commercial use of this work, please see paragraphs 4.2 and 5 of our Terms.
© 2023 The Author(s). This work is published and licensed by Dove Medical Press Limited. The full terms of this license are available at https://www.dovepress.com/terms.php and incorporate the Creative Commons Attribution - Non Commercial (unported, v3.0) License.
By accessing the work you hereby accept the Terms. Non-commercial uses of the work are permitted without any further permission from Dove Medical Press Limited, provided the work is properly attributed. For permission for commercial use of this work, please see paragraphs 4.2 and 5 of our Terms.