")
Back to Journals » International Journal of Nanomedicine » Volume 16
PU.1 Mimic Synthetic Peptides Selectively Bind with GATA-1 and Allow c-Jun PU.1 Binding to Enhance Myelopoiesis
Authors Raghav PK , Gangenahalli G
Received 22 January 2021
Accepted for publication 20 April 2021
Published 4 June 2021 Volume 2021:16 Pages 3833—3859
DOI https://doi.org/10.2147/IJN.S303235
Checked for plagiarism Yes
Review by Single anonymous peer review
Peer reviewer comments 2
Editor who approved publication: Professor Israel (Rudi) Rubinstein
Pawan Kumar Raghav, Gurudutta Gangenahalli
Division of Stem Cell and Gene Therapy Research, Institute of Nuclear Medicine and Allied Sciences (INMAS), Delhi, 110054, India
Correspondence: Gurudutta Gangenahalli
Division of Stem Cell and Gene-Therapy Research, Institute of Nuclear Medicine and Allied Sciences (INMAS), Delhi, 110054, India
Tel +91-11-23905144
Fax +91-11-23919509
Email [email protected]
Background: Hematopoietic stem cells’ commitment to myelopoiesis builds immunity to prevent infection. This process is controlled through transcription factor, especially Purine rich box 1 (PU.1) protein, which plays a central role in regulating myelopoiesis. The β 3/β 4 region of PU.1 accommodates a coactivator transcription factor, c-Jun, to activate myelopoiesis. However, an erythroid transcription factor, GATA-1, competes with c-Jun for the β 3/β 4 region, abolishing myelopoiesis and promoting erythropoiesis. This competitive regulation decides the hematopoietic stem cells’ commitment towards either erythroid or myeloid lineage.
Methods: Therefore, this study investigated the in vitro and in vivo effect of novel synthetic PU.1 β 3/β 4 mimic peptide analogs and peptide-loaded hydrophilic poly(D,L-lactide-co-glycolide) (PLGA) nanoparticles.
Results: The designed peptides significantly increase the expression of corresponding myeloid markers, specifically CD33 in vitro. However, the in vivo delivery of peptide-loaded PLGA nanoparticles, which have sustained release effect of peptides, increases 10.8% of granulocytes as compared to control.
Conclusion: The observations showed that the fabricated nanoparticles protected the loaded peptides from the harsh intracellular environment for a longer duration without causing any toxicity. These findings highlight the possibility to use these peptides and peptide-loaded nanoparticles to increase hematopoietic stem cell commitment to myeloid cells in case of opportunistic infection.
Keywords: nanoparticles, PU.1, GATA-1, peptide, myelopoiesis, erythropoiesis
Introduction
Immunity plays a major role to fight against diverse infectious diseases and each individual possesses a different immunity. Some pathogenic infections are cleared by host’s immunity, while some require boosting the immunity to fight against them.1 Thus, a strengthened immune system enriched with myeloid cells is needed, which can be accomplished by precise regulation of transcription factor (TF) such as Purine rich box 1 (PU.1) (31kDa), GATA-1 (42.7 kDa) and c-Jun (41.9 kDa).2
PU.1 is an ETS family TF, encoded by Spi-1 gene, that by binding to PU-box acts as a transcriptional activator involved in differentiation and activation of macrophages, dendritic cells and B-cells. It plays a significant role in early stages of precursor T-cell development and is an established antagonist of erythropoiesis.3 PU.1 protein levels within the hematopoietic stem cells (HSCs) are regulated by NF-κB signaling, activated by Tumor Necrosis Factor (TNF).4 Although, GATA-1 plays a major role in the later stages of erythropoiesis,2 more so in the development of hematopoietic precursor cells (HPCs) committed to the erythroid lineage, primarily through Scl–Gata2–Fli1 triad.5 Other coactivators that facilitate HPC development include Scl/TAL1, LDB1, and LMO2.6 The six isoforms of GATA (GATA 1 to 6) belong to dual zinc finger family, and GATA-1, GATA-2 and GATA-3 are involved with the regulation and development of HSCs. GATA-1-PU.1-GATA-2 transcription factors maintain a fine balance between the myeloid and erythroid lineages by competing for the same binding site over c-Jun.7 The c-Jun is a member of basic leucine zipper (bZIP) family of TFs, and a part of the activator protein-1 (AP-1) complex.7 It is a protooncogene observed to play multifarious roles in proliferation, apoptosis, tissue morphogenesis and also tumorigenesis.8 One of its important roles in development and expansion of HPCs, via the JNK pathway.9
The GATA-1 competes with c-Jun to bind at β3/β4 region (234–246 amino acids) of PU.1 (270 amino acids) present in the ETS C-terminal DNA binding domain (170–253 amino acids) to repress/antagonize PU.1 function.10 The basic tail region of C-terminal zinc (Zn) finger (CF-tail) (291–317 residues) (VNRPLTMRKDGIQTRNRKASGKGKKKR) of GATA-1 physically binds with PU.1 and displaces c-Jun to promote erythropoiesis. Although, c-Jun, an 18-residue sequence within its DNA-binding basic domain (257–276) (RKRMRNRIAASKCRKRKLER),11 binds with PU.1 that results in myelopoiesis. Thus, PU.1 is often described as a master regulator for myelopoiesis that enhances immunity against infections.12–17 However, limited evidence has reported such interaction among these molecules.18 Therefore, PU.1 facilitated myelopoiesis regulating molecules have not yet been identified, eliciting a dearth of PDB complex structures.19 Hence, the docking study is required to elucidate GATA-1-PU.1 and c-Jun-PU.1 molecular interaction, which would further be used to design PU.1 mimic molecule.
In this study, PU.1 mimetic novel peptides were designed and used to abolish erythropoiesis by binding with GATA-1, which also promotes myelopoiesis by allowing the binding of c-Jun with β3/β4 region of PU.1. The protein sequence comparison of GATA-1 and c-Jun reveals a high similarity between them. Initially, docking was employed to modulate the function of PU.1 by selective upregulation and relinquishing its potential to associate with GATA-1. The PU.1 docking identified the binding affinity for c-Jun and GATA-1, and hotspot residues involved in the interaction. Docking revealed that GATA-1 mediated repression of PU.1 could be abolished if the physical interaction between the two proteins is hindered. Therefore, mutated peptides of the β3/β4 region of PU.1 were generated in silico, which were considered to be specific for GATA-1 and expected to abrogate its binding with PU.1 without affecting c-Jun interaction. These mutated peptides were screened against both GATA-1 and c-Jun to identify GATA-1 specific potential peptide. The predicted binding affinity of each of these mutated peptides did not show much difference in the binding affinities between GATA-1 and c-Jun. Therefore, a scrambled peptide library of the β3/β4 region of PU.1 was generated and virtually screened to identify peptides with differential binding affinities for GATA-1 and c-Jun. This screening successfully identified potential peptides that possess a higher binding affinity for GATA-1 and lower for c-Jun. Subsequently, these peptides were synthesized, and later, functional assays were carried out to assess the potential effect of peptides. The fluorescence microscopy, confocal microscopy, and flow cytometry confirmed the intracellular localization and uptake of peptides within the cells. These peptides were found nontoxic as assessed using MTT assay. The increased expression of myeloid markers was evaluated in MO7e, KG1a, K562, and HL60 cells transfected with peptides, which confirmed cells’ commitment towards myeloid lineage. The expression of TFs that increases during myelopoiesis was also determined in peptide treated cells. Besides, nanoparticles of peptides (NPP) were synthesized and later characterized by DLS (Dynamic Light Scattering), SEM (Scanning Electron Microscope), AFM (Atomic Force Microscope), and TEM (Transmission Electron Microscope), which displayed its sustained release in the in vitro assays to increase the myelopoiesis. Also, cellular toxicity, cellular uptake, intracellular localization, assessment of myeloid expression, and in vivo studies of NPP were performed. The identification of these novel peptides would be drug-like candidates for enhancing selective myelopoiesis.
Materials and Methods
Protein Structure Preparation and Docking of GATA-1 and c-Jun with PU.1
The three-dimensional (3D) structures of PU.1, GATA-1, and c-Jun were obtained from the PDB database (https://www.rcsb.org/),20 and their PDB IDs are 1PUE (2.1 Å resolution X-ray structure),21 2GAT (NMR structure),22 and 1JNM (2.2 Å resolution X-ray structure), respectively. The SPDBv23 software was employed to clean all the PDBs, which removed the DNA chains and dimerized forms of PU.1 and c-Jun. Additionally, the removal of phosphate groups from the active site, water molecules, ligands, and repeated subunits, and addition of Kollman charges and polar hydrogens in 1PUE and 1JNM was performed using AutoDock Vina.24 Subsequently, all these PDBs were cross-checked in PyMOL25 to prevent any repeated subunits or any ligand and phosphate group in their active site. However, GATA-1 and c-Jun were considered a macromolecule and were treated as rigid while, PU.1 kept flexible for docking. Docking of PU.1 containing β3/β4 region with c-Jun was performed using AutoDock Vina with the grid of center_x: 3.8057, center_y: −5.6020, center_z: 13.8560, size_x: 32.3736, size_y: 39.8905, size_z: 59.1722 with spacing 0.375 Å. Nonetheless, GATA-1 (2GAT PDB) docking was performed with the grid of center_x: 7.8340, center_y: 54.4930, center_z: 42.0176, size_x: 17.1276, size_y: 17.9244, size_z: 20.8277 with spacing 0.375 Å. The superimposition of docking poses of GATA-1 and PU.1 complex, with c-Jun and PU.1 complex, identified the orientation of PU.1 binding with both c-Jun and GATA-1 using PyMOL.
Prediction of Mutations in the β3/β4 Region of PU.1 Their 3D Structures and Docking
The 17 residues, NYGKTGEVKKVKKKLTY (NYGKTGEVKKVKK represents the β3/β4 region, and KLTY represents four gatekeeping residues) were extracted from 236–252 amino acids of PU.1 PDB, 1PUE to predict the effect of a mutation in this region. Thus, PoPMuSiC (https://www.hsls.pitt.edu/obrc/index.php?page=URL1258139151) server26 was used to generate the mutations in the extracted peptide and predicted their stability and solvent accessibility. Subsequently, the 3D structure of mutated peptides was generated using PEP-FOLD (http://mobyle.rpbs.univ-paris-diderot.fr/cgi-bin/portal.py#forms::PEP-FOLD).27 PEP-FOLD was employed to predict the 3D structure of peptides from their amino acid sequences based on de novo approach using the Hidden Markov model with a coarse-grained force field and greedy algorithm. The docking of generated 3D structure with GATA-1 (2GAT, PDB containing 43–60 amino acids) and c-Jun (1JNM, PDB containing 254–285 amino acids) was performed using AutoDock Vina.
Designing of Scrambled Peptide Library of the β3/β4 Region Their 3D Structure Prediction and Optimization and Virtual Screening Against GATA-1 and c-Jun
The scrambled peptide library was generated based on PU.1 β3/β4 region (13 amino acids) extracted from PDB, 1PUE using a library designing tool, GenScript (http://www.genscript.com). This scrambled peptide library consisted of 80,000 peptides using all the permutation and combinations, C(n, r) = n!/r! (n-r)!. The following parameters were fixed to generate the library, such as 80,000 number of sequences as an output, the size of the library was ≤50, and length of the input sequence: 13 (NYGKTGEVKKVKK) at Molecular Weight, 1694.93802 Da. Among 80,000 peptides, 1% were selected randomly to generate 3D structures using the PEP-FOLD for virtual screening. Later, these 3D structures of peptides were subjected to energy minimization using SPDBv. The PyRx28 tool was employed for virtual screening of the 3D structure of scrambled peptides, which requires all of its input files in “pdbqt” format. Consequently, the protein and peptides were converted to pdbqt format using the Open Babel tool. Virtual screening was performed at centre_x: 3.8057, centre_y: −5.6020, centre_z: 13.8560, size_x: 32.3736, size_y: 39.8905, size_z: 59.1722 with a spacing of 0.375 Å for PU.1 scrambled library against c-Jun. Conversely, virtual screening for GATA-1 was performed at centre_x: 7.8340, centre_y: 54.4930, centre_z: 42.0176, size_x: 17.1276, size_y: 17.9244, size_z: 20.8277 with a spacing of 0.375 Å. The screened peptides with lowest binding energy (B.E), Intermolecular HBonds, Desolvation energy, Electrostatic energy, and Van der Waal energy were selected for further analysis.
Measurement of Peptides Charge and Identification of Cleavage Sites
GenScript tool (http://www.genscript.com/tools.html) was used to compute the chemical formula, molecular weight, isoelectric point, charge, and attributes (acidic, basic, neutral, hydrophobicity, and hydrophilicity) of peptides. The PeptideCutter29 (http://web.expasy.org/peptide_cutter/) analyzed the cleavage sites to measure the stability of peptides. The parameter of Block size at 60 was selected for considering all the enzymes which might have possible cleavage sites. Additionally, the secondary structure content of peptides was predicted by STRIDE tool (http://webclu.bio.wzw.tum.de/stride/).30
Chemicals and Reagents
Peptides were customized and purchased as lyophilized acetate salts from GL Biochem (China). The purity of peptides was confirmed by HPLC using C18 (4.6×250 mm) column, with solvent 0.1% trifluoroacetic in 100% acetonitrile and 0.1% trifluoroacetic in 100% water at a flow rate of 1.0mL/min for 220nm. Later, the presence of peptides was detected by mass spectrometry using Electrospray Ionization (ESI) probe with +4.5kv bias, 1.5L/min nebulizer gas flow, 1.5kv detector, −20.0v CDL, 250°C CDL, and 200°C block temperature. The N-terminal of each peptide was labeled with fluorescein isothiocyanate (FITC) to perceive the localization of peptides in the cells for uptake and functional studies. The synthesized FITC labeled peptides were obtained as without cell penetrating peptide (CPP), (FITC-NVEYKKKVTGGKK (P1), FITC-EKKGKYKKNVVGT (P2), and FITC-NYGKTGEVKKVKK (P3)), and with CPP (FITC-NVEYKKKVTGGKK-RRRRRRRRRRRR (P4), FITC-EKKGKYKKNVVGT-RRRRRRRRRRRR (P5), and FITC-NYGKTGEVKKVKK-RRRRRRRRRRRR (P6)). These peptides were obtained as 5mg approximate weight dissolved in Milli-Q-water and stored at −20°C as aliquots. Cell culture media RPMI1640 and IMDM were purchased from MP Biomedicals and Sigma Aldrich, respectively. The cell lines, KG1a, K562, and HL60 were purchased from National Centre for Cell Sciences (NCCS), Pune, India. Also, MO7e cells were obtained as a kind gift from Dr. Paulo de Sepulveda, INSERM scientist, Institute National de la Santé et de la Recherche Médicale, France. The Fetal Bovine Serum (FBS) of Gibco was purchased from Invitrogen, and plasticwares used for the experiments were from BD. The antibodies used in this study were purchased from their respective companies such as Anti-CD33-PE/Cy5.5 (Abcam; ab51530), anti-CD11B (BD), anti-CD116-PE (BD), anti-CD114-PE (BD), PU.1 (Rabbit polyclonal IgG1; Santa Cruz Biotechnology), c-Jun (Rabbit polyclonal IgG1), GATA-1 (goat polyclonal IgG1), C/EBPα (goat polyclonal IgG1; Santa Cruz Biotechnology). The following secondary antibodies used were purchased: anti-mouse IgG-PE (Santa Cruz Biotechnology), anti-rabbit IgG1-PE (Santa Cruz Biotechnology), and anti-goat IgG1-PE (Santa Cruz Biotechnology). The cytokines, SCF, G-CSF, GM-CSF, and IL-3 were purchased from Sigma Aldrich. Progenitor HSCs isolated from bone marrow were purchased from Lonza. PrestoBlue reagent was purchased from Invitrogen, and MTT from Sigma Aldrich chemicals, MethoCult H4435 methylcellulose from StemCell Technologies, the antibiotic and antimycotic solution from HiMedia, India. The Milli-Q with a resistance of 18.2 MΩ.cm from the Milli-Q system (Merck Millipore) attached with a 0.22µ PVDF membrane filter was used to dissolve the peptides and nanoparticles. Biodegradable Poly(D,L-Lactide-co-glycolide)-lactide:glycolide (PLGA), mol. wt. 30,000–60,000 (50:50 lactide:glycolide, MW 30,000–60,000) was purchased from Sigma Aldrich Chemicals (P2191-1G). The organic solvent, ethyl acetate (EA HPLC grade) purchased from Aldrich Chemicals. The stabilizer, poly (vinyl alcohol) (PVA, MW 9000–10,000, 80% hydrolyzed), was purchased from Aldrich Chemicals.
Cell Culture
KG1a (promyeloblast, macrophage) and K562 (lymphoblast) cells in IMDM medium, and MO7e (megakaryoblastic) and HL60 (promyeloblast) suspension cells in RPMI1640 medium were cultured in 100mm petri dishes and incubated at 37°C and 5% CO2. The KG1a cells were cultured in 20% FBS, whereas K562, HL60, and MO7e cells in 10% FBS containing 1% of 100× antibiotic and antimycotic solution, which includes 10,000 U Penicillin, 10mg Streptomycin, and 25µg Amphotericin B per mL in 0.9% normal saline (#A002, HiMedia, India). Besides, MO7e cells were cultured with 10ng/mL SCF. All the cells were visualized microscopically to confirm cells’ viability after 24h of incubation except MO7e after 40h.
Circular Dichroism (CD) of Peptides
The CD spectrum of peptides was acquired in the ultraviolet (UV) wavelength between 250 to 190 nm at 20.1°C, using the JASCO-CD Polarimeter, J-815 (150-S) spectrophotometer.31 The spectra with three accumulations were recorded at a 1.0nm data pitch, 61 data point, 1nm bandwidth, 1sec response time, and a 100nm/min scan speed. The CD measurement of each peptide was carried out at a concentration of 0.5%. The CD spectra were used to determine the ellipticity and secondary structure (α-helix, beta (β), turns, and random) content of peptides. The 310-helix indicated an α-helix, β signifies β-sheets, the bends named as turns, and the single residues assigned as random were grouped as disordered. The secondary-structure contents of six peptides in solution were assessed from the CD spectra using the SELCON3 program.
Cellular Uptake of Peptides and NPP Characterization by Flow Cytometry
The peptides and NPP uptake into the cells were assessed using flow cytometry. The 2.5×10⁵ KG1a, K562, MO7e, and HL60 cells were seeded per well onto a 24-well plate for treatment of peptides and incubated for 24h except for MO7e, 40h. Similarly, the same procedure was also used for the treatment of NPP except for HL60 cells/mL seeded at a density of 1×10⁵. The FITC-labeled peptides at 5µg and NPP at 5µg/mL were incubated with the cells for 1h at 37°C in the dark. Later, cells were washed thrice with ice-cold PBS to remove excess extracellular complexes, adsorbed, and free particles. Afterward, the cells were treated with trypsin (1mg/mL) for 10mins at 4°C to remove any peptides or nanoparticles bound to the cell surface. Subsequently, the cells were rewashed with ice-cold PBS thrice and centrifuged at 300xg (Spinwin, Tarson) for 5mins. Afterward, the cells were processed for flow cytometry and analyzed samples at a rate of 10,000 events/sample by LSRII Becton Dickinson (BD) flow cytometer to measure the fluorescence intensity. Flow cytometry data analysis was carried out using flowing software (https://bioscience.fi/services/cell-imaging/flowing-software/).32
Detection of Intracellular Localization of Peptides and NPP
The intracellular localization of peptides in MO7e and KG1a cells and NPP in HL60 cells was investigated using fluorescence and confocal microscopy. These cells were seeded in a 24-well plate at a density of 2×10⁵ and grown overnight, then incubated for 1h with 5µg of FITC labeled peptide and 10µL of NPP for 24h. The cells were harvested and centrifuged to remove the culture medium, followed by washing and centrifugation; the pellet was treated with 1% trypsin to remove cell membrane-bound peptides. Later, cells were pelleted and were washed thrice with PBS and fixed for 10mins at room temperature (RT) in 4% paraformaldehyde (PFA). Afterward, the cells were mounted on microscope slides with an anti-fading agent (prolong gold antifade reagent with DAPI) in the dark. The distribution of FITC (peptides only or NPP) and DAPI (for nucleus staining) was analyzed using a fluorescence microscope with an appropriate filter set at 40× magnification (Axio Imager M2, Zeiss, Germany). Additionally, Leica confocal microscope equipped with 40x and 100x objectives was used to detect peptide localization.
Cell Viability
The peptides and NPP toxicity to cells were assessed using MTT cell viability assay. The concentration of peptide at 5µg was used to access cell viability using MTT because of efficient cellular uptake shown by flow cytometry. Moreover, the viability of NPP (5µg) treated HL60 cells was measured using the PrestoBlue dye (Invitrogen). The KG1a and K562 cells in 100µL IMDM supplemented with 20% and 10% FBS, respectively, were seeded in 96 wells plate at a density of 2.5×10⁴ cells/well in triplicates and incubated for 24h. However, MO7e (supplemented with 10ng/mL SCF) and HL60 cells in 100µL of RPMI supplemented with 10% FBS were seeded and incubated at 37°C with 5% CO2 for 40h and 24h, respectively. Afterward, MTT was added and incubated for 2h and followed by DMSO addition for another 2h followed by absorbance measured by a spectrophotometer (BioTek Instruments, India) at 570nm, and 690nm (reference λ). Besides, PrestoBlue reagent, 10µL was added to each well contained nanoparticle-treated cells, followed by incubation for 10mins and finally read the absorbance at 570nm, and reference at 600nm.
Determination of Myeloid Marker Expression
The flow cytometry analysis of myeloid marker expression was performed to evaluate the myelopoiesis on peptide treatment. Surface staining for CD33, CD116, CD114, and CD11B was performed for P1, P2, P3, P4, P5, and P6 treated KG1a, K562, MO7e, and HL60 cells. These treated cells were seeded in a 24-well plate at a density of 2.5×10⁵ cells/well incubated for 24h except MO7e for 40h. Likewise, HL60 cells treated with NPP were also given the same treatment as followed by peptide treated HL60 cells. Harvested cells were centrifuged, washed thrice, and fixed for 10mins in 4% PFA at RT followed by three washings with PBS and incubation in 100µL BSA on ice for 20mins to block Fc receptors. After incubation, cells were again washed with PBS and stained with anti-CD-PE (0.1µg) conjugated marker antibodies at 4°C for 1h. The cells were washed up to three times after antibody incubation and were subsequently analyzed by LSRII. The same procedure was also followed for progenitor bone marrow HSCs treated with P4, P5, and P6 peptides for 24h and subsequently stained with CD33-PE antibody for 1.5×10⁴ cells/well in a 48-well plate to evaluate the CD33 expression using flow cytometry.
Evaluation of Peptides Treatment for Expression of TFs
The TFs expression was assessed to evaluate the function of peptide treated cells in regulating TFs expression. The 2.5×10⁵ K562, KG1a, MO7e, and HL60 cells supplemented with 250µL media treated with P1, P2, P3, P4, P5, and P6 were seeded onto a 48-well plate. All the cells were harvested after incubation of 24h, except MO7e (40h), into microcentrifuge Eppendorf tubes and subsequently washed thrice with PBS. Afterwards, washed cells were fixed in 4% PFA in PBS containing 0.1% saponin and 0.5% Tween 20 for 30mins at 4°C. Fixed cells were spun at 500×g for 5mins and washed with 200µL permeabilization buffer (1% BSA, 0.01% sodium azide in PBS containing 0.5% tween 20 and 0.5% saponin) twice. Later, cells were resuspended using 75µL of permeabilization buffer and incubated for 30mins at 4°C. Later on, 0.1µg each of primary antibody of PU.1, c-Jun, GATA-1, and C/EBPα was added in 25µL permeabilization buffer for another 30mins on ice. Unbound primary antibodies were washed out with permeabilization buffer with three washes. Subsequently, 0.2µg of secondary antibody was added to the 100µL cell suspension in permeabilization buffer. The cells were incubated for another 30mins at 4°C in the dark and washed three times with 200µL permeabilization buffers. Further, cells were resuspended in staining buffer (1% BSA and 0.01% sodium azide in PBS) and acquired in a flow cytometer, LSRII.
Colony-Forming Assay
The HSCs differentiated into myeloid cell colonies in the presence of peptides, cytokines, and their combinations were evaluated using a colony-forming assay. A single-HSC suspension was obtained by pipetting the 300µL complete media in 2mL semi-solid MethoCult H4435 methylcellulose supplemented with 1% antibiotic and antimycotic solution. Subsequently, peptides alone (P4, P5, and P6) at 5µg/mL, cytokines alone (G-CSF, GM-CSF, and IL-3) at 10ng/mL, and the combination of peptides at 5µg/mL and cytokines at 10ng/mL (P4, G-CSF, GM-CSF, and IL-3; P5, G-CSF, GM-CSF, and IL-3; P6, G-CSF, GM-CSF, and IL-3) were added to the mixture. Each final mixture was allowed to stand for 5mins to eliminate air bubbles and seeded in a 24-well plate in triplicates. The HSCs suspension was seeded in a 24-well plate at a concentration of 2×10³ HSCs per well. On day 14, total CFU-GM colonies were counted and imaged using a Nikon camera attached with an inverted microscope (Olympus, Japan).
Fabrication of NPP
The nanoparticles of P1 (NPP1), nanoparticles of P2 (NPP2), nanoparticles of P3 (NPP3), nanoparticles of P4 (NPP4), nanoparticles of P5 (NPP5), and nanoparticles of P6 (NPP6) were synthesized using the nanoprecipitation method33,34 with slight modification. The organic phase was prepared by dissolving 10mg of PLGA and 50µg of each peptide in 1mL of ethyl acetate as an organic solvent. The organic phase was mixed well, using vortex (Bangalore Genei) and subsequently sonicated at 50 powers and 20 pulses for 1min with a probe-tip sonicator (Bandel In). The mixed organic phase was then added dropwise to make emulsion at the rate of 100uL/min into an aqueous phase containing a surfactant (PVA 2% dissolved in water as an aqueous solvent). The nanoparticle suspension was kept under continuous stirring at 300rpm for 3h at 4°C to allow the complete evaporation of ethyl acetate, leaving behind the colloidal suspension of peptide-PLGA-nanoparticles in the aqueous phase. The colloidal nanosuspension was centrifuged at 14,000rpm (Refrigerated high-speed centrifuge, REMI, India) for 30mins at 4°C to get the final nanoparticulate, containing pellet as an encapsulated peptide. The pellet was washed two times with MiliQ to remove adsorbed peptide from the surface of nanoparticles. Further, the nanoparticulate pellet was redispersed in 1mL Milli-Q to perform subsequent assays.
Calculation of Peptide Encapsulation Efficiency and Loading Percentage
The NPPs were centrifuged at 14,000rpm for 30mins at 4°C, then washed twice with MiliQ, and the supernatant was collected and stored at −20°C. The micro BCA protein assay was used to quantify peptides in the supernatant, and absorbance was measured at 570nm using a microplate reader (BioTek Instruments, India). Background readings were corrected by subtracting the optical density (OD) values of supernatants from PBS-encapsulated in PLGA-nanoparticles. The peptide load in nanoparticles was calculated based on the amount of peptide and PLGA in NPP. The peptide encapsulation efficiency (EE) and the peptide loading capacity (LC) were calculated using the established protocol.35
Characterization of NPP
DLS assessed the mean particle size and charge distribution, whereas SEM and TEM determined the morphology and exact size of the NPP, respectively. On the other hand, the smoothness and roughness of NPP were identified using AFM. The mean sizes and zeta potentials of NPP were measured using a Zetasizer Nano-ZS instrument (Malvern Instruments, UK). Each NPP sample was suspended in filtered Milli-Q, sonicated, and placed in two different disposable cuvettes for size and zeta potential measurements. Individual sample was measured three times and is reported as the mean of triplicates for the Zetasizer (diameter in nm) and zeta potential (mV). The measurement was conducted for at least three batches of NPP. The morphology, uniformity, shape, and size36 of NPP were assessed using SEM (Carl Zeiss AG-SUPRA 55VP). The NPP were mounted on metal pegs using conductive double-sided tape and sputter coated with a gold layer before the examination. The exact size of each NPP was assessed using high-resolution TEM (Technai G2T30, U-Twin (FEI, Netherland)). One drop of each NPP was sufficiently deposited on the separate carbon-coated copper grid (200 mesh). The grids were allowed to dry for 10min before microscopy analysis. AFM was used to image the shape and size of the nanoparticles prepared by the nanoprecipitation method. A drop (10µL) of each of PLGA-alone and PLGA-peptides nanoparticles was deposited on a glass slide of 1cm2 mica surface and dried under the vacuum for 2h before being scanned. The measurements were performed using a commercial AFM (Agilent 5600 LS system) at RT in tapping mode (frequency= 5 kHz) and 2000-pixel × 2000-pixel format. The AFM images in a large scanning area were processed, and morphological analysis was performed in a dynamic mode in two dimensions (2D) and three dimensions (3D).
In vivo Administration of NPP
Male six-to-eight-week-old C57BL/6 mice (from animal house, INMAS) were used for this study. The animal study was performed, followed by a protocol recommended for PLGA nanoparticle delivery.27 Animals were distributed in polypropylene cages containing certified husk as bedding, food, and acidified water ad libitum throughout the experiment. Animals were housed under a standard pathogen-free environment with a 12h light/dark cycle at RT of 23±2°C and relative humidity of 55±5%. The committee approved the protocol followed for animal studies used in this experiment on the ethics of animal experiments of the Institute of Nuclear Medicine and Allied Sciences (INM/IAEC/2019/02). The NPP1 was injected into male C57BL/6 mice at 100μg in 100μL PBS by IP injection once a day consecutively for three days. The animals were euthanized through cervical dislocation on the 4th day of injection and processed to collect spleen, liver, bone marrow and kidney for tissue sectioning, and blood taken from the heart for hematology.
Hematology of Mice Injected with NPP1 and Toxicity Measurement by Histology
Analysis of blood samples was carried out after three days of treatment. Blood was collected into EDTA vacutainers (BD Microtainer Becton, Dickinson & Co., USA) from the heart of sacrificed mice. Hematological parameters such as the number of erythrocytes (RBCs), leukocytes (WBCs), hematocrit (HCT), hemoglobin (HGB), mean corpuscular volume (MCV), mean amount of hemoglobin in erythrocytes (MCH), mean hemoglobin concentration in the volume of erythrocytes (MCHC), red cell distribution by volume (RDW), platelet index (PLT) and granulocytes (GR) were determined in blood cell counter cell-Dyn 3200 (Abbott, USA). Besides, the toxicity of NPP1 in mice was assessed by visualizing the tissue section morphology of bone marrow of the thigh bone (femur), liver, spleen, and kidney. These tissue sections were fixed into 10% formalin except bone marrow in PBS. The fixed tissues were stained with hematoxylin and eosin and treated with paraffin.
Statistical Analysis
Results expressed as mean ± SD. Independent two-sided Student’s t-test was used to compare two groups. Data was considered statistically significant at a value of p <0.05, p <0.01, p <0.005 and p <0.001.
Results
Docking of GATA-1 and c-Jun with PU.1
The GATA-1 and c-Jun binding affinity towards PU.1 was estimated where the c-Jun domain, RKRMRNRIAASKCRKRKLER (−6kcal/mol), showed a higher binding affinity than the GATA-1 domain, VNRPLTMRKDGIQTRNRKASGKGKKKR (−4kcal/mol). The interaction energy between GATA-1 and c-Jun with PU.1 was ranked according to their binding mode and affinity for the β3/β4 region of PU.1 (Figure 1A).
 |
Figure 1 (A) Protein-protein docking identified that PU.1 (1PUE) exhibited a higher binding affinity for c-Jun (1JNM) compared to GATA-1 (2GAT). (B) Mutated peptide solvent accessibility and ∆∆G. The generated mutations and β3/β4 region of wild-type are shown with c-terminal gatekeeping residues (KLTY). (C) Docking of mutated peptides with GATA-1 and c-Jun showing binding energies (B.E.). (D) Virtual screening of peptides showing a lower affinity (positive B.E.) and higher affinity (negative B.E.). (E) The potential peptides have higher binding affinity with GATA-1 and lower with c-Jun compared to control (β3/β4 region). (F) Three-dimensional structure of P1, P2, P3, P4, P5, and P6 peptides. (G) Overlays of CD spectra showing differences in ellipticity between P1, P2, P3, P4, P5, and P6 peptides. (H) CD identified the percentage of secondary structure content of peptides. |
Mutational Analysis of the β3/β4 Region of PU.1
Substituted mutations in the β3/β4 region of peptides 16, 18, 19, 24, 25, 26, and 27 showed 100% solvent accessibility, which leads to unstable peptide structures (Figure 1B). These mutated peptides possess higher ∆∆G and susceptibility to degradation. Polar substituted mutation of peptides 6, 8, and 14, having the lowest solvent accessibility (26%) with moderate ∆∆G, appeared to be stabilizing mutations. However, the 3D structure of peptides (1, 2, 3, 4, 5, 7, 10, 11, 12, 15, and 21) containing mutated gatekeeping residues were found to have 72% solvent accessibility which shows instability. Furthermore, all mutated peptides were selected for docking with 2GAT and 1JNM (Figure 1C). The mutated peptides 1, 4, 6, 8, 11, 18, 19, 20, 25, 26, and 27 displayed a higher binding affinity for c-Jun and lower for GATA-1. The highest difference in B.E, −1.6 kcal/mol between c-Jun and GATA-1 was observed for peptide 1. In contrast, mutated peptides 3, 5, 7, 9, 10, 12, 13, 16, 17, 21, 22, 23, and 24 displayed a higher binding affinity for GATA-1 as compared to c-Jun. The B.E difference between GATA-1 and c-Jun was identified to be −0.9 kcal/mol for peptide 17. Also, the peptides 2, 14, and 15 were detected as neutral mutated peptides, which did not show the B.E difference between GATA-1 and c-Jun.
Designing and Virtual Screening of Novel Scrambled Peptide Library
The 80,000 scrambled peptide sequences of a β3/β4 region (NVEYKKKVTGGKK) were generated by applying mathematical permutation and combinations to identify novel peptides. Nevertheless, 800 peptides were chosen randomly, and 3D structures of each peptide were generated. The 3D structure was selected based on the cluster possessing minimum energy. Further, these structures were energy minimized and considered for virtual screening against GATA-1 (2GAT) and c-Jun (1JNM) binding domains (Figure 1D). Among screened peptides, the peptide P2 (EKKGKYKKNVVGT) was identified with the highest binding affinity towards GATA-1 (−5.1 kcal/mol) and lower towards c-Jun (−4 kcal/mol) (Figure 1E). However, P1 (NVEYKKKVTGGKK) displayed a higher B.E difference between GATA-1 and c-Jun (−1.6 kcal/mol) compared with P2 (−1.1 kcal/mol). Interestingly, the binding affinity of the control, β3/β4 peptide (P3), was predicted to have the lowest for GATA-1 and highest for c-Jun with a B.E difference of 1.3 kcal/mol. The higher B.E difference between GATA-1 and c-Jun (B.E. GATA-1–c-Jun) showed that peptides have a higher binding affinity towards GATA-1 and lower towards c-Jun. The P3 peptide showed the lowest B.E. difference between GATA-1 and c-Jun, 1.3 kcal/mol.
Novel Peptide Charge, Cleavage Sites, and Secondary Structure Content Analysis
The structures of six peptides (P1, P2, P3, P4, P5, and P6) were generated using PEP-FOLD and refined by SPDBv as represented in Figure 1F. The secondary structure content of P1 showed a rigid peptide, whereas P3 showed most flexible peptide (Table 1). The overall charge of peptides was calculated and found to be basic (Table 2). The peptide cleavage sites were identified before performing the experimental studies to avoid the use of chemicals and reagents containing reported enzymes (Table 3).
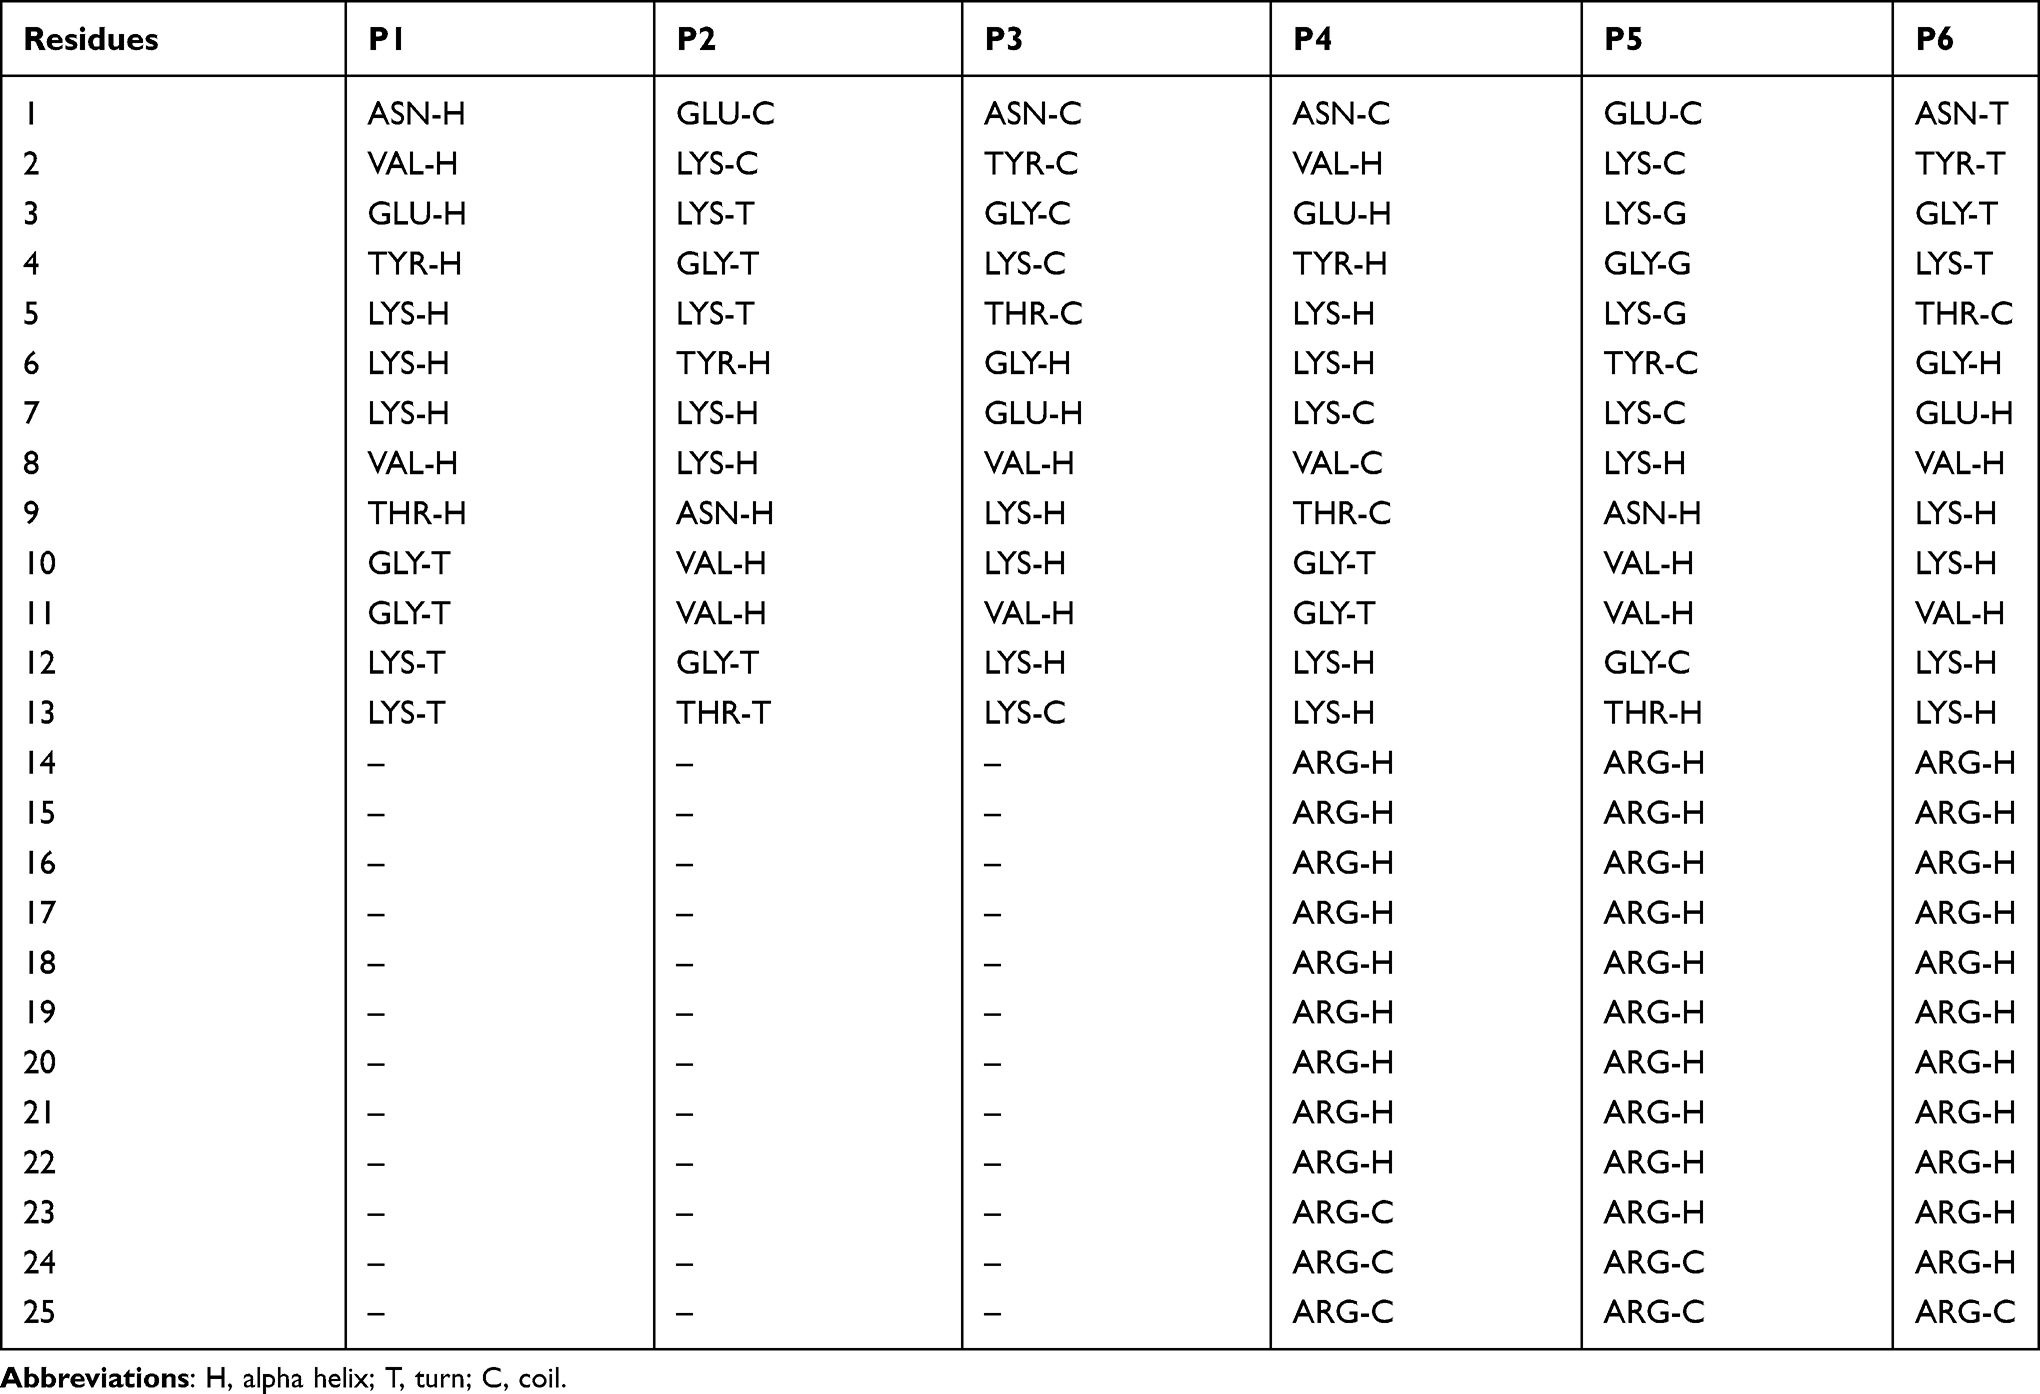 |
Table 1 Secondary Structure Content of Each Amino Acid of P1, P2, P3, P4, P5, and P6 Peptide |
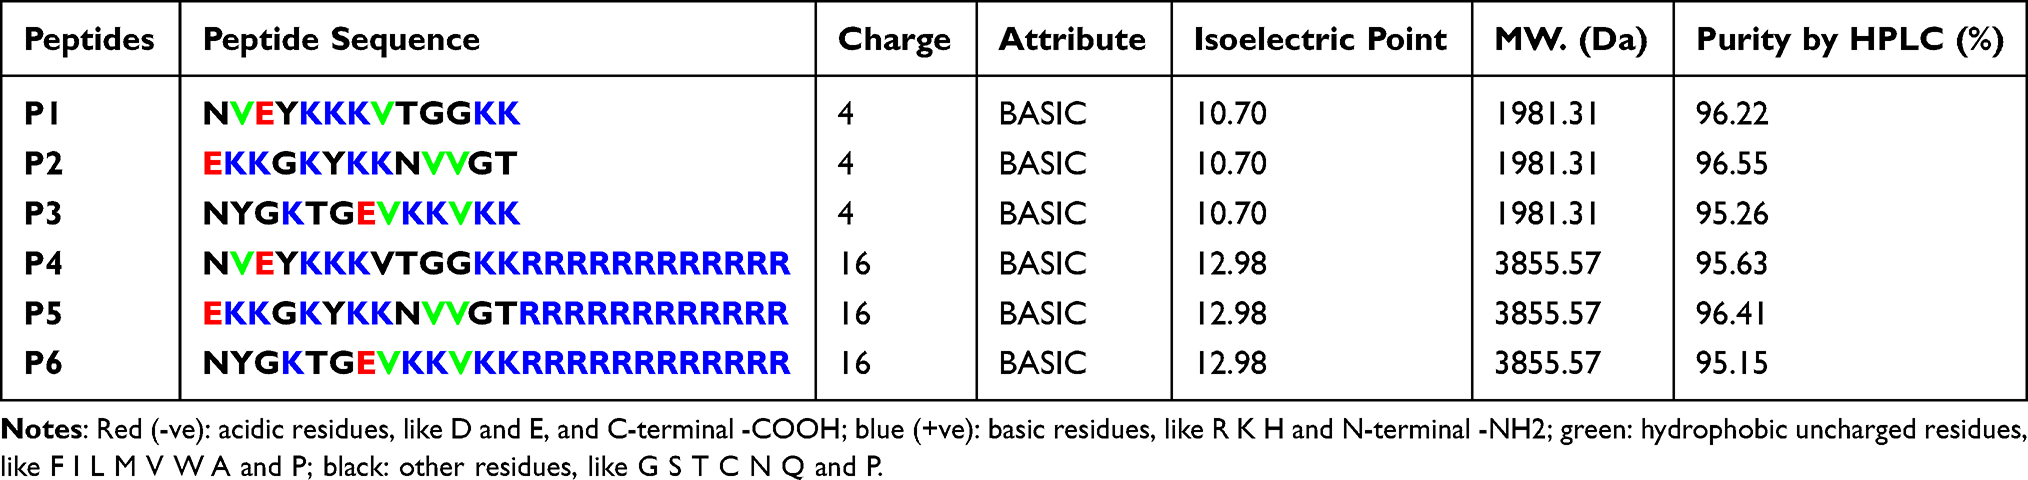 |
Table 2 Identification of Peptide Charge, Attribute, Isoelectric Point, Molecular Weight (MW), and Purity |
 |
Table 3 Predicted Cleavage Sites of Peptides P1, P2, P3, P4, P5, and P6 |
CD Identified Secondary Structure Content of Peptides
CD spectroscopy identified two-dimensional (2D) structures of the peptides, P1, P2, P3, P4, P5, and P6 to measure the flexibility and rigidity. The P1, P3, P4, and P5 possessed reduced levels of ellipticity, implying that without CPP these peptides lose a substantial degree of secondary structure, which becomes less compact and more disordered (Figure 1G). Although P2 exhibited its moderate ellipticity without CPP while P6 attained folded structure on CPP addition. The peptide P1 was found in solution as 0% helix, 29.1% beta strand, 18% turns, and 52.8% unordered structure (Figure 1H). Similarly, P4 (CPP added to P1) existed as 0% helix, 30.1% beta strand, 18.8% turns, and 51.1% unordered structure. However, P1 and P4 showed an increase in beta strand by 1% and turn by 0.8%, though a 1.7% decrease in the random coil was noted. Similarly, the peptide P2 sequence is the same as P5 except containing CPP sequence, which showed a 5.3% decrease in beta content, a 2.1% increase in turn and 3.2% increase in the coil. Nonetheless, significant structure alteration was identified while comparing P3 to P6 that displayed 8.6% increase in helix, 21.5% decrease in beta, 11.1% increase in turns, and 1.8% increase in the random coil.
Characterization of Peptides
ESI mass spectrometry determined the molecular mass, through which the maximum peptide length was estimated. The purity of P1 to P6 peptides was provided by HPLC, as shown in Figure 2. The yield of P1 to P6 peptide purity was obtained more than 95%, suitable for cell culture. These purities were explicitly associated with the mass spectrum of peptide, which displayed a maximum relative percentage of (M+3H)3+ ions at m/z 661.77 for P1, (M+3H)3+ ions at m/z 661.81 for P2, (M-2H)2- ions at m/z 989.45 for P3, (M+6H)6+ ions at m/z 644.02 for P4, (M+7H)7+ ions at m/z 552.20 for P5, and (M+7H)7+ ions at m/z 552.27 for P6.
 |
Figure 2 HPLC and mass spectrometry of peptide P1, P2, P3, P4, P5, and P6. |
Intracellular Uptake of P1, P2, P3, P4, P5, and P6 Peptides and NPP
The distribution of FITC tagged peptides (green fluorescence) at 5µg was observed in living unfixed MO7e, KG1a, K562, and HL60 cells using FACS analysis (Figure 3A). Because of the cationic nature of P1, P2, P3, P4, P5, and P6, they strongly bind with the negatively charged cell membrane. Thus, trypsin was used to remove cell membrane-bound peptides and measure peptide fluorescence inside the cells. All peptides were successfully permeated in all four cell lines at a 5µg concentration, but peptides having CPP sequences showed increased uptake.
 |
Figure 3 (A) P1 and P4 (green), P2 and P5 (red), and P3 and P6 (blue) uptake show its permeation in MO7e, KG1a, K562, and HL60 cells as compared to autofluorescence of cells (black). (B) Fluorescence images of MO7e cells showing P1, P2, P3, P4, P5, and P6 peptide uptake at 5µg. Green fluorescence (FITC) is shown by peptides’ intake within the cells followed by nucleus staining with DAPI (blue). (C) Confocal microscopy of MO7e cells showing P1, P2, P3, P4, P5, and P6 peptide uptake at 5µg/mL. |
Cellular Localization of Peptides
The fluorescence microscopy confirmed the internalization of P1, P2, P3, P4, P5, and P6 in MO7e cells at 5µg/mL (Figure 3B). The MO7e cells treated with peptides showed their distribution inside the cells but did not demarcate their presence in the nucleus. The merged images identified the presence of peptides (FITC, green color) inside the cells. It was observed that P1, P2, and P3 peptides were bound to the membrane and also entered inside the cells. Most of the peptides were found in the cells instead of the nucleus, which is likely to be targeting cytosolic GATA-1.
Confocal Microscopy
The localization of peptides at 5µg/mL was identified within the MO7e cells using confocal microscopy (Figure 3C). However, P4 and P6 showed a high-intensity signal of FITC whereas, a low-intensity signal was identified in the cells treated with peptides without CPP, P1, P2, and P3. Nonetheless, no nuclear localization was noted, which suggested that peptides’ effect would likely be due to the penetrated peptides within the cells.
Assessment of Cell Viability
The viability of K562 (Figure 4A), KG1a (Figure 4B), MO7e (Figure 4C), and HL60 (Figure 4D) cells treated with P1, P2, P3, P4, P5, and P6 was assessed using MTT. The K562 cells treated with P2, P3, P5, and P6 peptides were found significantly (p<0.005) viable compared with control (C). However, an insignificant decrease in viability was observed for P4 treated cells, and an insignificant increase in viability was detected for P1 treated cells. Furthermore, only P6 displayed a significant increase in cell viability than C, while other peptides displayed insignificant changes in KG1a. Moreover, no significant changes were observed in HL60 cells, suggesting no toxicity effect of these peptides. Also, MO7e cells treated with P1, P2, P3, P5, and P6 peptides displayed a significant (p<0.005) increased viability, though p<0.05 was noted for P4 compared with control.
 |
Figure 4 Toxicity assessment of P1, P2, P3, P4, P5 P6 treated (A) K562, (B) KG1a, (C) MO7e, and (D) HL60 cells. (E and F) shows the viability of NPP1, NPP2, NPP3, NPP4, NPP5, and NPP6 treated HL60 cells at 5µg/mL for 40h. $p<0.005; *p<0.05;@p<0.01; NS, not statistically significant. |
Myeloid Expression
The expression of myeloid specific receptors (CD11b, CD33, CD116, and CD114) on megakaryoblasts, MO7e cells for P1, P2, and P3 treatment is shown in Figure 5A. The peptide P1 treated MO7e cells identified as most significant (p<0.001) increase in CD11b expression compared to without peptide treated cells C (control). Similarly, increased expression of CD116 and CD114 was found to be most significant (p<0.001) for P1 treated MO7e cells compared to control. In comparison to control, a significant (p<0.005) increase of CD33 expression was noted in cells treated with P2 but was shown lower than P1 (p<0.001) treated MO7e cells. Also, an insignificant change in CD33 expression was observed between P1 and P2 treated MO7e cells.
 |
Figure 5 Expression of CD11b, CD33, CD116, and CD114 in (A) MO7e (B) KG1a (C) K562 (D) HL60 cells treated with P1, P2, and P3 and found; $$p<0.001; $p<0.005; @p<0.01; *p<0.05; NS, not statistically significant, compared to control. (E) expression of these markers was also quantified on HL60 cells treated with P4, P5, and P6, and found statistical significance; $$p<0.001; $p<0.005 compared to control. (F) The CD33 expression on HL60 cells treated with NPP1, NPP2, NPP3, NPP4, NPP5, and NPP6 at 24h and 48h was observed and found; *p<0.05; NS, not statistically significant. (G) CD33 expression on HSCs treated with P4, P5, and P6 at 24h was observed and found; *p<0.05; NS, not statistically significant. |
Also, expressing CD11b, CD33, CD116, and CD114 markers on macrophage promoting myeloblast cells, KG1a was examined (Figure 5B). The P2 displayed the highest significant (p<0.001) increased expression of CD11b, CD33, and CD116, while p<0.005 showed for CD114 compared to control.
Additionally, P2 showed the highest CD11b, CD116, and CD114 expression on erythroleukemic K562 cells (Figure 5C) but was insignificant compared to control. However, significantly raised CD33 expression was detected for P2 (p<0.05) and P1 (p<0.05) as compared to control.
Again, when compared with control, promyeloblast HL60 cells showed significantly highest CD11b (p<0.001), CD33 (p<0.001), and CD116 (p<0.005) expression with P1 treatment, whereas CD114 expression found significantly (p<0.001) highest for P2 (Figure 5D). However, insignificantly increased expression of CD114 was noted for P2 as compared to P1.
Likewise, the myeloid marker expression level was also evaluated in HL60 cells treated with P4, P5, and P6 (Figure 5E). The CD11b expression was found significantly highest on P4 (p<0.001) treated cells compared to control. In contrast, significantly, p<0.001 highest increased CD33, CD116, CD114 expression was displayed on P6 treated cells. This result was correlated with the CD result in which P6 showed highest α-helix content, attained rigidity compared to P3.
Besides, a significant (p<0.05) CD33 expression was observed on HSCs treated with P4 and P5 peptide as compared to control, while P6 shows non-significant CD33 expression (Figure 5G).
TFs Expression
The P1 showed the highest significant (p<0.001) increase of c-Jun and C/EBPα expression in MO7e cells (Figure 6A). However, no significant increased expression of GATA-1 was seen for P1, P2, and P3 compared to control, which revealed that these peptides had not raised the GATA-1 expression. Nevertheless, P2 treated cells exhibited increased significant (p<0.001) PU.1 expression compared to control, but an insignificant difference was followed between P1 and P2 treated cells.
 |
Figure 6 Expression of the TFs, PU.1, GATA-1, c-Jun, and C/EBPα in P1, P2, and P3 treated (A) MO7e, (B) KG1a, (C) K562, and (D) HL60 cells. In addition, (E) the expression of these TFs was also evaluated in P4, P5, and P6 treated HL60 cells and found statistical significance; $$p<0.001; $p<0.005; *p<0.05; @p<0.01; NS, not statistically significant compared to control. (F) shows HSCs colony, and (G) counted colonies of HSCs after 13 days. $$p<0.001; NS, not statistically significant. |
In KG1a cells, P2 peptide showed a significant (p<0.05) increase in PU.1 expression as compared to control (Figure 6B). However, P1 displayed a significant (p<0.001) increase in GATA-1 expression, whereas insignificant raised c-Jun and a significant (p<0.01) decreased expression of C/EBPα was obtained compared to control. Nonetheless, P3 significantly (p<0.001) augmented C/EBPα expression.
P2 treated K562 cells show a significant (p<0.005) increase in PU.1 and c-Jun (p<0.005) expression (Figure 6C). Interestingly, a significantly elevated C/EBPα expression was noted for P1 (p<0.005), P2 (p<0.001), and P3 (p<0.001) compared to control. Besides, insignificantly decreased GATA-1 expression was found in P1, P2, and P3 treated K562 cells compared to control.
Also, the highest increased significant expression of PU.1 (p<0.01) and c-Jun (p<0.01) was detected in P2 treated HL60 cells compared to the control (Figure 6D). Also, P1 displayed the highest increased significant expression of GATA-1 (p<0.001) and C/EBPα (p<0.001) as compared to control.
Further, a significant (p<0.05) expression of PU.1 and C/EBPα was found in P4 treated HL60 cells, while expression of c-Jun was insignificant in P4, P5 and P6 treated cells (Figure 6E). Similarly, insignificant promoted expression of GATA-1 was kept in P5 treated cells, conversely significantly increased expression was found for P4 (p<0.05) and P6 (p<0.01).
The results reveal that the highest increased PU.1 expression was found in P2 treated MO7e, KG1a, K562, and HL60 cells. Additionally, no significant change of GATA-1 expression was followed by P1, P2, and P3 treated megakaryoblast, MO7e (Figure 6A) and erythroleukemic, K562 (Figure 6C) cell lines. On the contrary, expression of GATA-1 was noted to be highly significant for the P1, P2, P3 compared to control in myeloid, KG1a, and HL60 cell lines.
Colony-Forming Assay
The HSCs formed the CFU-GM colonies, which were identified and counted after 13 days of the experiment (Figure 6F and G). The P4 alone, P5 alone, cytokines (GM-CSF, G-CSF, and IL3) only, cytokines+P4, cytokines+P5, and cytokines+P6, were found to increase significantly (p= 0.001), while P6 alone treated cells were detected insignificant compared with control.
Peptide Loading and Encapsulation in NPP
The emulsion solvent evaporation (nanoprecipitation) method was used to synthesized NPP. The low aqueous (peptide solution) to organic phase (PLGA dissolved in Ethyl Acetate) ratio was maintained to obtain nanoscale particles. Afterwards, the lyophilized nanoparticles with peptide loading percentage of 3.2 ± 0.05% and encapsulation efficiency of 86.4 ± 4.8% were determined.
Characterization and Functional Validation of NPP
The intensity was identified for the size distribution of NPP1, NPP2, NPP3, NPP4, NPP5, and NPP6, though no significant hovering was seen in size distribution intensity (Figure 7A). Besides, the relative surface charge of NPP in the colloidal dispersion was calculated based on their mobility across an electric field, described as zeta potential. The measured charge was found close-to-neutral, ranges from −3.58 to −0.26 mV for NPP1, NPP2, NPP3, NPP4, NPP5, and NPP6 (Figure 7B). The NPP size was identified as Z-Avg ranging from 93.6nm to 254.8nm, and polydispersity index (PdI) between 0.012 to 0.212 showed monodispersed formulation and suggested maximum penetration inside the cells.
 |
Figure 7 Characterization of NPP1, NPP2, NPP3, NPP4, NPP5, and NPP6 by (A) size distribution by intensity, which was recorded three times shown as record1 (green peak), record2 (red peak) and record3 (blue peak), (B) obtained zeta potential (ZP), size distribution (Z-Avg) and PdI values of NP (nanoparticles without peptide) and NPP. (C) SEM images with a scale of 100nm, and (D) TEM images with a scale of 100 and 50nm. (E) AFM 2D and 3D images of NPP1, NPP2, NPP3, NPP4, NPP5, and NPP6 with a scale of 100nm. |
SEM showed NPP size ranging from 42nm to 250nm and was found to be spherical (Figure 7C). The NPP1, NPP2, NPP3, NPP4, NPP5, and NPP6 showed rounded and monodispersed.
The NPP provided a smooth surface and was found monodispersed and varied in size from 20–150nm identified using TEM (Figure 7D).
All the NPP’ structure and morphology were observed identical as analyzed using AFM (Figure 7E). The NPP were attained their spherical shape suggesting their stability.
Besides, cellular localization of NPP1, NPP2, NPP3, NPP4, NPP5, and NPP6 (Figure 8A) in HL60 cells at 48h was confirmed by fluorescence microscopy. The significant cellular uptake of NPP1, NPP2, and NPP3 in HL60 cells was noted as compared to control using flow cytometry at 48h (Figure 8B). This assessment suggested that the use of these NPPs does not cause any cellular toxicity. Nonetheless, NPP4 displayed a significant increase in cellular uptake, but uptake of NPP5 and NPP6 was not found to be significant compared to control.
 |
Figure 8 (A) Cellular uptake of NPP1, NPP2, NPP3, NPP4, NPP5, and NPP6 in HL60 cells. Intracellular uptake of the NPPs is depicted by green fluorescence. (B) Intracellular localization of NPP1, NPP2, NPP3, NPP4, NPP5, and NPP6 in HL60 cells at 48h. *p<0.05; $$p<0.001; NS, not statistically significant. |
The NPP1, NPP2, NPP3, NPP4, NPP5, and NPP6 at 5µg/mL were found nontoxic to HL60 cells (Figure 4E and F). Significantly increased the viability of HL60 cells treated with NPP5 (p<0.05) and NPP6 (p<0.005) was observed at 5µg/mL compared to control. Furthermore, no toxicity was followed at 5µg/mL and significantly increased viability was found for NPP1 (p=0.01), while an insignificant change was remarked for NPP2 and NPP3 compared to control.
Nevertheless, no significant CD33 expression was noted on NPP2, and NPP3 treated HL60 cells at 24h and 48h (Figure 5F), while NPP1 displayed a statistically substantial (p<0.05) increase in CD33 expression at 24h. Besides, the CD33 expression on NPP4, NPP5, and NPP6 treated cells was not significant at 48h. In contrast, a significant (p<0.05) increased CD33 expression was detected in NPP4 and NPP6 treated HL60 cells at 24h compared to control.
Hematological Modulation of NPP1 in Rodent and Toxicity Assessment by Histology
The increased CD33 expression in HL60 cells suggested that NPP1 is potentially increasing myeloid expression. Instead of CPP, NPP1 displayed a significant difference; thus, it was considered in the in vivo system to compare the difference in granulocytic percentage between treated cells compared to control. In comparison to control, NPP1 decreased the WBC counts, specifically decreasing lymphocytes' percentage (Figure 9A). Interestingly, administration of NPP1 significantly (p<0.007) increased the percentage of granulocytes in comparison to control mice. A non-significant but noticeable difference was observed in PLT, called thrombocytosis, which is usually associated with underlying cancer, but further studies will be required to derive a conclusion. The NPP1 administration in rodents did not significantly suppress erythropoiesis, as observed through RBC and HGB counts. However, NPP1 caused a non-significant increase in HCT percentage and HGB count, which is usually indicative of dehydration since RBCs tend to get concentrated and hence increase the HCT count. A decrease in MCV, MCH, and MCHC, indicates microcytic anemia caused by either iron deficiency or internal bleeding. Therefore, histological analysis of other organs of the animal was conducted. Nonetheless, no significant changes were observed in other hematological parameters, and their values were found close to control values. The histology of bone marrow, spleen, liver, and kidney were performed, and no toxicity was observed for NPP1 (Figure 9B).
 |
Figure 9 (A) Hematological parameter indicates the average mean of control and NPP1 treatment. *p<0.05. (B) Histology of bone marrow, spleen, liver, and kidney shows no toxicity for NPP1 treatment. |
Discussion
Monocyte/macrophage system alone and in association with lymphocytes and cytokine provides a robust cellular defense system against infections.37,38 The host’s immunity is significantly affected by cancer chemotherapy. Chemotherapy reportedly decreases monocyte count and phagocyting ability, which makes these patients more prone to infections.37,39–47 Therefore, an increased number of monocyte/macrophages in a cancer patient receiving chemotherapy can prevent disease in pre- and post-bone marrow transplantations. The development of an activated adaptive immune system through differentiation of HSCs is regulated by PU.1, c-Jun, and GATA-1 TFs.48 It was noted that both c-Jun and GATA-1 compete to bind with the β3/β4 region of PU.1. Nonetheless, PU.1 interacts with c-Jun causing myelopoiesis, while GATA-1 antagonizes this interaction to promote erythropoiesis.11 However, less evidence has been reported for their interactions.18 As a result, yet no potent molecule has been identified to regulate myelopoiesis, which is facilitated by PU.1.19 Hitherto, no PDB complex structure is reported in the RCSB PDB database (www.rcsb.org). Therefore, in case of opportunistic infections, it is required to design a molecule, which increases myelopoiesis (number of myeloid cells) by abolishing the GATA-1 binding with PU.1, but allows the binding of c-Jun with PU.1 to combat infection.
In this study, primarily, docking was employed to explore the mechanism of GATA-1-PU.1 and c-Jun-PU.1 interaction that identified the interacting residues of the PU.1, β3/β4 region with carboxyl-terminal zinc finger of GATA-1 and c-Jun. The docking study confirmed the existence of competition between GATA-1 and c-Jun for binding with PU.1. Docking results identified the interacting regions between PU.1 and GATA-1, and PU.1 and c-Jun proteins, which play a leading role in the fate of stem cells to erythroid or myeloid lineages. The binding affinity of the β3/β4 region of PU.1 was identified for both GATA-1, and c-Jun, wherein c-Jun showed higher binding affinity. These results suggested the GATA-1 mediated repression of PU.1 can be abolished by altering the physical interaction between the two proteins. Therefore, a strategy was adopted to design a molecule that abolishes the binding of GATA-1 with PU.1 without affecting c-Jun binding to promote myelopoiesis. Thus, the β3/β4 region of PU.1 was extracted, and the PoPMuSiC algorithm was employed for in silico systematic search of single-site mutations to improve native-state stability through ∆∆G and solvent accessibility. The 27 mutants were created, and estimated the changes in folding free energy (∆∆G) and solvent accessibility of mutated peptides. The function of mutation is regulated by a biophysical mechanism known as peptide stability.49 The contribution of stability to the mutated peptide was noted by solvent accessibility and ∆∆G. An increase in ∆∆G showed a lower fraction of folded peptide and therefore decreased stability. As mutations increase the accessibility of buried residues to the solvent in the peptide, the 3D structure becomes unstable.50 Also, Proline substituted mutations were ignored to avoid conformational rearrangements in the peptides. Consequently, the mutated peptides with the high polarity of the peptide surface, moderate solvent accessibility, and lowest ∆∆G were considered for virtual screening. The screening evaluated the binding affinity and specificity of mutated peptides, which block the binding of GATA-1 with PU.1 and does not abrogate c-Jun binding with PU.1. The virtual screening revealed the mutations were not significant, which is identified by the B.E difference between GATA-1 and c-Jun for PU.1. Subsequently, a scrambled peptide library consisting of 800 peptides was constructed by scrambling β3/β4 residues. The virtual screening, identified the potential peptides have a higher binding affinity towards GATA-1 and lower affinity for c-Jun, which abrogates GATA-1 interaction with PU.1. The identified novel peptides (P1 and P2) displayed greater B.E difference (−1.6 kcal/mol) between GATA-1 and c-Jun, compared to mutated peptide number 17 (−0.9 kcal/mol). The P1 and P2 attained higher binding affinity for GATA-1, −4.7 kcal/mol and −5.1 kcal/mol, but least for c-Jun, −3.1 kcal/mol, and −4.0 kcal/mol, respectively. In contrast, P3 identified B.E, −3.4 kcal/mol for GATA-1, and −4.7 kcal/mol for c-Jun, which is substantiated to PU.1 docking with GATA-1 and c-Jun, which shows that P3 is specific for c-Jun. P1 and P2 displayed higher binding affinity identified using computational screening, and a control peptide, P3 (β3/β4) were synthesized and validated in vitro. The peptides, P4, P5, and P6, are similar to P1, P2, and P3, respectively, except being added with cell penetrating peptides (CPP), RRRRRRRRRRRR (12R). Therefore, these peptides were not further considered for docking. The effective transduction of 12R CPP was already reported in CD34+ cells,51 thus chosen for conjugation with P1, P2, and P3 peptides. The P4, P5, and P6 were FITC tagged peptides added with CPP to P1, P2, and P3 FITC tagged peptides, respectively. CD spectroscopy of peptides identified that P3 attained 3.4% helix, whereas the increased percentage of the helix was obtained for P6 (12%). This 8.6% increase in helix revealed that CPP provided stability to the P6. Nonetheless, the percentage of the beta content was drastically reduced from 30.1% in P3 to 8.6% in P6, while the increase of 29.5% in P6 and 18.4% in P3, in turns, were identified. This result suggested that flexibility was induced by CPP addition to P6, which may modulate the function of the native peptide. Besides, no significant change was observed in P1, P2, P4, and P5 peptides. A detailed analysis of intracellular uptake of peptides in megakaryocyte/erythroid cells (MO7e and K562) and myeloid cells (KG1a and HL60) was confirmed using flow cytometry. This result evaluated the internalization of FITC-labelled peptides in the cells. The fluorescence, and confocal microscopy assessed that peptides were distributed inside the cells, which confirmed its cell-penetrating ability. Rather, P1, P2, and P3 were observed with low FITC fluorescence than P4, P5, and P6, which reveals peptides without CPP had diminutive cellular localization and suggested that CPP increases the internalization. The viability of peptide-treated cells was assessed in vitro, which shows no cytotoxicity suggested that peptides’ treatment could be used subsequently in the in vitro cellular functional assays.
The cells treated with peptides increased the myeloid-specific receptor expression, which shows myelopoiesis. The expression of myeloid antigens CD33, CD11b, CD116, and CD114 was examined on four different cell lines, such as MO7e, KG1a, K562, and HL60. The CD33 is a myeloid-specific receptor, expressed highly on myeloid progenitor cells but at much lower levels in differentiated cells.52 Also, the CD11b (granulocytic),53 CD116 (GM-CSFR),54 and CD114 (G-CSFR)55 receptors were considered for FACS analysis. Myeloid marker expression was identified in MO7E, KG1a, K562, and HL60 cells treated with P1, P2, P3, P4, P5, and P6 peptides. Expression of CD11b, CD116, and CD114 was found to be increased, while CD33 expression was most significant in P1 treated MO7e cells compared to control. Similarly, P1 treatment on HL60 cells exhibited the highest CD11b, CD33, and CD116 expression. In contrast, P2 increased the expression of CD11b, CD33, CD116, and CD114 on KG1a and K562 cells. Moreover, CD11b expression was found increased in P4 treated HL60 cells, while expression of CD33, CD116, and CD114 was estimated highest in P6 treated HL60 cells compared to control. Conversely, P4 increased the expression of CD33 in HSCs; thus collectively, these results suggested that peptide, P1, and P2 can effectively increase myelopoiesis.
The PU.1−/- lessens the number of myeloid progenitors but responds to the multilineage cytokines IL-3, IL-6, and SCF in proliferation instead of myeloid specific cytokines GM-CSF, G-CSF, and M-CSF, recognized for differentiation. However, the synergistic effect of IL-3 and G-CSF differentiates the cells into their myeloid precursors.56 This effect shows that PU.1 controls the development of granulocytes and macrophages. Also, three essential TFs, c-Jun, GATA-1, and C/EBPα were needed to evaluate the myelopoiesis,57 expression inhibition by peptides, and granulocytic-monocyte development by inducing PU.1,58 respectively. The changes in TF expression were observed, which signify that P1 increased the expression of PU.1, c-Jun, and C/EBPα. Although P2 induces the highest expression of PU.1, no significant difference in the expression was noted between P1 and P2 treated MO7e cells. The results revealed that significantly highest PU.1 expression was found in P2 treated MO7e, KG1a, K562, and HL60 cells. Also, no significant change of GATA-1 expression was noted by P1, P2, and P3 treated megakaryoblast, MO7e, and erythroleukemia, K562 cell lines. On the contrary, significantly increased expression of GATA-1 was noted for P1, P2, P3 compared to control in myeloid, KG1a, and HL60 cell lines. Similarly, P4, P5, and P6 increased the expression of GATA-1, while the highest PU.1, c-Jun, and C/EBPα expression were found for the P1 peptide. Results suggested that P1, P2, P3, P4 altered the expression where increased expression of GATA-1 was found. HSCs colony-forming assay proposed that P4, P5, and P6 in combination with cytokines (GM-CSF, G-CSF, and IL3) increases the myeloid differentiation, measured by increased colony count as compared to control (C) and positive myeloid control (GM-CSF+G-CSF+IL3).
Since peptides being used to treat diseases have a short half-life, therefore, they are administered several times at short intervals.59 The Poly(lactic-co-glycolic acid) (PLGA) based formulation provided the solution to the problem by protecting peptides from degradation, supporting the sustained release, and stabilization.60 An in vitro sustained release of G-CSF loaded PLGA nanoparticles for more than seven days has already been reported.61 A higher polymer concentration leads to higher encapsulation efficiency with the larger nanoparticles’ size.62,63 As well, the low aqueous phase to organic phase ratio leads to smaller nanoparticles.63 Therefore, 10mg of PLGA and 1:4 ratio of aqueous to organic phase was used to synthesize the nanoparticle, which yields satisfactory loading and entrapment efficiency. The single peak of each NPP confirmed the formation of nanoparticles compared to a peptide, and PLGA alone, which was considered control. Zeta potential measured the low negative overall charge on NPP1, NPP2, NPP3, NPP4, NPP5, and NPP6, which showed that these NPP are close to neutral charge leading to cell internalization. The size of all NPP was found below 163.6nm, which suggested that no aggregation occurred after synthesis. The monosuspended NPPs were formed, and PdI was measured below 0.2 except for NPP4. Nonetheless, NPP4 achieved good PdI as observed from size distribution by intensity peaks. Also, all other NPP were found to have uniformity, and no hovering was noted. The SEM determined NPP morphology and size that demonstrated the synthesized NPP attained their shape in nano-size. The exact morphology was noted by TEM, which confirmed the average size of NPP below 100nm. These images represented the size distribution of NPPs were smooth and spherical. The AFM of NPP established the smoothness and stability as viewed after 30 days of synthesized nanoparticles. The NPP was found nontoxic and significantly increased the viability of cells. Subsequently, cellular uptake of NPP was detected and was found uniformly distributed in the cells. Intracellular localized NPP displayed that HL60 cells attained their compact structure with clear morphology, and no cytotoxic effect was identified. The penetration of NPP1, NPP2, and NPP3 showed significant facilitation into cells and represented encapsulated peptides, which regulate their function. A significant increase of CD33 expression in NPP1 treated HL60 cells established the elevation of myelopoiesis. Besides, NPP2 and NPP6 also displayed increased CD33 expression. These results suggested that NPP1, NPP4, and NPP6 have the potential to induce myelopoiesis. Nonetheless, NPP1 results were found to be correlated with P1 treatment in HL60 cells. However, NPP4 and P4 were not considered for further functional assays to avoid CPP’s effect, which can cause the alteration in native function. Thus, NPP1 was used for in vivo studies to determine the overall effect of NPP1 in regulating granulocytes. The hematology was performed, which showed a significant (p=0.007) increase of granulocytes by 10.8% after NPP1 treatment with respect to the control. This in vivo increase in percentage of granulocytes was also corroborated with in vitro increased CD33, myeloid marker expression. High HGB and HCT but low MCV, MCH and MCHC can be caused due to clumping of RBCs together, which raises the hematocrit reading and chances of developing microcytic anemia caused by iron deficiency. The noticeable difference in the PLT count of control vs NPP1 treated animals can be caused either due to cancer or infection, but these predicted underlying causes were ruled out by the organ histology report. Also, similar cellular structures and no abnormalities were observed in the bone marrow, spleen, liver, and kidney of the mice following the NPP1 administration as compared to the control group. Hence, no toxicity was seen in NPP1 treated mice organ’s histology in which cells attained their native morphology and appeared round that supports hematology result.
Conclusion
The computational, in vitro, and in vivo techniques were employed in this study to design novel therapeutic molecules (Figure 10). The β3/β4 region of PU.1 mimetic peptide library was created and virtually screened for both GATA-1 and c-Jun to reduce the time and financial cost of identifying a new novel molecule. Thus, novel synthetic peptides were designed, which bind specifically to GATA-1 and abrogate its binding with PU.1 leading myelopoiesis. This strategy would be useful in identifying synthetic novel peptides for the development of selective GATA-1 inhibitors. Subsequently, the identified potential peptides were chemically synthesized, and functional validation was performed. These peptides successfully increased the expression of myeloid receptors, CD33, CD11b, CD116, and CD114 present on the cell surface. This result suggests that these peptides modulate the differentiation of stem cells into myeloid cells. However, these peptides also increase the expression of myelopoiesis promoting TFs, PU.1 and GATA-1, and granulocytes promoting TFs, C/EBPα. We have eventually discovered novel GATA-1 specific synthetic peptides which successfully induce myelopoiesis. Although the peptides have a short half-life, thus in this study, NPP was reported as a promising vaccine delivery system for enhancement of myelopoiesis. The formulation composed of peptide encapsulated Poly(lactic-co-glycolic acid) (PLGA) nanoparticles were used to protect peptides from degradation, stabilized the peptides, and support their sustained release. The fabricated nanoparticles were characterized and subsequently determined cellular toxicity, cellular uptake, intracellular localization, and assessed myeloid expression. Also, in vivo studies treated with NPP were analyzed. The peptide encapsulated PLGA nanoparticles formulation was found to be effective in carrying the synthetic peptide into the cells, ensuring sustained delivery and protection from degradation. The cumulative results may prove to be helpful for the continued utilization of the formulation in enhancing myelopoiesis.
 |
Figure 10 Overall representation of adopted methodology. |
Abbreviations
HSCs, hematopoietic stem cells; TF, transcription factor; PU.1, Purine rich box1; GATA-1, Erythroid transcription factor of the GATA family; C/EBP, CCAAT/Enhancer Binding Proteins; B.E, binding energy; P1, NVEYKKKVTGGKK; P2, EKKGKYKKNVVGT; β3/β4 region of PU.1 (P3), NYGKTGEVKKVKK; NP, nanoparticles without peptide; NPP, nanoparticles of peptides; NPP1, nanoparticles of P1; NPP2, nanoparticles of P2; NPP3, nanoparticles of P3, NPP4, nanoparticles of P4, NPP5, nanoparticles of P5; NPP6, nanoparticles of P6.
Data Sharing Statement
All data generated or analyzed during this study are included in this manuscript.
Ethical Approval
The study was commenced after getting ethical clearance from Institutional Committee for Stem Cell Research (IC-SCR), INMAS, New Delhi. As the study is not a clinical research, consent from donors is not required for present study. All the cell lines including gifted MO7e cells used in this study had ethical or institutional review board approval. This investigation was approved by Institutional Animal Ethics Committee (IAEC) under registration no. 8/GO/RBi/S/99/CPCSEA; vide reference no. INM/IAEC/2019/02 dated 28/02/2019. All the animals were maintained as per the guidelines of the Committee for the Purpose of Control and Supervision of Experiments on Animals (CPSEA), India.
Acknowledgments
Authors wish to thank especially Mrs. Namita Kalra for flow cytometry sample acquisition and Dr. N.K. Chaudhury of INMAS, DRDO, Delhi, India, for fluorescence microscopy. Authors are grateful to the following: Dr. Paulo de Sepulveda, INSERM scientist, Institute National de la Santé et de la Recherche Médicale, France, for providing MO7e cells as a gift for research; Dr. Pradeep Kumar of IGIB, Delhi, for DLS; Dr. Manish of IGIB, for confocal microscopy; Mr. Approva Sharma, USIC, University of Delhi, Delhi, India, for support with the TEM; Dr. Akhilesh Pandey, SSPL, DRDO, Delhi, India, for SEM and AFM. PKR would like to acknowledge DRDO for financial assistance. The authors gratefully acknowledge Mrs. Rajni (CARA) and Ms. Zoya Mann (AIIMS) for proofreading the manuscript.
Funding
The work has been supported by Defence Research and Development Organization (DRDO) projects S&T/311/1.6/INMAS and S&T/18-19/INM-323.
Disclosure
Dr Pawan Kumar Raghav reports a patent 202011045773 pending; Dr Gurudutta Gangenahalli reports a patent 202011045773 pending. The authors declare no other conflicts of interest.
References
1. Berger ME, Christensen DM, Lowry PC, et al. Medical management of radiation injuries: current approaches. Occup Med (Chic Ill). 2006;56:162–172. doi:10.1093/occmed/kql011
2. Raghav PK, Gangenahalli G. Hematopoietic stem cell molecular targets and factors essential for hematopoiesis. J Stem Cell Res Ther. 2018;8:1–16. doi:10.4172/2157-7633.1000441
3. Etzrodt M, Ahmed N, Hoppe PS, et al. Inflammatory signals directly instruct PU.1 in HSCs via TNF. Blood. 2019;133(8):816–819. doi:10.1182/blood-2018-02-832998.
4. Rothenberg EV, Hosokawa H, Ungerbäck J. Mechanisms of action of hematopoietic transcription factor PU.1 in initiation of T-cell development. Front Immunol. 2019;10. doi:10.3389/fimmu.2019.00228.
5. Kato H, Igarashi K. To be red or white: lineage commitment and maintenance of the hematopoietic system by the “inner myeloid”. Haematologica. 2019;104(10):1919–1927. doi:10.3324/haematol.2019.216861.
6. Olariu V, Peterson C. Kinetic models of hematopoietic differentiation. Wiley Interdiscip Rev Syst Biol Med. 2019;11(1):e1424. doi:10.1002/wsbm.1424.
7. Hewitt KJ, Johnson KD, Gao X, et al. The hematopoietic stem and progenitor cell cistrome: GATA factor-dependent cis-regulatory mechanisms. Curr Top Dev Biol. 2016. doi:10.1016/bs.ctdb.2016.01.002.
8. Meng Q, Xia Y. c-Jun, at the crossroad of the signaling network. Protein Cell. 2011;2(11):889–898. doi:10.1007/s13238-011-1113-3.
9. Xiao X, Lai W, Xie H, et al. Targeting JNK pathway promotes human hematopoietic stem cell expansion. Cell Discov. 2019;5(1). doi:10.1038/s41421-018-0072-8.
10. Zhang P, Zhang X, Iwama A, et al. PU.1 inhibits GATA-1 function and erythroid differentiation by blocking GATA-1 DNA binding. Blood. 2000;96:2641–2648. doi:10.1182/blood.V96.8.2641
11. Liew CW, Rand KD, Simpson RJY, et al. Molecular analysis of the interaction between the hematopoietic master transcription factors GATA-1 and PU. J Biol Chem. 2006;281:28296–28306. doi:10.1074/jbc.M602830200
12. Gangenahalli GU, Gupta P, Saluja D, et al. Stem cell fate specification: role of master regulatory switch transcription factor PU.1 in differential hematopoiesis. Stem Cells Dev. 2005;14:140–152. doi:10.1089/scd.2005.14.140
13. Laity JH, Lee BM, Wright PE. Zinc finger proteins: new insights into structural and functional diversity. Curr Opin Struct Biol. 2001;11:39–46. doi:10.1016/S0959-440X(00)00167-6
14. Rekhtman N, Radparvar F, Evans T, et al. Direct interaction of hematopoietic transcription factors PU.1 and GATA-1: functional antagonism in erythroid cells. Genes Dev. 1999;13:1398–1411. doi:10.1101/gad.13.11.1398
15. Zhang P, Behre G, Pan J, et al. Negative cross-talk between hematopoietic regulators: GATA proteins repress PU.1. Proc Natl Acad Sci U S A. 1999;96:8705–8710. doi:10.1073/pnas.96.15.8705
16. Chou ST, Khandros E, Bailey LC, et al. Graded repression of PU.1/Sfpi1 gene transcription by GATA factors regulates hematopoietic cell fate. Blood. 2009;114:983–994. doi:10.1182/blood-2009-03-207944
17. Nerlov C, Querfurth E, Kulessa H, et al. GATA-1 interacts with the myeloid PU. 1 transcription factor and represses PU. 1-dependent transcription. Blood. 2000;95:2543–2551. doi:10.1182/blood.V95.8.2543
18. Gupta P, Gurudutta GU, Saluja D, et al. PU.1 and partners: regulation of haematopoietic stem cell fate in normal and malignant haematopoiesis. J Cell Mol Med. 2009;13:4349–4363. doi:10.1111/j.1582-4934.2009.00757.x
19. Kornblihtt LI, Vassallu PS, Heller P, et al. Treatment of essential thrombocythemia with anagrelide. A ten-year experience. Medicina (B Aires). 2002;62:231–236.
20. Burley SK, Bhikadiya CB, Bi C, et al. RCSB protein data bank: powerful new tools for exploring 3D structures of biological macromolecules for basic and applied research and education in fundamental biology, biomedicine, biotechnology, bioengineering and energy sciences. Nucleic Acids Res. 2021;49(D1):D437–D451. doi:10.1093/nar/gkaa1038
21. Kodandapani R, Pio F, Ni CZ, et al. A new pattern for helix–turn–helix recognition revealed by the PU. l ETS–domain–DNA complex. Nature. 1996;380(6573):456–460. doi:10.1038/380456a0
22. Mueller GA, Choy WY, Yang D, et al. Global folds of proteins with low densities of NOEs using residual dipolar couplings: application to the 370-residue maltodextrin-binding protein. J Mol Biol. 2000;300(1):197–212. doi:10.1006/jmbi.2000.3842
23. Johansson MU, Zoete V, Michielin O, et al. Defining and searching for structural motifs using DeepView/Swiss-PdbViewer. BMC Bioinform. 2012;13(1):173. doi:10.1186/1471-2105-13-173.
24. Forli S, Huey R, Pique ME, et al. Computational protein-ligand docking and virtual drug screening with the AutoDock suite. Nat Protoc. 2016;11(5):905–919. doi:10.1038/nprot.2016.051.
25. Schrödinger L The PyMOL molecular graphics system, version 1.8; 2015. Available from: Https://Www.Pymol.Org/Citing.
26. Dehouck Y, Kwasigroch JM, Gilis D, et al. PoPMuSiC 2.1: a web server for the estimation of protein stability changes upon mutation and sequence optimality. BMC Bioinform. 2011;12(1). doi:10.1186/1471-2105-12-151.
27. Thévenet P, Shen Y, Maupetit J, et al. PEP-FOLD: an updated de novo structure prediction server for both linear and disulfide bonded cyclic peptides. Nucleic Acids Res. 2012;40(W1):W288–W293. doi:10.1093/nar/gks419.
28. Dallakyan S, Olson AJ. Small-molecule library screening by docking with PyRx. Methods Mol Biol. 2015. doi:10.1007/978-1-4939-2269-7_19.
29. Gasteiger E, Hoogland C, Gattiker A, et al. Protein identification and analysis tools on the ExPASy server. Proteomics Protoc Handb. 2009.
30. Heinig M, Frishman D. STRIDE: a web server for secondary structure assignment from known atomic coordinates of proteins. Nucleic Acids Res. 2004;32(Web Server):W500–W502. doi:10.1093/nar/gkh429.
31. Dinitto JM, Kenney JM. Noise characterization in circular dichroism spectroscopy. Appl Spectrosc. 2012;66:180–187. doi:10.1366/11-06417
32. Raghav PK, Singh AK, Gangenahalli G. Stem cell factor and NSC87877 combine to enhance c-Kit mediated proliferation of human megakaryoblastic cells. Plos one. 2018;13.e0206364.
33. Sharma D, Maheshwari D, Philip G, et al. Formulation and optimization of polymeric nanoparticles for intranasal delivery of lorazepam using Box-Behnken design: in vitro and in vivo evaluation. Biomed Res Int. 2014;2014:2014. doi:10.1155/2014/156010
34. Ma W, Chen M, Kaushal S, et al. PLGA nanoparticle-mediated delivery of tumor antigenic peptides elicits effective immune responses. Int J Nanomedicine. 2012;7:1475–1487. doi:10.2147/IJN.S29506
35. Derman S, Mustafaeva ZA, Abamor ES, et al. Preparation, characterization and immunological evaluation: canine parvovirus synthetic peptide loaded PLGA nanoparticles. J Biomed Sci. 2015;22:89. doi:10.1186/s12929-015-0195-2
36. Keum CG, Noh YW, Baek JS, et al. Practical preparation procedures for docetaxel-loaded nanoparticles using polylactic acid-co-glycolic acid. Int J Nanomedicine. 2011;6:2225–2234. doi:10.2147/IJN.S24547
37. Mantovani A, Vecchi A. Interaction of cancer chemotherapy agents with the mononuclear phagocyte system. Prog Drug Res. 1990;35:487–519. doi:10.1007/978-3-0348-7133-4_9
38. Normann SJ, Weiner R. Cytotoxicity of human peripheral blood monocytes. Cell Immunol. 1983;81:413–425. doi:10.1016/0008-8749(83)90248-4
39. Kondo M, Oshita F, Kato Y, et al. Early monocytopenia after chemotherapy as a risk factor for neutropenia. Am J Clin Oncol Cancer Clin Trials. 1999. doi:10.1097/00000421-199902000-00025.
40. Dijkgraaf EM, Heusinkveld M, Tummers B, et al. Chemotherapy alters monocyte differentiation to favor generation of cancer-supporting m2 macrophages in the tumor microenvironment. Cancer Res. 2013;73:2480–2492. doi:10.1158/0008-5472.CAN-12-3542
41. Ichinose Y, Hara N, Motohiro A, et al. Influence of chemotherapy on superoxide anion-generating activity of polymorphonuclear leukocytes in patients with lung cancer. Cancer. 1986;58(8):1663–1667. doi:10.1002/1097-0142(19861015)58:8<663::aid-cncr2820580815><663::aid-cncr2820580815>3.0.CO;2-I.
42. Blay JY, Chauvin F, Le Cesne A, et al. Early lymphopenia after cytotoxic chemotherapy as a risk factor for febrile neutropenia. J Clin Oncol. 1996;14(2):636–643. doi:10.1200/JCO.1996.14.2.636.
43. Kempf RA, Mitchell MS. Effects of chemotherapeutic agents on the immune response. II. Cancer Invest. 1985;3:23–33. doi:10.3109/07357908509040605
44. Hosker HSR, McArdle P, Corris PA. Alveolar macrophage function before and during treatment with cytotoxic chemotherapy in patients with small cell lung cancer. Eur J Cancer Clin Oncol. 1991;27:1711. doi:10.1016/0277-5379(91)90454-L
45. Oshita F, Tamura T, Okamoto H, et al. The frequency and management of infectious episodes and sepsis in small cell lung cancer patients receiving intensive chemotherapy with granulocytecolony stimulating factor. Jpn J Clin Oncol. 1991. doi:10.1093/oxfordjournals.jjco.a039485.
46. Powell CB, Mutch DG, Kao M-S, et al. Reduced natural cytotoxic cell activity in patients receiving cisplatin-based chemotherapy and in mice treated with cisplatin. Clin Exp Immunol. 2008;79(3):424–429. doi:10.1111/j.1365-2249.1990.tb08106.x.
47. Mariotta S, Aquilini M, Ricci A, et al. Changes in monocyte phagocyting activity after multi-agent chemotherapy in non-small cell lung cancer. Eur Rev Med Pharmacol Sci. 2002;6:67–73.
48. Carotta S, Wu L, Nutt SL. Surprising new roles for PU.1 in the adaptive immune response. Immunol Rev. 2010;238(1):63–75. doi:10.1111/j.1600-065X.2010.00955.x.
49. DePristo MA, Weinreich DM, Hartl DL. Missense meanderings in sequence space: a biophysical view of protein evolution. Nat Rev Genet. 2005;6:678–687. doi:10.1038/nrg1672
50. Cabrita LD, Gilis D, Robertson AL, et al. Enhancing the stability and solubility of TEV protease using in silico design. Protein Sci. 2007;16:2360–2367. doi:10.1110/ps.072822507
51. Shen H, Mai JC, Qiu L, et al. Evaluation of peptide-mediated transduction in human CD34+ cells. Hum Gene Ther. 2004;15:415–419. doi:10.1089/104303404322959560
52. Taussig DC, Pearce DJ, Simpson C, et al. Hematopoietic stem cells express multiple myeloid markers: implications for the origin and targeted therapy of acute myeloid leukemia. Blood. 2005;106:4086–4092. doi:10.1182/blood-2005-03-1072
53. Shortman K, Liu Y-J. Mouse and human dendritic cell subtypes. Nat Rev Immunol. 2002;2:151–161. doi:10.1038/nri746
54. Goldstein JI, Kominsky DJ, Jacobson N, et al. Defective leukocyte GM-CSF receptor (CD116) expression and function in inflammatory bowel disease. Gastroenterology. 2011;141:208–216. doi:10.1053/j.gastro.2011.03.060
55. De Luca K, Frances-Duvert V, Asensio M-J, et al. The TLR1/2 agonist PAM3CSK4 instructs commitment of human hematopoietic stem cells to a myeloid cell fate. Leukemia. 2009;23:2063–2074. doi:10.1038/leu.2009.155
56. DeKoter RP, Walsh JC, Singh H. PU.1 regulates both cytokine-dependent proliferation and differentiation of granulocyte/macrophage progenitors. EMBO J. 1998;17:4456–4468. doi:10.1093/emboj/17.15.4456
57. Behre G, Whitmarsh AJ, Coghlan MP, et al. c-Jun is a JNK-independent coactivator of the PU.1 transcription factor. J Biol Chem. 1999;274:4939–4946. doi:10.1074/jbc.274.8.4939
58. Wang D, D’Costa J, Civin CI, et al. C/EBPα directs monocytic commitment of primary myeloid progenitors. Blood. 2006;108:1223–1229. doi:10.1182/blood-2005-12-008763
59. Mohammadi-Samani S, Taghipour B. PLGA micro and nanoparticles in delivery of peptides and proteins; problems and approaches. Pharm Dev Technol. 2014;7450:385–393.
60. Danhier F, Ansorena E, Silva JM, et al. PLGA-based nanoparticles: an overview of biomedical applications. J Control Release. 2012;161:505–522. doi:10.1016/j.jconrel.2012.01.043
61. Choi SH, Park TG. G-CSF loaded biodegradable PLGA nanoparticles prepared by a single oil-in-water emulsion method. Int J Pharm. 2006;311:223–228. doi:10.1016/j.ijpharm.2005.12.023
62. Blanco M, Alonso M. Development and characterization of protein-loaded poly(lactide-co-glycolide) nanospheres. Eur J Pharm Biopharm. 1997;43:287–294. doi:10.1016/S0939-6411(97)00056-8
63. Song CX, Labhasetwar V, Murphy H, et al. Formulation and characterization of biodegradable nanoparticles for intravascular local drug delivery. J Control Release. 1997;43:197–212. doi:10.1016/S0168-3659(96)01484-8
 © 2021 The Author(s). This work is published and licensed by Dove Medical Press Limited. The full terms of this license are available at https://www.dovepress.com/terms.php and incorporate the Creative Commons Attribution - Non Commercial (unported, v3.0) License.
By accessing the work you hereby accept the Terms. Non-commercial uses of the work are permitted without any further permission from Dove Medical Press Limited, provided the work is properly attributed. For permission for commercial use of this work, please see paragraphs 4.2 and 5 of our Terms.
© 2021 The Author(s). This work is published and licensed by Dove Medical Press Limited. The full terms of this license are available at https://www.dovepress.com/terms.php and incorporate the Creative Commons Attribution - Non Commercial (unported, v3.0) License.
By accessing the work you hereby accept the Terms. Non-commercial uses of the work are permitted without any further permission from Dove Medical Press Limited, provided the work is properly attributed. For permission for commercial use of this work, please see paragraphs 4.2 and 5 of our Terms.