Back to Journals » International Journal of General Medicine » Volume 15
PSME4 Activates mTOR Signaling and Promotes the Malignant Progression of Hepatocellular Carcinoma
Authors Ge S, Huang H, Huang W, Ji R, Chen J, Wu S ![]() , Wang L
, Wang L ![]() , Huang T, Sheng Y, Yan H, Lu C, Ma L
, Huang T, Sheng Y, Yan H, Lu C, Ma L
Received 21 October 2021
Accepted for publication 10 January 2022
Published 26 January 2022 Volume 2022:15 Pages 885—895
DOI https://doi.org/10.2147/IJGM.S344360
Checked for plagiarism Yes
Review by Single anonymous peer review
Peer reviewer comments 4
Editor who approved publication: Dr Scott Fraser
Sijia Ge,1,* Hua Huang,2,* Wei Huang,1 Ran Ji,1 Jing Chen,1 Shuzhen Wu,1 Liyang Wang,1 Tianxin Huang,1 Yu Sheng,1 Haiou Yan,1 Cuihua Lu,1 Lin Ma3
1Department of Gastroenterology, Affiliated Hospital of Nantong University, Jiangsu, People’s Republic of China; 2Department of Pathology, Affiliated Hospital of Nantong University, Jiangsu, People’s Republic of China; 3Department of Gastroenterology, Affiliated Haian Hospital of Nantong University, Jiangsu, People’s Republic of China
*These authors contributed equally to this work
Correspondence: Lin Ma
Department of Gastroenterology, Affiliated Haian Hospital of Nantong University, Nantong, 226600, Jiangsu, People’s Republic of China
, Email [email protected]
Cuihua Lu
Department of Gastroenterology, Affiliated Hospital of Nantong University, Nantong, 226001, Jiangsu, People’s Republic of China
, Email [email protected]
Background: As hepatocellular carcinoma (HCC) having the second-highest mortality rate globally, the early diagnosis and prognosis of HCC have always been the focus of various studies. Although PSME4 has been reported to be closely related to several malignancies, its role in HCC remains unclear.
Materials and Methods: The TCGA-LIHC database and HCC tissues were used to explore the expression of PSME4 in HCC. Gene set enrichment analysis (GSEA) was used to forecast the biological behavior of HCC cells that PSME4 might be involved in regulation. In addition, CCK-8, colony formation and flow cytometry assays were used to explore the effect of PSME4 on HCC cells. Furthermore, the underlying PSME4-related signaling pathways in HCC were further confirmed using GSEA.
Results: We found that the expression of PSME4 in HCC tissues was significantly higher than that in adjacent normal tissues, and patients with high PSME4 expression have a poor prognosis. CCK-8, colony formation and flow cytometry assays shown that knockdown of PSME4 inhibits HCC cell proliferation of HCC cells, promotes cell apoptosis and moves the cell cycle away from the S phase. Mechanistically, PSME4 may promote the development of HCC through mTOR signaling pathway.
Conclusion: The high expression of PSME4 in HCC promotes the proliferation of HCC cells via the mTOR signalling pathway. Therefore, PSME4 is an emerging tumour marker for the early diagnosis and prognosis of HCC.
Keywords: hepatocellular carcinoma, mTOR signaling, liver cancer prognosis, PSME4
Introduction
Liver cancer has the fifth-highest incidence rate and second-highest mortality rate worldwide.1 The major risk factors for liver cancer include genetics, race, age, sex, viral hepatitis, alcohol, non-alcoholic fatty liver disease/non-alcoholic steatohepatitis, metabolic syndrome, etc.2–4 As the most common pathological type of liver cancer, hepatocellular carcinoma (HCC) accounts for approximately 90% of all liver cancer cases. Diagnosis of hepatocellular carcinoma is significant which includes two main approaches: imaging and biomarkers. Imaging is relatively simple includes a contrast-enhanced ultrasound (CEUS), dynamic contrast-enhanced computed tomography (CT), dynamic contrast-enhanced magnetic resonance imaging (MRI).5 Biomarkers are varied compared to imaging and thus have the potential for further exploration. Current biomarkers of liver cancer are tissue biomarkers, serum biomarkers, protein markers, autoantibody markers, growth factors, and genetic biomarkers.6 Alpha-fetoprotein (AFP) is a typical biomarker for HCC, however, it has low sensitivity (41–65%) and specificity (80–94%).7 Therefore, identifying an ideal HCC biomarker with high sensitivity and specificity, which could increase the potential for the early diagnosis, prognosis, and targeted treatment of HCC, remains the highlight of various studies.
Proteasomal activity subunit 4 (PSME4) is a proteasomal activator, that regulates protein degradation by regulating proteasomal function. PA200, encoded by PSME4, is a mammalian protein highly expressed in the testis and sperm.8 Moreover, proteasome activators not only regulate the function of the proteasome, but also have the potential to become predictors of various malignant tumors. PSME1 and PSME2 have been reported to be potential biomarkers and prognostic indicators of gastric cancer. Whereas PSME3 and PSME4 are precited to be promising therapeutic targets for gastric cancer as oncogenes in tumorigenesis.9 Additionally, PSME4 has been reported to be a candidate protein marker for oral tumors.10 PSME4 is a key nodal protein involved in liver regeneration, which promotes of liver cell regeneration.11 Based on the correlation between tumors and PSME4 along with the unclear role of PSME4 in HCC, this study hypothesizes that PSME4 plays an important role in the occurrence and development of HCC.
In this study, the differential expression of PSME4 in HCC tissues and adjacent normal tissues was analyzed, and the relationship between PSME4 and the prognosis of patients with HCC was explored. Additionally, the effect of PSME4 on HCC cells was further explored by analyzing the biological behavior and gene expression characteristics. Finally, the underlying molecular mechanism of PSME4 in the progression of HCC was investigated.
Materials and Methods
Patients and Tissue Samples
The diagnostic criteria for liver cancer include the following aspects: (1) Liver space-occupying lesions or extrahepatic metastases biopsy or surgical resection of tissue specimens are diagnosed as liver cancer via histopathological or cytological examination; (2) Various imaging examinations have an auxiliary or even direct diagnosis function including dynamic enhanced CT, multi-modal MRI scan, digital angiography and PET-CT, which are more instructive for diagnosis; (3) Serum AFP is commonly used for the diagnosis of liver cancer and monitoring of its curative effect. Liver cancer is suspected when AFP ≥ 400ug/L lasts more than 4 weeks, excluding pregnancy, chronic or active liver disease, gonadal embryogenic tumors and gastrointestinal tumors; (4) Patients with hepatitis infection, excessive drinking, non-alcoholic steatohepatitis, the long-term consumption of Aspergillus flavus contaminated food or a family history of related liver disease, are considered to be high-risk factors for liver cancer, which aid in effective diagnosis combined with other diagnostic methods.12,13 A total of 20 pairs of liver cancer and its adjacent normal tissues were collected from the Affiliated Hospital of Nantong University, which included excised tissue specimens after surgery from 2019 to 2020 that had undergone an accurate histopathological diagnosis. This study was approved by the Human Research Ethics Committee of the Affiliated Hospital of Nantong University, and each patient provided written informed consent.
Cell and Transfection
Liver cancer cell lines (SMMC-7721, Huh7, HepG2 and Hep1) and normal liver cells (LO2) were selected for this study. Complete Dulbecco’s modified Eagle’s medium (DMEM), which was co-cultured with 10% fetal bovine serum (FBS), 1% penicillin-streptomycin, and 0.02% tetracycline in an incubator with 5% CO2 at 37°C, was used as the culture medium. HepG2 was selected and cultured in 6-well plates before transfection. When the cells were approximately 70–80% distributed, the primary medium was converted to a serum-free medium and transfected with small interfering RNA (siRNA) targeting PSME4 (PSME4-siRNA) and its negative control siRNA(siCtrl). PSME4-siRNA and control-siRNA were projected and synthesised by Gene Pharma (Shanghai, China). Sequences of the siRNAs used are as follows: PSME4-homo-481 siRNA (sense, 5′-GGAGACCACUUUAUGACAUTT −3′ and antisense, 5′-AUGUCAUAAAGUGGUCUCCTT −3′) and negative control siRNA (sense, 5′-UUCUCCGAACGUGUCACGUTT-3′ and antisense, 5′-ACGUGACACGUUCGGAGAATT-3′). HepG2 cells were transfected with liposome 2000 transfection reagent (Invitrogen, Shanghai, China). At 6 h post-transfection, the serum-free medium was replaced with complete DMEM. After 48 hours, the cells were collected and the transfection efficiency was detected using real-time quantitative polymerase chain reaction (RT-qPCR) and Western blotting.
Western Blot
To analyse the expression of each molecule at the protein level, RIPA (Beyotime, Jiangsu, China) buffer was used to fully lyse the cells. Following this, the sample was centrifuged for 10 minutes at 10,000 rpm at 4°C to collect the supernatant. The supernatant was boiled at 100°C for 15 minutes with a 5× sodium dodecyl sulphate loading buffer to obtain protein samples. Proteins were separated on sodium dodecyl sulfate polyacrylamide gel electrophoresis (SDS-PAGE) and electro-transferred to polyvinyl difluoride membranes (Millipore, Burlington, MA, USA). Tris-buffered saline with Tween-20 (TBST) containing 5% skim milk was used to block the membranes at room temperature for 2 h and incubated with diluted primary antibodies against PSME4 (Cat No.18799-1-AP,1:1000, Proteintech), p-mTOR (sc-293132,1:1000, SANTA), mTOR (WL02477,1:1000, Wanleibio), MAPK (T202/Y204,1:1000, Cell Signaling Technology), p-MAPK (8544,1:1000, Cell Signaling Technology), Erk (4370,1:1000, Cell Signaling Technology), p-Erk (18,251,1:1000, RD systems), Akt (abs131788,1:1000, Absin), p-Akt (sc-271966,1:500, Santa), Mek (GB11304-1,1:500, Servicebio), p-Mek (9127,1:1000, Cell Signaling Technology) at 4°C for 24 h. After washing with TBST thrice and incubating with species-specific antibodies for 2 hours, target bands were visualized using a bioimaging system (Bio-Rad, Hercules, CA, USA) that use an enhanced chemiluminescent kit (NCM Biotech, Suzhou, China). Glyceraldehyde 3-phosphate dehydrogenase(GAPDH) was employed as the internal reference, and finally protein bands were quantified by Image J software.
Real-Time PCR
Total RNA were isolated from HCC tissues, adjacent normal tissues and various cells by TRIzol reagent (Ambion, Austin, TX, USA) and reverse transcribed into complementary DNA(cDNA) by the first-strand cDNA synthesis kit (Vazyme, Nanjing, China). The differential expressions of various molecules in the tissues were determined by using a SYBR Green PCR Kit (Qiagen, Hilden, Germany) on a Roche Light Cycler 480 system (Roche Holding AG, Basel, Switzerland). Primer sequences were purchased from Sangon Biotech (Shanghai, China). The primer sequences provided in this analysis were as follows: PSME4, forward 5′-TGTGGAGCAAAGAAACCTG-3′ and reverse 5′-AAACCGTATGGCACGAAG-3′; MAPK, forward 5′-CAAGAAAATCAGCCCCTTTG-3′ and reverse 5′-TCTCATGTCTGAAGCGCAGT-3′; Akt, forward 5′-CAGGAGGAGGAGAGATGGACTTC-3′ and reverse 5′-CACACGGTGCTTGGGCTTGG-3′; PCNA, forward 5′-GGAGAGCTTGGCAATGGGAA-3′ and reverse 5′-TAGGAGACAGTGGAGTGGC-3′;c-Myc, forward 5′-TAACTGACTAGCAGGCTTGTCG-3′ and reverse 5′-TCCACATACAGTCCTGGATGATGATG-3′;18s, forward 5′-CGCCGCTAGAGGTGAAATTC-3′ and reverse 5′-CCAGTCGGCATCGTTTATGG-3′.
Proliferation and Apoptosis Experiment
The proliferation ability of the cells were evaluated via the CCK8 cell proliferation experiment, which used a WST-1 proliferation reagent for detection at 0, 24, 48, 72 hours with Cell-Counting kit 8(BBI Life Sciences). Each group of cells was screened by counting 2000 cells, cultured for 14 days under half starvation (5% FBS), and finally photographed. For the determination of apoptosis ability, we collected the cells of the two groups, added 1mL precooled 70% ethanol, blew them evenly at 4°C overnight, centrifuged them (1200rpm 4min 14°C), then supernatant was removed, re-suspended with 1mL phosphate-buffered saline (PBS), and removed the supernatant. AnnexinV Alexa Fluor647/PI (Fcmacs) apoptosis reagent was added to detect the apoptosis ability of the cells by flow cytometry. Additionally, the two groups of cells were collected for the determination of the cell cycle. The supernatant was centrifuged, and PBS was used for re-suspension. The DNA content detection reagent (Solarbio) was added to determine the status of each phase of the cell cycle was detected by flow cytometry.
TCGA LIHC Database Analysis
The XENA (http://xenabrowser.net/heatmap/) website was used to download the expression level of PSME4 mRNA, and the TCGA LIHC (The Cancer Genome Atlas- liver hepatocellular carcinoma) database was used to download the corresponding clinical data, including tumor stage and grade.
Gene Set Enrichment Analysis (GSEA)
GESA14 was used to divide the obtained data into PSME4 high and low expression groups, wherein the differences in gene enrichment between the two groups was determined.
Statistical Analysis
The results are reported as the mean±standard error. All values were obtained from at least three independent assays. Statistical analyses were performed by GraphPad Prism 8.0.2 software for Windows. The paired rank-sum test was used to analyze the data on paired HCC and its adjacent tissues. A two-tailed Student’s t-test was conducted to compare the differences between two groups. P>0.05 was considered statistically significant.
Results
PSME4 Was Highly Expressed in HCC Tissues
To explore the role of PSME4 in the development of HCC, the HCCDB and ONCOMINE databases were used to analyze the expression of PSME4. As shown in Figure 1, the expression of PSME4 in HCC tissues was significantly higher than that in adjacent normal tissues (ANT) (Figure 1A), with the three groups of data sets showing obvious differences (Figure 1B). Additionally, through analyzing two independent samples (Figure 1C) and two paired samples (Figure 1D), PSME4 was found to be highly expressed in HCC tissues. This was further verified using the tissues samples obtained from the Affiliated Hospital of Nantong University (Figure 1E). Therefore, compared to adjacent normal tissues, PSME4 was highly expressed in HCC tissues. However, the expression of PSME4 in HCC and its adjacent tissues had no significant relationship with race, gender, weight, age and histological subtype (Supplement Figure S1).
 |
Figure 1 PSME4 was highly expressed in HCC tissues. (A and B) The expression of PSME4 in the HCCDB and ONCOMINE database is different between HCC and ANT tissues and three typical groups of data sets with obvious differences were picked out. (C) PSME4 expresses higher in the HCC tissues than adjacent normal tissues in two independent samples. p=2.2e-12 (D) PSME4 expresses higher in the HCC tissues than adjacent normal tissues in two paired samples. p=1.4e-06 (E) Normal liver tissues (n = 20) and HCC tissues (n = 20) were evaluated by qRT-PCR. P=0.000. |
High Expression of PMSE4 Predicts Poor Prognosis in Patients with HCC
The high expression of PSME4 in HCC led to the speculation that PSME4 might be related to the prognosis of HCC. Analyses of the clinical data obtained from the TCGA-LIHC database revealed that the overall survival rate of patients with HCC having high expression of PSME4 was significantly lower than that of patients with low expression of PSME4 (Figure 2A). Moreover, the expression of PSME4 in HCC tissues with nodal metastasis (N1) was significantly higher than that in HCC tissues without nodal metastasis (N0) or in the normal group (Figure 2B). In addition, with increased tumor grade or individual cancer stage, the expression of PSME4 was increased (Figure 2C and D). Therefore, PSME4 is negatively related to the prognosis of HCC.
 |
Figure 2 High expression of PMSE4 predicts poor prognosis in patients with HCC. (A) The overall survival rate between HCC patients with or without high expression of PSME4 was found by analyzing the TCGA-LIHC database. (B–D) The expression of PSME4 about nodal metastasis, tumor grade or individual cancer stage was about by analyzing the TCGA-LIHC database. ns p≥0.5, *p< 0.05, ***p<0.001. |
GSEA Between PSME4 High and Low Expression Groups
The HCC tissues data obtained from the TCGA-LIHC database was divided into PSME4 high and low expression groups, and GSEA was used to determine the tumor-related functional pathways that may involve PSME4. As shown in Figure 3A–D, the effects of PSME4 on the biological behavior of HCC cells focused on apoptosis, cell cycle regulation, glycolysis and other pathways. TP53, a well-known tumor suppressor gene. The mutation of TP53 which is a well-known tumor suppressor, promotes cell proliferation but has no inductive effect on cancer cell apoptosis. Interestingly, the expression of PSME4 in patients with HCC having TP53 mutation was significantly higher than that in those without TP53 mutation or the normal group (Figure 3E). These results suggested that PSME4 plays a significant role in the tumorigenesis of HCC by affecting phenotypic functional pathways, which include cell proliferation, apoptosis and cell cycle.
 |
Figure 3 GSEA between PSME4 high and low expression groups. (A–D) GSEA was utilized to analyze the effects of PSME4 on the biological behavior of HCC cells. (E) The expression of PSME4 about TP53 mutation and nonmutation was about by analyzing the TCGA-LIHC database. ***p<0.001. |
Changes in the Functional Phenotype of HCC Cells After PSME4 Knockdown
To further elucidate the effect of PSME4 on cell proliferation, apoptosis and cell cycle, the expression of PSME4 in various HCC cell lines and normal liver cell (LO2) lines was determined by Western blotting, wherein the expression of PSME4 was the highest in HepG2 cell (Figure 4A). Therefore, subsequent experiments were conducted using HepG2 cells. Analysis of HepG2 cells transfected with PSME4-siRNA or control-siRNA (Figure 4B) using CCK8 and colony formation assays revealed that the proliferation ability of HepG2 cells was significantly reduced after PSME4 knockdown (Figure 4C and D). Additionally, flow cytometry revealed that the proportion of cells with early and late withering was significantly increased in HepG2 cells transfected with PSME4-siRNA (Figure 4E). Furthermore, the number of cells arrested in the S phase was increased after PSME4 knockdown (Figure 4F). Apoptosis (Supplement Figure S2) and cell cycle (Supplement Figure S3) experiments were repeated in triplicate between the control group and PSME4-siRNA group. Therefore, PSME4 plays a significant role in the tumorigenesis of HCC, which mainly through affecting phenotypic functional pathways including cell proliferation, apoptosis and cell cycle.
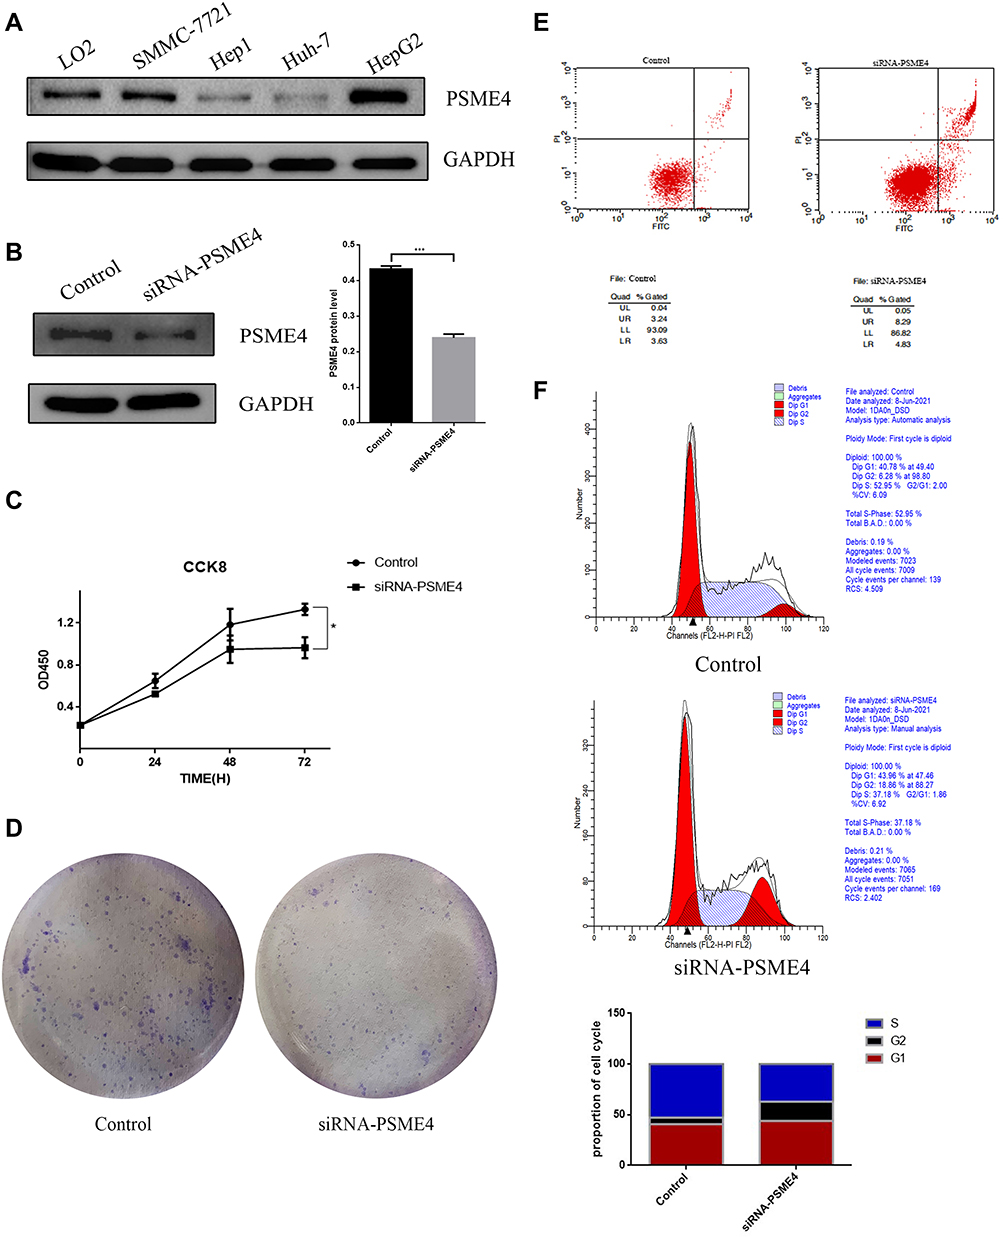 |
Figure 4 Changes in the functional phenotype of HCC cells after PSME4 knockdown. (A) The expression of PSME4 was measured in various HCC cell lines and in normal liver cell by Western blot. (B) HepG2 cells were transfected with PSME4 siRNA and non-targeting control siRNA and the expression of PSME4 was measured by Western blot. (C) CCK8 assays, (D) Colony formation assays, (E) Apoptosis and (F) Cell cycle experiments were performed after transfection. Results were represented as mean±SD of three independent experiments. *p< 0.05, ***p<0.001. |
PSME4 Plays a Role in HCC via the mTOR Signaling Pathway
The underlying molecular mechanisms driving PSME4-induced cell proliferation in HCC remains uncertain. GSEA (Figure 3A) revealed that the mTOR signaling pathway was found to be involved in the progression of HCC regulated by PSME4. Therefore, the expression of genes related to the mTOR signaling pathway was analyzed. p-mTOR was significantly decreased in HepG2 cells transfected with siRNA-PSME4 than that in the control group. Additionally, the expression of mTOR, p-Akt, Akt, p-MAPK, MAPK, p-Erk, Erk, p-Mek and Mek were also reduced (Figure 5A). Further verification of the expression of upstream and downstream molecules of the mTOR signaling pathway at the RNA level showed decreased levels after PSME4 knockout, including AMPK, Akt, c-myc and PCNA (Figure 5B). Therefore, mTOR plays an important role in promoting HCC of PSME4.
 |
Figure 5 PSME4 plays a role in HCC through mTOR signalling way. (A) Western blotting analyses the expression of mTOR/p-mTOR, AKT/p-AKT, ERK/p-ERK, MAPK/p-MAPK and MEK/p-MEK in HepG2 cells transfected with siRNA-PSME4 and in control HepG2 cells. (B) The expression of AKT, MAPK and other proliferation related genes (PCNA and c-myc) were measured in transfected HepG2 cells by qRT-PCR. Results were represented as mean±SD of three independent experiments. *p< 0.05. |
Discussion
As a member of the proteasome activator family, PSME4, encoding PA200 protein is speculated to play an important role in protein degradation.15 However, the specific role of PSME4 and its influence on HCC remains unclear and unexplored. Other proteasome activator subtypes similar to PSME4, such as PSMA7 and PSMB5, have been shown to inhibit cell apoptosis and promote tumor proliferation.16,17 Therefore, a preliminary exploration of the collected data revealed that the expression of PSME4 in HCC was significantly higher than that in adjacent tissues. Further analysis of the TCGA LIHC data showed that the high expression of PSME4 had a significantly negative effect on the prognosis of HCC, which is reflected in tumor grade, nodal metastasis, overall survival rate, and TP53 expression. TP53 mutation is one of the most common somatic events in cancer and has an adverse effect on cancer prognosis.18 Therefore, the positive correlation between PSME4 and TP53 expression reflects the negative effect of PSME4 on liver cancer prognosis.
Moreover, PSME4 affects HCC through functional pathways, including apoptosis, cell cycle, glycolysis, mitosis, androgen and MYC oncogene. Among them, apoptosis, cell cycle and glycolysis have a more prominent correlation with tumorigenesis. Apoptosis, known as programmed cell death, is one of the major forms of cell death.19 Studies have used this positive effect to unravel the therapeutic efficacy of diseases.20 For example, small molecule apoptosis inducers have been clinically proven to treat or even cure some diseases by eliminating diseased cells.21 Similarly, the present study shows that PSME4 may play an inhibitory role in HCC by regulating apoptosis, which was confirmed by flow cytometry analysis. Compared with the cells in the control group, the early and late-modulated cells in the PSME4 knockdown group were significantly increased. Meanwhile, a significant difference in the cell cycle status between the control and PSME4 knockdown groups was observed, wherein the proportion of cells in the S phase decreased significantly in the PSME4 knockdown group, whereas that in the G1 and G2 phases increased to varying degrees. The cell cycle is divided into the intercellular phase and mitotic phase (M phase), with the intercellular phase mainly including the prophase of DNA synthesis (G1 phase), DNA synthesis phase (S phase) and anaphase of DNA synthesis (G2 phase).22 G1 and G2 phases bridge the gaps between DNA synthesis and mitosis in the cell cycle. The transition from G1 to S phase represents cellular DNA synthesis, which indicates the ability of cells to proliferate, whereas the transition G2 to M phase is another significant marker of cell mitosis.22 These two stages involve complex and active molecular changes, which are easily affected by environmental conditions. Therefore, cancer cells and tumor suppressor factors have the potential to modify the cell cycle. The proportion of G1 and S phase cells in the knockout group was significantly reduced, which indicated the reduced proliferation ability of cells after PSME4 knockdown. This was consistent with the results of the CCK8 cell proliferation experiment and colony formation assay. As a transcription factor, TP53 not only reflects tumor prognosis, but also regulates apoptosis, cell cycle and DNA repair to affect cell proliferation. Moreover, the mutation of TP53 promotes cell proliferation and tumor development.23 This effect has been demonstrated in a variety of tumors, including cervical,24 colorectal25 and lung cancers.26 PSME4 expression was significantly increased after TP53 mutation, indicating that PSME4 promotes HCC proliferation and growth.
Although the oncogenic role of PSME4 in the occurrence and development of liver cancer has been indicated, the specific mechanisms remain unclear. GSEA revealed that PSME4 could regulate tumor development via the mTOR complex 1(mTORC1). mTOR, a serine/threonine-protein kinase in the PI3K-associated kinase family, consists of two catalytic subunits, mTORC1 and mTOR complex 2 (mTORC2).27 As a well-known eukaryotic signaling pathway, mTOR can regulate cell growth and metabolism through environmental coordination. It promotes protein and lipid synthesis, regulates glucose metabolism and inhibits protein catabolism.27 mTORC1 is a downstream effector of various frequently mutated oncogenic pathways, including the PI3K/Akt and Ras/Raf/MEK/ERK (MAPK) pathways.28 It has also been reported to lead to the overactivation of mTOR in various cancers, including breast cancer,29 neuroglioma30 and hepatic carcinoma.27 Therefore, targeting mTOR could provide novel avenues in cancer therapy. Furthermore, the expression of PCNA and c-myc, which are representative genes of proliferation31,32 is consistent with the decreased expression of PSME4 and mTOR. In addition, the expression of mTOR/p-mTOR, AKT/p-AKT, ERK/p-ERK, MAPK/p-MAPK and MEK/p-MEK were decreased after PSME4 knockdown, which substantiates that PSME4 can regulate the occurrence and development of liver cancer via the mTOR signaling pathway. However, further study is required to elucidate the specific mechanisms.
Conclusion
PSME4 promotes the occurrence and development of liver cancer through the mTOR signalling pathway, while having adverse effects on its prognosis. Therefore, PSME4 has the potential to become a new tumor marker for the early diagnosis and prognosis of liver cancer.
Research Ethics and Consent
All participants were informed of the objective of the study, and written consent was obtained. The study was approved by the Ethics Committee of Affiliated Hospital of Nantong University. All clinical samples were conducted in accordance with the Declaration of Helsinki and all cell lines were commercially purchased and were authenticated by STR profile.
Acknowledgments
We would like to acknowledge the contributions of colleagues, institutions, or agencies that aided the efforts of the authors. Sijia Ge and Hua Huang are co-first authors for this study.
Author Contributions
All authors made a significant contribution to the work reported, whether that is in the conception, study design, execution, acquisition of data, analysis and interpretation, or in all these areas; took part in drafting, revising or critically reviewing the article; gave final approval of the version to be published; have agreed on the journal to which the article has been submitted; and agree to be accountable for all aspects of the work.
Funding
This study was supported by grants from the Project supported by the National Natural Science Foundation of China (Grant No. 82070624); Social Development Foundation of Nantong City (Grant No. JC2019032; MS12019020); the Key Research and Development Plan of Jiangsu Province (No. BE2019692); Postdoctoral Science Foundation of China (Grant No. 2019M661909); Young Medical Talent Project of Jiangsu Province (QNRC2016697); Development Foundation of Nantong City (Grant No. MS12020013).
Disclosure
The authors declare that they no financial conflicts of interest.
References
1. Barsouk A, Thandra KC, Saginala K, Rawla P, Barsouk A. Chemical risk factors of primary liver cancer: an update. Hepat Med. 2020;12:179–188. doi:10.2147/HMER.S278070
2. Wallace MC, Preen D, Jeffrey GP, Adams LA. The evolving epidemiology of hepatocellular carcinoma: a global perspective. Expert Rev Gastroenterol Hepatol. 2015;9(6):765–779. doi:10.1586/17474124.2015.1028363
3. Clark T, Maximin S, Meier J, Pokharel S, Bhargava P. Hepatocellular carcinoma: review of epidemiology, screening, imaging diagnosis, response assessment, and treatment. Curr Probl Diagn Radiol. 2015;44(6):479–86.I. doi:10.1067/j.cpradiol.2015.04.004
4. Budny A, Kozłowski P, Kamińska M, et al. [Epidemiology and risk factors of hepatocellular carcinoma]. Pol Merkur Lekarski. 2017;43(255):133–139. Polish
5. Ren XP, Li RK. [Standardized screening and early imaging diagnosis strategies for hepatocellular carcinoma]. Zhonghua Gan Zang Bing Za Zhi. 2021;29(4):304–307. Chinese. doi:10.3760/cma.j.cn501113-20210406-00164
6. Mir IH, Jyothi KC, Thirunavukkarasu C. The prominence of potential biomarkers in the diagnosis and management of hepatocellular carcinoma: current scenario and future anticipation. J Cell Biochem. 2021. doi:10.1002/jcb.30190
7. Wong RJ, Ahmed A, Gish RG. Elevated alpha-fetoprotein: differential diagnosis - hepatocellular carcinoma and other disorders. Clin Liver Dis. 2015;19(2):309–323. doi:10.1016/j.cld.2015.01.005
8. Huang L, Haratake K, Miyahara H, Chiba T. Proteasome activators, PA28γ and PA200, play indispensable roles in male fertility. Sci Rep. 2016;6:23171. doi:10.1038/srep23171
9. Guo Y, Dong X, Jin J, He Y. The expression patterns and prognostic value of the proteasome activator subunit gene family in gastric cancer based on integrated analysis. Front Cell Dev Biol. 2021;9:663001. doi:10.3389/fcell.2021.663001
10. Pisamai S, Roytrakul S, Phaonakrop N, Jaresitthikunchai J, Suriyaphol G, Eckert RL. Proteomic analysis of canine oral tumor tissues using MALDI-TOF mass spectrometry and in-gel digestion coupled with mass spectrometry (GeLC MS/MS) approaches. PLoS One. 2018;13(7):e0200619. doi:10.1371/journal.pone.0200619
11. Yang H, Guo J, Jin W, Chang C, Guo X, Xu C. A combined proteomic and metabolomic analyses of the priming phase during rat liver regeneration. Arch Biochem Biophys. 2020;693:108567. doi:10.1016/j.abb.2020.108567
12. Ayuso C, Rimola J, Vilana R, et al. Diagnosis and staging of hepatocellular carcinoma (HCC): current guidelines. Eur J Radiol. 2018;101:72–81. doi:10.1016/j.ejrad.2018.01.025
13. Cong WM, Bu H, Chen J, et al. Practice guidelines for the pathological diagnosis of primary liver cancer: 2015 update. World J Gastroenterol. 2016;22(42):9279–9287. doi:10.3748/wjg.v22.i42.9279
14. Subramanian A, Tamayo P, Mootha VK, et al. Gene set enrichment analysis: a knowledge-based approach for interpreting genome-wide expression profiles. Proc Natl Acad Sci U S A. 2005;102(43):15545–15550. doi:10.1073/pnas.0506580102
15. Santosh Martin S, Rabelo Melo R, Pejler P. The absence of tryptase Mcpt6 causes elevated cellular stress in response to modulation of the histone acetylation status in mast cells. Cells. 2019;8(10):1190. doi:10.3390/cells8101190
16. Ren CC, Yang L, Liu L, et al. Effects of shRNA-mediated silencing of PSMA7 on cell proliferation and vascular endothelial growth factor expression via the ubiquitin-proteasome pathway in cervical cancer. J Cell Physiol. 2019;234(5):5851–5862. doi:10.1002/jcp.26408
17. Yang YM, Lee S, Nam CW, et al. G(alpha)12/13 inhibition enhances the anticancer effect of bortezomib through PSMB5 downregulation. Carcinogenesis. 2010;31(7):1230–1237. doi:10.1093/carcin/bgq097
18. Petitjean A, Achatz MI, Borresen-Dale AL, Hainaut P, Olivier M. TP53 mutations in human cancers: functional selection and impact on cancer prognosis and outcomes. Oncogene. 2007;26(15):2157–2165. doi:10.1038/sj.onc.1210302
19. Cotter TG, al-Rubeai M. Cell death (apoptosis) in cell culture systems. Trends Biotechnol. 1995;13(4):150–155. doi:10.1016/S0167-7799(00)88926-X
20. Kaczanowski S. Apoptosis: its origin, history, maintenance and the medical implications for cancer and aging. Phys Biol. 2016;13(3):031001. doi:10.1088/1478-3975/13/3/031001
21. Xu X, Lai Y, Hua ZC. Apoptosis and apoptotic body: disease message and therapeutic target potentials. Biosci Rep. 2019;39(1). doi:10.1042/BSR20180992
22. Schafer KA. The cell cycle: a Riuo T, Jiang Y. Targeting mTOR for cancer therapy. J Hematol Oncol. 2019;12(1):71. doi:10.1186/s13045-019-0754-1
23. Levine AJ, Hu W, Feng Z. The P53 pathway: what questions remain to be explored. Cell Death Differ. 2006;13(6):1027–1036. doi:10.1038/sj.cdd.4401910
24. Ma HM, Cui N, Zheng PS. HOXA5 inhibits the proliferation and neoplasia of cervical cancer cells via downregulating the activity of the Wnt/β-catenin pathway and transactivating TP53. Cell Death Dis. 2020;11(6):420. doi:10.1038/s41419-020-2629-3
25. Tang HQ, Meng YL, Lu QL, Dou YY, Liang LL, Luo Y. Decreased long noncoding RNA ADIPOQ promoted cell proliferation and metastasis via miR-219c-3p/TP53 pathway in colorectal carcinoma. Eur Rev Med Pharmacol Sci. 2020;24(14):7645–7654. doi:10.26355/eurrev_202007_22265
26. Cai P, Li J, Chen G, et al. MicroRNA-107 may regulate lung cancer cell proliferation and apoptosis by targeting TP53 regulated inhibitor of apoptosis 1. Oncol Lett. 2020;19(3):1958–1966. doi:10.3892/ol.2020.11248
27. Dimri M, Satyanarayana A. Molecular signaling pathways and therapeutic targets in hepatocellular carcinoma. Cancers. 2020;12(2):491. doi:10.3390/cancers12020491
28. Saxton RA, Sabatini DM. mTOR signaling in growth, metabolism, and disease. Cell. 2017;168(6):960–976. doi:10.1016/j.cell.2017.02.004
29. El Shamieh S, Saleh F, Moussa S, Kattan J, Farhat F. RICTOR gene amplification is correlated with metastasis and therapeutic resistance in triple-negative breast cancer. Pharmacogenomics. 2018;19(9):757–760. doi:10.2217/pgs-2018-0019
30. Masri J, Bernath A, Martin J, et al. mTORC2 activity is elevated in gliomas and promotes growth and cell motility via overexpression of rictor. Cancer Res. 2007;67(24):11712–11720. doi:10.1158/0008-5472.CAN-07-2223
31. Wang SC. PCNA: a silent housekeeper or a potential therapeutic target. Trends Pharmacol Sci. 2014;35(4):178–186. doi:10.1016/j.tips.2014.02.004
32. Wade M, Wahl GM. c-Myc, genome instability, and tumorigenesis: the devil is in the details. Curr Top Microbiol Immunol. 2006;302:169–203. doi:10.1007/3-540-32952-8_7
 © 2022 The Author(s). This work is published and licensed by Dove Medical Press Limited. The
full terms of this license are available at https://www.dovepress.com/terms
and incorporate the Creative Commons Attribution
- Non Commercial (unported, 3.0) License.
By accessing the work you hereby accept the Terms. Non-commercial uses of the work are permitted
without any further permission from Dove Medical Press Limited, provided the work is properly
attributed. For permission for commercial use of this work, please see paragraphs 4.2 and 5 of our Terms.
© 2022 The Author(s). This work is published and licensed by Dove Medical Press Limited. The
full terms of this license are available at https://www.dovepress.com/terms
and incorporate the Creative Commons Attribution
- Non Commercial (unported, 3.0) License.
By accessing the work you hereby accept the Terms. Non-commercial uses of the work are permitted
without any further permission from Dove Medical Press Limited, provided the work is properly
attributed. For permission for commercial use of this work, please see paragraphs 4.2 and 5 of our Terms.